Abstract
Background
Angelman syndrome (AS), a severe neurodevelopmental disorder resulting from the loss of the maternal UBE3A gene, is marked by changes in the brain’s white matter (WM). The extent of WM abnormalities seems to correlate with the severity of clinical symptoms, but these deficits are still poorly characterized or understood. This study provides the first large-scale measurement of WM volume reduction in children with AS. Furthermore, we probed the possibility of underlying WM neuropathology by examining the progression of myelination in an AS mouse model.
Methods
We conducted magnetic resonance imaging (MRI) on children with AS (n = 32) and neurotypical controls (n = 99) aged 0.5–12 years. In parallel, we examined myelination in postnatal Ube3a maternal-null mice (Ube3am−/p+; AS model), Ube3a paternal-null mice (Ube3am+/p−), and wildtype controls (Ube3am+/p+) using MRI, immunohistochemistry, western blotting, and electron microscopy.
Results
Our data revealed that AS individuals exhibit significant reductions in brain volume by ~ 1 year of age, and by 6–12 years of age WM is reduced by 26% and gray matter by 21%—approximately twice the reductions observed in the adult AS mouse model. Our AS mouse model saw a global delay in the onset of myelination, which normalized within days (likely corresponding to months or years in human development). This myelination delay is caused by the loss of UBE3A in neurons rather than UBE3A haploinsufficiency in oligodendrocytes. Interestingly, ultrastructural analyses did not reveal abnormalities in myelinated or unmyelinated axons.
Limitations
It is difficult to extrapolate the timing and duration of the myelination delay observed in AS model mice to individuals with AS.
Conclusions
This study reveals WM deficits as a hallmark in children with AS, demonstrating for the first time that these deficits are already apparent at 1 year of age. Parallel studies in a mouse model of AS show these deficits occur alongside the delayed onset of myelination, which results from the loss of neuronal (but not glial) UBE3A, though the causal relationship between these phenotypes remains to be determined. These findings emphasize the potential of WM as both a therapeutic target for interventions and a valuable biomarker for tracking the progression of AS and the effectiveness of potential treatments.
Supplementary Information
The online version contains supplementary material available at 10.1186/s13229-024-00636-y.
Keywords: Myelination, Myelin basic protein, White matter, Microcephaly, UBE3A, Magnetic resonance imaging
Background
Angelman syndrome (AS, OMIM #105830) is a severe neurodevelopmental disorder that manifests within the first year of life. Individuals with AS exhibit severe intellectual disability, developmental delay, speech impairment, motor dysfunction, behavioral abnormalities, microcephaly, sleep disturbances, seizures, and abnormal EEG patterns [1–6]. The first signs of developmental delay typically appear between 6 and 12 months of age, with additional symptoms gradually emerging throughout early childhood.
AS is caused by maternally inherited loss of function of UBE3A (OMIM# 601623), a gene located in the chromosomal 15q11.2-13 region, which is notable for its involvement in several other neurodevelopmental disorders including Prader-Willi syndrome [7–9] and Dup15q syndrome [9, 10]. Most (around 70%) cases of AS are caused by chromosomal deletions of the 15q11.2-13 region, eliminating the UBE3A gene [8]. AS can also result from loss-of-function mutations within the UBE3A gene itself. Although UBE3A is expressed in all tissues, its expression is regulated by genomic imprinting. In most cells, the maternal and paternal copies of the UBE3A gene are active. However, in neurons, the paternal UBE3A allele is transcriptionally silenced by an antisense transcript [11–14]. This monoallelic expression makes neurons uniquely vulnerable to maternal UBE3A loss-of-function mutations or deletions. Conversely, in non-neuronal cells such as astrocytes and oligodendrocytes, both parental UBE3A alleles are transcribed. This dual expression potentially mitigates the impact of maternal UBE3A deficiencies. Despite the identification of numerous potential UBE3A protein substrates and interacting partners, and the established role of UBE3A in synaptic plasticity [8], the precise mechanisms through which UBE3A loss in neurons cause the pervasive clinical manifestations of AS remain poorly understood.
Neuroimaging studies in children with AS reveal significant reductions in brain volume, widespread alterations in white matter (WM), and global decreases in both functional and structural connectivity [15–19]. Importantly, greater WM deficits correlate with more severe phenotypic expression in AS [18–20]. Similarly, we found a disproportionate reduction in WM compared to gray matter (GM) loss in our AS model mice [21]. Taken together, these observations underscore the need to better characterize aberrant WM development in AS, especially in the postnatal brain, when WM development is most dynamic [22] and AS symptoms start to appear. A better understanding of WM development in AS will enhance our knowledge of AS pathology and aid in developing therapies to mitigate WM deficits.
To investigate the consequences of maternal UBE3A loss on WM development after birth, we (1) characterize the postnatal trajectory of WM volume in children with AS (aged 1–12 years) and (2) examine differences in myelination patterns in postnatal AS model mice compared to wild-type (WT) controls.
Methods
Human MRI
We conducted MRIs on N = 131 children between 0.5 and 12 years of age: n = 32 children with AS and n = 99 neurotypical (NT) control participants. Total brain volumes (TBV) were generated in all scans between 0.5 and 12 years. White matter (WM) and gray matter (GM) volumes were generated in the subset of scans acquired between 1 and 12 years, owing to the ability to automatically segment between WM/GM tissues in MRI scans acquired over age 1 year. The final WM and GM analyses sample included N = 94 children: n = 28 AS (19 M, 9 F) and n = 66 age- and sex-matched NT controls (54 M, 12 F). Of these, 25 participants (13 AS; 12 NT) had a second longitudinal MRI scan, yielding a total of 119 scans in the WM and GM analyses (41 AS scans; 78 NT scans). T1- and T2-weighted structural MRI scans (1mm3 voxels) were acquired at UNC on 3T Siemens TIM Trio scanners with a 12-channel head coil. Children with AS were sedated using IV administration of propofol in the hospital MR suite. A pediatric anesthesiologist and certified registered nurse anesthetist implemented the standard hospital pediatric sedation protocol after consent from the parent/guardian and screening for contraindications. All images were reviewed for head motion and image quality by a reviewer blinded to genotype. Only images that passed quality control were used in the analysis. T1 and T2 images underwent registration, transformation to stereotactic space, and segmentation of total brain, WM, and GM volumes [23–25].
AS participants were confirmed with a chromosomal microarray showing a chromosomal deletion of the 15q11.2-13 region on the maternal allele, with deletion sizes ranging from 4.7 to 7.6 MB included in the WM and GM analyses. We excluded subjects with significantly larger deletions that extended beyond this region to ensure our WM findings specifically reflect the impact of typical AS deletions. NT participants were enrolled and had no first-degree relatives with a psychiatric diagnosis [26]. All subjects were excluded for the presence of: (a) diagnosis or physical signs of known genetic conditions or syndromes other than AS (e.g., significant dysmorphology, asymmetry on physical exam), significant medical or neurological conditions affecting growth, development or cognition (e.g., CNS infection, diabetes, tuberous sclerosis, congenital heart disease), or sensory impairments such as significant vision or hearing loss (or evidence of during the course of the study); (b) a history of significant perinatal adversity, exposure to in-utero neurotoxins (including alcohol, illicit drugs, selected prescription medications), or a history of maternal gestational diabetes; (c) contraindication for MRI (pacemaker, vascular stents, metallic ear tubes, other metal implants or braces); (d) families whose predominant home language is not English; and (e) children who were adopted. Parents of AS and NT individuals provided informed consent, and the institutional review board approved the research protocol.
Mice
The Ube3a mouse model was created in Dr. A. Beaudet’s laboratory [27]. This model represents specific UBE3A loss-of-function rather than the larger 15q11.2-13 deletions typically found in AS patients. While this model may not capture all aspects of AS genetics, it allows us to isolate UBE3A’s specific role in neurodevelopment. AS model mice (Ube3am–/p+), which maternally inherit the Ube3a knock-out allele, were generated by mating wild-type (Ube3am+/p+) male mice to female mice with paternal inheritance of the Ube3a knock-out allele (Ube3am+/p−, paternal null model), which themselves are phenotypically normal [27, 28]. Table 1 details the number of mice, their sex distribution, ages, and litter information for each experiment.
Table 1.
Summary of the age, sex, genotype, and number of mice used in this study
| Experiment | Age | WT | AS | Litters |
|---|---|---|---|---|
| Light microscopy | P5 | 3 M | 3 M | 3 |
| P8 | 3 F | 3 F | 3 | |
| P10 | 1 M, 1 F | 1 M, 1 F | 2 | |
| P12 | 2 M, 1 F | 2 M, 1 F | 3 | |
| P16 | 2 M, 1 F | 2 M, 1 F | 3 | |
| P23 | 1 M, 2 F | 1 M, 2 F | 3 | |
| P28 | 2 M, 1 F | 2 M, 1 F | 3 | |
| P30 | 1 M, 1 F | 1 M, 1 F | 2 | |
| P45 | 2 M, 1 F | 2 M, 1 F | 3 | |
| P60 | 3 F | 3 F | 3 | |
| Electron microscopy | P16 | 2 M, 2 F | 2 M, 2 F | 4 |
| P30 | 2 M, 2 F | 2 M, 2 F | 4 | |
|
Western blotting (AS vs. WT) |
P14 | 5 M, 5 F | 5 M, 5 F | 6 |
| P45 | 4 M, 3 F | 4 M, 3 F | 3 | |
|
Western blotting (PNL vs. WT) |
P14 | 2 M, 5 F | 4 M, 4 F | 3 |
| MRI-DTI | P14 | 2 M, 1 F | 1 M, 2 F | 2 |
Mouse MRI
WT and AS mice at P14 were deeply anesthetized using isoflurane and transcardially perfused with heparinized saline (0.9% NaCl, 0.1% heparin), immediately followed by 10% neutral buffered formalin (NBF) containing 10% Gadoteridol (0.5 M) (Gd, ProHance, Bracco Diagnostics Inc.). The mice were then decapitated, and their heads were postfixed in 10% NBF overnight. The following day, mouse heads were transferred to 0.5% Gd in PBS for 14 days. Before imaging, samples were placed in custom-designed MR-compatible tubes and submerged in Fomblin (Fomblin perfluoropolyether, Ausimont, Thorofare, NJ, USA) to minimize susceptibility artifacts and prevent sample dehydration.
Diffusion Tensor Imaging (DTI) was performed using a 9.4 Tesla scanner at the UNC Small Animal Imaging Facility (BioSpec 9.4/30 USR; Bruker Biospin). DTI was chosen because P14 mouse brains do not display robust T1 and T2 contrast between gray and white matter. Diffusion data was obtained using a multi-shot EPI sequence with the following parameters: TE = 30.896 ms, TR = 180 ms, BW = 400 kHz, FOV = 18 mm × 12 mm × 9 mm, matrix size = 240 × 160 × 120, Number of shots = 16, voxel resolution = 75 × 75 × 75 µm3, δ = 4 ms, Δ = 16 ms, Number of b0 images = 6, Shell = 3, b-value = 2000 (30 directions), 4000 (30 directions), 6000 (60 directions) s/mm2, partial Fourier = 1.11 (homodyne reconstruction for TE shortening), scan time = 12 h.
The diffusion data underwent preprocessing using the FSL eddy package to correct for eddy current distortions and subject motion artifacts [29]. Post-correction, Fractional Anisotropy (FA) was calculated using DSI Studio (RRID: SCR_009557) [30]. To spatially normalize the DTI images, each subject’s FA image was first registered to a reference subject’s FA map using rigid-body registration. A study-specific template was then generated using ANTs SyN non-linear registration. A brain mask was drawn on this template, and the inverse transform was applied to estimate subject-level brain masks. These masks were manually refined using ITK-SNAP and employed for skull stripping to improve spatial normalization. The skull-stripped FA images were then registered to the Developmental Common Coordinate Framework (DevCCF) at P14 [31] using ANTs SyN non-linear registration. To calculate brain volumes, the total number of voxels in each subject’s brain mask was multiplied by the volume of a single voxel. To calculate WM volumes, the DevCCF FA template was thresholded with FA > 0.3 [32, 33] and inverse transformed to each subject’s FA map.
Antibodies
To identify myelin basic protein (MBP), we used a rat monoclonal antibody (Abcam Cat#ab7349, RRID: AB_305869) raised against the full-length protein corresponding to cow MBP. This antibody binds to a region defined by amino acids 82–87 (DENPVV).
For UBE3A identification we used a mouse monoclonal antibody (Sigma-Aldrich, Cat#SAB1404508, RRID: AB_10740376). This antibody was developed against a peptide sequence common to all three isoforms of mouse UBE3A (amino acids 315–415 for isoforms 1 & 3, and 336–436 for isoform 2) and has been extensively validated [14, 34, 35].
Western blotting
Animals were anesthetized with isoflurane, followed by decapitation and extraction of forebrain tissue, excluding the olfactory bulb, cerebellum, and brainstem. The tissue was homogenized in a lysis buffer containing Tris-HCl (25mM, pH 7.4), 1% SDS, and 1mM EDTA with protease inhibitor. Protein concentrations were determined with the BCA assay, and protein (30 µg for P14 and 20 µg for P45) was loaded onto a 20% polyacrylamide-SDS gel. Proteins were then transferred onto a 0.2 μm nitrocellulose membrane. After blocking with Intercept Blocking Buffer (LiCor) for 1 h, the membranes were incubated overnight at 4 °C with primary antibodies: rat anti-MBP (1:1,000) and mouse anti-GAPDH (1:5,000; Sigma Cat#MAB374; RRID: AB_2107445). Following washing with PBS-Tween (PBS with 0.1% Tween™ 20), membranes were incubated in HRP-conjugated secondary antibodies, washed in PBS-Tween, and chemiluminescence imaging was performed. MBP protein band intensity was normalized to GAPDH band intensity. Protein expression in WT and Ube3a mutants was represented as a fraction of protein level in WT mice.
Light microscopy
Mice were anesthetized with sodium pentobarbital (60 mg/kg i.p.) and subsequently transcardially perfused, starting with a rapid flush with PBS (0.1 M, pH 7.3), followed by 10 min of 4% freshly depolymerized paraformaldehyde in phosphate buffer (pH 7.3). Brains were then postfixed overnight at 4 °C in the same fixative solution, cryoprotected in 30% sucrose in PBS, and sectioned at 50 μm using a sliding microtome. Free-floating sections underwent an initial methanol permeabilization step (2 × 15 min in 50% methanol in PBS) followed by a second permeabilization step: 1 h at 37 °C in a solution comprising 2.3% glycine, 20% DMSO, and 0.2% Triton X-100 in PBS. Subsequently, sections were preincubated for 30 min in 5% DMSO/0.1% Triton X-100/1% BSA in PBS and incubated overnight at 37 °C with primary antibody (MBP, 1:2,000 in PBS with 5% DMSO, 0.1% Triton X-100, 1% BSA, 0.2% Tween-20, and 1% heparin). The primary antibody was visualized using a secondary antibody conjugated with Alexa Fluor dye. Sections were counterstained with DAPI to reveal nuclei, and scanning was performed using a Slideview VS200 slide scanner (Olympus, Hamburg, Germany). Analysis was conducted using the QuPath software package (RRID: SCR_018257).
Electron microscopy
Mice were anesthetized with sodium pentobarbital (60 mg/kg i.p.) and perfused with a solution containing 2% glutaraldehyde, 2% paraformaldehyde, and 0.2% picric acid in 0.1 M phosphate buffer (pH 6.8). Following perfusion, brains were promptly removed and postfixed overnight at 4 °C in the same fixative. Subsequently, the brains were sectioned to a thickness of 50 μm using a vibratome. The sections were processed for reduced osmium following the Knott protocol [34, 36, 37]. In brief, the sections were washed in cacodylate buffer (0.1 M, pH 7.4) and post-fixed for 40 min in a solution of 1.5% potassium ferrocyanide and 1% osmium tetroxide, followed by an hour in 1% osmium tetroxide alone. After rinsing in water, the sections were incubated for 40 min in 1% uranyl acetate in water, rinsed again in water, dehydrated in an ethanol series, and finally infiltrated and embedded in resin (Spurr’s low viscosity epoxy with ERL-4221, Electron Microscopy Sciences, Hatfield, PA; cat. No. 14300). The embedded sections were flat mounted between sheets of ACLAR® fluoropolymer (Electron Microscopy Sciences, Hatfield, PA; cat. No. 50425) within glass slides. Small chips of the corpus callosum (body region) were affixed to plastic blocks, sectioned en face at ~ 60 nm, collected on 300 mesh nickel grids, and coated and contrasted with uranyl acetate and Sato’s lead. Grids were imaged at a voltage of 120 kV using a Technai 12 D230 transmission electron microscope running SerialEM [38, 39]. We acquired large 50–60 μm by 50–60 μm montages at 6500x (close to 1 nm per pixel) for quantification. Axons and myelin were manually traced using FIJI [40, 41]. The relative myelin thickness around an axon (g-ratio) was calculated as the √(AxonArea/MyelinArea). Quantitative analyses included 1,500–2,000 axons per animal at P16 and 1,000–1,500 axons per animal at P30.
Experimental design and statistical analysis
Differences in human MRI brain volumes (TBV, WM, GM) between the AS and NT groups were tested using a mixed effects model for repeated measures while covarying for the fixed effects of age, sex, scanner, and group x age interaction. Random effects included the individual subjects’ age at scan. All statistical analyses of MRI data were performed using SAS JMP software.
Early nutrition and maternal care are known to influence brain development, specifically growth and myelination. To account for these factors, we sampled AS mice and their WT littermates at various ages, ensuring litters were culled to a size of 5–7 mice (Table 1). Statistical analyses were performed using GraphPad Prism 9 (RRID: SCR_002798), including unpaired two-tailed t-tests to compare brain volumes for mouse MRI-DTI, MBP protein levels, and the percentage of myelinated axons.
Results
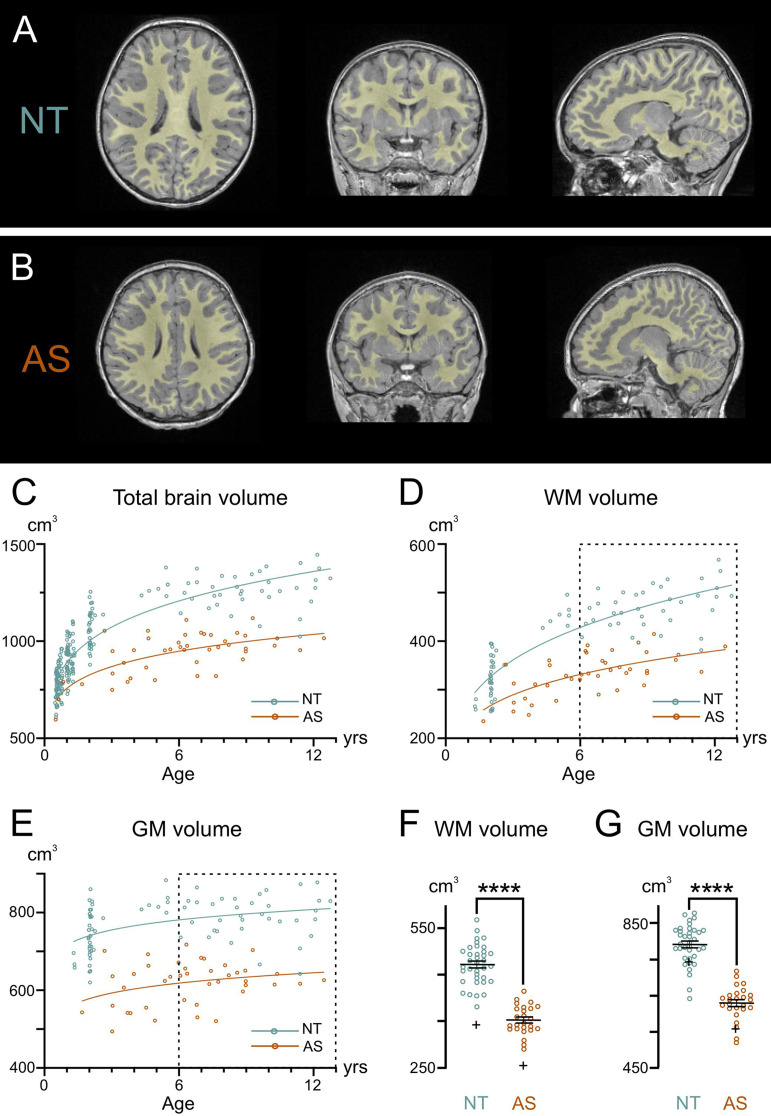
Our previous MRI studies showed decreased white matter (WM) volume in adult AS model mice [21]. To investigate whether this finding extends to children with AS and to explore its developmental trajectory, we conducted MRIs on children with AS compared to NT controls (Fig. 1). Representative MRIs from an AS and NT individual are depicted in Fig. 1A-B, with total brain volume (TBV) segmented into WM and GM volumes. AS children had significantly smaller TBV from 0.5 to 12 years compared to NT children (F1,234 = 28.82, p < 0.0001, covarying for age, sex, scanner, group x age; Fig. 1C). This smaller TBV in AS was comprised of significantly smaller WM volumes from 1 to 12 years compared to NT controls (F1,103 = 24.46, p < 0.0001, covarying for age, sex, scanner, group x age; Fig. 1D) and GM volumes (F1,99 = 34.98, p < 0.0001; Fig. 1E). The lack of group x age interaction in WM trajectories (p = 0.42) indicated that the AS group had significantly smaller WM volumes at all ages from 1 to 12 years (Fig. 1D).
Fig. 1.
Developmental trajectory of brain volume in neurotypical and AS individuals. Representative axial, coronal, and sagittal orientations of MRI scans from (A) a 4-year-old neurotypical (NT) control and (B) a 4-year-old individual with AS. Regions marked in yellow represent the segmented white matter (WM). (C) Quantification of total brain volume in NT controls and individuals with AS from 0.5 to 12 years of age. AS children had significantly smaller total brain volume from 0.5–12 years compared to NT controls (F1,234 = 28.82, p < 0.001, covarying for age, sex, scanner, group x age). Quantification of (D) WM volume and (E) gray matter (GM) volume in NT controls and individuals with AS from 1 to 12 years of age. AS children had significantly smaller WM (F1,103 = 24.46, p < 0.001) and GM (F1,99 = 34.98, p < 0.001) volumes from 1–12 years of age compared to NT controls. The boxplots show the (F) WM volumes and (G) GM volumes in NT controls and AS individuals from 6 to 12 years, corresponding to the age data points in dotted rectangles in (D) and (E). WM volume is decreased by 26.5% and GM volume is decreased by 21.6% in AS children compared to NT controls between 6 to 12 years. The ‘+’ in (F) and (G) depicts the group means from 1–6 years
In neurotypical individuals, TBV grows rapidly from 6 months to around 6 years of age, at a rate exceeding 10% per year (Fig. 1C). This growth rate was calculated by dividing the slope of the fitted curve by the number of years. After 6 years of age, TBV growth in NT individuals continues at a slower rate of ~ 4% per year. In contrast, individuals with AS show a different TBV growth rate of ~ 8% between 6 months and 6 years of age and ~ 2% between 6 and 12 years.
During the 6–12 year age range, when brain growth slowed and stabilized in both groups (see the dotted rectangles in Fig. 1D-E), we calculated the difference in WM and GM volumes between AS and neurotypical groups, controlling for covariates. The reduced TBV in AS individuals was primarily driven by a 26.5% decrease in WM volume (Fig. 1F) and a 21.6% decrease in GM volume (Fig. 1G) compared to NT controls. Further analysis of the ratio of WM to GM volume indicates that WM is disproportionally decreased in AS compared to NT by 5.8% (F1,41 = 4.57, p = 0.039; WM: GM ratio least-squared means for AS group = 0.562; NT = 0.597). We also analyzed available body weight data, finding that children with AS did not differ significantly from neurotypical children (p = 0.79) when accounting for age and sex. This indicates that the observed volume reductions are not simply a reflection of overall smaller body size.
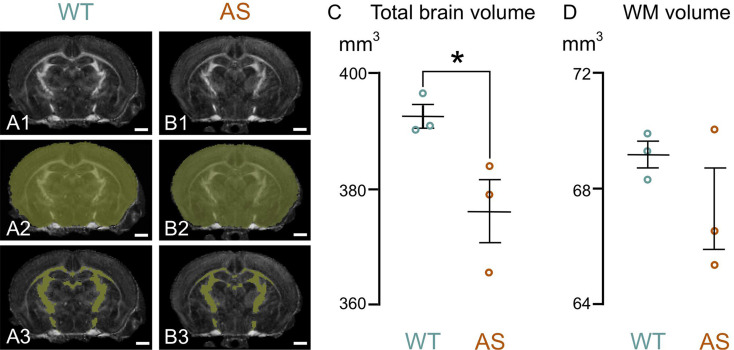
To determine if brain volume deficits observed in children with AS were also present in developing model mice, we performed DTI on both WT and AS mice at P14, roughly equivalent to a 2-year-old human. Consistent with our human MRI data, AS mice had significantly smaller TBV than WT mice (Fig. 2). However, no significant difference in WM volume was found between the groups, which may be due to the limited voxel resolution of our imaging protocol, the limited sample size given the relatively large variability, or the sensitivity of FA as a surrogate marker for WM segmentation at this young age.
Fig. 2.
Total brain and WM volume in developing WT and AS mice. A1, B1: show representative Fractional Anisotropy (FA) maps of WT (A1) and AS (B1) mice brains at P14, obtained through diffusion tensor imaging. A2, B2: highlights the mask used to determine total brain volume (yellow overlay). A3, B3: show segmented white matter (yellow overlay). C, D: quantification of total brain volume (C) and white matter volume (D) in WT and AS mice at P14. Data are presented as mean ± standard error of the mean. Scale bars = 1mm
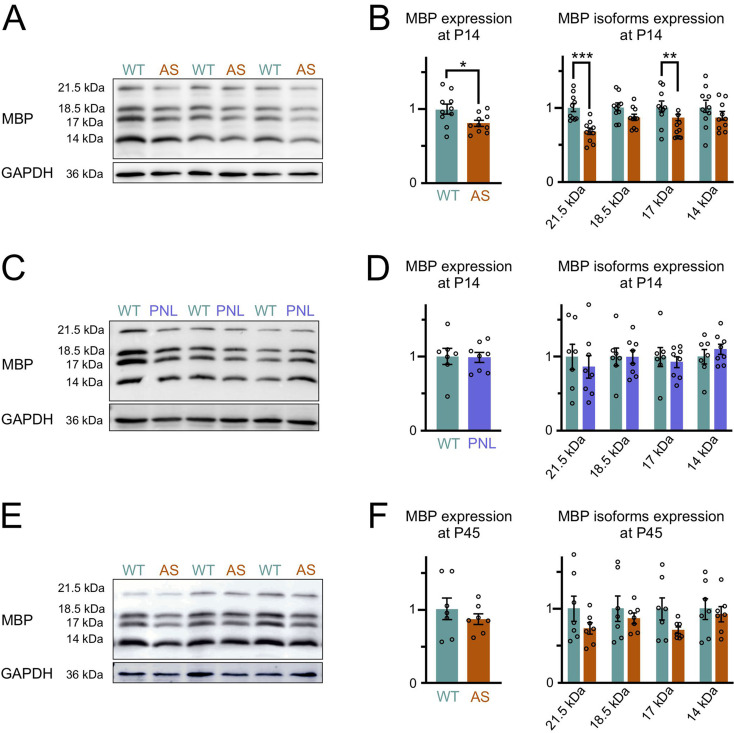
To investigate potential WM deficits further, we directly examined myelination levels, given their significant contribution to the increase in postnatal WM volume. Using MBP as a marker, we started by comparing two developmental stages: P14, a period of peak myelination activity, and P45, when myelination is largely complete [42]. Western blot analysis at P14 revealed approximately 20% less MBP in the forebrains of AS mice than in WT controls (Fig. 3A, B). This reduction in overall MBP was primarily due to the decreased levels of the two exon-II-containing isoforms, 21.5 kDa and 17.22 kDa, which are known to play a role in early, active myelination [43–46]. Early-onset neurodevelopmental disorders often show male bias, and recent studies implicate UBE3A in sex-specific effects in conditions like autism [47–49]. However, we observed no significant sex differences in MBP expression.
Fig. 3.
Delayed myelination in AS mouse brain (A) Representative Western blots for MBP and GAPDH loading control protein in P14 forebrain lysates from littermate pairs of Ube3am−/p+ (AS) and wild-type (WT) mice. (B) Quantification of Western blotting for total MBP content (sum of 21.5, 18.5, 17 and 14 kDa isoforms). The total MBP content is significantly reduced in the forebrains of AS compared to WT mice (WT n = 10, AS n = 10, unpaired two-tailed t-test, P = 0.026). Quantification of Western blotting for individual MBP isoforms (unpaired two-tailed t-test, 21.5 kDa: P = 0.0002, 18.5 kDa: P = 0.06, 17 kDa: P = 0.005, 14 kDa: P = 0.25). (C) Representative Western blots for MBP and GAPDH loading control protein in P14 forebrain lysates from littermate pairs of paternal Ube3a-null model (Ube3am+/p−, PNL) and WT mice. (D) Quantification of Western blotting for total MBP content (WT n = 7, PNL n = 8, unpaired two-tailed t-test, P = 0.93). Quantification of Western blotting for individual MBP isoforms (unpaired two-tailed t-test, 21.5 kDa: P = 0.6, 18.5 kDa: P = 0.97, 17 kDa: P = 0.6, 14 kDa: P = 0.42). (E) Representative Western blots for MBP and GAPDH loading control protein in P45 forebrain lysates from littermate pairs of AS and WT mice. (F) Quantification of Western blotting for total MBP content (WT n = 7, AS n = 7, unpaired two-tailed t-test, P = 0.412). Quantification of Western blotting for individual MBP isoforms (unpaired two-tailed t-test, 21.5 kDa: P = 0.18, 18.5 kDa: P = 0.47, 17 kDa: P = 0.09, 14 kDa: P = 0.67). Data are mean ± SEM
Interestingly, this lower level of MBP was not seen in mice that lacked the paternal Ube3a allele (Fig. 3C, D). Paternal Ube3a-null mice (Ube3am+/p−), in contrast to AS model mice (Ube3am−/p+), retain UBE3A protein expression in neurons, while oligodendrocytes in both the maternal- and paternal-null models express only one functional Ube3a copy. This finding suggests that the MBP expression deficit seen in AS arises from the loss of UBE3A in neurons rather than haploinsufficiency of Ube3a within oligodendrocytes. Surprisingly, the MBP differences between groups at P45 did not reach statistical significance (p = 0.41, Fig. 3E, F), suggesting that AS mice experience a delay in myelination rather than a permanent deficit.
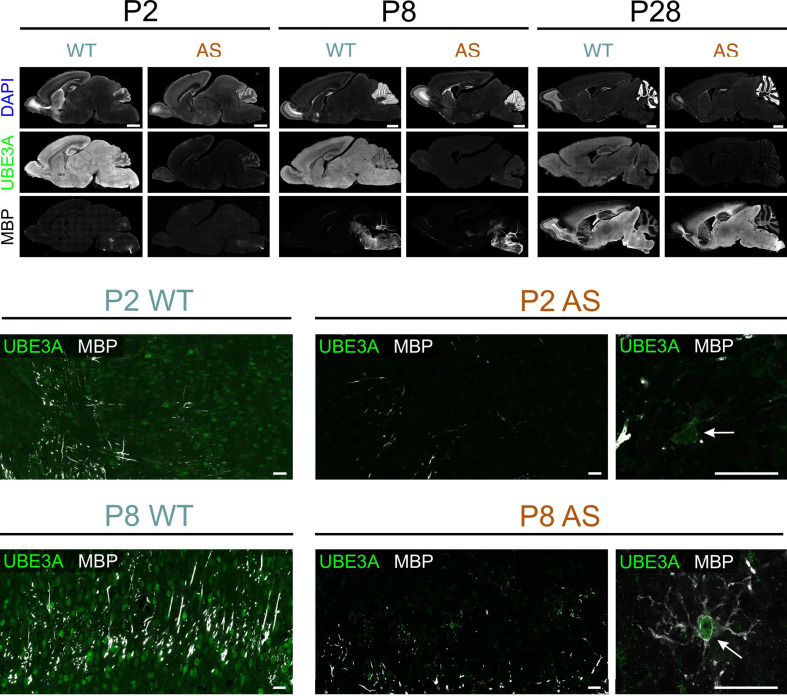
To better understand myelination patterns in AS model mice, we used immunohistochemistry to compare regional MBP distribution in WT and AS postnatal brains. Before examining specific regional myelination patterns, we investigated the expression of UBE3A during early postnatal development to determine if the paternal Ube3a gene was still active in brain regions undergoing myelination. We used double staining for UBE3A and MBP in AS mice (Fig. 4) and found that by postnatal day 2, UBE3A staining was limited to small non-neuronal cells in the regions where myelination occurred. This pattern was consistent across all animals when litter sizes were properly controlled, supporting our previous findings on the early developmental silencing of the paternal Ube3a allele in neurons [14]. These results also indicate that individual variability did not significantly influence UBE3A expression patterns.
Fig. 4.
Multiple labeling for MBP and UBE3A in WT and AS mice during development. Upper panel: Overview of MBP, UBE3A, and DAPI labeling in sagittal sections from WT and AS mice at P2, P8, and P28. Middle panel: High magnification images from midbrain at P2. Arrow points to a premyelinating oligodendrocyte in AS tissue that expresses UBE3A while neighboring cells show minimal UBE3A staining. Lower panel: High magnification images from midbrain at P8. Arrow points to a premyelinating oligodendrocyte in AS tissue that expresses UBE3A Scale bars: upper panel = 1 mm, middle and lower panel = 25 μm
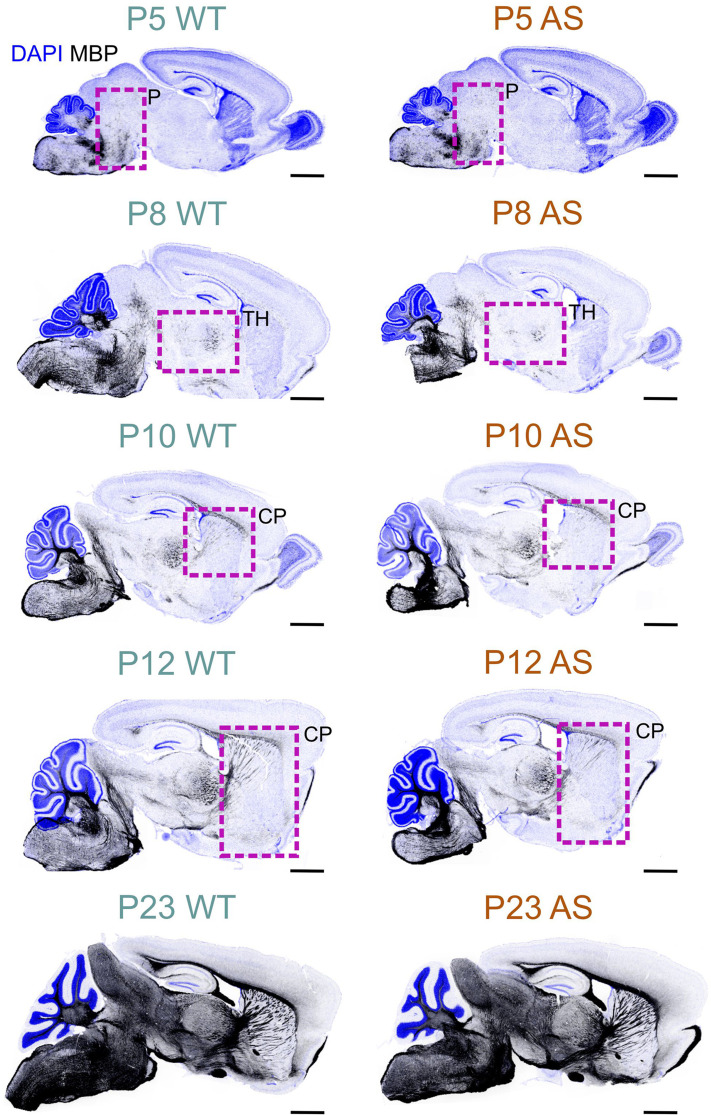
In both WT and AS brains, the developmental distribution of MBP, indicative of myelination, follows the well-established caudo-rostral myelination pattern (Fig. 5). MBP staining begins in the spinal cord and progresses systematically through the brainstem regions (medulla, pons, mesencephalon) and finally into the telencephalon. However, AS mice show a consistent delay of several days in the appearance and intensity of MBP staining compared to their age-matched WT littermates. This delay is especially clear during the initial stages of myelination, with the timing varying across different brain regions.
Fig. 5.
MBP developmental profile in the WT and AS mouse brain. Immunofluorescence staining for MBP (black) and DAPI (blue) in sagittal brain sections of WT and AS mice at P5 through P23. Boxes highlight regions with notably reduced MBP staining in AS mice compared to WT mice. Scale bars = 1 mm. P, Pons; TH, Thalamus; CP, caudoputamen
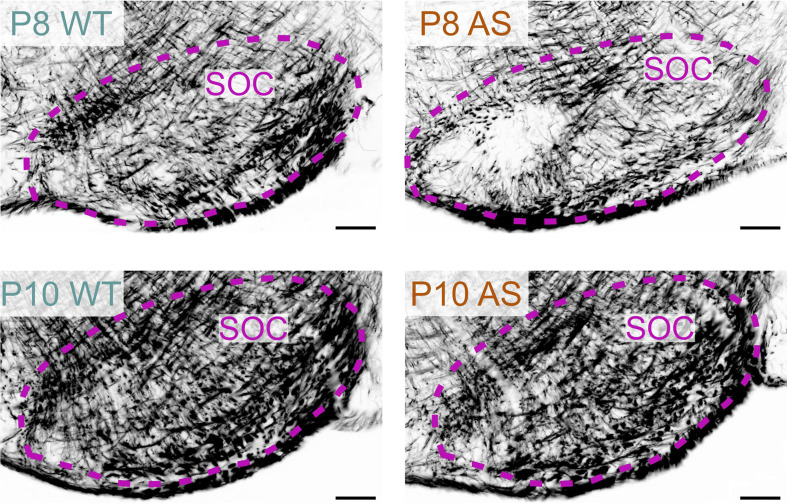
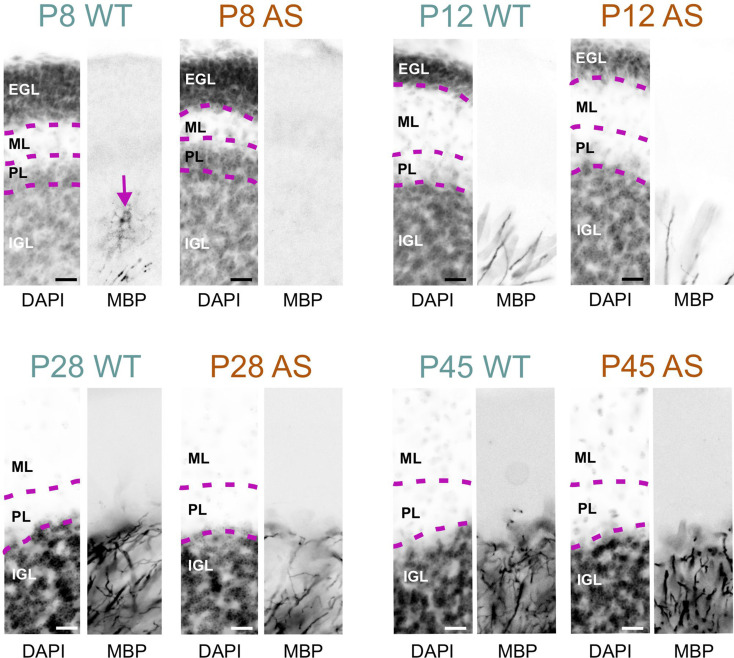
For example, in the superior olivary complex at P8, AS mice displayed a reduced density of MBP-positive fibers compared to WT mice (Fig. 6). However, by P10, this difference in staining density was no longer noticeable. In the WT cerebellum at P8, the granule cell layer displayed abundant MBP-positive premyelinating oligodendrocytes, characterized by many delicate, radiating processes resembling a spider’s web. A few MBP-positive fibers were also visible in the lower part of the granule cell layer. In sharp contrast, the AS cerebellar cortex at this stage completely lacked MBP staining (Fig. 7). By P12, the granule cell layer in the WT brain showed a progression in myelination, with increased MBP-positive fibers and longer processes reaching toward the Purkinje cell layer, but this progression was less pronounced in the cerebellar cortex of AS mice, which exhibited fewer fibers and shorter processes. This delay in myelination persisted at P28 but was unnoticeable by P45.
Fig. 6.
Delayed myelination in the AS hindbrain. Immunofluorescence staining for MBP in the superior olivary complex of WT mouse and AS littermate at P8 and P10. Scale bars = 100 µm. SOC, superior olivary complex
Fig. 7.
Delayed myelination in the AS cerebellar cortex. Immunofluorescence staining for DAPI and MBP in the cerebellar cortex of WT mice and AS littermates from P8 to P45. Arrow shows MBP staining along an oligodendrocyte in the WT cerebellar cortex at P8. Scale bars = 20 µm. EGL, external granule layer; ML, molecular layer; PL, Purkinje cell layer; IGL; inner granule layer
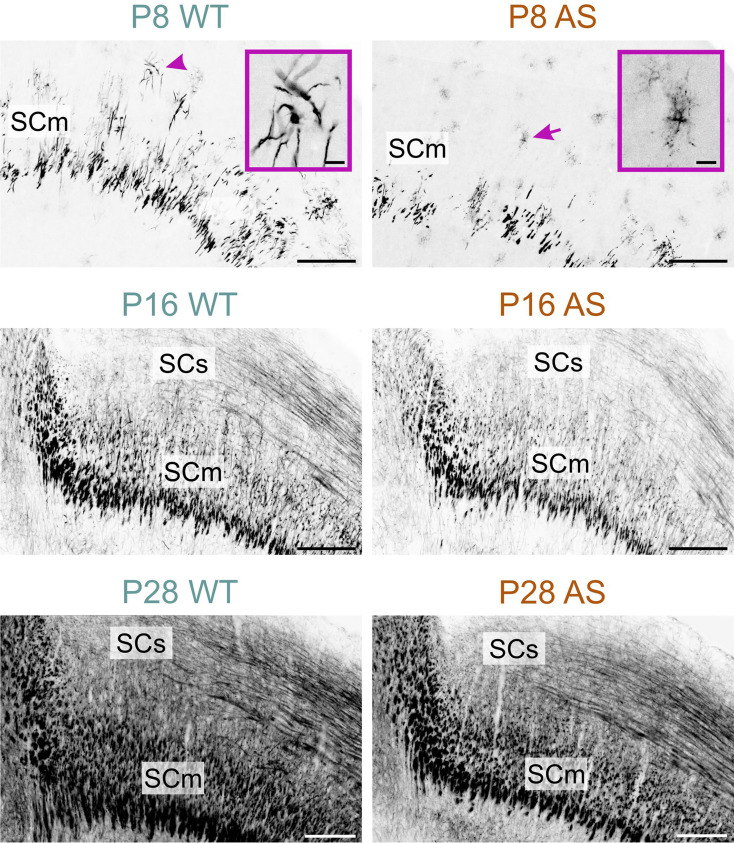
The late onset of myelination in AS mice was clearest in the motor-related part of the superior colliculus at P8 (Fig. 8). In WT mice, MBP staining at P8 indicated the onset of myelination (Fig. 8 inset in P8 WT micrograph). In contrast, in AS mice at the same age, MBP staining was localized to cells displaying morphological features of premyelinating oligodendrocytes (Fig. 8 inset in P8 AS micrograph). MBP staining in the colliculi of the AS brains continued to exhibit reduced density at both P16 and P28, although this difference was normalized by P60.
Fig. 8.
Delayed myelination in the AS midbrain. Immunofluorescence staining for MBP in the midbrain of WT mice and AS littermates at P8, P16, and P28. The arrowhead indicates active myelination, while the arrow points to premyelinating oligodendrocytes. Insets provide a close-up view of the areas indicated by the arrowhead and the arrow. Scale bars = 200 μm; inset = 20 μm. SCm, superior colliculus motor related; SCs, superior colliculus sensory related
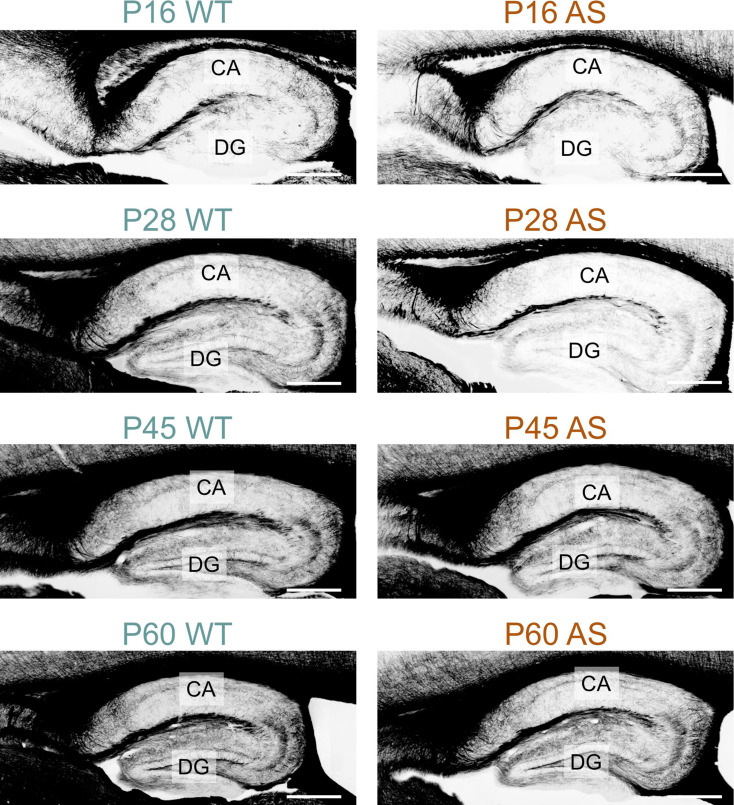
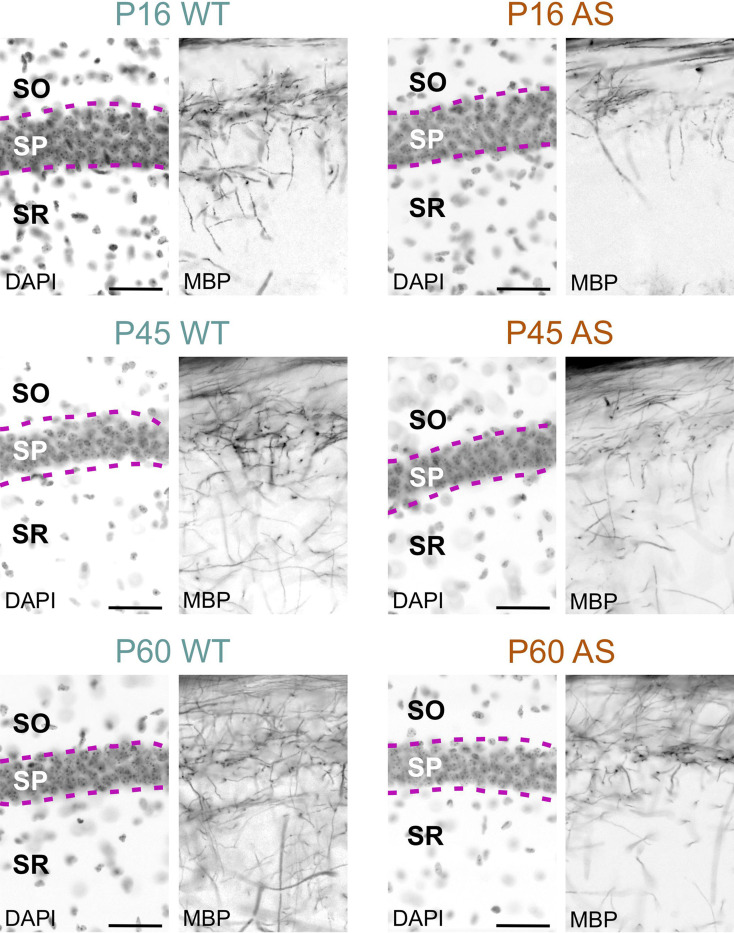
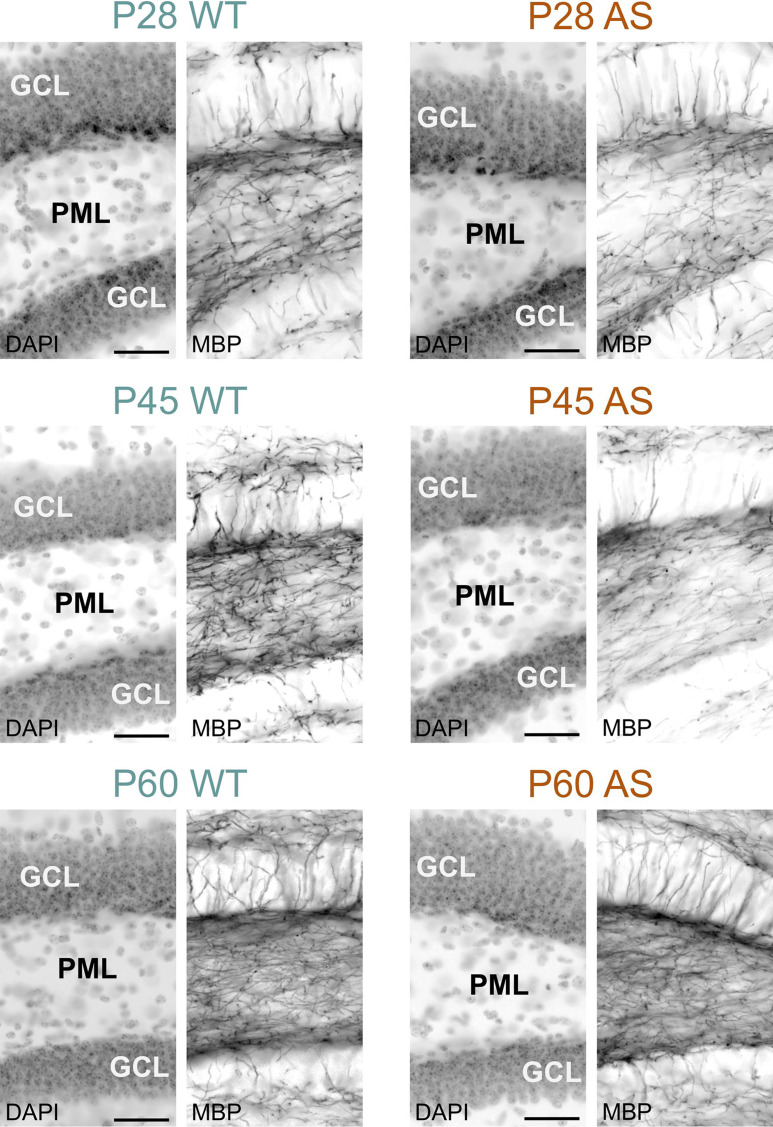
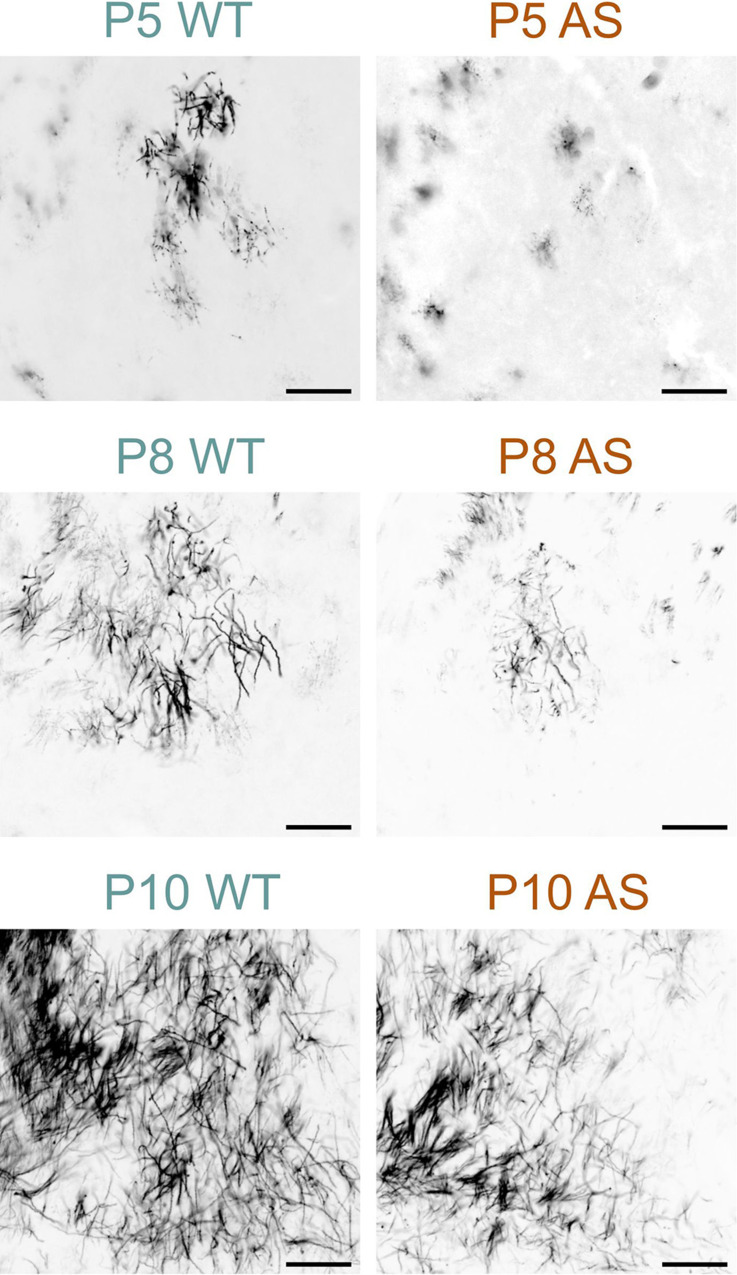
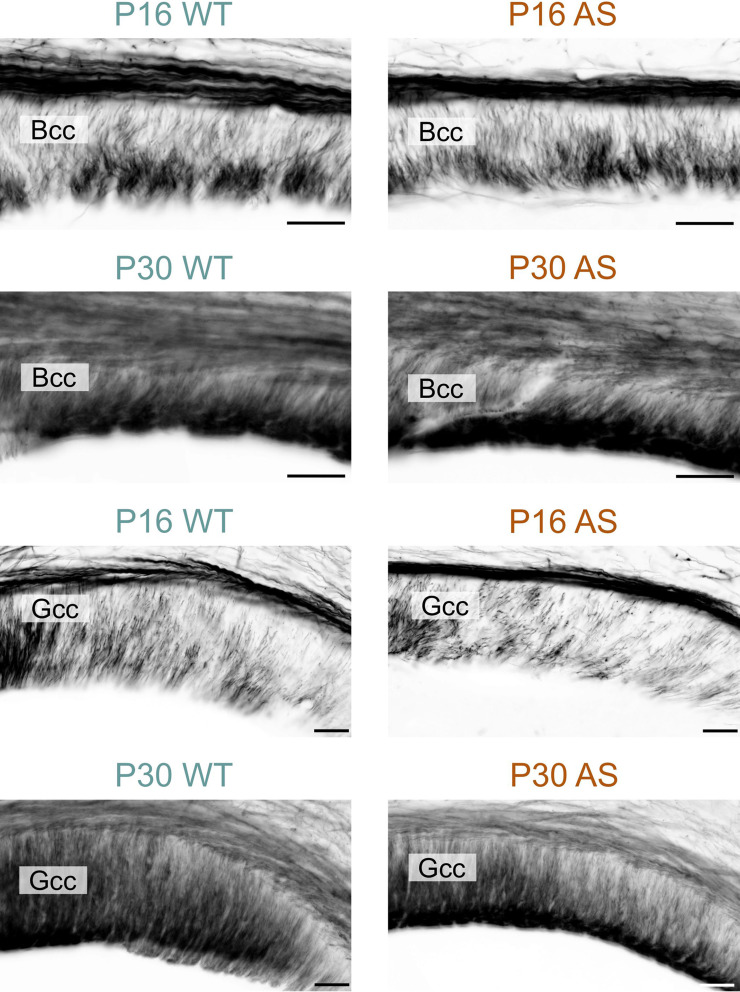
Myelination in the hippocampal area also experienced delays; while in the dentate gyrus the delay normalized by P60, in the CA1 region, AS littermates still showed reduced MBP signal, albeit modestly (Figs. 9, 10 and 11). WM pathways in AS mice also showed myelination delays, including fibers penetrating the globus pallidus (Fig. 12) and the corpus callosum (Fig. 13). At P5, MBP staining in the globus pallidus of WT mice showed early-stage myelination. In contrast, in AS mice, it was predominantly localized to premyelinating oligodendrocytes (Fig. 12). This delay persisted until P10 but was resolved by P12. In the body and genu of the corpus callosum, AS mice showed a reduced density of MBP-positive fibers compared to WT mice at P16 (Fig. 13). While the MBP signal in the body region normalized by P30, the genu did not normalize until P60.
Fig. 9.
Delayed myelination in the AS hippocampal formation. Immunofluorescence is staining for MBP in the hippocampal formation of WT mice and AS littermates from P16 to P60. Scale bars = 400 µm. CA, Cornu ammonis; DG, Dentate gyrus
Fig. 10.
Delayed myelination in the AS CA1 hippocampus. Immunofluorescence staining for DAPI and MBP in the hippocampal CA1 region of WT mice and AS littermates at P16, P45, and P60. Scale bars = 50 µm. SO, stratum oriens; SP, stratum pyramidale; SR, stratum radiatum
Fig. 11.
Delayed myelination in the AS dentate gyrus. Immunofluorescence staining for DAPI and MBP in the dentate gyrus of WT mice and AS littermates at P28, P45, and P60. Scale bars = 50 µm. GCL, granule cell layer; PML, polymorph layer
Fig. 12.
Delayed myelination in the AS globus pallidus. Immunofluorescence staining for MBP in the globus pallidus of WT mice and AS littermates at P5, P8, and P10. Scale bars = 100 µm
Fig. 13.
Delayed myelination in the AS corpus callosum. Immunofluorescence staining for MBP in the body and genu of the corpus callosum in WT mice and AS littermates at P16 and P30. Scale bars = 50 µm. Bcc, body of corpus callosum; Gcc, genu of corpus callosum
Immunohistological data confirmed the Western blot findings, revealing a delay in the onset of myelination across all brain regions examined, but that was ultimately normalized. To investigate whether this delay is associated with ultrastructural abnormalities, we used transmission electron microscopy to analyze myelin structure for major defects, such as vacuolation and misfolding, as well as subtle alterations, including myelin thickness relative to axon diameter. Our analysis focused on the body of the corpus callosum at two time points: P16, when immunohistochemistry indicated a pronounced myelin deficit in the body of the corpus callosum, and P30, when this deficit appeared to have normalized.
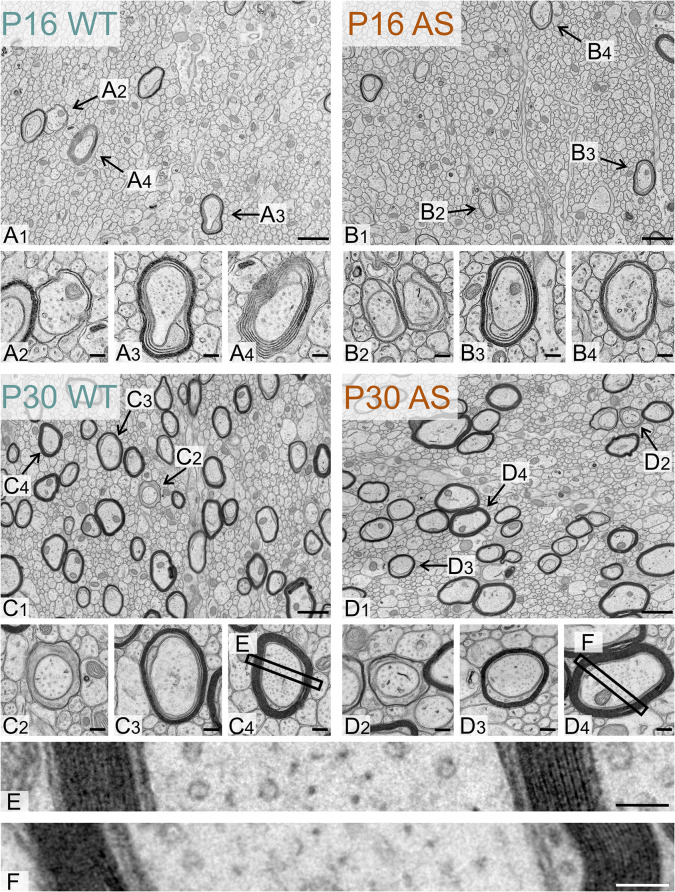
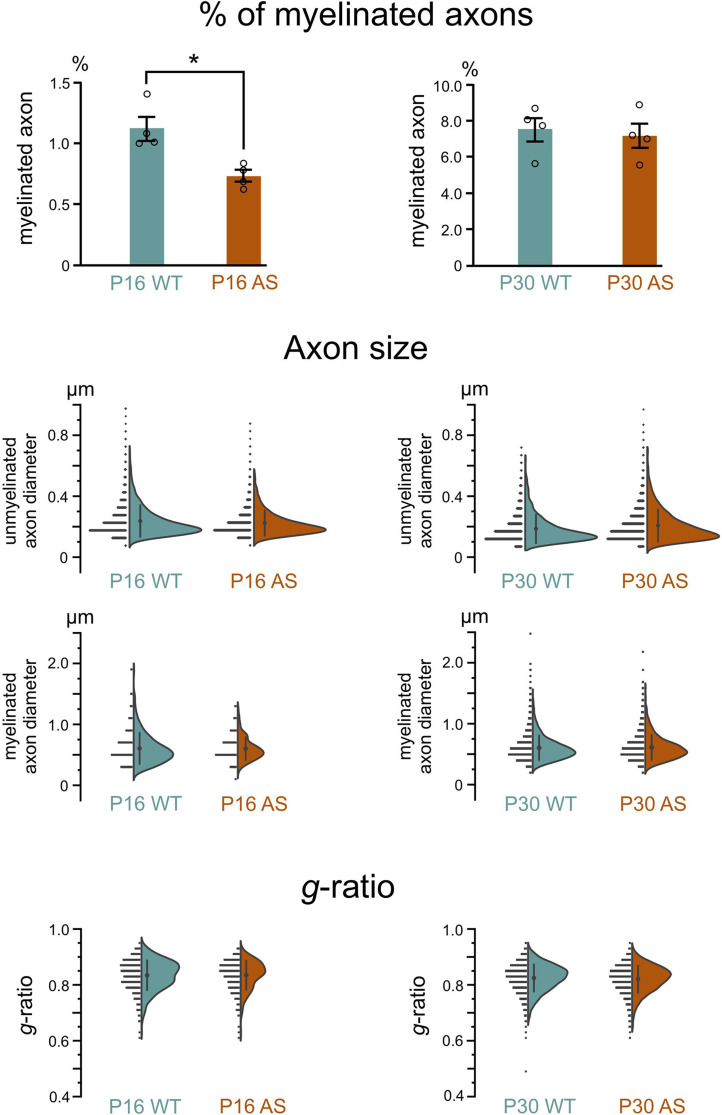
Ultrastructural analysis showed no evidence of axonopathy in either genotype at any age (Fig. 14). At P16, both genotypes exhibited a typical range of myelination stages: initial myelin extension, ongoing wrapping and compaction, and axons with fully compacted myelin. By P30, while axons still presented early and intermediate stages of myelination, there was a notable shift towards more mature myelin. Quantitative analysis revealed a significant delay in myelination in AS model mice at P16, with about 35% fewer myelinated axons than their WT littermates (Fig. 15). However, by P30, this difference was no longer significant. The average diameter of both unmyelinated and myelinated axons in WT and AS mice did not differ significantly at either age. Additionally, we did not see differences in the relative thickness of the myelin sheath (g-ratio) between WT and AS groups at any age. Finally, none of our ultrastructural analyses revealed significant differences between the sexes.
Fig. 14.
Ultrastructure of the developing WT and AS corpus callosum. Representative electron micrographs of the corpus callosum body in (A1) a WT mouse and (B1) a AS littermate at P16. Representative electron micrographs showing examples of myelinated axons observed in (A2, A3, A4) a WT mouse and (B2, B3, B4) an AS littermate at P16. Representative electron micrographs of the corpus callosum body in (C1) a WT mouse and (D1) a AS littermate at P30. Representative electron micrographs showing examples of myelinated axons observed in (C2, C3, C4) a WT mouse and (D2, D3, D4) a AS littermate at P30. (E) and (F) Representative electron micrographs showing layers of compacted myelin around the axons shown in C4 and D4. Scale bars: (A1, B1, C1, D1) = 500 nm; (A2-4), (B2-4), (C2-4), (D2,4) = 125 nm, (E), (F) = 50 nm
Fig. 15.
Percentage of myelinated axons, axon size, and g-ratio in the developing WT and AS corpus callosum. Quantification of percent myelinated axons in the body of corpus callosum (Bcc) in WT and AS mice at P16 and P30 (n = 4 mice for each genotypic group, unpaired two-tailed t-test, P = 0.01 for P16, P = 0.72 for P30). Data are mean ± SEM. Distribution of diameters of unmyelinated and myelinated axons in WT and AS mice Bcc at P16 and P30. Distribution of g-ratios of myelinated axons in WT and AS mice Bcc at P16 and P30
Taken together, our data support a model of delayed myelination onset in AS mice rather than a fundamental defect in the myelination process itself.
Discussion
Microcephaly
Postnatal microcephaly is a common clinical feature of children with AS and is typically noticed by the age of two. However, it may be present earlier but go unnoticed due to the limitations of imaging technology. AS mouse models also show microcephaly [21], showing this is a penetrant feature driven by the loss of UBE3A. Our previous MRI studies on adult AS mouse models indicate that a reduction in WM volume is an important contributor to microcephaly in AS [21]. This follow-up study shows that significant WM deficits are also present in children with AS. Our MRI data show a ~ 26% reduction in WM volume in AS children aged 6–12 years. This confirms that altered WM throughout the brain is a key feature of AS, expanding on earlier findings [15–19]. Interestingly, we find a greater reduction in AS individuals compared to the AS mouse model. Specifically, AS individuals showed a WM decrease of around ~ 26%, whereas the mice only showed an 11–13% reduction [21]. Similarly, GM volume was reduced by ~ 21% in AS individuals compared to 7–8% in the mouse model [21]. Whether these differences stem from species-specific differences in UBE3A biology, differences from having only maternal UBE3A allele deleted versus having other genes in the 15q11-q13 region also deleted, or idiosyncratic anatomical variations between rodents and primates is still an open question.
WM is fundamental to infant behavior, with healthy development linked to cognitive function, visual attention, working memory, and language skills [50–54]. Conversely, atypical WM development is a hallmark of several neurodevelopmental diseases [55, 56]. Therefore, the significant reduction in WM volume seen in this study is likely an important contributor to AS pathology. However, the remarkable plasticity of WM during development also presents a promising avenue for AS treatment. Recent research highlights how the frequency of parent-infant communication can directly affect the myelination of key brain pathways [57]. This plasticity suggests that targeted therapies focused on enhancing WM health could lead to significant improvements for individuals with AS.
Several promising treatments aimed at restoring UBE3A function are currently undergoing clinical trials for AS [58]. Considering the large WM deficit seen in this study, its link to behavioral traits in AS [18–20], and the plasticity of WM, measures of WM integrity hold promise as therapeutic biomarkers. Current imaging methods struggle to accurately distinguish between WM and GM in infants under one year old because of lower levels of myelination, which hampers the early detection of WM deficits. Nevertheless, rapid advancements in computer vision technology may soon overcome this limitation, thereby increasing the effectiveness of WM as a therapeutic biomarker.
Delayed myelination
Our data from the AS mouse model showed a temporary delay in the onset of myelination, which quickly resolves, resulting in a normalized percentage of myelinated axons by P30. Myelinated axons in the AS brain displayed a normal g-ratio, indicating a typical axon diameter to myelin thickness ratio, and were indistinguishable from their counterparts in the WT brain. Our earlier studies suggested a decrease in axon size [21]. However, in this study, we did not see any significant reduction in axon diameter, either in myelinated or unmyelinated axons. This discrepancy might be attributed to multiple factors: the inherent spatial heterogeneity within the corpus callosum, the possibility that UBE3A loss has region-specific effects, and age differences. Finally, we saw no overt defects in the myelination process or any ultrastructural abnormalities within the WM.
The exact mechanism behind the observed delay in myelination remains unclear, although our data offer some insights. UBE3A is expressed in oligodendrocytes [14] and likely in oligodendrocyte precursor cells. Theoretically, the maternal loss of UBE3A in oligodendrocytes, which express Ube3a biallelically, could impair their ability to myelinate, leading to a delay in myelination. It has yet to be definitively established whether Ube3a haploinsufficiency in oligodendrocytes leads to a 50% reduction in UBE3A protein levels. However, our results from AS model mice show that Ube3a haploinsufficiency in oligodendrocytes does not lead to the observed myelination deficits, as this delay is not present in our paternal Ube3a-null model mice. Thus, our data suggest that the delayed myelination is associated with the absence of UBE3A in neurons. Neurons can influence myelination through various mechanisms [59, 60], and the loss of UBE3A could disrupt one or more of these processes, resulting in a delay in myelination. Several secreted molecules from active neurons have been reported to increase oligodendrocyte precursor cell proliferation and/or differentiation, including PDGF [61], brain-derived neurotrophic factor [62], adenosine 5′-triphosphate [63], and glutamate [64, 65].
Oligodendrocyte precursor cells also express neurotransmitter receptors and can be directly regulated by synaptic transmission [66]. Therefore, neuronal activity can regulate the early steps of myelin formation, including oligodendrocyte precursor cell proliferation and differentiation, to affect overall myelination. Consequently, a delay in neuronal maturation could lead to a delay in myelination.
Relationship between microcephaly and delayed myelination
The structural basis for WM volume reduction in AS remains unclear, as does whether microcephaly and delayed myelination represent linked or independent phenotypes. However, since myelin stabilizes axon structure and shapes neural circuits, even transient myelination delays during development could permanently alter brain connectivity [67]. This may explain why AS individuals show reduced brain connectivity [19, 68], even after myelination normalizes. It is also worth noting that while we saw a brief delay in myelination in mice (days), this likely translates to a more extended period in humans (potentially months or even years). An extended delay in humans could have a significantly greater impact on AS brain development. It might explain the greater WM deficit we observed in AS individuals compared to mouse models. On the positive side, this also implies extended windows for therapeutic intervention.
Limitations
Our immunofluorescence data revealed a delay in myelination. However, technical limitations prevented us from conducting a detailed quantitative analysis of oligodendrocyte morphology to further characterize this delay. Importantly, assessing the translational relevance of the delayed myelination seen in mice to humans presents challenges. First, capturing precise information about myelin using MRI is difficult, and our current data do not directly measure myelination in humans. Second, histological validation in humans is not possible. Additionally, translating developmental data from rodent models to humans is challenging due to the inherent differences in timing across species. Future studies using multimodal imaging approaches could investigate whether and to what extent a delay in myelination also occurs in children with AS. Additionally, microcephaly is reported in adults with AS. While our study focused on early development, extending these MRI analyses to adults will be crucial for understanding whether WM deficits persist throughout the lifespan and how they might contribute to long-term clinical outcomes.
Conclusions
In summary, our study shows that children with AS exhibit substantial WM and GM volume deficits, as previously shown for AS model mice, and demonstrate that these deficits are apparent as early as 1 year of life. Our studies in AS model mice suggest that brain volume reductions are accompanied by a delay in the onset of myelination. Further research is needed to determine whether these observed deficits and myelination delays are secondary consequences of AS or play a central role in its pathogenesis. Investigating these questions will improve our understanding of AS and aid in developing potential treatments. Additionally, our research shows that tracking changes in WM could be an effective method for evaluating the potential success of therapeutic interventions in AS patients, particularly for detecting early therapeutic responses in clinical trials.
Electronic supplementary material
Below is the link to the electronic supplementary material.
Acknowledgements
We are deeply grateful to the study participants and their dedicated families. We thank Matt Judson and Hanna Vihma for their technical advice, Paul Risteff from the Hooker Imaging Core for assistance with tissue processing for electron microscopy, and Winnie Wang from the Center for Animal MRI for collecting the mouse DTI data.
Abbreviations
- AS
Angelman syndrome
- Bcc
Body of corpus callosum
- CA1
Cornu ammonis1
- CP
Caudoputamen
- DG
Dentate gyrus
- EGL
External granule layer of the cerebellum
- Gcc
Genu of corpus callosum
- GCL
Granule cell layer of dentate gyrus
- GM
Gray matter
- IGL
Inner granule layer of cerebellum
- MBP
Myelin basic protein
- ML
Molecular layer of cerebellum
- MRI
Magnetic resonance imaging
- NT
Neurotypical
- P
Pons
- PL
Purkinje cell layer of cerebellum
- PML
Polymorph layer of dentate gyrus
- PNL
paternal-null
- SCm
Superior colliculus motor-related
- SCs
Superior colliculus sensory-related
- SO
Stratum oriens
- SOC
Superior olivary complex
- SP
Stratum pyramidale
- SR
Stratum radiatum
- TH
Thalamus
- UBE3A
Ubiquitin protein ligase E3A
- WM
White matter
- WT
Wild type
Author contributions
SSO performed and analyzed electron microscopy experiments, designed experiments, analyzed data, prepared the figures, and wrote the manuscript. RKRP performed immunohistochemistry and light microscopy, and analyzed data. TV performed electron microscopy analysis. ALS performed Western Blots. MAS developed image processing methods for the human MRIs. HCH provided oversight to the acquisition and analysis of the human MRI data. MDS collected the human MRI data, generated brain volumes, analyzed the data, and wrote portions of the manuscript involving the human MRI data. LMS, SHL, and YYS acquired and analyzed the mouse DTI data. ACB performed experiments and microscopy, analyzed data, prepared the figures, and wrote the manuscript. BDP, conceptualized and provided experimental guidance. All authors edited the manuscript.
Funding
This research was supported by NIH R01MH120229, NIH R01NS114086, NIH R01NS129914, NIH R56NS097831, Angelman Syndrome Foundation, and Simons Foundation Autism Research Initiative award 702556 to BDP; NIH P50HD103573 project 8084 to BDP and MDS; NIH T32 HD040127 to BDP and MDS; NIH K12HD001441 to MDS; NIH R01HD093771 to BDP and HCH. Neurotypical control data was collected as parts of NIH R01MH064708 and NIH R01HD055741. Microscopy was performed at the UNC Neuroscience Microscopy Core, supported in part by funding from the UNC Neuroscience Center Support Grant (NINDS; P30NS045892) and the NIH-NICHD Intellectual and Developmental Disabilities Research Center Grant P50HD103573, and at the UNC Hooker Imaging Core Facility, supported in part by P30CA016086 Cancer Center Core Support Grant to the UNC Lineberger Comprehensive Cancer Center. Animal MRI was performed at the UNC Center for Animal MRI, supported in part by funding from NIH High-End Instrumentation Grant (S10OD026796 and S10MH124745).
Data availability
The authors will make the raw data supporting this article’s conclusions available upon request.
Ethics approval and consent to participate
All procedures related to the care and treatment of animals followed institutional and NIH guidelines, and all animal use protocols were reviewed and approved by the UNC Institutional Animal Care and Use Committee. Parents of AS and NT individuals provided informed consent, and the institutional review board approved the research protocol.
Competing interests
The authors declare no competing interests.
Footnotes
Publisher’s note
Springer Nature remains neutral with regard to jurisdictional claims in published maps and institutional affiliations.
Mark D. Shen, Alain C. Burette and Benjamin D. Philpot are co-senior authors and co-corresponding authors.
Contributor Information
Mark D. Shen, Email: mark_shen@med.unc.edu
Alain C. Burette, Email: alain_burette@med.unc.edu
Benjamin D. Philpot, Email: bphilpot@med.unc.edu
References
- 1.Mabb AM, Judson MC, Zylka MJ, Philpot BD. Angelman syndrome: insights into genomic imprinting and neurodevelopmental phenotypes. Trends Neurosci. 2011;34:293–303. 10.1016/j.tins.2011.04.001. [DOI] [PMC free article] [PubMed] [Google Scholar]
- 2.Margolis SS, Sell GL, Zbinden MA, Bird LM. Angelman Syndrome Neurother. 2015;12:641–50. 10.1007/s13311-015-0361-y. [DOI] [PMC free article] [PubMed] [Google Scholar]
- 3.Williams CA, Driscoll DJ, Dagli AI. Clinical and genetic aspects of Angelman syndrome. Genet Med. 2010;12:385–95. 10.1097/GIM.0b013e3181def138. [DOI] [PubMed] [Google Scholar]
- 4.Williams CA, et al. Angelman syndrome 2005: updated consensus for diagnostic criteria. Am J Med Genet A. 2006;140:413–8. 10.1002/ajmg.a.31074. [DOI] [PubMed] [Google Scholar]
- 5.Bindels-de Heus K, et al. An overview of health issues and development in a large clinical cohort of children with Angelman syndrome. Am J Med Genet A. 2020;182:53–63. 10.1002/ajmg.a.61382. [DOI] [PMC free article] [PubMed] [Google Scholar]
- 6.Kishino T, Lalande M, Wagstaff J. UBE3A/E6-AP mutations cause Angelman syndrome. Nat Genet. 1997;15:70–3. 10.1038/ng0197-70. [DOI] [PubMed] [Google Scholar]
- 7.Bird LM. Angelman syndrome: review of clinical and molecular aspects. Appl Clin Genet. 2014;7:93–104. 10.2147/TACG.S57386. [DOI] [PMC free article] [PubMed] [Google Scholar]
- 8.Buiting K, Williams C, Horsthemke B. Angelman syndrome - insights into a rare neurogenetic disorder. Nat Rev Neurol. 2016;12:584–93. 10.1038/nrneurol.2016.133. [DOI] [PubMed] [Google Scholar]
- 9.Kalsner L, Chamberlain SJ, Prader-Willi. Angelman, and 15q11-q13 duplication syndromes. Pediatr Clin North Am. 2015;62:587–606. 10.1016/j.pcl.2015.03.004. [DOI] [PMC free article] [PubMed] [Google Scholar]
- 10.Isles AR, et al. Parental origin of interstitial duplications at 15q11.2-q13.3 in Schizophrenia and Neurodevelopmental disorders. PLoS Genet. 2016;12:e1005993. 10.1371/journal.pgen.1005993. [DOI] [PMC free article] [PubMed] [Google Scholar]
- 11.Albrecht U, et al. Imprinted expression of the murine Angelman syndrome gene, Ube3a, in hippocampal and Purkinje neurons. Nat Genet. 1997;17:75–8. 10.1038/ng0997-75. [DOI] [PubMed] [Google Scholar]
- 12.Yamasaki K, et al. Neurons but not glial cells show reciprocal imprinting of sense and antisense transcripts of Ube3a. Hum Mol Genet. 2003;12:837–47. 10.1093/hmg/ddg106. [DOI] [PubMed] [Google Scholar]
- 13.Landers M, et al. Regulation of the large (approximately 1000 kb) imprinted murine Ube3a antisense transcript by alternative exons upstream of Snurf/Snrpn. Nucleic Acids Res. 2004;32:3480–92. 10.1093/nar/gkh670. [DOI] [PMC free article] [PubMed] [Google Scholar]
- 14.Judson MC, Sosa-Pagan JO, Cid D, Han WA, J. E., Philpot BD. Allelic specificity of Ube3a expression in the mouse brain during postnatal development. J Comp Neurol. 2014;522:1874–96. 10.1002/cne.23507. [DOI] [PMC free article] [PubMed] [Google Scholar]
- 15.Harting I, et al. Abnormal myelination in Angelman syndrome. Eur J Paediatr Neurol. 2009;13:271–6. 10.1016/j.ejpn.2008.04.005. [DOI] [PubMed] [Google Scholar]
- 16.Castro-Gago M, Gomez-Lado C, Eiris-Punal J, Rodriguez-Mugico VM. Abnormal myelination in Angelman syndrome. Eur J Paediatr Neurol. 2010;14:292. 10.1016/j.ejpn.2009.07.007. [DOI] [PubMed] [Google Scholar]
- 17.Peters SU, et al. Alterations in white matter pathways in Angelman syndrome. Dev Med Child Neurol. 2011;53:361–7. 10.1111/j.1469-8749.2010.03838.x. [DOI] [PMC free article] [PubMed] [Google Scholar]
- 18.Wilson BJ, et al. Abnormal language pathway in children with Angelman syndrome. Pediatr Neurol. 2011;44:350–6. 10.1016/j.pediatrneurol.2010.12.002. [DOI] [PMC free article] [PubMed] [Google Scholar]
- 19.Yoon HM, et al. Disrupted functional and structural connectivity in Angelman Syndrome. AJNR Am J Neuroradiol. 2020;41:889–97. 10.3174/ajnr.A6531. [DOI] [PMC free article] [PubMed] [Google Scholar]
- 20.Peters SU, Horowitz L, Barbieri-Welge R, Taylor JL, Hundley RJ. Longitudinal follow-up of autism spectrum features and sensory behaviors in Angelman syndrome by deletion class. J Child Psychol Psychiatry. 2012;53:152–9. 10.1111/j.1469-7610.2011.02455.x. [DOI] [PubMed] [Google Scholar]
- 21.Judson MC, et al. Decreased Axon Caliber underlies loss of Fiber Tract Integrity, Disproportional reductions in White Matter volume, and Microcephaly in Angelman Syndrome Model mice. J Neurosci. 2017;37:7347–61. 10.1523/JNEUROSCI.0037-17.2017. [DOI] [PMC free article] [PubMed] [Google Scholar]
- 22.Lebel C, Deoni S. The development of brain white matter microstructure. NeuroImage. 2018;182:207–18. 10.1016/j.neuroimage.2017.12.097. [DOI] [PMC free article] [PubMed] [Google Scholar]
- 23.Sled JG, Zijdenbos AP, Evans AC. A nonparametric method for automatic correction of intensity nonuniformity in MRI data. IEEE Trans Med Imaging. 1998;17:87–97. 10.1109/42.668698. [DOI] [PubMed] [Google Scholar]
- 24.Collins DL, Neelin P, Peters TM, Evans AC. Automatic 3D intersubject registration of MR volumetric data in standardized Talairach space. J Comput Assist Tomogr. 1994;18:192–205. [PubMed] [Google Scholar]
- 25.Smith SM. Fast robust automated brain extraction. Hum Brain Mapp. 2002;17:143–55. 10.1002/hbm.10062. [DOI] [PMC free article] [PubMed] [Google Scholar]
- 26.Shen MD, et al. Subcortical Brain Development in Autism and Fragile X Syndrome: evidence for dynamic, age- and disorder-specific trajectories in Infancy. Am J Psychiatry. 2022;179:562–72. 10.1176/appi.ajp.21090896. [DOI] [PMC free article] [PubMed] [Google Scholar]
- 27.Jiang YH, et al. Mutation of the Angelman ubiquitin ligase in mice causes increased cytoplasmic p53 and deficits of contextual learning and long-term potentiation. Neuron. 1998;21:799–811. 10.1016/s0896-6273(00)80596-6. [DOI] [PubMed] [Google Scholar]
- 28.Mulherkar SA, Jana NR. Loss of dopaminergic neurons and resulting behavioural deficits in mouse model of Angelman syndrome. Neurobiol Dis. 2010;40:586–92. 10.1016/j.nbd.2010.08.002. [DOI] [PubMed] [Google Scholar]
- 29.Andersson JLR, Sotiropoulos S. N. An integrated approach to correction for off-resonance effects and subject movement in diffusion MR imaging. NeuroImage. 2016;125:1063–78. 10.1016/j.neuroimage.2015.10.019. [DOI] [PMC free article] [PubMed] [Google Scholar]
- 30.Yeh FC, Verstynen TD, Wang Y, Fernandez-Miranda JC, Tseng WY. Deterministic diffusion fiber tracking improved by quantitative anisotropy. PLoS ONE. 2013;8:e80713. 10.1371/journal.pone.0080713. [DOI] [PMC free article] [PubMed] [Google Scholar]
- 31.Kronman FN, et al. Developmental mouse brain common coordinate framework. Nat Commun. 2024;15:9072. 10.1038/s41467-024-53254-w. [DOI] [PMC free article] [PubMed] [Google Scholar]
- 32.Mori S, et al. Diffusion tensor imaging of the developing mouse brain. Magn Reson Med. 2001;46:18–23. 10.1002/mrm.1155. [DOI] [PubMed] [Google Scholar]
- 33.Wu D, et al. In vivo high-resolution diffusion tensor imaging of the mouse brain. NeuroImage. 2013;83:18–26. 10.1016/j.neuroimage.2013.06.012. [DOI] [PMC free article] [PubMed] [Google Scholar]
- 34.Burette AC, et al. Subcellular organization of UBE3A in human cerebral cortex. Mol Autism. 2018;9:54. 10.1186/s13229-018-0238-0. [DOI] [PMC free article] [PubMed] [Google Scholar]
- 35.Sen D, Drobna Z, Keung AJ. Evaluation of UBE3A antibodies in mice and human cerebral organoids. Sci Rep. 2021;11:6323. 10.1038/s41598-021-85923-x. [DOI] [PMC free article] [PubMed] [Google Scholar]
- 36.Knott G, Rosset S, Cantoni M. Focussed ion beam milling and scanning electron microscopy of brain tissue. J Vis Exp. 2011;e2588. 10.3791/2588. [DOI] [PMC free article] [PubMed]
- 37.Knott G, Marchman H, Wall D, Lich B. Serial section scanning electron microscopy of adult brain tissue using focused ion beam milling. J Neurosci. 2008;28:2959–64. 10.1523/JNEUROSCI.3189-07.2008. [DOI] [PMC free article] [PubMed] [Google Scholar]
- 38.Mastronarde DN. Automated electron microscope tomography using robust prediction of specimen movements. J Struct Biol. 2005;152:36–51. 10.1016/j.jsb.2005.07.007. [DOI] [PubMed] [Google Scholar]
- 39.Resch GP. Software for automated acquisition of electron tomography tilt series. Methods Cell Biol. 2019;152:135–78. 10.1016/bs.mcb.2019.05.002. [DOI] [PubMed] [Google Scholar]
- 40.Schneider CA, Rasband WS, Eliceiri KW. NIH Image to ImageJ: 25 years of image analysis. Nat Methods. 2012;9:671–5. 10.1038/nmeth.2089. [DOI] [PMC free article] [PubMed] [Google Scholar]
- 41.Schindelin J, et al. Fiji: an open-source platform for biological-image analysis. Nat Methods. 2012;9:676–82. 10.1038/nmeth.2019. [DOI] [PMC free article] [PubMed] [Google Scholar]
- 42.Semple BD, Blomgren K, Gimlin K, Ferriero DM, Noble-Haeusslein LJ. Brain development in rodents and humans: identifying benchmarks of maturation and vulnerability to injury across species. Prog Neurobiol. 2013;106–107:1–16. 10.1016/j.pneurobio.2013.04.001. [DOI] [PMC free article] [PubMed] [Google Scholar]
- 43.Harauz G, Boggs JM. Myelin management by the 18.5-kDa and 21.5-kDa classic myelin basic protein isoforms. J Neurochem. 2013;125:334–61. 10.1111/jnc.12195. [DOI] [PMC free article] [PubMed] [Google Scholar]
- 44.Smith GS, et al. Nucleus-localized 21.5-kDa myelin basic protein promotes oligodendrocyte proliferation and enhances neurite outgrowth in coculture, unlike the plasma membrane-associated 18.5-kDa isoform. J Neurosci Res. 2013;91:349–62. 10.1002/jnr.23166. [DOI] [PMC free article] [PubMed] [Google Scholar]
- 45.Smith GS, Seymour LV, Boggs JM, Harauz G. The 21.5-kDa isoform of myelin basic protein has a non-traditional PY-nuclear-localization signal. Biochem Biophys Res Commun. 2012;422:670–5. 10.1016/j.bbrc.2012.05.051. [DOI] [PMC free article] [PubMed] [Google Scholar]
- 46.Ozgen H, et al. Regulation of cell proliferation by nucleocytoplasmic dynamics of postnatal and embryonic exon-II-containing MBP isoforms. Biochim Biophys Acta. 2014;1843:517–30. 10.1016/j.bbamcr.2013.11.026. [DOI] [PubMed] [Google Scholar]
- 47.Montani C, et al. Sex-biasing influence of autism-associated Ube3a gene overdosage at connectomic, behavioral, and transcriptomic levels. Sci Adv. 2024;10:eadg1421. 10.1126/sciadv.adg1421. [DOI] [PMC free article] [PubMed] [Google Scholar]
- 48.Cosgrove JA, Kelly LK, Kiffmeyer EA, Kloth AD. Sex-dependent influence of postweaning environmental enrichment in Angelman syndrome model mice. Brain Behav. 2022;12:e2468. 10.1002/brb3.2468. [DOI] [PMC free article] [PubMed] [Google Scholar]
- 49.Koyavski L, et al. Sex-dependent sensory phenotypes and related transcriptomic expression profiles are differentially affected by Angelman Syndrome. Mol Neurobiol. 2019;56:5998–6016. 10.1007/s12035-019-1503-8. [DOI] [PubMed] [Google Scholar]
- 50.Girault JB, et al. White matter microstructural development and cognitive ability in the first 2 years of life. Hum Brain Mapp. 2019;40:1195–210. 10.1002/hbm.24439. [DOI] [PMC free article] [PubMed] [Google Scholar]
- 51.Sket GM, et al. Neonatal White Matter Maturation is Associated with Infant Language Development. Front Hum Neurosci. 2019;13:434. 10.3389/fnhum.2019.00434. [DOI] [PMC free article] [PubMed] [Google Scholar]
- 52.Swanson MR, et al. Splenium development and early spoken language in human infants. Dev Sci. 2017;20. 10.1111/desc.12360. [DOI] [PMC free article] [PubMed]
- 53.Short SJ, et al. Associations between white matter microstructure and infants’ working memory. NeuroImage. 2013;64:156–66. 10.1016/j.neuroimage.2012.09.021. [DOI] [PMC free article] [PubMed] [Google Scholar]
- 54.O’Muircheartaigh J, et al. White matter development and early cognition in babies and toddlers. Hum Brain Mapp. 2014;35:4475–87. 10.1002/hbm.22488. [DOI] [PMC free article] [PubMed] [Google Scholar]
- 55.Swanson MR, et al. Development of White Matter Circuitry in infants with Fragile X Syndrome. JAMA Psychiatry. 2018;75:505–13. 10.1001/jamapsychiatry.2018.0180. [DOI] [PMC free article] [PubMed] [Google Scholar]
- 56.Dennis EL, Thompson PM. Typical and atypical brain development: a review of neuroimaging studies. Dialogues Clin Neurosci. 2013;15:359–84. 10.31887/DCNS.2013.15.3/edennis. [DOI] [PMC free article] [PubMed] [Google Scholar]
- 57.Huber E, Corrigan NM, Yarnykh VL, Ramirez F, N., Kuhl PK. Language Experience during Infancy predicts White Matter Myelination at Age 2 years. J Neurosci. 2023;43:1590–9. 10.1523/JNEUROSCI.1043-22.2023. [DOI] [PMC free article] [PubMed] [Google Scholar]
- 58.Markati T, Duis J, Servais L. Therapies in preclinical and clinical development for Angelman syndrome. Expert Opin Investig Drugs. 2021;30:709–20. 10.1080/13543784.2021.1939674. [DOI] [PubMed] [Google Scholar]
- 59.Klingseisen A, Lyons DA. Axonal regulation of Central Nervous System Myelination: structure and function. Neuroscientist. 2018;24:7–21. 10.1177/1073858417703030. [DOI] [PubMed] [Google Scholar]
- 60.Osso LA, Chan JR. Architecting the myelin landscape. Curr Opin Neurobiol. 2017;47:1–7. 10.1016/j.conb.2017.06.005. [DOI] [PMC free article] [PubMed] [Google Scholar]
- 61.Fruttiger M, et al. Defective oligodendrocyte development and severe hypomyelination in PDGF-A knockout mice. Development. 1999;126:457–67. 10.1242/dev.126.3.457. [DOI] [PubMed] [Google Scholar]
- 62.Xiao J, et al. Brain-derived neurotrophic factor promotes central nervous system myelination via a direct effect upon oligodendrocytes. Neurosignals. 2010;18:186–202. 10.1159/000323170. [DOI] [PubMed] [Google Scholar]
- 63.Stevens B, Porta S, Haak LL, Gallo V, Fields RD. Adenosine: a neuron-glial transmitter promoting myelination in the CNS in response to action potentials. Neuron. 2002;36:855–68. 10.1016/s0896-6273(02)01067-x. [DOI] [PMC free article] [PubMed] [Google Scholar]
- 64.Kukley M, Capetillo-Zarate E, Dietrich D. Vesicular glutamate release from axons in white matter. Nat Neurosci. 2007;10:311–20. 10.1038/nn1850. [DOI] [PubMed] [Google Scholar]
- 65.Wake H, Lee PR, Fields RD. Control of local protein synthesis and initial events in myelination by action potentials. Science. 2011;333:1647–51. 10.1126/science.1206998. [DOI] [PMC free article] [PubMed] [Google Scholar]
- 66.Bergles DE, Roberts JD, Somogyi P, Jahr CE. Glutamatergic synapses on oligodendrocyte precursor cells in the hippocampus. Nature. 2000;405:187–91. 10.1038/35012083. [DOI] [PubMed] [Google Scholar]
- 67.Fields RD. White matter in learning, cognition and psychiatric disorders. Trends Neurosci. 2008;31:361–70. 10.1016/j.tins.2008.04.001. [DOI] [PMC free article] [PubMed] [Google Scholar]
- 68.Wei L, et al. Disrupted Topological Organization of White Matter Network in Angelman Syndrome. J Magn Reson Imaging. 2023;57:1212–21. 10.1002/jmri.28360. [DOI] [PubMed] [Google Scholar]
Associated Data
This section collects any data citations, data availability statements, or supplementary materials included in this article.
Supplementary Materials
Data Availability Statement
The authors will make the raw data supporting this article’s conclusions available upon request.


