Abstract
Background
Somatic cell mutants can be informative in the analysis of a wide variety of cellular processes. The use of map-based positional cloning strategies in somatic cell hybrids to analyze genes responsible for recessive mutant phenotypes is often tedious, however, and remains a major obstacle in somatic cell genetics. To fulfill the need for more efficient gene mapping in somatic cell mutants, we have developed a new DNA microarray comparative genomic hybridization (array-CGH) method that can rapidly and efficiently map the physical location of genes complementing somatic cell mutants to a small candidate genomic region. Here we report experiments that establish the validity and efficacy of the methodology.
Results
CHO cells deficient for hypoxanthine:guanine phosphoribosyl transferase (HPRT) were fused with irradiated normal human fibroblasts and subjected to HAT selection. Cy5-labeled genomic DNA from the surviving hybrids containing the HPRT gene was mixed with Cy3-labeled genomic DNA from normal CHO cells and hybridized to a microarray containing 40,185 cDNAs, representing 29,399 genes (UniGene clusters). The DNA spots with the highest Cy5:Cy3 fluorescence ratios corresponded to a group of genes mapping within a 1 Mb interval centered near position 142.7 Mb on the X chromosome, the genomic location of HPRT.
Conclusion
The results indicate that our physical mapping method based on radiation hybrids and array-CGH should significantly enhance the speed and efficiency of positional cloning in somatic cell genetics.
Background
Systematic forward genetics using somatic cell mutants is a powerful tool in elucidating biochemical pathways [1]. However, it is often difficult to identify the genetic loci responsible for a particular somatic cell mutant phenotype. Map-based positional cloning strategies can be used in somatic cell hybrids to analyze mutants with recessive phenotypes. By tracking DNA sequence variants that co-segregate with heritable traits, the genes accounting for these traits can be localized to specific chromosomal locations [2]. Recent advances in genome sequencing have facilitated the assembly of physical maps of candidate regions, but fine mapping and narrowing of candidate regions is still often tedious and remains a major obstacle in somatic cell genetics. Consequently, there is a need to efficiently map the positions of genes in somatic cell mutants.
We previously established a method to enrich for human genes that complement rodent somatic cell mutants [3]. The mutant rodent cells are fused with wild-type human fibroblasts and the resulting hybrids are irradiated and selected for absence (that is, complementation) of the mutant phenotype. Retention of the complementing gene(s) during selection leads to enrichment, in the selected population of cells, of DNA copy number of the genomic region containing the complementing gene. Hybridization of genomic DNA from the selected hybrids to human metaphase chromosomes can be analyzed by fluorescence in situ hybridization (FISH), to locate the complementing genes by the elevated fluorescence ratios at the corresponding chromosomal loci. However, metaphase-CGH (a map of DNA copy number as a function of chromosomal location on metaphase spreads) requires specialized facilities, has a limited resolution and it is difficult to detect changes in small regions of the genome.
Recent developments in microarray technology have been applied in comparative genomic hybridization (array-CGH) by replacing metaphase chromosomes with arrayed DNAs such as bacterial artificial chromosomes (BACs), P1 artificial chromosomes and cDNAs representing specific genetic loci [4,5,6]. DNA microarrays have shown reliable quantitative capability in expression monitoring as well as greater sensitivity and resolution in array-CGH. We therefore defined and tested a radiation-hybrid method for mapping the complementing genes in somatic cell hybrids using high-density array-CGH. Using this method, we were able to map the human gene that complemented a recessive mutation in a CHO line to a region spanning less than 1 million bases (Mb) or 0.1% of the genome.
Results and discussion
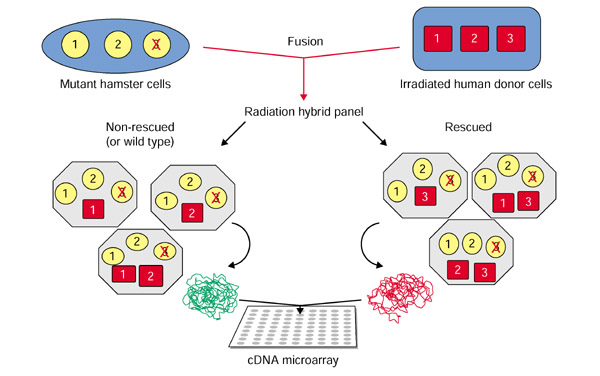
The method is outlined in Figure 1. Mutant cell lines with a phenotype of interest are fused to irradiated wild-type donor cells by somatic cell fusion to generate a pool of radiation hybrids. Each radiation hybrid cell contains a full complement of the mutant genome and random fragments of the donor genome. The hybrids are selected for reconstitution (complementation) of their wild-type phenotype. Hybrid cells that survive the selection should all retain the chromosome fragment that bears the complementing gene(s), presumably the wild-type counterpart of the mutant gene, provided by the donor genome (Figure 1). The genomic DNA from the rescued and the wild-type CHO populations are harvested and used as test and reference probes, respectively, in a comparative fluorescent hybridization to a DNA microarray. The DNA microarray contains human DNA sequences with known genomic positions. The preferential retention of the DNA fragments encompassing the gene of interest generates increased fluorescence ratios for the corresponding genes or expressed sequence tag (EST) elements on the array. The fluorescence ratios measured at each element are plotted along each chromosome on the basis of their positions in the genome. The position of the wild-type gene is thus revealed by the clustering of increased fluorescence ratios in the region encompassing the complementing gene.
Figure 1.

Schematic diagram of the radiation hybrid array-CGH methodology. Mutant rodent cells that have a recessive phenotype due to a mutation in a gene (gene 3, depicted as a red cross), are complemented by cell fusion with irradiated human donor cell lines. The resulting cells in the radiation-hybrid panel contain a full complement of the hamster genome as well as fragments of the human genome. Hybrids are complemented when they have retained the functional human chromosome fragment bearing the rescuing gene (in this case gene 3), resulting in restoration of the wild-type phenotype. Hybrids that were not complemented retain only random fragments of the donor genome (for example genes 1 and 2). The complemented and the non-complemented populations are separated by selection, resulting in enrichment of gene 3 in the complemented cells, which are used as the source of the test DNA probes (versus wild-type CHO DNA) on the array.
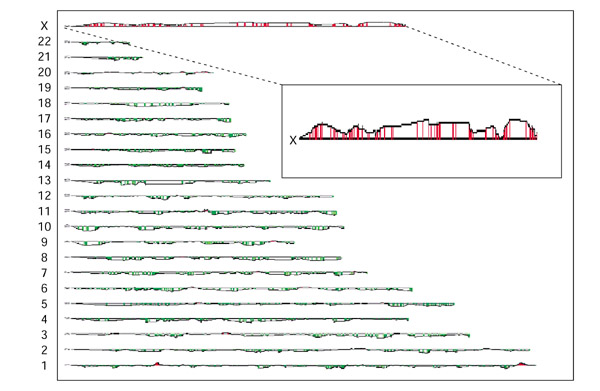
We first evaluated the feasibility of this methodology by analyzing a monochromosomal human-hamster hybrid cell line containing the human X chromosome. Test genomic DNA from the hybrid cell line and reference genomic DNA from CHO cells were labeled with Cy-5 (red) and Cy-3 (green) respectively, and the labeled DNAs were co-hybridized to a microarray comprising approximately 40,000 human cDNAs. Fluorescence ratios for the genes along the X chromosome were elevated (mean fluorescence ratio 1.9), reflecting DNA copy-number gain for X-chromosome-specific genes (Figure 2). No significant elevations were observed along the other chromosomes (mean fluorescence ratio 0.93), indicating no significant gain of DNA copy number elsewhere in the genome. Thus, the method identified the presence of the human X chromosome in a monochromosomal human-hamster hybrid cell line.
Figure 2.

Mapping of retained human genomic sequences in a rodent cell. As a proof of principle, test genomic DNA from a monochromosomal CHO-human hybrid cell line containing the human X chromosome was co-hybridized with reference genomic CHO cell DNA on the microarray. Regions of increased fluorescence ratios in the test DNA, relative to reference DNA, are indicated in red. The magnitude of the increase in fluorescence ratios between the test and reference samples is indicated by the height of the line (log10 scale) compared with the baseline, which represents equal DNA copy numbers and has a fluorescence ratio of 1. Fluorescence ratios are drawn as a moving average of five adjacent genes/ESTs along the chromosome. Note the marked increased fluorescence ratios along the X chromosome (inset, with an expanded vertical scale).
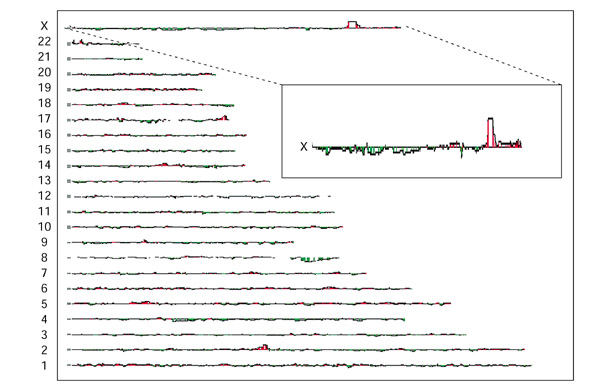
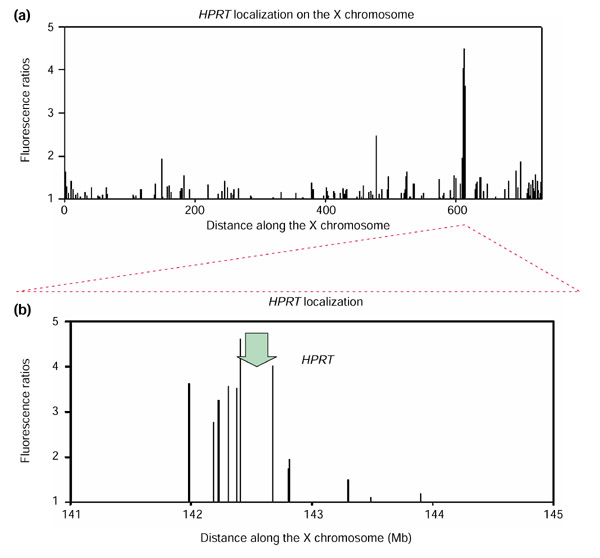
Next, we evaluated the sensitivity and resolution of the method by using a CHO cell line deficient in the gene for hypoxanthine:guanine phosphoribosyl transferase (HPRT). The HPRT gene was chosen because its map location on the long arm of the X chromosome at position 142.7 Mb was well established. Hybrid cells were derived by fusion between the HPRT-deficient hamster cell line and irradiated human donor fibroblasts, followed by selection for HPRT+ cells in hypoxanthine, aminopterin, thymidine (HAT) medium. Cy5-labeled genomic DNA from the human-hamster hybrids that survived in HAT medium was mixed with Cy3-labeled genomic DNA from normal CHO cells, then hybridized to the 40,000-element DNA micro-array. Cy5 and Cy3 fluorescence at each array element was measured using a fluorescent scanning microscope (Axon Instruments, Union City, CA). The distribution of fluorescence ratios for each array element was plotted as a 'moving-average' of five adjacent cDNAs along the chromosome. The result (Figure 3 and inset) revealed a sharp peak of fluorescence ratios at chromosome Xq26, the location of the HPRT gene. Moving-average fluorescence ratios at Xq26 reached a magnitude of 4, or 10 standard deviations (SD) above the mean. The highest fluorescence ratios for other regions, observed at loci on chromosomes 2q and 22q, reached a magnitude of approximately 3 (7.5 SD above mean). However, in a second hybridization using an independently selected pool of complemented cells, the observed fluorescence peaks on 2q and 22q were not observed, whereas that at Xq26 remained. In both hybridizations, the only region with fluorescence ratios greater than 3 SD above the mean in both experiments was Xq26, suggesting that this is a threshold for identification of specific enrichment. A detailed view (Figure 4a,4b) of Xq26 reveals a peak of fluorescence ratios spanning approximately 900,000 bases, and encompassing 17 arrayed cDNAs. The HPRT gene is located within this region of peak fluorescence ratios (Figure 4b, arrow), reflecting the enrichment of the functional HPRT gene and adjacent sequences. Thus, the method accurately mapped the HPRT gene within a 900,000 bp interval.
Figure 3.

Specificity of the array-CGH mapping method for mapping a complementing gene. Total genomic DNA of the complemented HPRT-deficient CHO-human radiation hybrid cells was co-hybridized with total genomic DNA from wild-type CHO cells on the microarray. The complemented hybrid cells contain the complete CHO genome and human chromosomal fragments. The human sequences are enriched in fragments bearing the complementing human HPRT gene. The magnitude of the increase in fluorescence ratio between the test and reference samples is indicated by the height of the red line (log10 scale) compared with the baseline, which has a fluorescence ratio of 1. Fluorescence ratios are drawn as a moving average of five adjacent genes/ESTs along the chromosome. Note that the region around the HPRT locus at Xq26 (inset) corresponds to a sharp maximum in the fluorescence ratio increase, indicating a corresponding gain in DNA copy number for genomic elements in that region. No such consistent copy-number gains were observed in other parts of the genome.
Figure 4.

Resolution of the array-CGH mapping method. (a) For the microarray comparison between the complemented HPRT-deficient CHO-human radiation hybrid cell DNA versus wild-type CHO DNA, fluorescence ratios are depicted for chromosomal region Xq24-Xqter. In this depiction, non-averaged fluorescence ratios are plotted; therefore, amplitudes reflect actual measured fluorescence ratios for each gene/EST (log10 scale). A sharp maximum of fluorescence ratios is observed in the region surrounding the HPRT locus on the human X chromosome, indicating the retention, and therefore the gain, of DNA copy number for genes in this region. The units for the distance along the X chromosome are units for radiation hybrid distances (cR3000) as defined in [5]. (b) Close-up depiction of the fluorescence ratio peak observed around the HPRT locus on the human X chromosome. The peak region covers approximately 900,000 base pairs. Gene/EST array elements around the HPRT locus (indicated by the green arrow) are located according to their genomic positions, and fluorescence ratios are depicted on a log10 scale.
We believe that the procedure we describe here can substantially increase the speed and efficiency of complementation cloning in somatic cell genetics. Approaches employing expression cloning using cDNA-based libraries have had success in identifying complementing genes [7,8]. The present method offers potential advantages over expression cloning. All human genes are represented in the donor-cell genome; consequently, limitations associated with quality and representation in cDNA libraries are overcome. Moreover, for mapping dominant mutations in human cells, the procedure obviates the requirement for a cDNA library from the cells of interest.
Materials and methods
Cell lines and mutant selection
Monochromosomal hybrid
Genomic DNA from a monochromosomal human-hamster hybrid containing the human X chromosome was obtained from NIGMS Human Genetic Mutant Cell repository (number GM0631).
Hprt mutants
CHO cell lines defective in the hprt gene were obtained as described [9]. Briefly, CHO cells were chemically mutagenized by the point mutagen EMS or the frameshift mutagen ICR-191. After initial mutagenesis, the cells were cultured in the presence of the toxic base analog 6-thioguanine (6-TG), which selects for those cells that lack HPRT and are therefore resistant to killing by 6-TG. Before cell-fusion experiments, Hprt mutants were cultured for several passages in 6-TG to ensure stability of the mutant phenotype.
Generation of radiation hybrids
Radiation hybrids were generated by polyethylene-glycol-mediated cell fusion between lethally gamma-irradiated (150 Gy) human male AG1522 fibroblasts and the CHO mutants. The hybrids were selected for the presence of the HPRT gene by culturing in the presence of HAT medium. The complemented hybrids were analyzed as the test population after three weeks of HAT selection.
Labelling and hybridizations
DNA from the test and reference populations was harvested using Qiagen Genomic Tips 500 according to the manufacturer's protocol. For each labeling, we DpnII-digested (New England Biolabs) genomic DNA (4 μg), which was then purified (Qiaquick PCR kit) and random-primer labeled using a Bioprime Labeling kit (Gibco BRL), modified to include in a 100 μl reaction, dATP, dGTP and dTTP (120 μM each), dCTP (60 μM) and Cy5-dCTP or Cy3-dCTP (60 μM). We purified labeled products using a Microcon 30 filter (Amicon) and Cy5- and Cy3-labeled probes were combined with 50 μg human Cot-1 DNA (BRL), 20 μg poly(dA)-poly(dT) (Sigma), and 100 μg yeast tRNA (Gibco BRL). A Microcon 30 filter (Amicon) concentrated the hybridization mixture, which was then adjusted to contain 3.4 × SSC and 0.3% SDS in a 40 μl final volume. Following denaturation (100°C, 2 min) and a 30 min Cot-1 pre-annealing step (37°C), the probe was hybridized to the array under a glass coverslip at 65°C for 16-20 h, which was then washed in 2× SSC, 0.03% SDS (65°C, 5 min), followed by 5 min each at room temperature in 1× SSC and 0.2× SSC. cDNA microarrays were fabricated as described [10]. In brief, we PCR-amplified IMAGE human cDNA (ESTs) clones in a 96-well format from DNA minipreps (Qiagen) using modified M13 universal primers. Most PCR products were 0.5-2 kb. The purified PCR products in 3× SSC were robotically arrayed (175 μm spacing between spots) onto polylysine-coated glass microscope slides. The cDNA microarrays described here contained 40,185 different sequence-validated human cDNAs, representing 29,399 different human UniGene clusters, of which 13,267 were named genes and the remaining 16,132 were ESTs.
Imaging and data analysis
Hybridized arrays were imaged using a GenePix scanner (Axon Instruments). Fluorescence ratios were calculated after background subtraction (background calculated as the median fluorescence signal of non-target pixels) using the GenePix software package. To correct for differences in DNA-labeling efficiency between samples, fluorescence ratios were normalized across each array to achieve an average log ratio of 0 (average ratio of 1; that is, no DNA copy-number change) for all cDNA elements on the array. Poorly quantified data (fluorescence signal < 40% above background for the wild-type CHO genomic DNA sample) were excluded from analysis (approximately 10-20% of array spots). Mean fluorescence ratios were calculated in log space to weight DNA gains (fluorescence ratios > 1) and losses (fluorescence ratios < 1) equally. When indicated, data are expressed as a 'moving average' of fluorescence ratios, calculated for sets of five adjacent genes along the chromosome. A moving-average ratio serves to average across multiple elements any imprecision in measurement, along with inaccuracies due to mapping misassignments. Genomic map positions of the arrayed cDNAs were determined using the 'Golden Path' assembly of the human genome draft sequences [11]. We were able to assign genomic map positions for approximately 85% of all arrayed genes/ESTs. Fluorescence ratios were visualized by chromosomal nucleotide position using the CaryoScope website ([12] and C.A.R., unpublished data).
References
- Stark GR, Gudkov AV. Forward genetics in mammalian cells: functional approaches to gene discovery. Hum Mol Genet. 1999;8:1925–1938. doi: 10.1093/hmg/8.10.1925. [DOI] [PubMed] [Google Scholar]
- List of genes cloned by positional cloning http://genome.nhgri.nih.gov/clone
- Lin JY, Bedford JS. Regional gene mapping using mixed radiation hybrids and reverse chromosome painting. Radiat Res. 1997;148:405–412. [PubMed] [Google Scholar]
- Pinkel D, Segraves R, Sudar D, Clark S, Poole I, Kowbel D, Collins C, Kuo WL, Chen C, Zhai Y, et al. High resolution analysis of DNA copy number variation using comparative genomic hybridization to microarrays. Nat Genet. 1998;20:207–211. doi: 10.1038/2524. [DOI] [PubMed] [Google Scholar]
- Pollack JR, Perou CM, Alizadeh AA, Eisen MB, Pergamenschikov A, Williams CF, Jeffrey SS, Botstein D, Brown PO. Genome-wide analysis of DNA copy-number changes using cDNA microarrays. Nat Genet. 1999;23:41–46. doi: 10.1038/12640. [DOI] [PubMed] [Google Scholar]
- Geschwind DH, Gregg J, Boone K, Karrim J, Pawlikowska-Haddal A, Rao E, Ellison J, Ciccodicola A, D'Urso M, Woods R, et al. Klinefelter's syndrome as a model of anomalous cerebral laterality: testing gene dosage in the X chromosome pseudoautosomal region using a DNA microarray. Dev Genet. 1998;23:215–229. doi: 10.1002/(SICI)1520-6408(1998)23:3<215::AID-DVG7>3.0.CO;2-X. [DOI] [PubMed] [Google Scholar]
- Fenczik CA, Sethi T, Ramos JW, Hughes PE, Ginsberg MH. Complementation of dominant suppression implicates CD98 in integrin activation. Nature. 1997;390:81–85. doi: 10.1038/36349. [DOI] [PubMed] [Google Scholar]
- Ramos JW, Kojima TK, Hughes PE, Fenczik CA, Ginsberg MH. The death effector domain of PEA-15 is involved in its regulation of integrin activation. J Biol Chem. 1998;273:33897–33900. doi: 10.1074/jbc.273.51.33897. [DOI] [PubMed] [Google Scholar]
- Stark GR. Genetic analysis of interferon and other mammalian signaling pathways. Harvey Lectures. 93:1–16. 1997-98. [PubMed] [Google Scholar]
- Perou CM, Sorlie T, Eisen MB, van de Rijn M, Jeffrey SS, Rees CA, Pollack JR, Ross DT, Johnsen H, Akslen LA, et al. Molecular portraits of human breast tumours. Nature. 2000;406:747–752. doi: 10.1038/35021093. [DOI] [PubMed] [Google Scholar]
- UCSC Human Genome Project working draft http://genome.ucsc.edu
- Christian A Rees homepage http://genome-www.stanford.edu/~rees/


