
FIGURE 5.
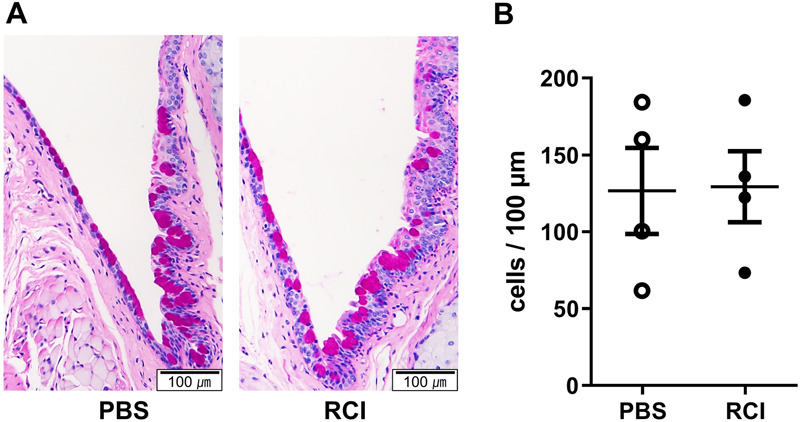
PAS histology and conjunctival goblet cell density analysis between RCI001 and PBS in the primary Sjögren syndrome model. A, Representative images of PAS staining (×100). B, Goblet cell counts revealed no significant change in the primary Sjögren syndrome model. Data are expressed as mean ± standard error of the mean. *P < 0.05, **P < 0.01, and ***P < 0.001.