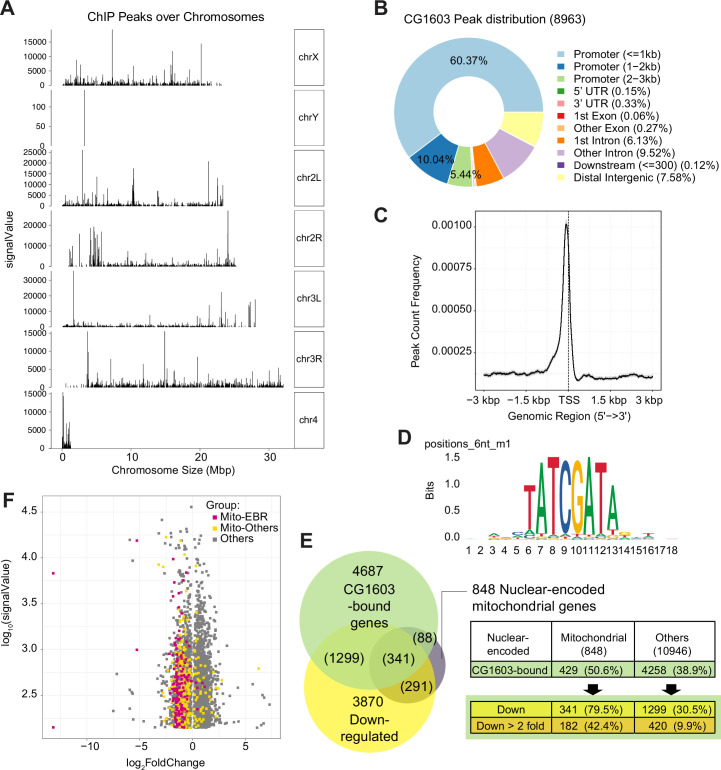
Figure 7. ChIP analysis identified nuclear mitochondrial genes that may be directly regulated by CG1603.
(A) CG1603 ChIP peaks over all chromosomes. (B) Genomic distribution of CG1603 peaks. (C) Average profile of CG1603 peaks binding to transcription start site (TSS) regions. (D) Representative binding motif discovered with CG1603 ChIP peaks. (E) The number of nuclear-encoded mitochondrial and non-mitochondrial genes bound by CG1603, and the overlapping down-regulated differentially expressed genes (DEGs) in each group. (F) Scatterplot illustrating the signalValue of CG1603 ChIP peaks (y-axis) and log2 fold change in expression of DEGs between CG1603PBac mutant and control (x-axis). Mito-EBR: genes related to electron transport chain (ETC) biogenesis and maintenance, including ETC subunits and assembly factors, mitochondrial DNA (mtDNA) replication and transcription, mitochondrial RNA metabolism and translation, as well as mitochondrial protein import and membrane insertion machinery.

