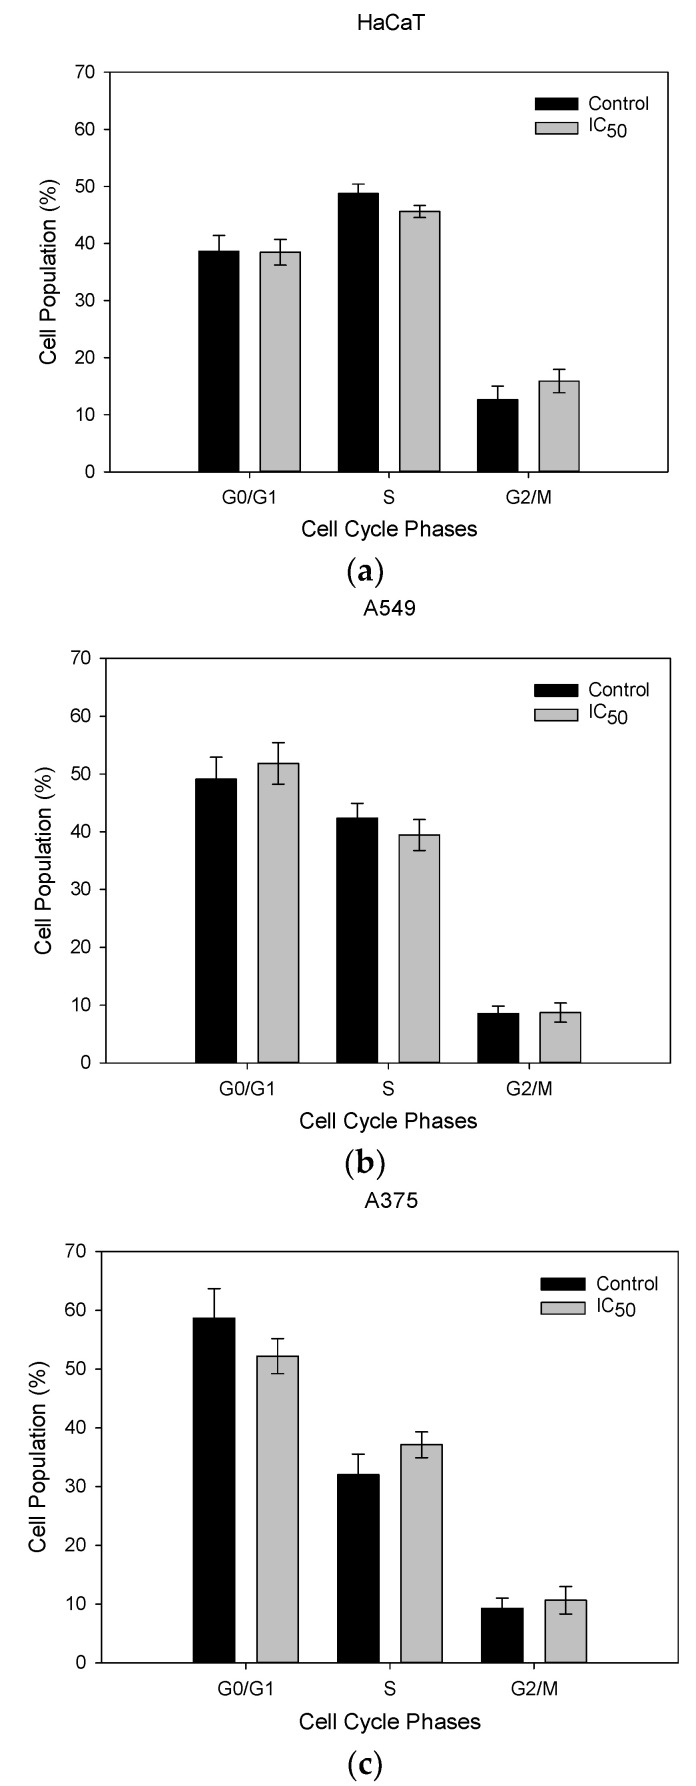
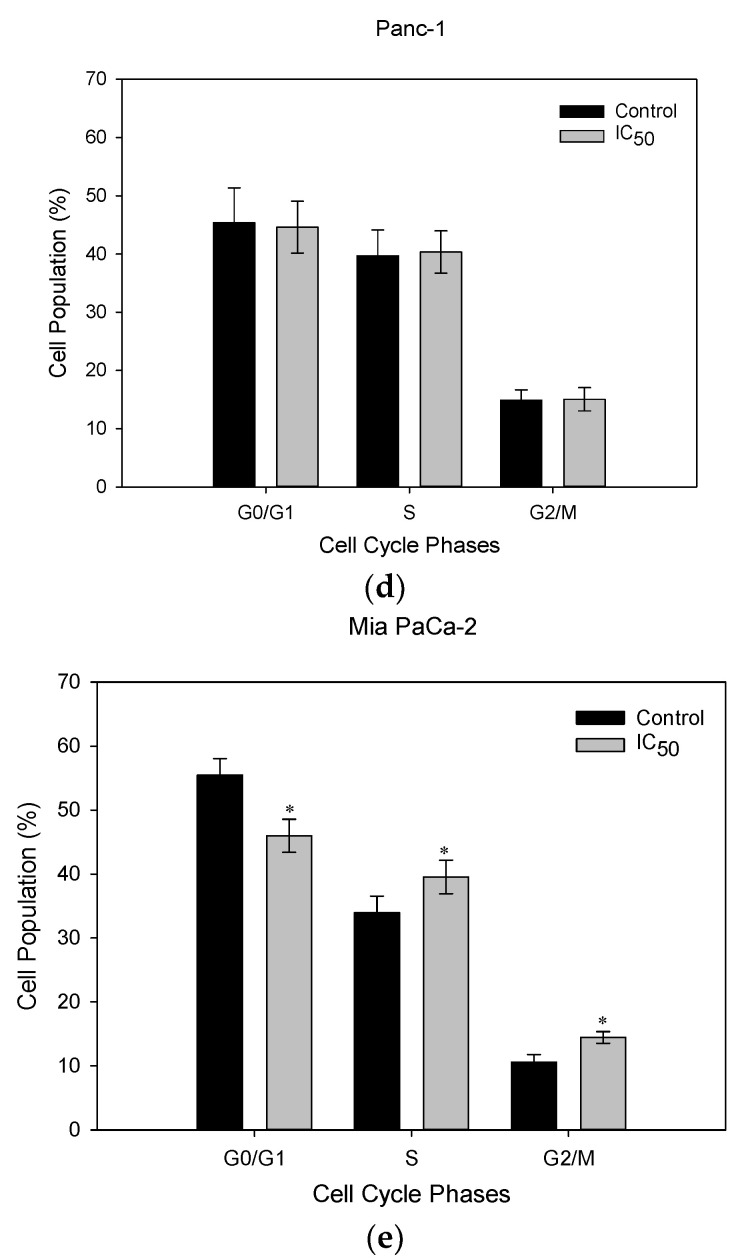
Figure 4.
Cell cycle analysis of cells exposed to the respective IC50 of trans-tiliroside for 72 h. Data shown are the mean values ± standard deviation of two independent experiments, with two technical replicates each, and each replicate with at least 5000 events. * Indicates statistical significance relative to the control (p < 0.05).


