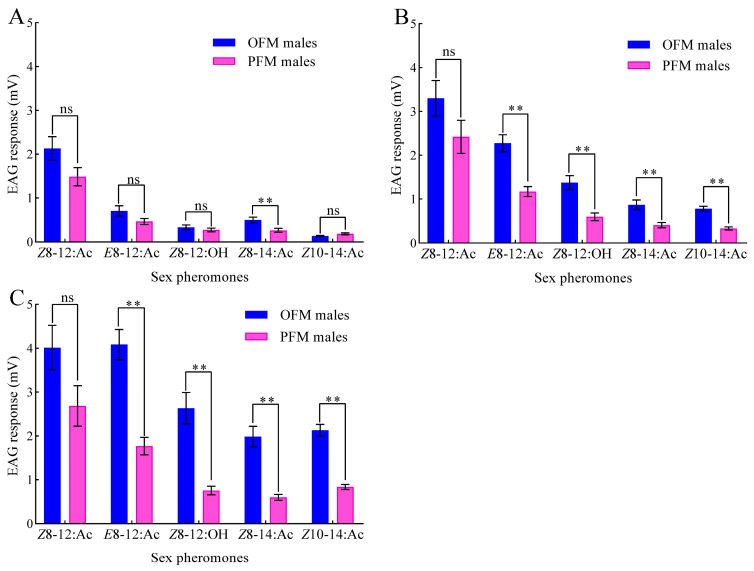
Figure 1.
EAG dose–response of OFM and PFM males to different sex pheromone components: (A) 20 ng; (B) 200 ng; (C) 2000 ng. Data are presented as mean ± SEM (n = 10). Double asterisks and “ns” indicate extremely significant differences (p < 0.01) and no significant differences (p > 0.05), respectively, in the EAG response values between OFM and PFM males to the same sex pheromone (independent sample t-test).

