Abstract
The transit signal priority, as an effective method to address public transport operation issues, has been widely applied. With the continuous advancement of connected technology, research on developing transit signal priority strategies using vehicle-to-everything technology is gaining increasing attention. However, current traffic signal priority studies primarily focus on optimizing bus speeds on dedicated bus lanes, neglecting the adverse impacts of private vehicle queuing on priority strategies, as well as the carbon emissions resulting from speed fluctuations. To more effectively evaluate the optimization effect of bus priority in the absence of dedicated bus lanes, this paper proposes a cooperative control method combining signal control and eco-driving speed guidance in a connected environment. The objective is to maximize the reduction in delays for both buses and private vehicles at intersections and optimize carbon emission reduction. Initially, an Extended Kalman Filter is employed to predict the arrival time of buses at intersections and the signal status. Building upon this, optimal timings for phase adjustments and the optimization bus trajectories are calculated using signal control and eco-driving speed guidance models. Then a Genetic Algorithm is used to solve the model. Finally, the effectiveness of the proposed model is verified using Zhengzhou city as a case study and compared against scenarios involving NTSP, TSP, and speed guidance. The results demonstrate that, in the absence of dedicated bus lanes, the proposed method not only ensures the stability of bus operations but also achieves significant bus priority and carbon emission benefits while mitigating the adverse impact of bus priority on private vehicles to a certain extent.
Keywords: Connected environment, Transit signal priority, Eco-driving speed guidance, Without dedicated bus lanes
Subject terms: Civil engineering, Environmental impact
Introduction
With the growing economy in China, the number of vehicles has significantly increased, presenting substantial challenges to urban transportation. This surge has inevitably resulted in traffic congestion, as well as increased energy consumption and carbon emissions. Consequently, there is an urgent need to develop efficient transportation systems that enhance mobility within urban areas. Public transportation (PT) offers several advantages, including high capacity, extensive coverage, and affordable fares. Thus, promoting PT usage has become a critical approach to mitigating traffic congestion. However, inherent limitations exist within the current PT system, such as irregular operational schedules and extended waiting times for passengers at stops. As a result, the implementation of transit signal priority (TSP) and dedicated bus lanes has become a vital strategy for improving operational efficiency and reducing carbon emissions.
The adjustment of signal timings through TSP has been demonstrated as an effective strategy for reducing bus delays at signalized intersections1. This approach has gained extensive adoption to enhance the efficiency and reliability of public transportation systems2. The control strategies within TSP primarily include passive priority, active priority, and real-time priority strategies. The passive priority strategy relies on predefined signal timing plans based on historical traffic flow data or bus departure schedules3. However, this approach lacks the flexibility needed to adapt to dynamic traffic conditions. In contrast, the active priority strategy effectively addresses these limitations. Typically, detectors are placed upstream of intersections in active priority systems, which activate the TSP strategy as buses approach. Active priority strategies include green extension, red truncation, phase insertion, phase skipping, and green phase reassignment4–6. However, it is important to note that active priority may result in significant negative impacts on other vehicles. Real-time priority, on the other hand, seeks to balance the operational benefits for both buses and private vehicles. Recent advancements in TSP have been further driven by the emergence of vehicle-to-everything (V2X) technology. This technology enables real-time bidirectional information exchange between vehicles and traffic controllers, allowing buses to access current traffic data7. This data includes information about preceding vehicle movements, intersection signal timings, infrastructure status, and more. Such advancements provide a diverse array of strategies to fulfill the demand for bus priority, thereby establishing a foundation for the development of various Cooperative Adaptive Cruise Control (CACC) models8.
The operational efficiency and reliability of PT can be significantly enhanced through the implementation of dedicated bus lanes on roadways9,10. However, the increasing number of vehicles has intensified urban traffic congestion, presenting challenges for the establishment of dedicated bus lanes in central urban areas. A common issue in small and medium-sized cities in China is the relatively low proportion of dedicated bus lanes. In many cases, buses share lanes with private vehicles, resulting in frequent overtaking, lane changes, queuing, and other behaviours that lead to variable speeds rather than consistency. Consequently, the presence of private vehicles adversely affects buses, undermining the effectiveness of pre-established TSP strategies in providing meaningful benefits to the bus service.
Unlike TSP, the speed control strategy optimizes driving speeds to enable transit vehicles to align with the signal timing phases at downstream intersections, minimally impacting private vehicles11. Therefore, speed control is employed as a priority in the cooperative control strategy to mitigate the negative effects on private vehicles associated with TSP. However, this optimization method may also induce energy-intensive behaviors, such as abrupt acceleration and deceleration by buses to comply with signal priorities, which can negatively affect vehicle safety, fuel consumption, and carbon emissions12. To address these issues, this paper proposes a cooperative control method that integrates signal control and eco-driving speed guidance in the absence of dedicated bus lanes within a connected environment. This approach aims to effectively reduce vehicle carbon emissions while alleviating delays experienced by buses.
Literature review
TSP is widely regarded as one of the most effective strategies for alleviating traffic congestion, garnering significant attention from researchers. Previous studies have primarily focused on optimizing total passenger delay, vehicle queue length, and intersection capacity as their key objectives. Various TSP methods have been proposed to alleviate bus delays, ultimately aiming to achieve bus priority at intersections13,14. For instance, Thodi et al.15 aimed to minimize total passenger delays within the control area of intersections by employing strategies such as green extension and red truncation, utilizing VISSIM for simulation analysis. Li et al.16 developed a bi-level programming model for the dynamic cycles and arrival rates of private vehicles, solving the model using a Genetic Algorithm (GA) while validating its effectiveness through simulations in SUMO. Ma et al.9 proposed a coordinated transit priority control optimization model between two successive bus stops with dedicated bus lanes. However, these studies achieve TSP solely through the adjustment of traffic signals.
In recent years, China has actively constructed dedicated bus lanes to reduce carbon emissions and achieve sustainable development goals, thereby encouraging green and low-carbon travel. This initiative has also created favourable conditions for bus speed guidance, leading many scholars to gradually integrate speed guidance methods into the realm of bus priority systems17,18. Zhang et al.19 designed an eco-driving control method for intersections involving station, establishing an acceleration/deceleration model that enables non-stop passage through intersections to derive the optimal eco-velocity curve20,21 for buses. Teng et al.12 proposed a multi-part cooperative control strategy that calculates optimal phase adjustment times and speed trajectory by employing both signal control and speed control models, validating their model’s effectiveness using SUMO. To explore optimization issues in mixed traffic scenarios, He et al.22 developed an optimal control model designed to recommend eco-driving suggestions to the mixed-traffic platoon.
Although various models have been proposed to achieve bus priority, the aforementioned studies have primarily developed bus priority methods within the context of dedicated bus lanes. These methods do not account for the impact of queued private vehicles in shared-lane situations on bus priority. Ignoring this queuing constraint may diminish the effectiveness of the proposed models. To address this issue, Li et al.23 developed a state space model for bus motion considering passenger demand uncertainties. Based on Lyapunov function analysis, a robust optimal bus control method utilizing state-feedback scheme was designed. Rao et al.24 proposed a TSP strategy that shares right-turn lanes, forecasting bus arrival time to assess the requirement for priority phases. They established a bus arrival time prediction model based on Kalman filtering (KF) using RFID and GPS data. However, these priority methods allow buses to only passively adapt to priority control schemes, leading to increased delays for non-priority phase vehicles.
With the establishment of China’s carbon peaking and carbon neutrality targets, some researchers have begun to incorporate vehicle fuel consumption, carbon emissions, and other indicators into vehicle prioritization control models. Guo et al.25 developed a multi-stage mixed integer optimization model aimed at minimizing the fuel consumption for freight vehicles, focusing on speed trajectories and signal timing. However, delays caused by vehicles in other phases were not considered.
The literature indicates that researchers have conducted extensive studies on bus priority. However, most of these investigations have focused on bus priority models established within the context of dedicated bus lanes, without considering the impact of queue lengths at intersections under mixed traffic conditions involving buses and private vehicles. Additionally, previous studies primarily optimized metrics such as bus delays, headways, and intersection capacity, while neglecting the additional carbon emissions generated during the optimization process. To address this gap, this study proposes a cooperative control method that combines signal control with eco-driving speed guidance in a connected environment, without relying on dedicated bus lanes. Delay and carbon emissions for both buses and private vehicles at intersections are integrated into the objective function. The method provides priority to buses from the perspectives of signal precedence and eco-driving speed guidance. This approach aims to enhance the operational efficiency and service quality of public transport, improve energy utilization, and ensure bus priority while minimizing the impact on private vehicles. Furthermore, it offers a novel low-carbon approach to bus signal control.
Objectives and contributions
This study proposes a bus priority strategy applicable in environments without dedicated bus lanes, aiming to reduce vehicle delays and carbon emissions. The strategy involves the cooperative control of intersection signals and bus speeds to achieve both bus priority and urban sustainability. The key contributions of this method are as follows:
(1) Expansion of Bus Priority Applications: Existing research has primarily focused on scenarios with dedicated bus lanes. This study applies bus signal priority schemes in environments without dedicated bus lanes, thereby extending the scope of bus priority research. The introduction of Extended Kalman Filtering (EKF) for real-time prediction of bus arrival times at intersections provides data support for subsequent priority implementations, facilitating the application and advancement of bus priority methods in complex traffic conditions.
(2) Innovative Integration of Bus Signal Priority and Eco-Driving: The proposed strategy organically integrates bus signal priority with eco-driving, systematically exploring the potential of this coordinated approach to reduce vehicle carbon emissions. This method introduces environmental performance metrics into bus priority research, broadening the traditional focus on delays and paving the way for new directions in sustainable bus priority research.
Model
Problem description
The utilization of the TSP concept has been advocated in academic research for many years. However, most existing TSP studies primarily focus on the implementation of dedicated bus lanes. Due to constraints imposed by road width, effective allocation of these lanes presents significant challenges. Consequently, private vehicles substantially impede the progress of buses, rendering pre-established TSP strategies inadequate in delivering meaningful benefits to bus operations. Notably, with advancements in connected vehicle technologies, the exchange of real-time information between vehicles and traffic controllers has become feasible. This development enables buses to access a wealth of real-time traffic data7, thereby creating favourable conditions for investigating signal priority strategies in the absence of dedicated bus lanes.
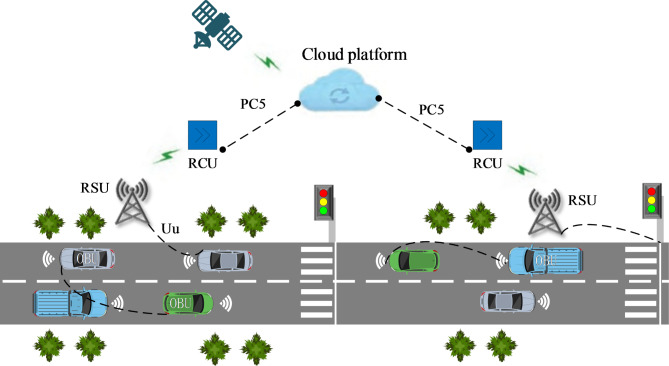
This paper focuses on an isolated intersection within a connected environment, as illustrated by the equipment deployment scheme in Fig. 1. Initially, from a macro perspective, Cellular Vehicle-to-Everything (C-V2X) encompasses the comprehensive connectivity among vehicles, cloud platforms, Vehicle-to-Vehicle (V2V), Vehicle-to-Infrastructure (V2I), and in-vehicle devices. Within the C-V2X framework, the PC5 interface is designated for near-field information exchange, while the Uu interface facilitates far-field information transmission. Furthermore, Roadside Units (RSUs) establish connections with roadside sensing devices (such as cameras, traffic signals, and vehicle On-Board Units (OBUs)) to process the collected data. The Roadside Control Unit (RCU) is responsible for disseminating information to endpoints and the V2X cloud platform. From a micro perspective, the connectivity in this study is achieved through the implementation of a Cooperative Adaptive Cruise Control (CACC) following model. In this process, real-time data, including vehicle position, speed, and carbon emissions, is shared with the simulation program. Simultaneously, infrastructure shares traffic information, such as vehicle queue lengths at intersections and real-time signal statuses, with connected vehicles. Ultimately, calculations are conducted in Python based on the proposed model, and the optimized results are communicated back to both the vehicles and the infrastructure.
Fig. 1.
Vehicle information architectural diagram16.
To address the limitation of traditional detectors, which are unable to rapidly calculate optimal strategies upon vehicle detection, leading to delays in bus response, a speed-guided priority method is proposed that does not require dedicated bus lanes. Utilizing the EKF26, this approach predicts the arrival time of buses at the entrance of the guidance zone. Concurrently, the method seeks to minimize the adverse effects of TSP on private vehicles, aiming to reduce the total delay at the intersection. The predicted arrival time is subsequently used to calculate the required speed for buses and to establish optimal signal timing that facilitates uninterrupted passage through the intersection.
Assumptions
To facilitate the examination of the problem, the following assumptions are made:
The speed of the bus can be adjusted freely within a predetermined range, and bus drivers are expected to adhere to the guidance speed.
All vehicles on the road, including buses and private vehicles, are equipped with CACC and are considered connected and automated vehicles (CAVs).
The length of the signal cycle is assumed to remain constant.
Bus stops are not considered in this analysis.
Conflicts
(5) arising from bus requests are not included.
-
(6)
Interference from pedestrians and non-motorized entities is disregarded.
Research method
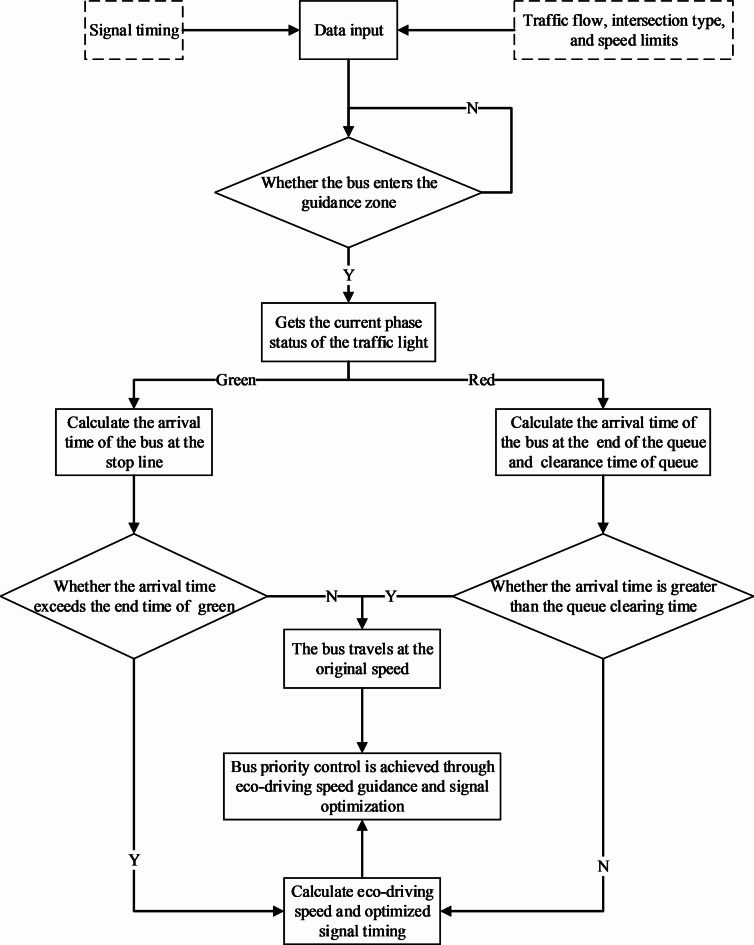
A TSP model at an isolated intersection is established in this paper, with the fundamental logic of the research method depicted in Fig. 2. When a bus enters the speed guidance zone, various bus priority control methods are implemented according to the current signal status of the priority phase at the intersection. If the priority phase is green, the time required for the vehicle to travel from the guidance zone to the stop line is calculated. If this time is less than the designated end time of the green phase, the bus maintains its speed; otherwise, the ecological guiding speed and optimized signal timing for the bus are determined. Conversely, when the priority phase is red, the time for the vehicle to reach the end of the queue and the clearance time for queued vehicles at the intersection is assessed. If the arrival time at the end of the queue exceeds the clearance time, the bus maintains its speed; if it is less, the ecological guiding speed and optimized signal timing are calculated.
Fig. 2.
Flowchart of research method.
Bus arrival time prediction model
The conventional Kalman Filter (KF) is typically regarded as a linear model, primarily because it relies on constant velocity or simple acceleration and deceleration to describe vehicle dynamics and observation equations. In the context of this study, which addresses scenarios where buses and private vehicles share the same lanes, it is crucial to account for the interactions between these vehicles, as well as factors such as road congestion and signal timing. These elements introduce nonlinearity into the dynamics and observation equations. To address this issue and achieve more accurate results, the EKF is employed for nonlinear state estimation of buses. This approach facilitates more precise estimation outcomes.
The EKF model proposed in this study is designed based on multiple intersections along a single bus route. Although the focus of this research is on an isolated intersection, the presence of speed guidance zones allows for an approximation of the predictive processes for two intersections, as illustrated in Fig. 3. The starting point of the speed guidance zone is assumed to be intersection
Fig. 3.
Illustration of EKF predictive model for bus arrival time.
This study focuses on an isolated intersection, where the bus begins its state prediction at the upstream intersection k. Using the bus’s speed at intersection
At the onset of the guidance zone, The EKF is utilized to forecast the arrival time for each bus. It is assumed that a specific bus route comprises
| 1 |
where
The travel time from
| 2 |
where
The
| 3 |
where
By simultaneously considering Eqs. 2 and 3 and simplifying, an equality relating to
| 4 |
where
The state equation of the EKF for the
| 5 |
| 6 |
where
During the prediction process described above, real-time data regarding bus speed, bus acceleration, traffic flow of private vehicles, speed of private vehicles, and signal statuses at intersections can be obtained. After collecting this relevant data, it is processed to estimate queue lengths at intersections, assess signal statuses, and estimate delays for buses. Subsequently, the processed information is integrated into the bus arrival time prediction model. In the EKF prediction model, to incorporate information from upstream intersections, the state vector
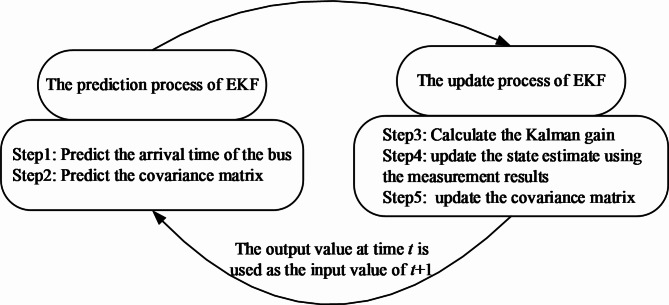
The update process, described by Eq. 4, involves the bus transitioning from one intersection to its downstream intersection. In this process, the prediction of the state variable is based on its current state. Additionally, Eq. 5 establishes a feedback mechanism that incorporates the newly measured travel time
Upon the arrival of the bus at the intersection
Fig. 4.
Step of estimating bus arrival times by EKF method.
An eco-driving strategy is employed for buses based on the estimated bus arrival time derived from the EKF. Real-time speed guidance is executed for the bus, considering the signal state upon entering the guidance zone and the prevailing road traffic conditions (e.g., queue length of private vehicles at the intersection). Equation 7 illustrates the two primary scenarios, which will be expounded upon in the subsequent sections for a more comprehensive analysis.
| 7 |
where
Bus eco-driving strategy
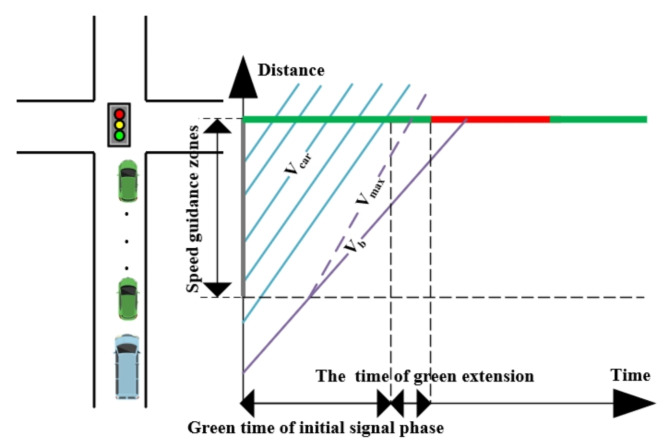
An integrated approach is employed to prioritize buses approaching the stop line at their initial speed when encountering a red signal phase. This paper presents four distinct scenarios for bus operations. In both scenario one and scenario two, when the bus enters the starting position of the speed guidance zone, the signal phase is green. In scenario one, the bus cannot traverse the intersection at its initial speed without stopping; however, it can proceed by accelerating to its maximum speed. In scenario two, even at maximum speed, the bus is unable to pass through the intersection without stopping, necessitating the implementation of a green extension strategy. Conversely, scenarios three and four illustrate conditions where the signal phase is red upon the bus entering the starting position of the guidance zone. In scenario three, the bus slows down and positions itself at the rear of a queue of private vehicles that are resuming movement. Consequently, the bus can traverse the intersection without stopping. In scenario four, despite the bus attempting to reduce its speed via maximum deceleration while facing a queue of private vehicles, it must still come to a complete stop and wait. In this case, the implementation of a red truncation strategy is required.
| 8 |
where
Scenario one
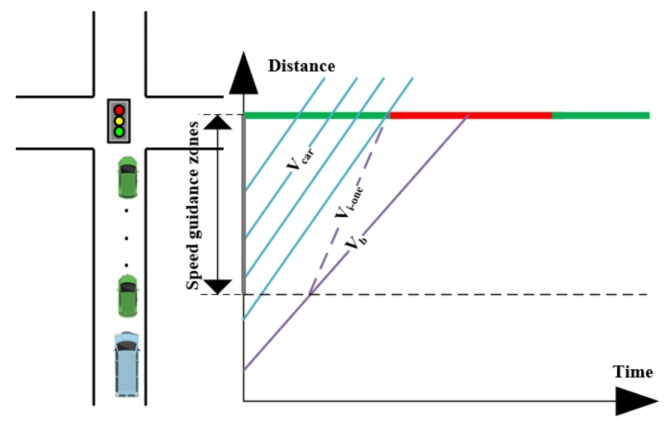
As shown in Fig. 5, when the bus travels at its initial speed, the time required to reach the stop line exceeds the duration of the green phase for priority vehicles. However, the intersection can be traversed by accelerating to maximum speed. Notably, the implementation of eco-driving techniques allows the bus to pass through the intersection without stopping.
Fig. 5.
Space-time diagram in scenario one.
| 9 |
At this point, the eco-driving speed needed for the bus is as follows:
| 10 |
| 11 |
where
In scenario one, the bus operates in an accelerated state, leading to reduced travel delays compared to when it operates at its initial speed. Furthermore, the acceleration of the bus has a negligible impact on the delays experienced by private vehicles. Consequently, Eq. 12 quantifies the observed reduction in bus delay.
| 12 |
where
With changes in vehicle power relative to speed, energy consumption per unit varies with increasing speed. This results in differing carbon emissions per unit distance for vehicles at various speeds27. Therefore, the equation for calculating the variation in carbon emissions for buses under the acceleration guidance strategy is presented as follows:
| 13 |
where
Scenario two
Figure 6 illustrates that the bus is unable to traverse the intersection without stopping, even upon reaching its maximum speed within the guidance zone. This observation highlights the ineffectiveness of the speed guidance strategy, as the remaining green phase does not enable a seamless transition for the bus beyond the stop line. To address this issue, the implementation of the TSP strategy, specifically the green extension, is essential.
Fig. 6.
Space-time diagram in scenario two.
| 14 |
The time of green extension is:
| 15 |
where
The cycle length remains constant, and extending the green phase would result in a reduction of the green phase duration for non-priority movements. To prevent excessive congestion among these non-priority movements, a maximum threshold is established to regulate the extension of the green phase.
| 16 |
where
In conclusion, the time of green extension should satisfy Eq. 17:
| 17 |
If the condition is met, it can be inferred that the green extension of the priority phase does not result in excessive saturation of traffic during non-priority phases.
To mitigate the adverse effects on vehicles in non-priority phases caused by public transit priority measures, while simultaneously minimizing carbon emissions from intersection traffic, the optimal guidance speed for buses under Scenario 2 should satisfy the constraint specified by Eq. 18.
| 18 |
where
Following the implementation of the green extension strategy, the delay at intersections is primarily comprised of the following components. First, a reduction in bus delays during the priority phase is observed due to the green extension. This reduction corresponds to the time that buses spend waiting at intersections prior to signal optimization.
| 19 |
where
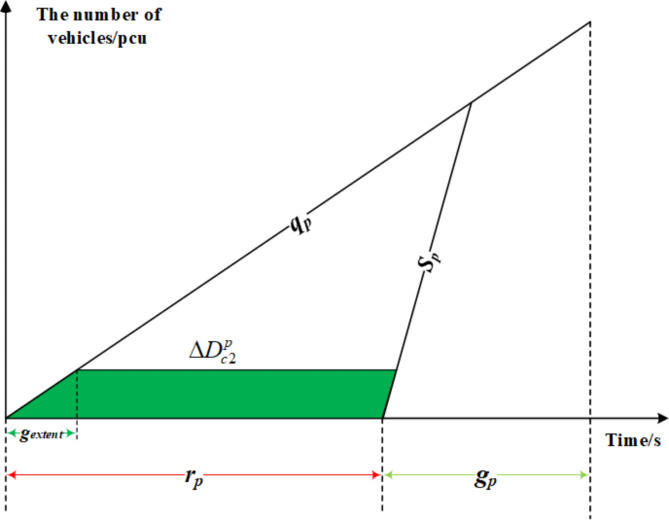
Second, additional time is allocated to private vehicles during the priority phase, facilitating their smooth passage through intersections. The shaded area in Fig. 7 illustrates the reduction in delay experienced by private vehicles due to the green extension implementation. The delay within this shaded area is mathematically defined by Eq. 20.
Fig. 7.
Decreased delay of private vehicles in priority phase caused by green extension.
| 20 |
where
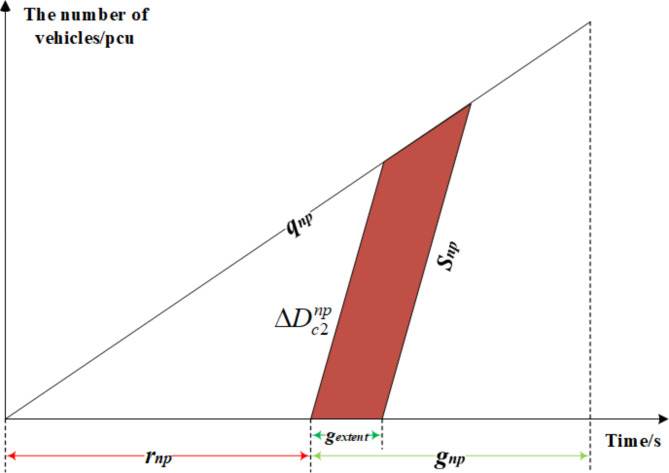
Third, following the implementation of the green extension strategy, private vehicles in non-priority phases incur additional waiting time. Figure 8 visually illustrates the increased delay experienced by these vehicles, as represented by the shaded area. The delay within this segment is quantified by Eq. 21.
Fig. 8.
Increased delay of private vehicles in non-priority phases caused by green extension.
| 21 |
where
Following the implementation of acceleration guidance and green extension strategies for buses, the changes in carbon emissions at intersections can be attributed to three main factors. First, a variation in carbon emissions from buses occurs due to changes in speed, as illustrated in Eq. 13.
Second, the green extension reduces idling and start-stop emissions from some private vehicles by decreasing their stopping time at intersections. However, this strategy may also adversely impact non-priority phase vehicles, resulting in increased carbon emissions from these vehicles. The reduction in carbon emissions from buses within the guidance zone can be primarily categorized into additional emissions resulting from idling and queuing. The calculation method for the reduction in bus carbon emissions
| 22 |
where
Third, the green extension shortens the travel time of private vehicles in the non-priority phase. Vehicles that previously passed through the intersection smoothly under the original signal timing are now compelled to stop, resulting in increased carbon emissions from non-priority phase vehicles. This increase in carbon emissions is represented by Eq. 23.
| 23 |
where
Scenario three
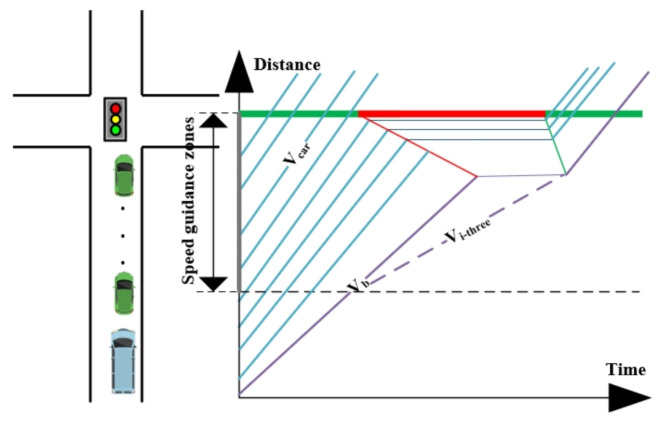
Figure 9 illustrates the sequencing process when a bus enters the guidance zone while the corresponding signal for the priority phase is red. If the bus maintains its initial speed, it will encounter a queue and be required to halt and join the line. Once the green light for the priority phase is activated, the bus will resume movement by following the departing private vehicles. Conversely, if the bus decelerates upon entering the guidance zone, it will align with the rear of the queue as the next private vehicle begins to move. In this scenario, the bus will proceed in sync with the exiting queued vehicles, thereby avoiding the need to pause and await clearance at the intersection.
Fig. 9.
Space-time diagram in scenario three.
| 24 |
The queue length at the intersection is determined by the arrival rate of private vehicles and the duration of the red signal following the bus’s entry into the guidance zone.
| 25 |
where
To facilitate the synchronization of the bus with privately owned vehicles starting from the rear of the queue, it is essential to calculate the start-up time of the last private vehicle in the queue.
| 26 |
where
The guidance speed for the bus can be determined from the queue length and the start-up time of the last private vehicle in the queue.
| 27 |
where
The bus operates in a state of deceleration, resulting in increased travel delays compared to a bus traveling at an initial speed. The delay experienced by the bus can be classified into two primary components: delays encountered from the guidance zone to the end of the queue, and delays experienced as the bus follows the queued vehicles toward the intersection.
| 28 |
where
To facilitate the passage of buses through intersections without stopping, it is essential to reduce their driving speed. Variations in speed consequently lead to changes in carbon emissions from buses. The reduction in carbon emissions can be categorized into two components: the variation in emissions resulting from speed changes and the decrease in emissions achieved by avoiding stops.
| 29 |
where
Scenario four
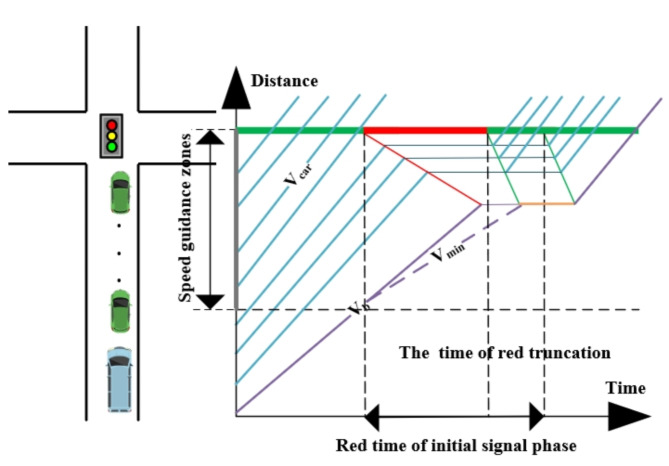
Figure 10 illustrates the situation in which a bus enters the guidance zone while the priority phase signal remains red. In contrast to Scenario 3, Scenario 4 requires the bus to integrate into the queue, even after reducing its speed to a minimum, due to the red phase not yet being terminated. To mitigate this issue, the implementation of the TSP strategy, specifically the red truncation, is essential.
Fig. 10.
Space-time diagram in scenario four.
| 30 |
The red truncation necessary for the bus to traverse the intersection is calculated based on the moment it reaches the end of the queue, the initiation of movement of the last private vehicle in the queue, and the remaining duration of the red phase in the priority signal.
| 31 |
| 32 |
where
The cycle length remains constant, however, the implementation of red truncation leads to a reduction in the allocated green time for non-priority phases. To ensure a minimum green duration for these phases and prevent excessive saturation of private vehicles, it is essential to limit the length of red truncation. The maximum duration of red truncation is given by Eq. 33.
| 33 |
where
In conclusion, the constraint shown in Eq. 34 should be satisfied by the time of red truncation.
| 34 |
It has been indicated that the minimum green time in the preceding phase remains unaffected by the red truncation of the priority phase, thereby preventing excessive saturation of traffic flow from that phase. The total delay at the intersection resulting from the red truncation is calculated; if this delay is deemed excessive, the implementation of the red truncation strategy is not pursued.
To mitigate the adverse effects on vehicles in non-priority phases caused by bus priority measures while minimizing carbon emissions from intersection traffic, the optimal guidance speed for buses under Scenario 4 must satisfy the constraint specified by Eq. 35.
| 35 |
where
Following the implementation of red truncation, the delay experienced by vehicles at intersections is primarily composed of the following components. First, a reduction in bus delays during the priority phase is observed, which corresponds to the combined duration of the remaining red time prior to optimization and the time required for the start-up wave to reach the end of the queue.
| 36 |
where
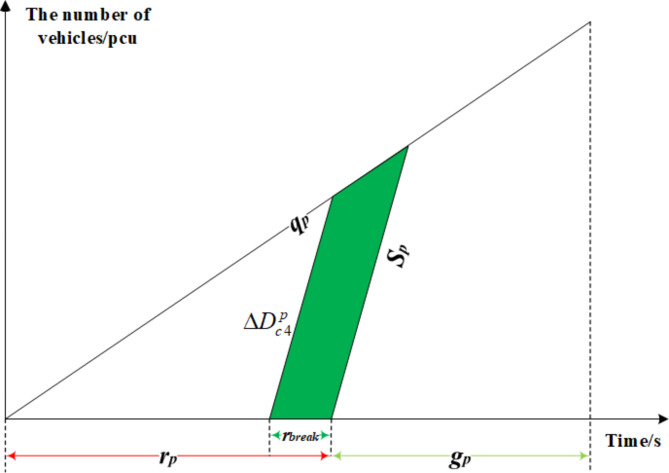
Second, the implementation of red truncation allows private vehicles in the priority phase to depart from the intersection earlier. Figure 11 illustrates the shaded area, representing the reduction in delay experienced by private vehicles during the priority phase due to red truncation.
Fig. 11.
Decreased delay of private vehicles in priority phase caused by red truncation.
| 37 |
where
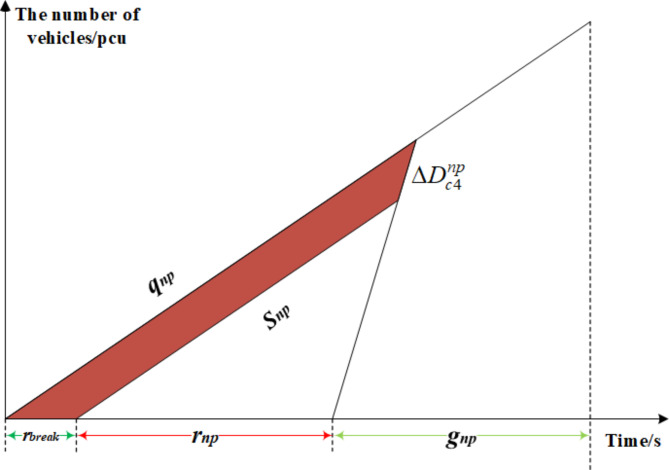
Third, the implementation of red truncation compresses the green time allocated to non-priority phases, potentially causing delays for private vehicles that may have to wait until the next cycle for the green light to activate. As a result, the waiting time for private vehicles in non-priority phases is increased. Figure 12 presents the shaded area, illustrating the heightened delays experienced by these vehicles due to red truncation.
Fig. 12.
Increased delay of private vehicles in non-priority phases due to red truncation.
| 38 |
Following the implementation of deceleration guidance and red truncation strategies for buses, the changes in carbon emissions at intersections can be classified into three categories: the reduction in bus carbon emissions, the decrease in emissions from priority phase private vehicles, and the increase in emissions from non-priority phase private vehicles.
The reduction in carbon emissions from buses in the guidance zone primarily results from additional emissions due to idling and queuing. The calculation of the reduction in bus carbon emissions
With the influence of red truncation, green lights for priority phases are activated earlier. As a result, private vehicles that were queued at the intersection under the original signal timing may begin moving through the intersection sooner, thereby reducing idle time during queuing. Consequently, carbon emissions from priority phase private vehicles also decrease, with the emissions reduction quantified by Eq. 39.
| 39 |
where
With unchanged signal cycles, red truncation leads to a reduction in the travel time of non-priority phase vehicles. Vehicles that previously passed through the intersection smoothly under the original signal timing are now compelled to stop, resulting in increased carbon emissions. The increase in carbon emissions from non-priority phase private vehicles is calculated using Eq. 40.
| 40 |
where
Objective function
The optimization objective of the proposed model is to maximize the reduction of total delay at intersections along with carbon emissions. Total delay is calculated by multiplying the delay variation for each vehicle by its corresponding occupancy rate. Delay variation encompasses both travel delay and signal delay. Travel delay is defined as the difference between actual travel time and travel time under free-flow conditions, while signal delay represents the time required for vehicles to pass through the intersection before and after the optimization process. The carbon emissions of vehicles are primarily calculated based on the energy consumption and carbon emission factors of different vehicle types29.
To facilitate problem-solving, a weighted approach is employed to transform multi-objective optimization problems into single-objective ones. Due to the numerical disparity between vehicle delay and carbon emissions, simultaneous optimization may yield distorted results. To mitigate this issue, this study defines the ratio of optimized vehicle delay and carbon emissions to their initial values as the objective function, assigning distinct weights to each. The normalized objective function is presented in Eq. 41.
| 41 |
| 42 |
where
Solution
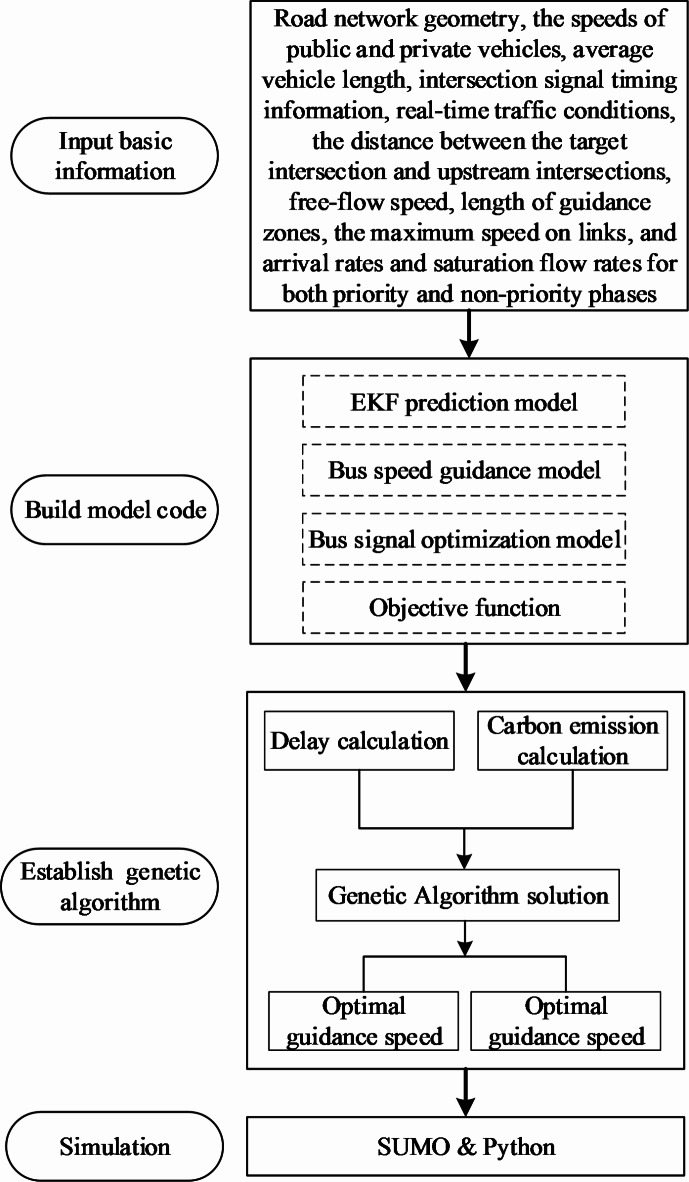
This study primarily utilizes SUMO and Python for the simulations. The required data for the simulation includes road network geometry, the speeds of public and private vehicles, average vehicle length, intersection signal timing information, real-time traffic conditions, the distance between the target intersection and upstream intersections, free-flow speed, length of guidance zones, the maximum speed on links, and arrival rates and saturation flow rates for both priority and non-priority phases. The data collection time is simulation time 0–4500 s. In the proposed model, the time for public vehicles to reach the target intersection is initially predicted using the distance between the target and upstream intersections alongside the speed of the public vehicle, in conjunction with the EKF. The predicted arrival time is then compared with the intersection signal state to determine whether priority strategies should be executed, as outlined in Eq. 7. If priority strategies are warranted, the guidance speed range for vehicles, intersection delay, vehicle carbon emissions, and signal priority timing plans are calculated based on the collected data, which includes the speeds of public and private vehicles, average vehicle length, intersection signal timing information, free-flow speed, maximum speed, and the arrival rates and saturation flow rates for both priority and non-priority phases. Ultimately, the optimal guidance speed for public vehicles and the associated signal timing scheme are derived based on the objective function defined in this study.
The simulation flowchart is illustrated in Fig. 13. Once buses enter the guidance area, the EKF is applied to predict the time of arrival at the intersection based on this information and to determine whether priority strategies need to be implemented. If the bus arrives at the intersection during the green light interval, no actions will be taken, otherwise, an optimization scheme will be developed to facilitate the uninterrupted passage of the bus through the intersection, guided by the constraints and objectives defined in the bus priority model. Finally, the GA will be employed to identify the optimal solution that aligns with the objective function from the aforementioned optimization schemes, which will then be communicated back to the bus during the simulation.
Fig. 13.
Flowchart of the simulation process.
Genetic algorithm
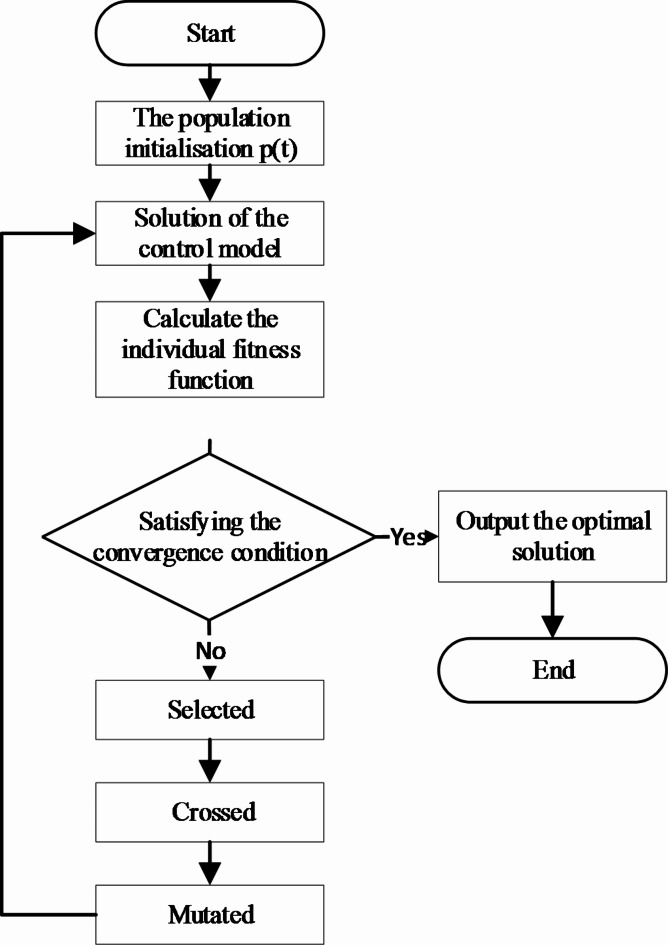
The proposed model employs the GA, a self-adaptive global search optimization technique that simulates phenomena such as natural selection, genetic crossover, and mutation through iterative steps. The optimal solution, which fulfils the specified requirements, is decoded from the best individuals in the final generation. Figure 14 illustrates the fundamental process of the GA.
Fig. 14.
Fundamental process of GA.
The implementation steps of GA
Integration is achieved through the use of SUMO simulation software and the Python programming environment, facilitated by SUMO’s traffic control interface (TraCI). Before the simulation begins, predefined signal timing parameters and traffic flow inputs are provided. Real-time adjustments to signal timing and bus guidance speed are made using the GA within the simulation framework. The pursuit of optimal solutions, consistent with the objective function, is conducted.
Step 1: Population initialization. In this study, the method of numerical symbol encoding is utilized, whereby each individual represents a solution. A population is formed by aggregating these individuals, with an initial population size of 100 being set.
Step 2: Fitness function calculation. The fitness function is defined as the reciprocal of the objective function.
| 43 |
Step 3: Selection strategy. The selection strategy is performed using the roulette method within the context of this study. Denoting the population size as
| 44 |
Step 4: Crossover operation. The genetic sequences of individuals undergo a crossover operation in which multiple crossover points are randomly selected. At these points, the genetic sequences of two individuals are exchanged. This process ensures that a random permutation is maintained, effectively preventing local convergence. Excessively high crossover probabilities may lead to premature convergence, therefore, a crossover probability of 0.716 has been selected for this study.
Step 5: Mutation operation. Individuals are randomly selected, and two genes from the selected individual are randomly chosen to undergo mutation. To mitigate these issues, a mutation probability of 0.0516 has been adopted in this research.
Step 6: Termination condition assessment. If the termination condition is satisfied, the optimal individual is produced.
Case study
Case description
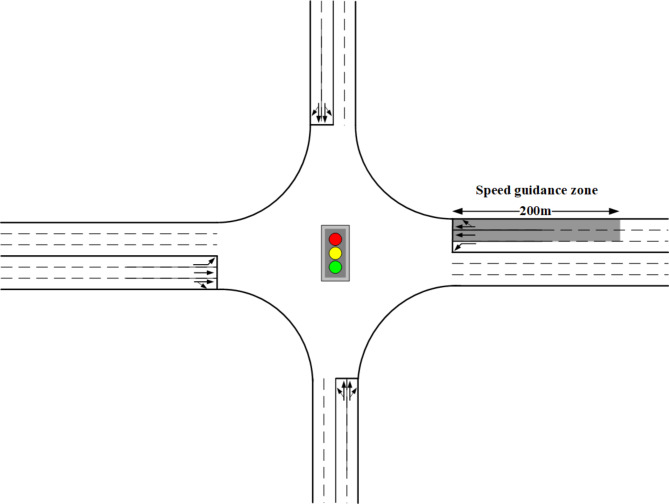
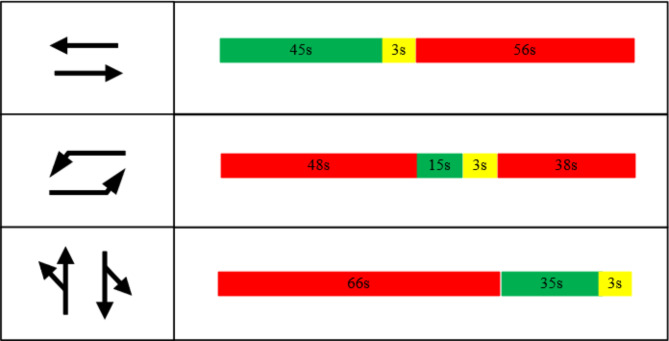
For the evaluation and validation of the proposed model, the intersection at the junction of Jingkai Fifth Street and Jingnan Third Road in Zhengzhou City, China, was selected as a representative example. The layout of the intersection is depicted in Fig. 15. The arterial roads comprise three lanes in each direction, while the side streets consist of two lanes in each direction, and each lane width is 3.25 m. Figure 16 illustrates the signal timing, which accommodates uncontrolled right-turning vehicles. The research primarily focuses on the east-west approach to the intersection. The permissible speed range for vehicles is established between 20 and 60 km/h, and buses operate with a departure interval of 5 min. The TSP strategies primarily involve green extensions and red truncations, with a maximum priority duration of 14s. The guidance zone begins 200 m upstream of the stop line.
Fig. 15.
Intersection layout.
Fig. 16.
Signal timing.
The carbon emission factors for buses and private vehicles are 1.06 and 1.73 gCO2/gce, respectively30. The unit energy consumption rates are 4.77 gce/s for buses during acceleration, 1.12 gce/s during deceleration, and 2.27 gce/s while idling. For private vehicles, the respective rates are 1.46 gce/s for acceleration, 0.34 gce/s for deceleration, and 0.70 gce/s while idling31. During the optimization process using the GA, various sets of comparative results were generated by assigning different weights to the optimization objectives of bus passenger delay, private vehicle passenger delay, and carbon emissions. The results indicate that the optimization effect is most favourable when when
A case study was conducted under three different traffic demand levels32 (v/c = 0.5, v/c = 0.7, and v/c = 0.9) as detailed in Table 1. A comparative analysis was performed among four distinct strategies. The first strategy, designated as No Traffic Signal Priority (NTSP), involved examining the intersection signal timing, which remained unchanged regardless of bus detection. The second strategy investigated was the Traffic Signal Priority (TSP) approach, which adjusted the signal timing to grant priority to buses only when detected. The third strategy implemented was Speed Guidance, which maintained bus speed and initial signal timing upon entering the guidance zone. Lastly, the proposed TSP strategy was introduced, integrating both TSP and Speed Guidance to dynamically adjust bus speed and signal timing in real time. A comprehensive comparison was then made to evaluate the performance of the proposed strategy against these three alternatives across varying traffic demand levels.
Table 1.
Traffic volume.
| v/c | Lane configuration | Eastbound/(pcu/h) | Westbound/(pcu/h) | Southbound/(pcu/h) | Northbound/(pcu/h) |
|---|---|---|---|---|---|
| 0.5 | Left | 43 | 26 | 72 | 64 |
| Straight | 120 | 87 | 182 | 171 | |
| Right | 72 | 43 | 104 | 95 | |
| 0.7 | Left | 56 | 41 | 92 | 78 |
| Straight | 275 | 233 | 514 | 390 | |
| Right | 156 | 120 | 257 | 189 | |
| 0.9 | Left | 73 | 56 | 126 | 97 |
| Straight | 357 | 295 | 857 | 652 | |
| Right | 213 | 151 | 308 | 259 |
Four indices are considered for evaluation: average bus delay, average delay for private vehicles (east-west approach), average side street delay, and per person delay. The calculations account for all passengers on both buses and private vehicles, with occupancy rates of 2 passengers per private vehicle and 30 passengers per bus.
The CACC car-following model employs the SUMO framework for case simulation. Python is utilized to interface with the TraCI of SUMO, facilitating the construction of the SUMO-Python simulation environment. The TraCI interface is then used to manage the experimental process and gather the necessary data. Each simulation run lasts for 1 h, excluding the warm-up period. To ensure the reliability of the simulation outputs, 20 simulation runs are conducted for each scenario.
GA and simulation
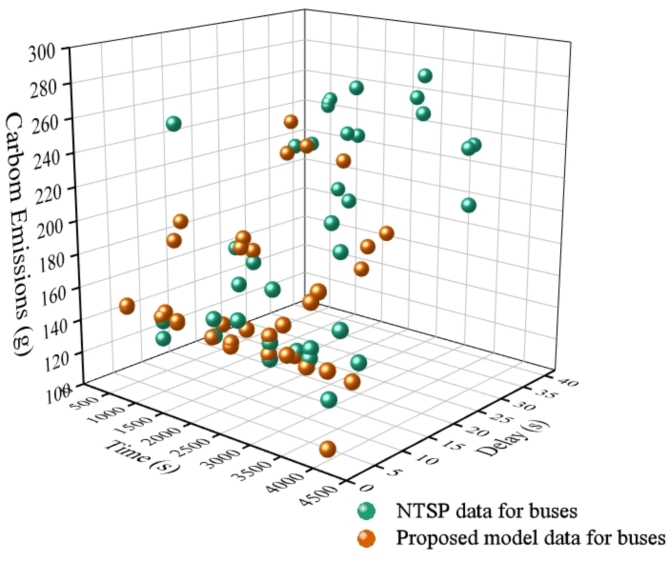
In this study, the GA is employed to calculate the delays and carbon emissions of buses at various eco-driving speeds, ultimately deriving the optimal values that satisfy the objective function. The optimal bus delays and carbon emissions are then compared with those of the NTSP scenario, as illustrated in Fig. 17.
Fig. 17.
Comparison between NTSP and Proposed model on bus delays and carbon emissions from GA.
Figure 17 illustrates the disparities in bus travel data between the proposed model and the NTSP scenario across various time periods. It is evident that buses experience significantly lower delays and carbon emissions when utilizing the proposed model compared to the NTSP. In particular, the results indicate that bus delays associated with the proposed model are considerably reduced. In scenarios without dedicated bus lanes, the approach presented in this study, encompassing eco-driving speed guidance and signal optimization for buses, effectively minimizes delays and carbon emissions, thereby enhancing both operational efficiency and environmental sustainability for bus services.
Simulation results
Average delay
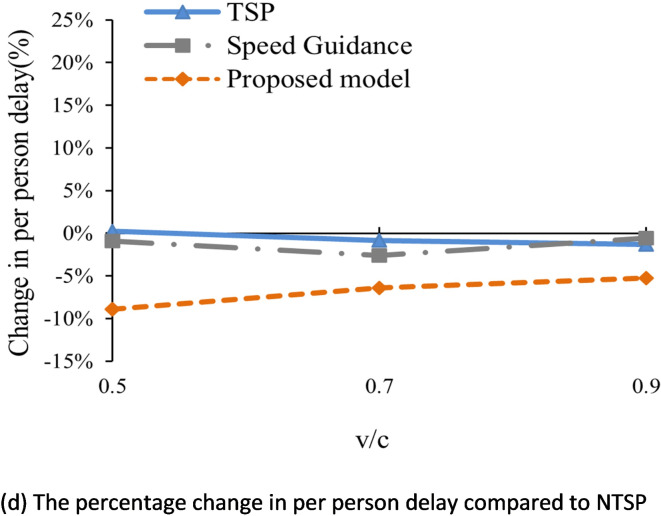
The effects of four control strategies (NTSP, TSP, Speed Guidance and the proposed model) were tested through experiments conducted at three different traffic demand levels. The performance of these strategies was evaluated by analyzing average delays, as detailed in Table 2. Additionally, Fig. 18 summarizes the percentage changes in average bus delay, average private vehicle delay, average side street delay, and per person delay relative to the base case (NTSP).
Table 2.
Average delay under different scenarios.
| v/c | Indexes | Scenarios | |||
|---|---|---|---|---|---|
| NTSP | TSP | Speed Guidance | Proposed model | ||
| 0.5 | Average bus delay (s) | 13.43 | 11.2 | 12.33 | 7.05 |
| Average private vehicle delay (s) | 10.62 | 9.87 | 10.66 | 9.93 | |
| Average side street delay (s) | 15.81 | 17.83 | 15.81 | 15.96 | |
| Per person delay (s) | 12.81 | 12.84 | 12.69 | 11.67 | |
| 0.7 | Average bus delay (s) | 16.46 | 14.02 | 15.28 | 8.47 |
| Average private vehicle delay (s) | 13.08 | 11.56 | 12.42 | 12.13 | |
| Average side street delay (s) | 16.13 | 18.53 | 16.34 | 16.53 | |
| Per person delay (s) | 14.46 | 14.34 | 14.08 | 13.53 | |
| 0.9 | Average bus delay (s) | 20.23 | 16.96 | 18.61 | 11.67 |
| Average private vehicle delay (s) | 16.13 | 13.99 | 15.28 | 14.82 | |
| Average side street delay (s) | 21.11 | 24.41 | 21.85 | 21.24 | |
| Per person delay (s) | 17.55 | 17.32 | 17.45 | 16.63 | |
Fig. 18.
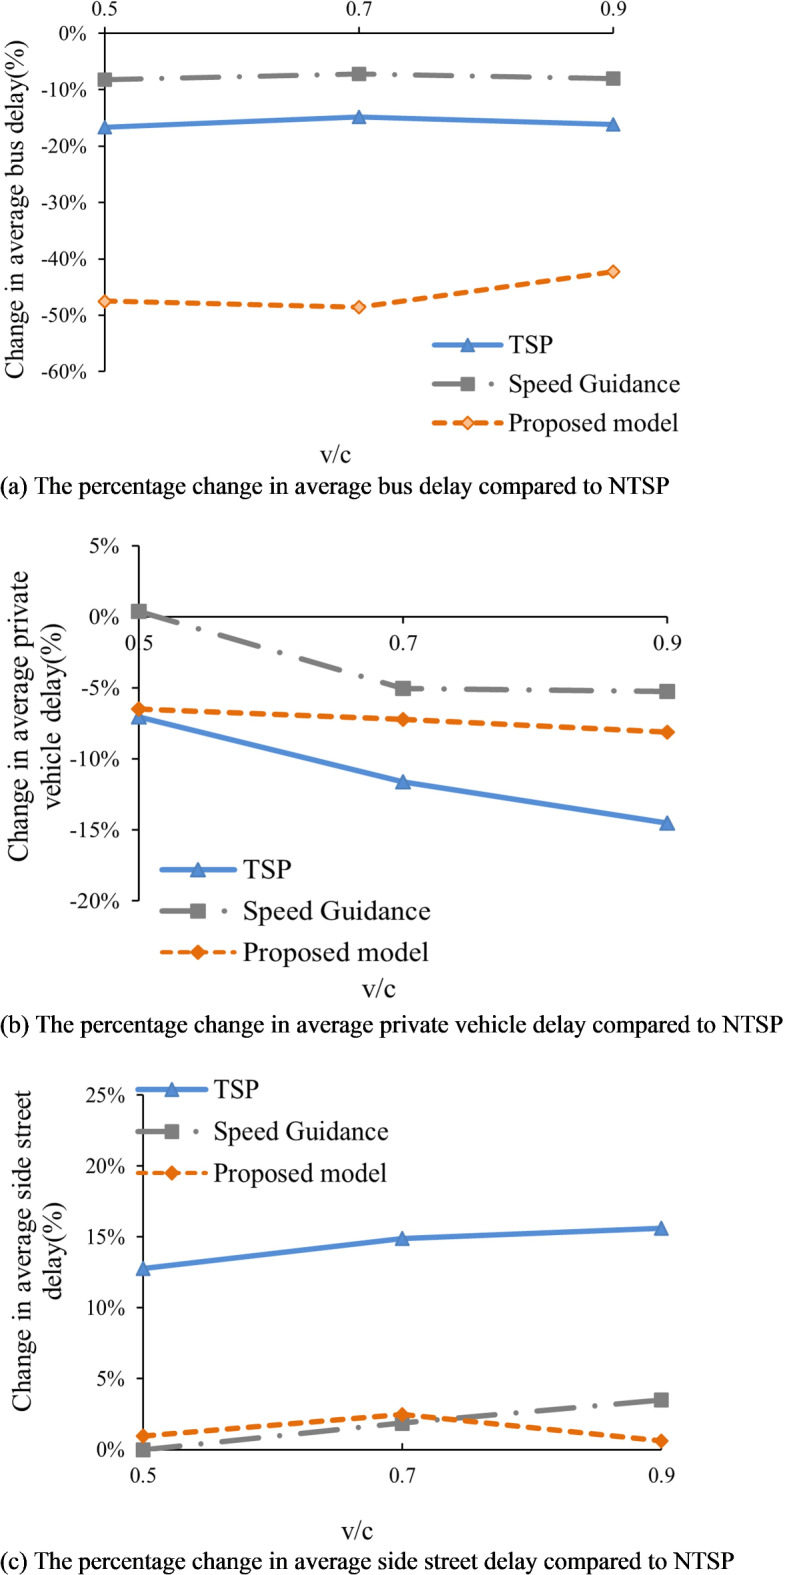
Percentage change in delay compared to NTSP.
Table 2 demonstrates a clear reduction in average bus delay for the TSP, Speed Guidance, and proposed model compared to the NTSP. At v/c ratios of 0.5, 0.7, and 0.9, the average bus delays are reduced by 6.38s, 7.99s, and 8.56s, respectively, through the application of the proposed model. The implementation of TSP results in significant average bus delay reductions of 2.23s, 2.44s, and 3.27s for v/c ratios of 0.5, 0.7, and 0.9, respectively, compared to the NTSP. For Speed Guidance, reductions of 1.1s, 1.18s, and 1.62s in average bus delay are observed at v/c ratios of 0.5, 0.7, and 0.9, respectively, relative to the NTSP. Notably, the model proposed in this study exhibits superior performance in reducing average bus delay compared to both TSP and Speed Guidance. Furthermore, as the v/c ratios increase, the average bus delay decreases even more significantly.
In comparison to the NTSP, the TSP, Speed Guidance, and proposed model demonstrate a decreasing trend in average private vehicle delay. Specifically, the proposed model reduces the average private vehicle delay by 0.69s, 0.95s, and 1.31s for v/c ratios of 0.5, 0.7, and 0.9, respectively. For TSP, reductions in average private vehicle delay are 0.75s, 1.52s, and 2.14s at the same v/c ratios. Notably, a variation was observed concerning Speed Guidance; when the v/c ratio is 0.5, the average private vehicle delay increases by 0.04s. Conversely, at v/c ratios of 0.7 and 0.9, consistent decreases of 0.66s and 0.85s, respectively, were recorded. Therefore, the proposed model exhibits superior performance in reducing average private vehicle delay compared to Speed Guidance, while demonstrating inferior performance relative to TSP. This phenomenon is primarily attributed to the fact that TSP solely employs signal priority strategies (including red truncation and green extension) aimed at minimizing bus delays. This approach often results in frequent modifications to intersection signal timing to prioritize buses, thereby extending the green light duration for priority phases, which also benefits private vehicles in these phases. In contrast, the proposed model integrates speed guidance with signal priority, first applying speed guidance strategies to buses. If this strategy proves ineffective, signal priority is then implemented. As a result, the frequency of signal priority applications in the proposed model is lower than that in TSP, leading to comparatively lesser benefits for private vehicles in priority phases than those observed under TSP strategies.
In contrast, an increase in average side street delay is observed for the TSP, Speed Guidance, and proposed model when compared to the NTSP. This phenomenon primarily results from the alteration of signal timing by TSP, which decreases the allocation of green time to non-priority phases. For v/c ratios of 0.5, 0.7, and 0.9, the proposed model demonstrates impacts on average side street delay, with increases of 0.15s, 0.4s, and 0.13s, respectively. The use of TSP contributes to higher delay levels, with increments of 2.02s, 2.4s, and 3.3s. Similarly, the implementation of Speed Guidance yields discernible effects, resulting in increases of 0s, 0.21s, and 0.74s. Therefore, the proposed model exhibits superior performance in reducing average side street delay compared to TSP, while demonstrating inferior performance relative to Speed Guidance. The proposed model combines speed guidance with bus signal priority. The implementation of bus signal priority results in an increased green light duration for the priority phase when buses pass through, which consequently compresses the green light duration for the non-priority phase, leading to increased delays for side street vehicles. In contrast, Speed Guidance only adjusts the speed of buses without modifying signal timing, thus avoiding any negative impact on side street vehicles. Consequently, the average side street delays for the proposed model do not demonstrate improvement compared to the Speed Guidance.
For per person delay, the TSP, Speed Guidance, and proposed model also exhibit a downward trend compared to the NTSP. The proposed model reduces per person delay by 1.14s, 0.93s, and 0.92s at v/c ratios of 0.5, 0.7, and 0.9, respectively. At a v/c ratio of 0.5, an increase of 0.03s is noted for TSP; however, for v/c ratios of 0.7 and 0.9, corresponding reductions of 0.12s and 0.23s are observed. Speed Guidance shows decreases of 0.12s, 0.38s, and 0.1s, respectively. Overall, the proposed model demonstrates the most significant reduction in per person delay.
The results indicate that the proposed model outperforms both TSP and Speed Guidance in effectively reducing average bus delay and per person delay. Moreover, it demonstrates superior performance over Speed Guidance regarding average private vehicle delay. Additionally, in terms of average side street delay, the proposed model exceeds the performance of TSP.
Figure 18 illustrates the percentage change in delay when comparing TSP, Speed Guidance, and the proposed model with NTSP. Figure 18a emphasizes the significant reduction in average bus delay achieved by the proposed model, which surpasses the improvements offered by both TSP and Speed Guidance. At v/c ratios of 0.5, 0.7, and 0.9, the average bus delays for the proposed model show reductions of 48%, 49%, and 42%, respectively, resulting in an overall decrease of 46%. However, it is important to note that the results indicate a reduction in average bus delay for the proposed model at a v/c ratio of 0.9. This outcome can be attributed to the higher traffic demand at this level, which poses increased challenges in adjusting bus speed.
Figure 18b and c illustrate the percentage variations in average private vehicle delay and average side street delay, respectively, when implementing TSP, Speed Guidance, and the proposed model compared to NTSP. The implementation of TSP extends the green duration of the priority phase, benefitting private vehicles in that phase. The average private vehicle delay under TSP decreased by 11%, outperforming the proposed model, which achieved a reduction of 7%. In contrast, a 14% increase was observed in average side street delay, while the proposed model exhibited only a marginal increase of 1%. Therefore, in terms of overall intersection delay, the proposed model demonstrates superior performance.
Figure 18d reveals that per person delay can be reduced through the application of TSP, Speed Guidance, and the proposed model. Notably, the reductions achieved with TSP and Speed Guidance are relatively less substantial compared to those of the proposed model. The per person delay was significantly reduced by 7% through the implementation of the proposed model, in contrast to the marginal reductions of 1% achieved by both TSP and Speed Guidance.
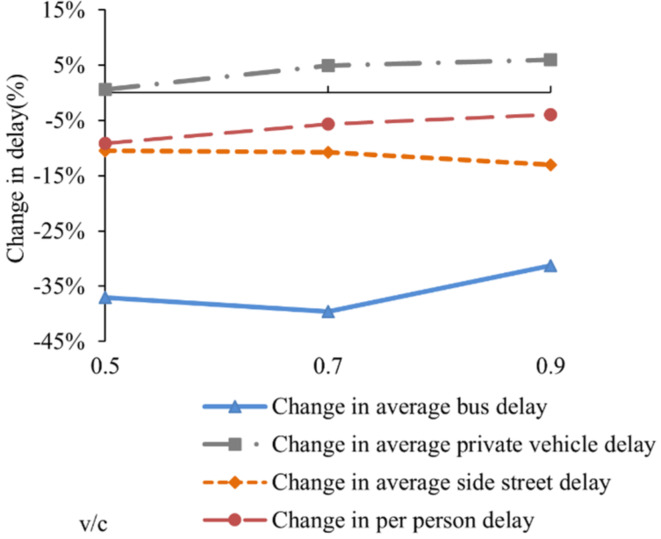
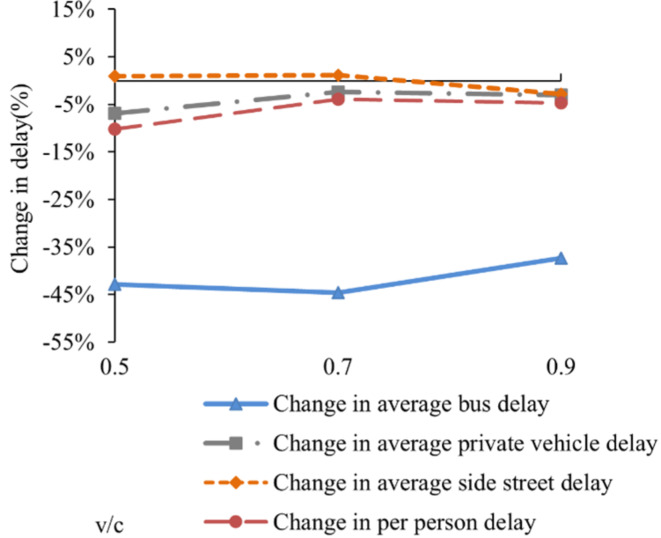
Figures 19 and 20 illustrate the percentage change in delay when comparing the proposed model to TSP and Speed Guidance, respectively. Figure 19 reveals significant enhancements in the proposed model relative to TSP, with reductions in average bus delay, average side street delay, and per person delay of 36%, 11%, and 6%, respectively. Conversely, a slight increase of 4% is noted in average private vehicle delay. Figure 20 shows that, compared to Speed Guidance, the proposed model achieves substantial reductions in average delays for buses, private vehicles, and per person delays, with reductions of 42%, 4%, and 6%, respectively. However, no improvement in average side street delay is observed.
Fig. 19.
Percentage change in delay compared to the TSP for proposed model.
Fig. 20.
Percentage change in delay compared to the Speed Guidance for proposed model.
Overall, the proposed model demonstrates considerable advantages in decreasing average bus delay, average private vehicle delay, and per person delay compared to NTSP, TSP, and Speed Guidance. Moreover, the adverse effect on average side street delay is negligible.
Average carbon emissions
In the joint simulation of SUMO and Python, the carbon emission function within SUMO was employed to determine vehicle emissions at each simulation timestep. The overall carbon emissions for the intersection were calculated by aggregating the emissions of vehicles across each timestep (1s). Throughout this process, SUMO continuously collects data on road conditions, traffic volume, and vehicle movement. This data is processed using an integrated pollutant emission calculation model33,34, which outputs various emission figures.
Tests were conducted at three different levels of traffic demand to compare carbon emissions per vehicle using four optimization control methods. The length of the test route was 1.4 km. Table 3 presents an evaluation of the performance of these methods based on the analysis of carbon emissions per vehicle. Additionally, Fig. 21 summarizes the percentage changes in average bus carbon emissions, average private vehicle carbon emissions, and average side street carbon emissions compared to the pre-optimization levels.
Table 3.
Average carbon emissions under different scenarios.
| v/c | Indexes | Scenarios | |||
|---|---|---|---|---|---|
| NTSP | TSP | Speed Guidance | Proposed model | ||
| 0.5 | Average bus carbon emissions (g) | 255.16 | 212.54 | 227.13 | 152.37 |
| Average private vehicle carbon emissions (g) | 169.91 | 158.78 | 169.25 | 161.09 | |
| Average side street carbon emissions (g) | 184.53 | 191.20 | 184.91 | 188.04 | |
| 0.7 | Average bus carbon emissions (g) | 300.87 | 252.94 | 278.10 | 163.57 |
| Average private vehicle carbon emissions (g) | 193.23 | 179.51 | 192.77 | 184.22 | |
| Average side street carbon emissions (g) | 201.75 | 218.50 | 202.54 | 207.95 | |
| 0.9 | Average bus carbon emissions (g) | 346.71 | 293.26 | 325.97 | 180.45 |
| Average private vehicle carbon emissions (g) | 218.97 | 202.91 | 218.06 | 206.53 | |
| Average side street carbon emissions (g) | 224.75 | 241.59 | 223.79 | 233.82 | |
Table 3 presents a comparison of average carbon emissions per vehicle among the NTSP, TSP, Speed Guidance, and the proposed model under various levels of traffic demand. Compared to the NTSP, both TSP, Speed Guidance, and the proposed model demonstrate significant reductions in average bus carbon emissions. Specifically, at v/c ratios of 0.5, 0.7, and 0.9, the proposed model achieves reductions of 102.79 g, 137.3 g, and 166.26 g in average bus carbon emissions, respectively. In contrast, TSP achieves reductions of 42.62 g, 47.94 g, and 53.45 g, while Speed Guidance achieves reductions of 28.03 g, 22.77 g, and 20.74 g compared to the NTSP, respectively. Notably, the proposed model significantly outperforms both TSP and Speed Guidance in reducing average bus carbon emissions. This superior performance is primarily attributed to the integration of the strengths of TSP and Speed Guidance, which allows for real-time optimization feedback control of traffic signals and bus speeds, thereby minimizing bus stopping frequency, duration, and speed fluctuations, ultimately contributing to reduced bus carbon emissions.
Compared to the NTSP, TSP, Speed Guidance, and the proposed model all exhibit a decreasing trend in average private vehicle carbon emissions. At v/c ratios of 0.5, 0.7, and 0.9, the proposed model reduces average private vehicle carbon emissions by 8.82 g, 9.01 g, and 12.44 g, respectively. In comparison, TSP achieves reductions of 11.13 g, 13.72 g, and 16.06 g, while Speed Guidance results in reductions of 0.66 g, 0.46 g, and 0.91 g, respectively. These data indicate that TSP produces the most significant reduction in average private vehicle carbon emissions, whereas the optimization effect of Speed Guidance is minimal. This discrepancy is primarily attributed to TSP’s extension of the green light duration for priority phases, allowing more private vehicles to benefit from this priority. In contrast, Speed Guidance primarily favors buses by adjusting their speeds, which has a limited effect on private vehicles.
Conversely, when compared to NTSP, both TSP and the proposed model reveal an increase in average side street carbon emissions. This increase primarily results from bus priority altering original signal timings, which reduces green light duration for non-priority phases and consequently decreases the number of private vehicles passing through side streets within a fixed signal cycle. As a result, average side street carbon emissions increase. Specifically, at v/c ratios of 0.5, 0.7, and 0.9, the proposed model demonstrates increases of 3.51 g, 6.20 g, and 9.07 g in average side street carbon emissions, significantly lower than the carbon emissions reductions achieved during the priority phase.
These findings indicate that, compared to TSP and Speed Guidance, the proposed model effectively reduces average bus carbon emissions while mitigating some of the adverse effects of bus priority on non-priority phase vehicles.
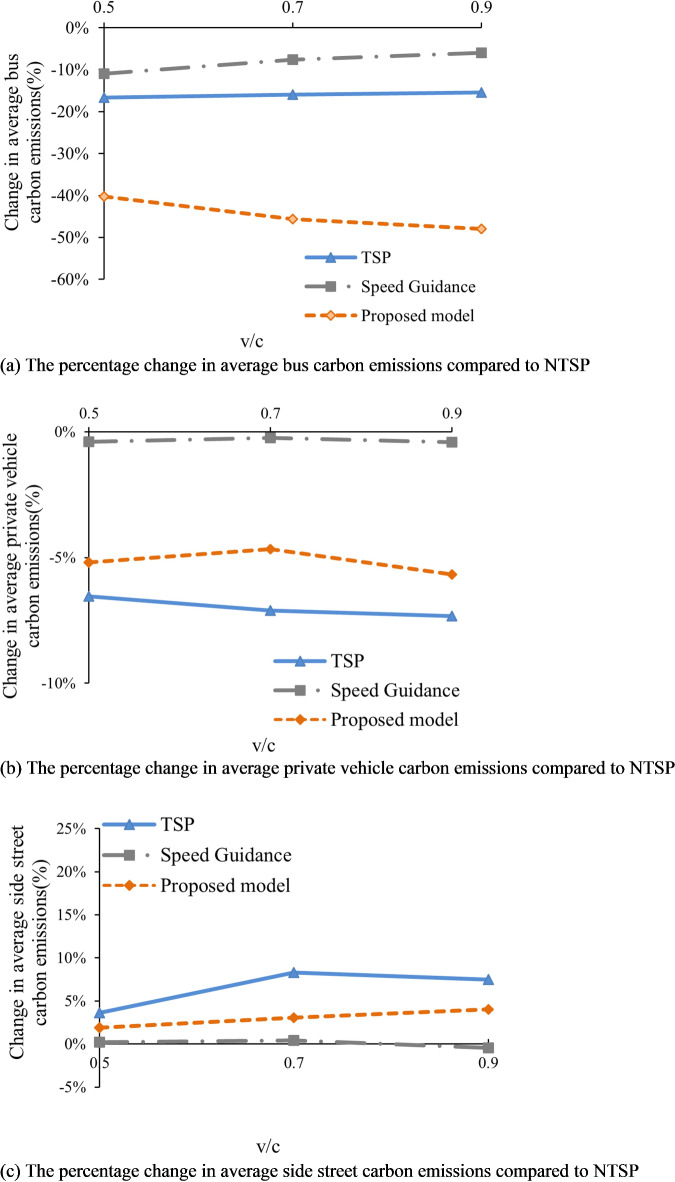
Figure 21 displays the optimization effects of three control methods under varying levels of traffic demand relative to the NTSP. Regarding average bus carbon emissions, as illustrated in Fig. 21(a), the proposed model significantly outperforms both TSP and Speed Guidance. At v/c ratios of 0.5, 0.7, and 0.9, the proposed model achieves reductions in average bus carbon emissions of 40.28%, 45.63%, and 47.95%, respectively. Notably, the optimization effect of the proposed model is more pronounced at a v/c ratio of 0.9, primarily due to increased congestion as traffic demand rises, resulting in longer queues and extended waiting times at intersections during red light phases. Consequently, by integrating eco-driving speed guidance with signal prioritization, significant reductions in bus queue times can be realized, thereby contributing to the goal of minimizing carbon emissions.
Fig. 21.
Percentage change in carbon emissions compared to NTSP.
Figures 21(b) and (c) illustrate the percentage changes in average private vehicle carbon emissions and average side street carbon emissions, respectively, for the three optimization control methods compared to the NTSP under different levels of traffic demand. While bus priority benefits vehicles in the priority phase, it concurrently leads to increased carbon emissions from non-priority phases. As evidenced in Fig. 21(c), the adverse effects of TSP on average side street carbon emissions across various levels of traffic demand are significantly greater than those observed with the proposed model.
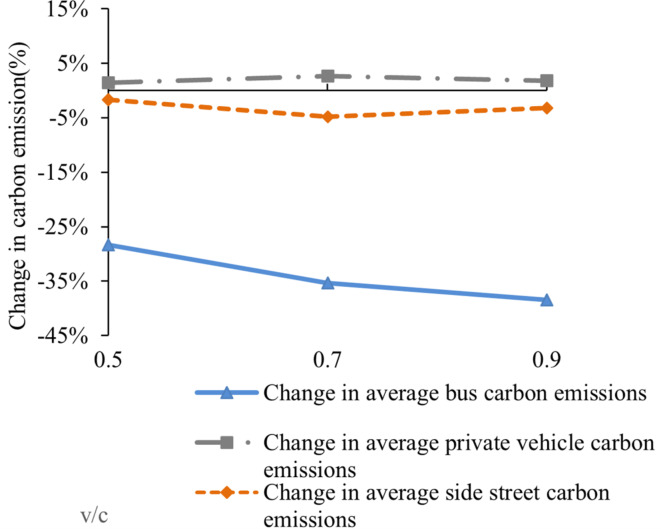
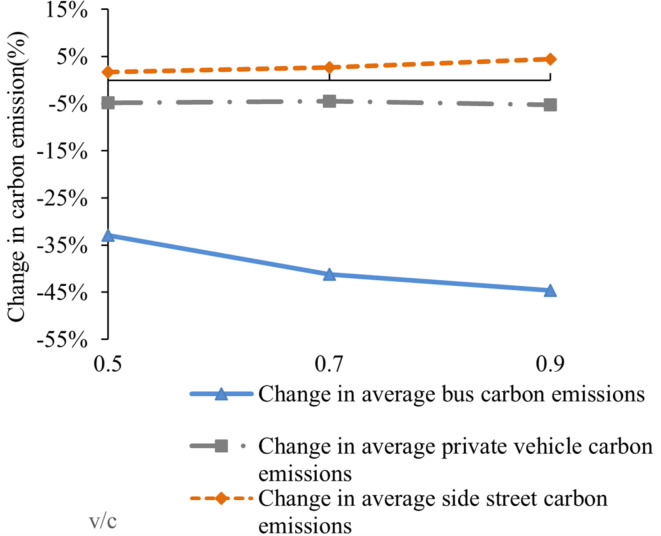
Figures 22 and 23 illustrate the percentage changes in carbon emissions when comparing the proposed model to TSP and Speed Guidance. As indicated in Fig. 22, the optimization effect of the model in this study on average bus carbon emissions is more pronounced than that of TSP. At v/c ratios of 0.5, 0.7, and 0.9, the average bus carbon emissions decrease by 28.31%, 35.33%, and 38.47%, respectively. Additionally, a reduction in average side street carbon emissions is also observed with the proposed model in comparison to TSP. Figure 23 reveals significant reductions in both average bus carbon emissions and average private vehicle carbon emissions when compared to Speed Guidance. The optimization effects for average bus carbon emissions reach 32.92%, 41.18%, and 44.64% at v/c ratios of 0.5, 0.7, and 0.9, respectively.
Fig. 22.
Percentage change in carbon emission compared to the TSP for proposed model.
Fig. 23.
Percentage change in carbon emission compared to the Speed Guidance for proposed model.
The proposed method was compared with the approach developed by Ma et al.35, and the results are presented in Table 4. As demonstrated in Table 4, substantial improvements in average vehicle delays and average vehicle carbon emissions were achieved with the proposed method compared to the approach by Ma et al. This further demonstrates the effectiveness of the proposed method.
Table 4.
Comparison of calculation results.
| v/c | Indexes | Scenarios | ||
|---|---|---|---|---|
| Proposed method in this paper | Method proposed by Ma et al.35 | Delay reduction compared with Ma et al.35 | ||
| 0.5 | Average bus delay (s) | 7.05 | 9.13 | 22.78% |
| Average private vehicle delay (s) | 12.94 | 13.56 | 4.57% | |
| Average bus carbon emissions (g) | 152.37 | 211.78 | 28.05% | |
| Average private vehicle carbon emissions (g) | 174.56 | 197.22 | 11.49% | |
| 0.7 | Average bus delay (s) | 8.47 | 11.4 | 25.7% |
| Average private vehicle delay (s) | 14.33 | 14.95 | 4.14% | |
| Average bus carbon emissions (g) | 163.5 | 247.75 | 34.01% | |
| Average private vehicle carbon emissions (g) | 196.08 | 217.49 | 9.84% | |
| 0.9 | Average bus delay (s) | 11.67 | 14.24 | 18.04% |
| Average private vehicle delay (s) | 18.03 | 18.63 | 3.23% | |
| Average bus carbon emissions (g) | 180.45 | 268.23 | 32.72% | |
| Average private vehicle carbon emissions (g) | 220.18 | 242.75 | 9.29% | |
In summary, the proposed model demonstrates more significant optimization effects compared to alternative control methods. It facilitates the implementation of bus priority across varying traffic demand levels, reduces bus carbon emissions, and enhances traffic efficiency at intersections.
Conclusion
In the context of without dedicated bus lanes, the operational state of private vehicles is recognized to significantly influence bus priority strategies. This study introduces the EKF algorithm for predicting bus and signal status data. Building on this, a cooperative control method that integrates signal control and eco-driving speed guidance within a connected environment is proposed. A GA is utilized to optimize the model, and case studies are provided to demonstrate the validity and feasibility of the proposed control method. The results indicate that the bus priority methodology presented here effectively reduces carbon emissions from bus operations while simultaneously decreasing bus delays compared to the NTSP, TSP, and Speed Guidance. Compared to the NTSP, the proposed method reduces average bus delays by 47.51%, 48.54%, and 42.31% for traffic demands of 0.5, 0.7, and 0.9, respectively. Average private vehicle delays decrease by 2.04%, 1.88%, and 2.09% during the same conditions. Additionally, average bus carbon emissions are lowered by 40.28%, 45.63%, and 47.95%, while average private vehicle emissions decrease by 1.50%, 0.71%, and 0.77%.
Despite these contributions, some limitations persist. This study focuses on isolated intersections, acknowledging their interdependent nature. Therefore, prioritizing real-time signal control at arterial intersections is essential. Future research will investigate the integration of eco-driving and signal priority in the absence of dedicated bus lanes. Additionally, the influence of bus stops has not been addressed in this study. The stops of buses can notably impact the effectiveness of speed guidance strategies, making it crucial to consider the role of bus stops when examining arterial intersections. Furthermore, multiple bus lines often traverse all four approaches of an intersection, resulting in instances where buses from different directions are prioritized. While this scenario was not analyzed in the current study, it will be examined in future research. This paper presents an interconnected environment that includes both buses and private vehicles. However, as the prevalence of mixed traffic environments-comprising both human-driven vehicles and connected and autonomous vehicles-increases, future extensions will take vehicle penetration rates into account.
Acknowledgements
This research was supported by the Tackle Key Problems in Science and Technology Project of Henan Province (No. 222102240052), Foundation for High-Level Talents of Henan University of Technology (No. 2018BS029), Doctoral Foundation of Henan University of Technology for Xu Zhang (No. 31400348), and Research Funds for Xu Zhang, Chief Expert of Traffic Engineering (No. 21410003).
Author contributions
H.L.: conceptualization, methodology, formal analysis, writing—original draft, writing—review and editing, project administration, funding acquisition. Y.G.: conceptualization, investigation, data curation, software, writing-original draft. Y.D.: formal analysis, writing—original draft, writing—review and editing, visualization. X.Z.: project administration, supervision, writing—review and editing.
Data availability
The data that support the findings of this study are available from the corresponding author, [Hui Li], upon reasonable request.
Declarations
Competing interests
The authors declare no competing interests.
Footnotes
Publisher’s note
Springer Nature remains neutral with regard to jurisdictional claims in published maps and institutional affiliations.
References
- 1.Eom, M. & Kim, B. The traffic signal control problem for intersections: a review. Eur. Transp. Res. Rev.12, 50 (2020). [Google Scholar]
- 2.Liang, S. et al. Optimal holding time calculation algorithm to improve the reliability of high frequency bus route considering the bus capacity constraint. Reliabi Eng. Syst. Saf.212, 107632 (2021). [Google Scholar]
- 3.Moghimi, B., Kamga, C. & Zamanipour, M. Look-ahead transit signal priority control with self-organizing logic. J. Transp. Eng. A-Syst. 146, 04020045 (2020). [Google Scholar]
- 4.Liu, H. et al. Transit signal priority controlling method considering non-transit traffic benefits and coordinated phase states for multi-rings timing plan at isolated intersections. IEEE Trans. Intell. Transp. Syst.22, 913–936 (2021). [Google Scholar]
- 5.Xu, M. et al. A bi-level model to resolve conflicting transit priority requests at urban arterials. IEEE Trans. Intell. Transp. Syst.20, 1353–1364 (2018). [Google Scholar]
- 6.Bie, Y. et al. Dynamic headway control for high-frequency bus line based on speed guidance and intersection signal adjustment. Comput. -Aided Civ. Infrastruct. Eng.35, 4–25 (2020). [Google Scholar]
- 7.Zeng, X. et al. Route-based transit signal priority using connected vehicle technology to promote bus schedule adherence. IEEE Trans. Intell. Transp. Syst.22, 1174–1184 (2020). [Google Scholar]
- 8.Tajalli, M. & Hajbabaie, A. Dynamic speed harmonization in connected urban street networks. Comput. -Aided Civ. Infrastruct. Eng.33, 510–523 (2018). [Google Scholar]
- 9.Ma, W. et al. Effective coordinated optimization model for transit priority control under arterial progression. Transp. Res. Rec. 2366, 71–83 (2015). [Google Scholar]
- 10.Liu, J., Lin, P. & Ran, B. A reservation-based coordinated transit signal priority method for bus rapid transit system with connected vehicle technologies. IEEE Trans. Intell. Transp. Syst.13, 17–30 (2020). [Google Scholar]
- 11.He, S. et al. An approach to improve the operational stability of a bus line by adjusting bus speeds on the dedicated bus lanes. Transp. Res. Part. C Emerg. Technol.107, 54–69 (2019). [Google Scholar]
- 12.Teng, K. et al. A cooperative control method combining signal control and speed control for transit with connected vehicle environment. IET Control Theory Appl.18, 725–737 (2024). [Google Scholar]
- 13.Beak, B. et al. Peer-to-peer priority signal control strategy in a connected vehicle environment. Transp. Res. Rec. 2672, 15–26 (2018). [Google Scholar]
- 14.Petit, A., Ouyang, Y. & Lei, C. Dynamic bus substitution strategy for bunching intervention. Transp. Res. B-Meth. 115, 1–16 (2018). [Google Scholar]
- 15.Thodi, B., Chilukuri, B. & Vanajakshi, L. An analytical approach to real-time bus signal priority system for isolated intersections. J. Intell. Transp. Syst.26, 145–167 (2022). [Google Scholar]
- 16.Li, H. et al. Dynamic signal priority of the self-driving bus at an isolated intersection considering private vehicles. Sci. Rep.13 (1), 17482 (2023). [DOI] [PMC free article] [PubMed] [Google Scholar]
- 17.Li, J. et al. Review on eco-driving control for connected and automated vehicles. Renew. Sust Energ. Reviews. 189, 114025 (2024). [Google Scholar]
- 18.Shi, D. et al. Pontryagin’s minimum principle based fuzzy adaptive energy management for hybrid electric vehicle using real-time traffic information. Appl. Energy. 286, 116467 (2021). [Google Scholar]
- 19.Zhang, Y. et al. Eco-driving strategy for connected electric buses at the signalized intersection with a station. Transp. Res. D-Tr E. 128, 104076 (2024). [Google Scholar]
- 20.Wu, B. et al. Transit signal priority method based on speed guidance and coordination among consecutive intersections. Transp. Res. Rec. 2677, 1226–1240 (2023). [Google Scholar]
- 21.Sun, P. et al. An eco-driving algorithm based on vehicle to infrastructure (V2I) communications for signalized intersections. Transp. Res. Part. C Emerg. Technol.144, 103876 (2022). [Google Scholar]
- 22.He, X. & Wu, X. Eco-driving advisory strategies for a platoon of mixed gasoline and electric vehicles in a connected vehicle system. Transp. Res. D-Tr E. 63, 907–922 (2018). [Google Scholar]
- 23.Li, S. et al. Robust dynamic bus controls considering delay disturbances and passenger demand uncertainty. Transp. Res. B-Meth. 123, 88–109 (2019). [Google Scholar]
- 24.Rao, W. et al. A transit signal priority strategy with right-turn lane sharing. IEEE Access.8, 6238–6248 (2020). [Google Scholar]
- 25.Guo, G. & Wang, Y. Eco-driving of freight vehicles with signal priority on congested arterial roads. IEEE Trans. Veh.70, 4225–4237 (2021). [Google Scholar]
- 26.Yin, J., Sun, J. & Tang, K. A. Kalman filter-based queue length estimation method with low-penetration mobile sensor data at signalized intersections. Transp. Res. Rec. 2672, 253–264 (2018). [Google Scholar]
- 27.Ravina, M. et al. Traffic-induced atmospheric pollution during the COVID-19 lockdown: dispersion modeling based on traffic flow monitoring in Turin, Italy. J. Clean. Prod.317, 128425 (2021). [DOI] [PMC free article] [PubMed] [Google Scholar]
- 28.Hu, X. et al. Optimization model for bus priority control considering carbon emissions. J. Air Waste Manage.73, 471–489 (2023). [DOI] [PubMed] [Google Scholar]
- 29.Wang, Y., Li, X. & Hu, J. Collaborative optimization model for bus eco-speed guidance and transit signal priority strategy. China J. Highw Transp. 1–16 (2023).
- 30.Sinha, R. & Chaturvedi, N. A graphical dual objective approach for minimizing energy consumption and carbon emission in production planning. J. Clean. Prod.171, 312–321 (2018). [Google Scholar]
- 31.Hu, X. et al. Optimization model for bus priority control considering carbon emissions under non-bus lane conditions. J. Clean. Prod.402, 136747 (2023). [DOI] [PubMed] [Google Scholar]
- 32.Truong, T. et al. Coordinated transit signal priority model considering stochastic bus arrival time. IEEE Trans. Intell. Transp. Syst.20, 1269–1277 (2018). [Google Scholar]
- 33.Krajzewicz, D. et al. Second generation of pollutant emission models for SUMO. In Modeling Mobility with Open Data: 2nd SUMO Conference Berlin, Germany (2014).
- 34.Koch, L. et al. Accurate physics-based modeling of electric vehicle energy consumption in the SUMO traffic microsimulator. In 2021 IEEE International Intelligent Transportation Systems Conference (ITSC) Indianapolis, IN, USA (2021).
- 35.Ma, W., Liu, Y. & Han, B. A rule-based model for integrated operation of bus priority signal timings and traveling speed. J. Adv. Transp.47 (3), 369–383 (2013). [Google Scholar]
Associated Data
This section collects any data citations, data availability statements, or supplementary materials included in this article.
Data Availability Statement
The data that support the findings of this study are available from the corresponding author, [Hui Li], upon reasonable request.


