Abstract
Pupil dilation is considered to track the arousal state linked to a wide range of cognitive processes. A recent article suggested the potential to unify findings in pupillometry studies based on an information theory framework and Bayesian methods. However, Bayesian methods become computationally intractable in many realistic situations. Thus, the present study examined whether pupil responses reflect the amount of information quantified in approximate inference, a practical method in a complex environment. We measured the pupil diameters of 27 healthy adults instructed to predict each subsequent number to be presented in a series, and to update their predictions at several discrete change points when an outcome generation criterion changed. Individual differences in task performance and pupil response were modeled by a variational Bayes method, which quantified prediction uncertainty and change point probability as Kullback-Leibler divergence (DKL) and Shannon’s surprise (SS). This model-based approach revealed that covariance between trial-wise pupil dilation and trial-wise DKL varies depending on prediction accuracy. Further, SS was sensitive to several discrete change points. These findings suggest that the pupil-linked arousal system reflects information divergence during approximate inference in a dynamic environment.
Keywords: Pupillometry, Approximate inference, Information theory, Variational Bayes, Individual difference
Subject terms: Computational neuroscience, Learning algorithms, Neural decoding
Introduction
Due to its low invasiveness, pupillometry has been used as an index of numerous cognitive functions including attention1–5, cognitive load6–8, decision bias9,10, exploitation/exploration trade-off11,12, uncertainty13–16, or surprise17–21. The measured pupillary data in those studies have been interpreted assuming the existence of several independent cognitive functions and various computational models tailored to each task. However, a recent review proposed unifying the findings in pupillometry studies based on an information theory framework and Bayesian methods22.
Statistical inference consists of data analysis and statistics to infer the properties of an underlying distribution of probability. Recent advances in computational neuroscience enable coding brain functions such perception, cognition, learning, motor control, and emotion as statistical inference23–25. For example, perception is considered to result from unconscious inferences about the 3D structure of the environment26 and has been modeled as computational algorithms in computer vision research24. Notably, Bayesian methods have successfully built computational paradigms such as the Bayesian brain, assuming the brain as a statistical organ of hierarchical inference that interprets sensory information on the basis of past experience27,28.
Information theory provides another important tool for solving inference problems, as it mathematically quantifies information. According to Shannon’s information theory29, the information value of an event (E) is expressed as the negative logarithm of the event’s probability (Shannon’s surprise: -log p(E); SS). SS can be understood as quantifying how unlikely an event is; this varies in accordance with pupil size during various cognitive tasks17–21. By contrast, pupil diameter is thought to reflect information gain in inference. The Kullback-Leibler divergence (DKL) is a measure to quantify the difference between two probability distributions30. DKL can be any value between [0, ∞]. If two distributions are the same, then DKL = 0. A previous study retrospectively reanalyzed pupillary data measured during various cognitive tasks using a standard Bayes model-based approach and found that pupil dilation reflects DKL between prior and posterior distributions22. In that study, DKL was interpreted as the amount of information gained after acquiring new data.
Although many previous studies using the Bayesian brain approach assumed that an organism can optimize prediction by rigorous Bayesian leaning and interpret the state of the environment27,31, in everyday life, our inferences cannot always be optimized. In a complex world constantly changing, sometimes recognition converges to the true value but sometimes it does not. Moreover, rigorous Bayesian learning can cause difficulties due to limited resources for brain computation25. For discrete variables, to obtain a marginal likelihood in Bayes’ theorem, the organism needs to use the sum of the probability of generating the observed sample for all possible values of parameters. Thus, approximate inference methods, efficient and computationally tractable by trading off computation time for accuracy, are assumed to be utilized in the brain. Approximate inference requires to assess the uncertainty of model predictions to optimize inference. As mentioned earlier, pupil size is thought to reflect prediction uncertainty in cognitive tasks13–16. However, how the pupil-linked arousal system can be implemented in an approximate inference model remains unclear.
Here, we hypothesized that the human brain tries to find a likely probability density instead of rigorously finding a posterior and that the pupil-linked arousal system conveys information divergence between an approximation and a posterior in this approximate inference as an objective function. The current study subjected 27 adults to an inference task (the predictive inference task) and measured pupil diameter meanwhile. Participants were instructed to predict each subsequent number presented in a series, to minimize the average error on all predictions. Participants were required to rely directly on unobservable task representations to estimate the likely outcomes and update their predictions at several discrete change points when an outcome generation criterion changed. We proposed a variational Bayes model to quantify the degree of difference between one’s approximate distribution and a posterior distribution generated by computing statistical properties of gained information automatically as DKL. To clarify the difference between the variational Bayes model and a conventional Bayes model, we also performed a simulation using a Bayesian model, which has been used in the predictive inference task15. Moreover, SS was used to detect change points in the model. Based on this model-based approach, we examined the relationship between DKL/SS and pupil responses to reveal the role of the arousal system in human inference.
Methods
Participants
Twenty-seven adults (14 women; mean age [SD] = 37.3 [10.0]) participated in this study. All participants had normal or corrected-to-normal vision and normal hearing. Participants were restricted from consuming caffeine and/or nicotine on the experimental day. They were also naïve to the task. The experiment was approved by the ethics committee at the National Center of Neurology and Psychiatry, Tokyo, (approval number: A2020-069) and conducted according to the principles in the Declaration of Helsinki. All participants provided written informed consent prior to the study.
Stimuli and procedure
The participants sat in a lit room facing a monitor screen, subtending 50.9 × 28.6° of visual angle at 60 cm. The task was preceded by a calibration procedure for which the participants were required to fixate a target on the monitor screen. Stimuli were generated using the Psychophysics Toolbox routines for MATLAB (Version R2020b, Math Works Ltd, http://www.mathworks.com/) and presented on a 27-inch LCD monitor (1920 × 1080 pixels at 60 Hz, 53.4° × 31.6° of visual angle) driven by a PC (Windows 10).
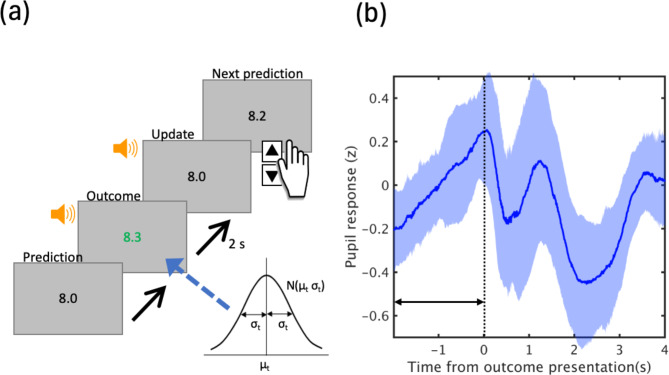
The present study used the predictive inference task15, where for each trial (t) a single integer xt (outcome) sampled from a Gaussian distribution whose mean (μt) changed at non-signaled change points with a hazard rate of 0.1 and fixed SD (σt) of 0.25 in 200 test trials was presented (Fig. 1). Twenty practice trials were conducted before the test phase and repeated if necessary. At each change point, μt increased/decreased randomly by five. Participants were instructed to predict numbers close to a certain number and serially presented on a monitor screen and to fixate the center of the screen during the task. They were also told that the focal number suddenly changed and that their prediction needs to be updated depending on the change. The task required participants to predict each subsequent number relying on unobservable task representations to estimate likely outcomes, and flexibly change their beliefs at several change points when an outcome generation criterion changed. Participants pressed the up arrow or down arrow keys to provide the number which was likely presented in the next trial. After pressing the Enter key, a new outcome was presented for 2 s and replaced by the former prediction. Then, an auditory cue was played to inform that the prediction should begin. All participants were shown the same sequence of numbers.
Fig. 1.
Experimental design. (a) For each trial (t) a single integer xt (outcome) sampled from a Gaussian distribution whose mean (μt) changed at non-signaled change points with a hazard rate of 0.1 and fixed SD (σt) of 0.25 in 200 test trials was presented. (b) Time course of grand-averaged pupil dilations (solid line) from 25 participants (200 trials each). A shaded error band represents standard deviation of the mean. Mean pupil diameter was computed for each trial, z-scored by participant, across the 2-s time window before outcome presentation (indicated by an arrow).
During the inference task, the participants’ eye position and pupil diameter were monitored using a glass type eye tracker (model: Tobii Glass 3, Tobii Technology, Stockholm, Sweden; sampling rate: 100 Hz). MATLAB was used to process and analyze pupil data. As pupillary data contained missing values as well as noise induced by eye blinks, we removed blinks by linear interpolation. Blink-removed data was filtered using a low-pass filter with a cutoff frequency of 3.75 Hz. The mean pupil size was computed for each trial by taking the mean of all 200 z-scored pupil data from the 2-s time window before outcome presentation. We chose this period as several previous studies have reported that pupil size transiently increases during effortful decisions reflecting decision uncertainty9,16. Two individuals were eliminated from further analyses due to excessive data loss.
Modeling
Variational Bayes model
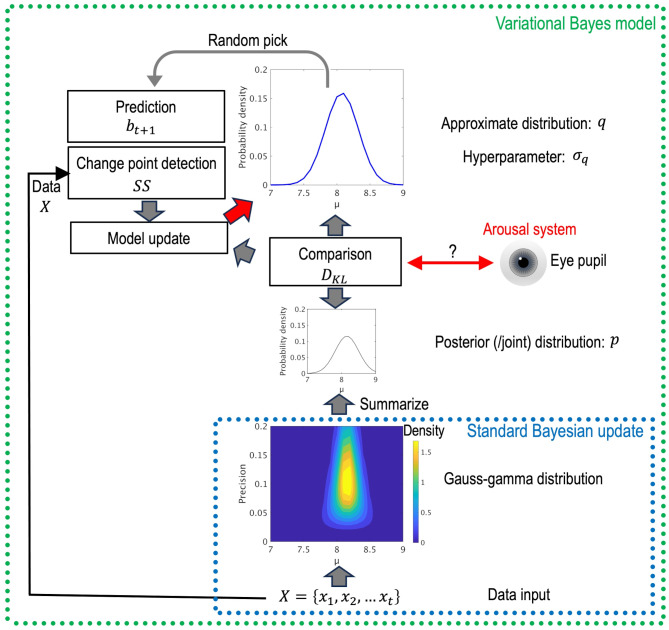
Figure 2 shows the conceptual diagram of the variational Bayes model. Standard Bayesian update estimates the parameters of the outcome-generating distribution in the form of a Gauss-gamma distribution. By contrast, the variational Bayes model is based on the idea that humans try to infer an optimal approximate distribution of the true posterior probability distribution of unobserved variables (μt,σt) by decreasing the dissimilarity of these two probability distributions expressed. In this model, differences in approximation precision induce individual difference in task performance. As mentioned earlier, variational Bayes methods are used when there is difficulty in computing a true posterior distribution by utilizing DKL as an objective function. The model derives a solution using an alternative called a joint probability density, which can be calculated easily in Bayes theorem. The variational Bayes model also detects a change point based on SS and predicts the next outcome by randomly picking a value from the approximate distribution (q).
Fig. 2.
Conceptual diagram of the variational Bayes model. Standard Bayesian update estimates the unknown characteristics of the data-generating distribution in the form of a Gauss-gamma distribution (dotted blue line). By contrast, the variational Bayes model (dotted green line), which is a type of approximate inference, sets and modifies an arbitrary approximate (q) based on DKL, indicating the difference between the approximate (q) and true posterior (p).
A detailed look at the process: the model assumes that incoming data X = {x1,x2,…xt} are independent random samples arising from a normal distribution N(µ,λ−1), where the parameters µt,λ(= 1/σ2) are unknown, and estimates the posterior distribution of µ, λ. First, we need to break the posterior p(µ,λ|X), joint distribution of µ and λ into likelihood and prior using Bayes theorem.
| 1 |
Here,
| 2 |
i.e., posterior ∝ prior × likelihood.
We can obtain a Gauss-gamma distribution as posterior by assuming the prior in the same format with fixed parameter m, β, a, b:
| 3 |
The likelihood p(X|μ,λ) is given by:
| 4 |
Moreover, a normalized prior can form a Gauss-gamma distribution where the constants are
| 5 |
If we have data X, the updated posterior is written as follows:
| 6 |
The updated posterior p(µ,λ|X) can be decomposed into the µ’s posterior p(µ|λ,X) and the λ’s posterior p(λ|X) using the multiplication theorem on probability:
| 7 |
The µ’s posterior p(µ|λ,X) is given by:
| 8 |
where the updated parameters
| 9 |
Then, the λ’s posterior p(λ|X) can be written as follows:
| 10 |
The obtained posterior takes the same form as that of the prior, including the four parameters (m, β, a, b) based on incoming data:
| 11 |
To facilitate handling, the posterior is assumed as a Gaussian distribution as follows:
| 12 |
Next, we can compute the DKL between the obtained posterior (p) and an approximate (q) to consider in the prediction for the next (t + 1) trial. Here, the approximate q is a normal distribution. DKL quantifies the distance between two probability distributions and becomes zero when those distributions are equivalent:
| 13 |
In addition, DKL can be calculated assuming q and p as a normal distribution as follows:
| 14 |
where the parameters of q and p are μq, σq, μp, σp. Furthermore, we set σq as a hyperparameter to duplicated individual differences in task performance and changed it within the range of σp (0.37–1.42) which was obtained by a Bayesian update. The lowest value was obtained by utilizing all outcomes between change points whereas the highest value was obtained by utilizing one outcome in the calculation. This parameter range was chosen based on the assumption that σq takes a range similar to σp because the VB model has an approximate calculation processes of a Bayesian update. The model assumes individuals whose σq is close to the true value of the outcome-generating process (σt) show high prediction accuracy. In contrast, the model predicts individuals whose σq is far from the true value show inaccurate prediction. More precisely, prediction accuracy could change within individuals during the task. However, we set σq as a constant during the task for simplicity.
To calculate a change point probability, SS is explained by the negative log probability of the likelihood (-log(p(X|μq,σq))). SS may be useful to detect a change point because the quantity shows a transient elevation when observing a rare event in the model, showing barely any changes in trials other than change points. The above-mentioned process was repeated updating μq to μp in every trial.
Reduced Bayesian model
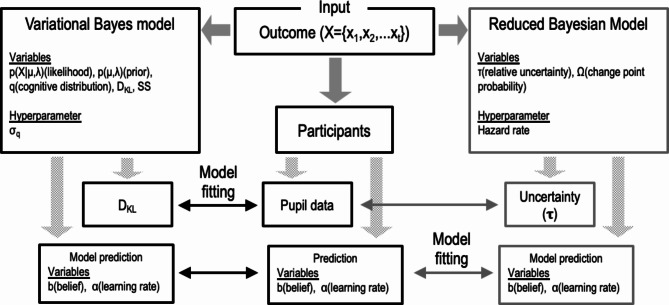
Figure 3 shows differences in model variables and simulation processes between the variational Bayes model used in this study and the reduced Bayesian model used by Nassar et al. 2012 as a schematic diagram. The reduced Bayesian model is based on the idea that optimal performance on the predictive inference task requires inferring a probability distribution of possible outcomes on the next trial, given all previous data (x1, x2,.xt−1) and the process whereby those data were generated. This model is a simplified version of a full Bayesian model and was designed to decrease the variance (σt2) on the predictive distribution in the model by accumulating data. In each trial, the change point probability (Ωt) was estimated utilizing Bayes theorem; then, the uncertainty on the mean of the outcome-generating distribution in the next trial (τt+1) was calculated based on change point probability, uncertainty in a previous trial, and other variables. If a change point occurs when change point probability exceeds a threshold, uncertainty is reset to a peak value (0.5); if a change point does not occur, uncertainty gradually decreases. Then, the model estimated the learning rate which determines how much the person change their prediction in the next trial. Nassar et al. (2012) represented individual differences in task performance by incorporating the hazard rate into the model as a hyperparameter. They showed that average pupil diameter reflected belief uncertainty (τt) during the outcome-viewing period, and that both tended to peak on the trial after a change point later decreasing in magnitude with accumulating information.
Fig. 3.
Schematic diagram of the simulation process.
Statistical analysis
To examine individual difference in task performance, we calculated the learning rate (
| 15 |
The learning rate has been used to describe the characteristics of belief updating15,32,33. When αt = 0, the updated belief maintains the previous belief but not the latest outcome. When αt = 1, the updated belief prioritizes the latest outcome but not the previous belief. Moreover, a moderate update integrates new and old information. We examined the participants’ updating strategy by using the leaning rate. We assumed that individuals with lower learning rate performed the task better than individuals with higher learning rate, given a hazard rate of the predictive inference task of 0.1. We divided participants into two groups (top 50% and bottom 50%) based on learning rate and compared the mean deviation between prediction and μt point-wise by a Bonferroni-corrected two-sided t-test. The significance level was defined as 0.05.
Next, we examined the association between trial-wise DKL and pupil responses during the decision-making period (2 s before bottom press). To diminish the influence of internal fluctuations in pupil size, averaging was performed on the model estimating DKL and z-scored pupil size for each participant as a function of trials relative to task change points. Then, we fitted the variational Bayes model to participant pupil data by minimizing the total squared difference between DKL and pupil size using σq as a hyper parameter after adjusting the gap between each average value. The estimated σq and average learning rate for each participant in behavioral data were included in a correlation analysis to determine whether the variational Bayesian model can explain participant behavior and pupil responses in the predictive inference task. Additionally, a simple regression analysis was conducted to find the association between trial-wise DKL and pupil size in the decision-making period for each participant.
Results
Individual differences in behavioral performance
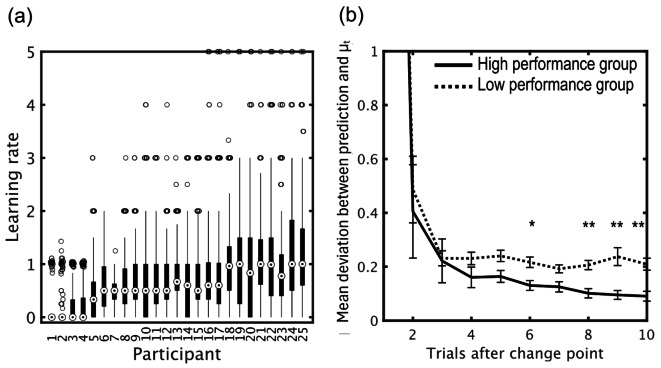
Figure 4(a) shows individual differences in learning rate. As shown in Fig. 4(b), the low performance group tended to predict values significantly further from the mean on the outcome-generating distribution with increasing trials after a change point compared to the high performance group.
Fig. 4.
Individual difference in task performance. (a) Learning rate distributions across trials from the 25 participants, sorted by median learning rate. For each individual, we drew a box extending from the 25th to the 75th percentiles with the median in the distribution of learning rates. Whiskers indicate most extreme data not considered as an outlier. (b) Group differences in prediction accuracy. The low performance group showed significantly larger mean deviation between the prediction and μt with increasing trials after the change point. *p < 05, **p < 01, Bonferroni-corrected t-tests, two tailed (N = 25, group mean ± SE).
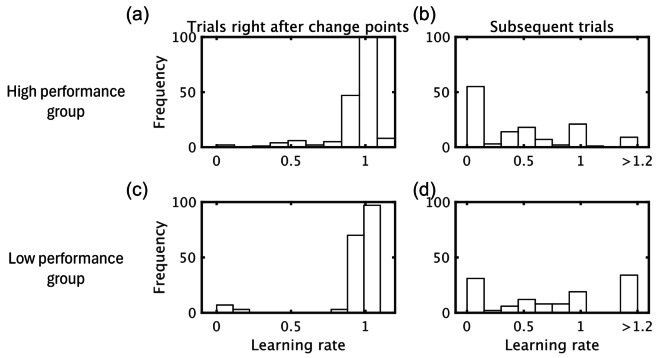
For further understanding of individual differences in task performance, we evaluated group differences in learning rate histograms in trials right after change points, and subsequent trials (2–10 trials after change points; Fig. 5). In trials after change points, both groups had a peak in the vicinity of 1.0 in learning rate. By contrast, in subsequent trials, the high performance group had a peak nearly at a learning rate of 0, while the low performance group had peaks at both the lowest (≃0) and highest (> 1.2) learning rates.
Fig. 5.
Learning rate histograms depicting the relative frequency with which the low and high performance groups used trial learning rates in the trials after change points (one trial after change point trials) and subsequent trials (2–10 trials after change point trials).
Simulation and model fitting
Model comparison
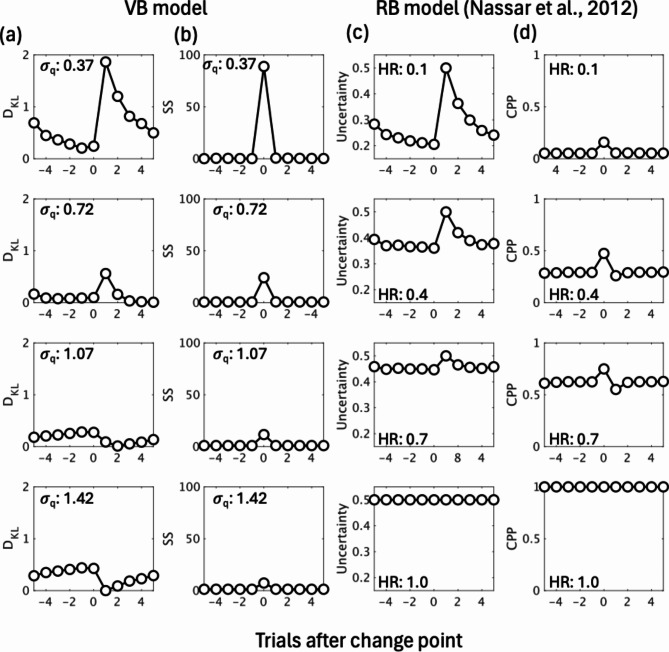
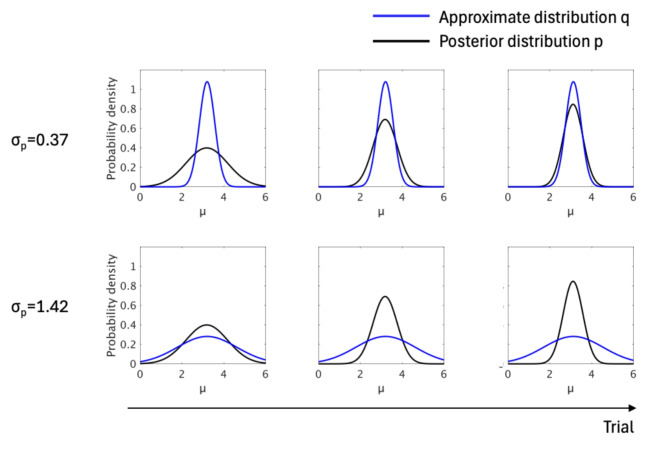
To compare the performance of the variational Bayes model versus the reduced Bayesian model, we calculated DKL and prediction uncertainty based on these models under various hyperparameters. When the SD of a posterior approximation (σq) was close to that of an outcome-generating distribution (σt) of the task, the DKL estimated by the variational Bayes model tended to be maximized right after change points, decreasing gradually in subsequent trials (Fig. 6(a)). When σq became larger (more inaccurate), DKL tended to decrease right after a change point and increased in subsequent trials. The VB model can cause diverse patterns in DKL since it contains a comparison process between the approximate distribution (q) and the posterior distribution (p) (Fig. 7). In contrast, the uncertainty estimated by the reduced Bayesian model acted similarly to DKL, estimated by the variational Bayes model with an optimal parameter when the model’s hazard rate was comparable to the true change point probability of the task, while the estimated uncertainty remained higher across trials with increasing hazard rate. Moreover, the two models estimated SS/change point probability differently. The variational Bayes model induced a spike at change points, and SS attenuated with increasing σq (Fig. 6(b)) while the change point probability estimated by the reduced Bayesian model tended to be higher across trials with increasing hazard rate (Fig. 6(d)). Figure 8 also shows the predictive inference task and its relationship to the variational Bayes model across change points.
Fig. 6.
Comparison of the two models’ estimates. (a) DKL and (b) SS estimated by the variational Bayes model with various hyperparameter values (𝜎q). (c) Uncertainty and (d) change point probability (CPP) estimated by the reduced Bayesian model with various hazard rate (HR) values. Both VB and RB models with optimal hyperparameter values predicted similar changes in DKL /uncertainty. This pattern gradually reversed as σq increased (more inaccurate) in the VB model. By contrast, the estimated uncertainty remained higher across trials with an increasing HR. VB model: variational Bayes model; RB model: reduced Bayesian model.
Fig. 7.
Association between approximate distribution (q) and posterior distribution (p) in different hyperparameters. When a lower σq (0.37) is used as a hyperparameter the difference (DKL) between q and p decreases whereas the difference between them increases for a higher σq (1.42).
Fig. 8.
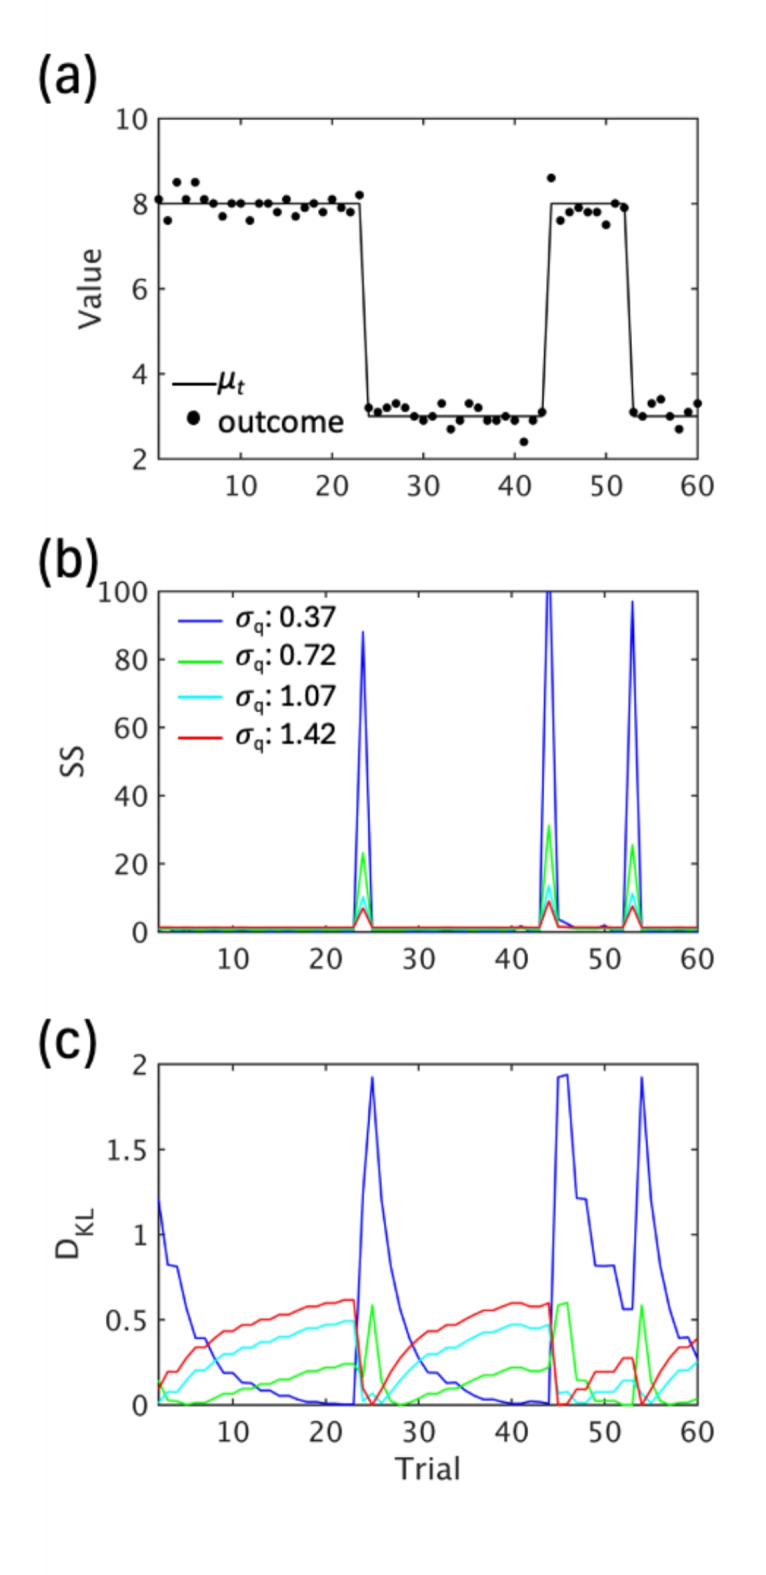
Predictive inference task and its relationship to VB model across change points. (a) A part of the session. Numbers (black dots) are generated from a normal distribution whose mean (μt) changes at change points. (a) SS and (b) DKL estimated by the variational Bayes model with various hyperparameter values (𝜎q) as a function of trials.
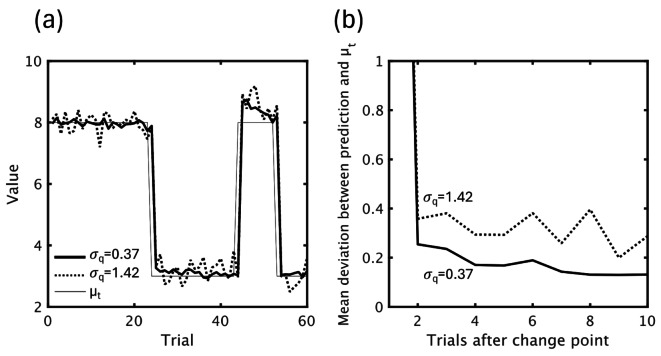
Although the variational Bayes model cannot output a single predictive value because it follows a normal distribution, we estimated model predictions with different prediction accuracy by averaging random numbers generated from q(𝜎q, 𝜇q) after 20 iterations. A model with a lower σq (0.37) predicted values closer to μt after change points, while a model with larger σq (1.42) showed large fluctuations in predictions (Fig. 9).
Fig. 9.
VB Model predictions calculated with different hyperparameters (σq). (a) Model prediction with different σq values (0.37, 1.42) over the course of the first 60 trials. (b) Mean deviation between model prediction and μt with different σq values.
Model fitting
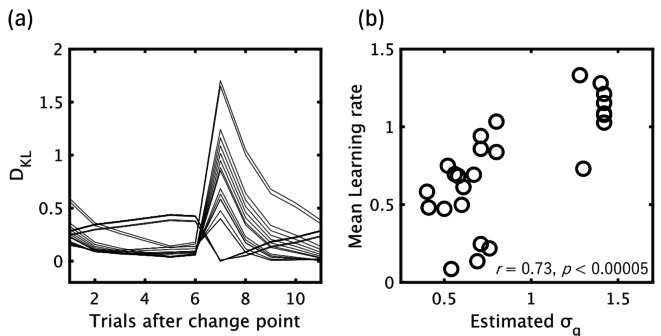
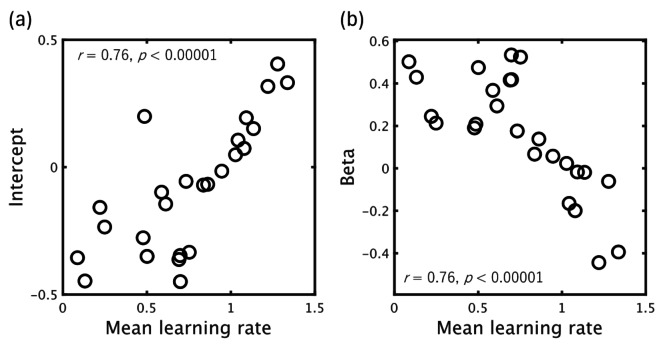
Figure 10 shows the results of model fitting. As mentioned previously, to decrease the influence of internal fluctuations in pupil response, we averaged both z-scored pupil size and the model estimated DKL based on the number of trials after change points for each participant, fitting the variational Bayes model to pupil data by minimizing the total squared difference (Fig. 10 (a)). We found a significant positive correlation between the participants’ σq estimated by the model and the average learning rate calculated from each participant’s behavioral data over 200 trials (r = 0.73, p < 0.00005; Fig. 10(b)). Moreover, we also observed a positive correlation between individual learning rate and the intercepts/slopes calculated by a simple regression analysis between trial-wise DKL, as estimated by an optimal variational Bayes model (σq = 0.37) and the pupil size for each participant. Figure 11 shows that individuals with lower learning rates tended to increase pupil size, in agreement with the DKL estimated by an optimal model, but this tendency reversed with increasing individual learning rate.
Fig. 10.
Model fitting results. (a) Estimated DKL with the variational Bayes model with different σq fitted per individual. (b) Association between mean learning rate per participant and estimated σq. Each point indicates separately computed data for each participant.
Fig. 11.
Association between mean learning rate per participant and intercept (a)/beta (b) obtained by simple regression analysis between trial-wise DKL (estimated by an optimal variational Bayes model [σq = 0.37]) and pupil size for each participant. Points correspond to regression intercepts or coefficients (beta) calculated separately for each participant.
Discussion
In a complex environment where Bayesian inference often becomes computationally intractable, approximate inference has been believed to a realistic method. However, conventional research has not clearly shown how human brain uses the amount of information and uncertainty in prediction in approximate inference13–16,22. Our model-based approach sheds a light on a possibility that the pupil-linked arousal system conveys information for optimizing learning in approximate inference.
Information theory mathematically quantifies information and uncertainty in prediction using DKL and SS. In our study, the variational Bayes model predicted that an observer can optimize predictions when modifying the approximate distribution such that DKL decreases. In fact, both estimated DKL and trial-wise pupil responses tended to be maximized at trials after change points, decreasing gradually in subsequent trials in the high performance group. Moreover, their predictions tended to converge to μt, the mean outcome-generating distribution, in successive trials after change points and tended to be similar to model predictions simulated by the variational Bayes model with a lower σq. In contrast, the low performance group showed an increase in DKL and trial-wise pupil response as a function of trials after change points, showing large fluctuations in their prediction (Fig. 4(b)) as suggested in a simulation with larger σq.
In contrast, although SS was useful to detect a change point in the present study, it exhibited a short-lived intense response at a change point and did not fit the pattern observed in pupil responses (Fig. 6(b)). Those findings suggest that the variational Bayes model computes DKL, changing in agreement with participants’ pupil fluctuations in a performance dependent fashion and that the pupil-linked arousal system works differently between precise and imprecise inference. Although our model analytically computes the posterior based on incoming data in the predictive inference task, computing a posterior may be impossible in more complex tasks. Approximate inference methods may demonstrate its strength to optimize predictions by utilizing a joint probability instead of a posterior in such circumstances.
Comparing the variational Bayes model with a previous model clarified both common and different behaviors of these models. As mentioned earlier, a previous study described the association between trial-wise pupil dilation and prediction uncertainty estimated by the reduced Bayesian model15. This model explains individual performance differences taking hazard rate (HR) as a hyperparameter. The HR ranges between [0, 1.0]. For a HR of 1.0, all trials become a change point. Importantly, the previous study did not allow a leaning rate > 1, by constraining predictions between the previous prediction and the most recent outcome. Thus, the leaning rate ranges from 0 to 1.0, being 1.0 in trials right after a changepoint in this model. Comparatively, the learning rate predicted by the variational Bayes model can be > 1.0 because predictions are randomly picked from a Gaussian distribution (q). Furthermore, a detailed analysis of learning rate showed that both performance groups showed a peak close to 1.0 in learning rate in trials right after change points (Fig. 5(a)(c)). In subsequent trials, these groups showed different patterns in learning rate histograms (Fig. 5(b)(d)). Especially, the low performance group had peaks appearing at both the lowest (≃0) and highest (> 1.2) learning rates, indicating a different distribution pattern in successive trials from those in trials right after the change point. This does not fit the high HR status where participants more frequently detect a change point even in successive trials. Worse performance in the predictive inference task can be explained by an imprecise approximate account as shown in our study, but it warrants further research.
Since DKL and SS quantify information and assess prediction uncertainty in inference as explained by information theory, DKL and SS play a role in inference optimization. Those measures are embedded in the free energy principle, a theoretical framework suggesting that the brain reduces surprise or uncertainty by minimizing an information quantity referred to as “free energy” 34.
| 16 |
Here, the
In such a case, how can inference be optimized by the pupil-linked arousal system in the brain? Adaptive behavior in a dynamic environment requires a rapid reorganization of all neural networks in the entire brain. The locus coeruleus norepinephrinergic (LC-NE) system is the neural basis –or at least part – for the functional alterations, as its broad projections change activity across a substantial portion of the brain35. The LC-NE system causes changes in neuronal activity and network connectivity and underlies a broad range of brain functions, including arousal, attention, and learning36,37. As some lines of evidence, including monkey electrophysiology38,39 and pharmacology in healthy adults and patients40,41, support a link between pupil dilation and the LC-NE system, the pupil-linked arousal system appears to act as a trigger to update the brain’s internal model involving a wide range of brain areas.
Despite the present insights, the present study has some limitations that will need to be addressed in future research. First, it is still an unsolved problem what circumstances pupil size reflects DKL and SS. As aforementioned, previous pupillometry studies found pupil responses corresponding to the scarcity of an event17–21. For example, Alamia et al. (2019) measured participants’ pupil responses during an implicit learning task requiring them to report the appearance of a fifth letter in a stream of letters. Pupil size dilated when stimuli violated transition statistics not relevant to the task. Interestingly, pupil size increased following surprising events, in the absence of awareness of transition statistics, and only when attention was allocated to the stimulus. In contrast, in the framework of the free energy principle, DKL is used for perceptual inference of sensory data while SS is utilized for changing sensory data by action to meet predictions. SS is no longer beneficial in a consistent environmental state because marginal likelihood becomes constant. Taken together, the roles of DKL and SS need to be examined from the aspects of perception and action in future research. Another limitation of the present study is the simplification of the approximate inference. To replicate individual differences in task performance, we maintained the precision of the approximate distribution constant within an individual. However, participants might change the precision of the approximate distribution while listening to an instruction, practicing, or since the test started. In the field of machine learning, a gradient descent method has been used to optimize approximate inference. Accordingly, how observers produce approximate distributions with various precision needs to be investigated.
In conclusion, a variational Bayes model explained complex individual differences in pupil responses as well as in prediction convergence depending on the precision of the approximate distribution. The results suggest that the pupil-linked arousal system reflects information divergence between the participants’ approximate distribution and a posterior distribution of incoming data in a dynamic environment. Our findings expand the current knowledge of approximate inference and the arousal system, helping advance our understanding of human inference and its neural basis.
Author contributions
A.S.: conceptualization, investigation, data curation, project administration, writing, S.N.: conceptualization, data curation, supervision, manuscript review & editing, T.S.: conceptualization, supervision, manuscript review & editing.
Funding
This publication was supported by JSPS KAKENHI through a Grant-in-Aid for Scientific Research/Transformative Research Areas ((A)JP20H05921 (to S.N.); (B)JP23H03610 (to A.S. and T.S.); (C) JP23K03024 (to A.S.); (C) JP22K12183 (to S.N.)), Intramural Research Grant (5 − 3,6 − 1)(to T.S.) for Neurological and Psychiatric Disorders of the National Center of Neurology and Psychiatry, and AMED Grant (JP24dk0307114)(to T.S.).
Data availability
The ethics protocol does not allow sharing raw and preprocessed pupil data via a public repository. Data may be shared however within the context of a collaboration. The MATLAB code for our computational model in Fig. 5 will be made available on reasonable request. In order to obtain the data or the source code, an e-mail to the author responsible for the data sets is required (Aya Shirama, shiramaaya@gmail.com).
Declarations
Competing interests
The authors declare no competing interests.
Footnotes
Publisher’s note
Springer Nature remains neutral with regard to jurisdictional claims in published maps and institutional affiliations.
References
- 1.Aston-Jones, G. & Cohen, J. D. An integrative theory of locus coeruleus-norepinephrine function: adaptive gain and optimal performance. Annu. Rev. Neurosci.28, 403–450 (2005). 10.1146/annurev.neuro.28.061604.135709 [DOI] [PubMed] [Google Scholar]
- 2.Smallwood, J. et al. Pupillometric evidence for the decoupling of attention from perceptual input during offline thought. PLoS One. 6, e18298 (2011). 10.1371/journal.pone.0018298 [DOI] [PMC free article] [PubMed] [Google Scholar]
- 3.Unsworth, N. & Robison, M. K. Pupillary correlates of lapses of sustained attention. Cogn. Affect. Behav. Neurosci.16, 601–615 (2016). 10.3758/s13415-016-0417-4 [DOI] [PubMed] [Google Scholar]
- 4.van den Brink, R. L., Murphy, P. R. & Nieuwenhuis, S. Pupil diameter tracks lapses of attention. PLoS One. 11, e0165274 (2016). 10.1371/journal.pone.0165274 [DOI] [PMC free article] [PubMed] [Google Scholar]
- 5.Wierda, S. M., van Rijn, H., Taatgen, N. A. & Martens, S. Pupil dilation deconvolution reveals the dynamics of attention at high temporal resolution. Proc. Natl. Acad. Sci. U S A. 109, 8456–8460 (2012). 10.1073/pnas.1201858109 [DOI] [PMC free article] [PubMed] [Google Scholar]
- 6.Alnæs, D. et al. Pupil size signals mental effort deployed during multiple object tracking and predicts brain activity in the dorsal attention network and the locus coeruleus. J. Vis.14, 1–1 (2014). 10.1167/14.4.1 [DOI] [PubMed] [Google Scholar]
- 7.van der Wel, P. & Van Steenbergen, H. Pupil dilation as an index of effort in cognitive control tasks: a review. Psychon Bull. Rev.25, 2005–2015 (2018). [DOI] [PMC free article] [PubMed] [Google Scholar]
- 8.Wright, T. J., Boot, W. R. & Morgan, C. S. Pupillary response predicts multiple object tracking load, error rate, and conscientiousness, but not inattentional blindness. Acta Psychol.144, 6–11 (2013). 10.1016/j.actpsy.2013.04.018 [DOI] [PubMed] [Google Scholar]
- 9.de Gee, J. W., Knapen, T. & Donner, T. H. Decision-related pupil dilation reflects upcoming choice and individual bias. Proc. Natl. Acad. Sci.111, E618–E625 (2014). 10.1073/pnas.1317557111 [DOI] [PMC free article] [PubMed] [Google Scholar]
- 10.Krishnamurthy, K., Nassar, M. R., Sarode, S. & Gold, J. I. Arousal-related adjustments of perceptual biases optimize perception in dynamic environments. Nat. Hum. Behav.1, 0107 (2017). 10.1038/s41562-017-0107 [DOI] [PMC free article] [PubMed] [Google Scholar]
- 11.Gilzenrat, M. S., Nieuwenhuis, S., Jepma, M. & Cohen, J. D. Pupil diameter tracks changes in control state predicted by the adaptive gain theory of locus coeruleus function. Cogn. Affect. Behav. Neurosci.10, 252–269 (2010). 10.3758/CABN.10.2.252 [DOI] [PMC free article] [PubMed] [Google Scholar]
- 12.Jepma, M. & Nieuwenhuis, S. Pupil diameter predicts changes in the exploration-exploitation trade-off: evidence for the adaptive gain theory. J. Cogn. Neurosci.23, 1587–1596 (2011). 10.1162/jocn.2010.21548 [DOI] [PubMed] [Google Scholar]
- 13.Browning, M., Behrens, T. E., Jocham, G., O’reilly, J. X. & Bishop, S. J. Anxious individuals have difficulty learning the causal statistics of aversive environments. Nat. Neurosci.18, 590–596 (2015). [DOI] [PMC free article] [PubMed] [Google Scholar]
- 14.de Berker, A. O. et al. Computations of uncertainty mediate acute stress responses in humans. Nat. Commun.7, 10996 (2016). 10.1038/ncomms10996 [DOI] [PMC free article] [PubMed] [Google Scholar]
- 15.Nassar, M. R. et al. Rational regulation of learning dynamics by pupil-linked arousal systems. Nat. Neurosci.15, 1040–1046 (2012). 10.1038/nn.3130 [DOI] [PMC free article] [PubMed] [Google Scholar]
- 16.Urai, A. E., Braun, A. & Donner, T. H. Pupil-linked arousal is driven by decision uncertainty and alters serial choice bias. Nat. Commun.8, 14637 (2017). ARTN 1463710.1038/ncomms14637. [DOI] [PMC free article] [PubMed] [Google Scholar]
- 17.Alamia, A., VanRullen, R., Pasqualotto, E., Mouraux, A. & Zenon, A. Pupil-linked arousal responds to unconscious surprisal. J. Neurosci.39, 5369–5376 (2019). 10.1523/JNEUROSCI.3010-18.2019 [DOI] [PMC free article] [PubMed] [Google Scholar]
- 18.Lavín, C., San Martín, R. & Rosales Jubal, E. Pupil dilation signals uncertainty and surprise in a learning gambling task. Front. Behav. Neurosci.7, 218 (2014). 10.3389/fnbeh.2013.00218 [DOI] [PMC free article] [PubMed] [Google Scholar]
- 19.O’Reilly, J. X. et al. Dissociable effects of surprise and model update in parietal and anterior cingulate cortex. Proc. Natl. Acad. Sci.110, E3660–E3669 (2013). 10.1073/pnas.1305373110 [DOI] [PMC free article] [PubMed] [Google Scholar]
- 20.Preuschoff, K., ’t Hart, B. M. & Einhäuser, W. Pupil dilation signals surprise: evidence for noradrenaline’s role in decision making. Front. Neurosci.5, 115 (2011). 10.3389/fnins.2011.00115 [DOI] [PMC free article] [PubMed] [Google Scholar]
- 21.Qiyuan, J., Richer, F., Wagoner, B. L. & Beatty, J. The pupil and stimulus probability. Psychophysiology. 22, 530–534 (1985). 10.1111/j.1469-8986.1985.tb01645.x [DOI] [PubMed] [Google Scholar]
- 22.Zénon, A. Eye pupil signals information gain. Proc. R Soc. B. 286, 20191593 (2019). 10.1098/rspb.2019.1593 [DOI] [PMC free article] [PubMed] [Google Scholar]
- 23.Barrett, L. F. How Emotions are made: The Secret life of the Brain (Pan Macmillan, 2017). (Japanese version).
- 24.Kawato, M., Hayakawa, H. & Inui, T. A forward-inverse optics model of reciprocal connections between visual cortical areas. Netw. Comput. Neural Syst.4, 415 (1993). [Google Scholar]
- 25.Parr, T., Pezzulo, G. & Friston, K. J. Active Inference: The free Energy Principle in mind, Brain, and Behavior (MIT Press, 2022). (Japanese version).
- 26.Von Helmholtz, H. Handbuch Der Physiologischen Optik. Vol. 9 (Voss, 1867).
- 27.Doya, K. Bayesian Brain: Probabilistic Approaches to Neural Coding (MIT Press, 2007).
- 28.Knill, D. C. & Pouget, A. The Bayesian brain: the role of uncertainty in neural coding and computation. Trends Neurosci.27, 712–719 (2004). 10.1016/j.tins.2004.10.007 [DOI] [PubMed] [Google Scholar]
- 29.Shannon, C. E. A mathematical theory of communication. Bell Syst. Tech. J.27, 379–423 (1948). [Google Scholar]
- 30.Kullback, S. & Leibler, R. A. On information and sufficiency. Ann. Math. Stat.22, 79–86 (1951). [Google Scholar]
- 31.Kording, K. P. Bayesian statistics: relevant for the brain? Curr. Opin. Neurobiol.25, 130–133 (2014). 10.1016/j.conb.2014.01.003 [DOI] [PMC free article] [PubMed] [Google Scholar]
- 32.Nassar, M. R., Waltz, J. A., Albrecht, M. A., Gold, J. M. & Frank, M. J. All or nothing belief updating in patients with schizophrenia reduces precision and flexibility of beliefs. Brain. 144, 1013–1029 (2021). [DOI] [PMC free article] [PubMed] [Google Scholar]
- 33.Nassar, M. R., Wilson, R. C., Heasly, B. & Gold, J. I. An approximately Bayesian delta-rule model explains the dynamics of belief updating in a changing environment. J. Neurosci.30, 12366–12378 (2010). 10.1523/JNEUROSCI.0822-10.2010 [DOI] [PMC free article] [PubMed] [Google Scholar]
- 34.Friston, K., Kilner, J. & Harrison, L. A free energy principle for the brain. J. Physiol. Paris. 100, 70–87 (2006). 10.1016/j.jphysparis.2006.10.001 [DOI] [PubMed] [Google Scholar]
- 35.Foote, S. L., Bloom, F. E. & Aston-Jones, G. Nucleus locus ceruleus: new evidence of anatomical and physiological specificity. Physiol. Rev.63, 844–914 (1983). 10.1152/physrev.1983.63.3.844 [DOI] [PubMed] [Google Scholar]
- 36.McBurney-Lin, J., Lu, J., Zuo, Y. & Yang, H. Locus coeruleus-norepinephrine modulation of sensory processing and perception: a focused review. Neurosci. Biobehav Rev.105, 190–199 (2019). [DOI] [PMC free article] [PubMed] [Google Scholar]
- 37.Viglione, A., Mazziotti, R. & Pizzorusso, T. From pupil to the brain: new insights for studying cortical plasticity through pupillometry. Front. Neural Circuit. 17, 1151847 (2023). [DOI] [PMC free article] [PubMed] [Google Scholar]
- 38.Joshi, S., Li, Y., Kalwani, R. M. & Gold, J. I. Relationships between pupil diameter and neuronal activity in the locus coeruleus, colliculi, and cingulate cortex. Neuron. 89, 221–234 (2016). 10.1016/j.neuron.2015.11.028 [DOI] [PMC free article] [PubMed] [Google Scholar]
- 39.Varazzani, C., San-Galli, A., Gilardeau, S. & Bouret, S. Noradrenaline and dopamine neurons in the reward/effort trade-off: a direct electrophysiological comparison in behaving monkeys. J. Neurosci.35, 7866–7877 (2015). 10.1523/JNEUROSCI.0454-15.2015 [DOI] [PMC free article] [PubMed] [Google Scholar]
- 40.Jepma, M. et al. Neurocognitive function in dopamine-β-hydroxylase deficiency. Neuropsychopharmacol. 36, 1608–1619 (2011). 10.1038/npp.2011.42 [DOI] [PMC free article] [PubMed] [Google Scholar]
- 41.Phillips, M., Szabadi, E. & Bradshaw, C. Comparison of the effects of clonidine and yohimbine on spontaneous pupillary fluctuations in healthy human volunteers. Psychopharmacology. 150, 85–89 (2000). [DOI] [PubMed] [Google Scholar]
Associated Data
This section collects any data citations, data availability statements, or supplementary materials included in this article.
Data Availability Statement
The ethics protocol does not allow sharing raw and preprocessed pupil data via a public repository. Data may be shared however within the context of a collaboration. The MATLAB code for our computational model in Fig. 5 will be made available on reasonable request. In order to obtain the data or the source code, an e-mail to the author responsible for the data sets is required (Aya Shirama, shiramaaya@gmail.com).


