Abstract
Objective
The resurgence of syphilis in the United States presents a significant public health challenge. Much of the information needed for syphilis surveillance resides in electronic health records (EHRs). In this manuscript, we describe a surveillance platform for automating the extraction of EHR data, known as SmartChart Suite, and the results from a pilot.
Materials and Methods
The SmartChart Suite framework has been developed in compliance with the HHS Health IT Alignment Policy. The platform’s major functionalities are (1) data retrieval; (2) logical evaluation; (3) standardized data storage; and (4) results display. The SmartChart Suite was deployed in September 2023 at the Grady Health System in Atlanta, Georgia. We established a cohort of likely syphilis patients, randomly selected 50 medical records for manual and automated chart review, and analyzed the results.
Results
The SmartChart Suite was successfully deployed and integrated with the Epic EHR system at Grady. The overall performance results were precision of 97.6%, recall of 100.0%, and F-Score of 98.8%
Discussion
Automated abstraction of EHR data has significant potential to improve public health surveillance and case investigation processes while reducing the resource burden on health departments and reporters. The SmartChart Suite comprises a flexible open-source solution for registry development and maintenance across a wide spectrum of conditions and use cases.
Conclusion
SmartChart Suite demonstrates the potential of automated chart abstraction to support disease surveillance. HHS-compliant open-source tools such as SmartChart Suite can support more efficient human review by providing accurate and relevant data for critical public health activities.
Keywords: Fast Healthcare Interoperability Resources, surveillance, public health, natural language processing
Objectives
Background and significance
The resurgence of syphilis in the United States presents a significant public health challenge, with over 203 000 cases reported in 2022, a 17% annual increase and a 79% increase since 2018.1 Especially alarming is the rise in congenital syphilis, which is completely preventable, with each new case representing a failure of our public health system. In 2022, the rate of congenital syphilis was 102.5 cases per 100 000 live births, a 30.6% increase since 2021.1 Understanding the longitudinal course of syphilis patients, from diagnosis to treatment to subsequent testing, is essential to ensure adequate treatment and break the chain of transmission. Much of the information needed for syphilis surveillance resides in electronic health records (EHRs), in particular, laboratory results, signs/symptoms, and treatment information. Recent progress has been made towards automating the extraction of EHR data for case reporting of sexually transmitted infections (STIs) using the Fast Healthcare Interoperability Resources (FHIR) standard, both via “push” mechanisms such as electronic case reports (eCRs) and “pull” mechanisms such as enhancing electronic laboratory report (ELR) with additional case-related information.2,3 In “push” mechanisms, cases are reported when an individual meets the reportability criteria, whereas in “pull” mechanisms, case-related information is requested on a known reportable individual.
Despite these advances, critical gaps remain. For example, identification and management of syphilis requires additional information such as signs/symptoms and treatment information that is typically not available in “push” methods.4–7 Due to this complexity, typical reporting methods do not sufficiently collect important initial data needed for surveillance and case investigation activities for syphilis. Also, a substantial portion of crucial data for syphilis surveillance remains in unstructured form, posing a challenge for current automated public health data extraction methods, which largely rely on structured data. While the techniques for natural language processing (NLP) of clinical free-text data have evolved rapidly, enabling public health entities to leverage these methods without incurring new technical complexity or infrastructure is a key challenge. Furthermore, many applications in this area, including work done by our own team, have combined standard and custom data models but have not yet achieved complete end-to-end standardization.2 In July 2022, the U.S. Department of Health and Human Services (HHS) issued a Health IT Alignment Policy8 requiring all federal health agencies to comply with specific standards and terminologies for new tools and acquisitions.9 For long-term sustainability of public health interventions, including at the state and local level, it is essential that health departments and collaborating informatics teams are aware of and compliant with these policies.
In this manuscript, we describe an open-source longitudinal surveillance platform that leverages interoperable models and terminology standards throughout and is compliant with the HHS Health IT Alignment Policy. The framework, known as SmartChart Suite, is distinct in its ability to assimilate both structured and unstructured data using lightweight existing tools and standard FHIR protocols while persisting data in the widely used Observation Medical Outcomes Partnership (OMOP) common data model, supporting both population-level analysis and patient-level case evaluation. Most importantly, the logic for data extraction is highly configurable using standard data querying models and optional Application Programming Interfaces (APIs) for integration of advanced NLP methods. We report on the design and implementation of this framework as well as results from a syphilis registry pilot at a large inner city health system.
Materials and methods
Platform architecture
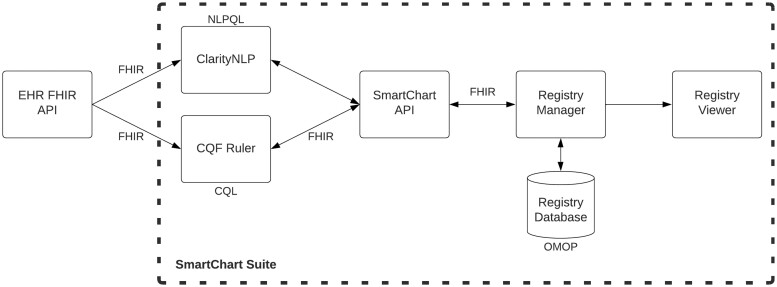
The SmartChart Suite framework has been developed in compliance with the HHS Health IT Alignment Policy8 on interoperable applications. Specifically, the platform utilizes FHIR R4 4.0.1, US Core STU 4.0.0, SMART Application Launch Framework 2.0, and USCDI v2. The major functionalities of the platform are (1) data retrieval; (2) logical evaluation; (3) standardized data storage; and (4) results display. As shown in Figure 1, the framework leverages the following standards and tools:
Figure 1.
SmartChart Suite component architecture. CQL: Clinical Quality Language; NLPQL: Natural Language Processing Query Language; HER: electronic health record; API: Application Programming Interface; FHIR: Fast Healthcare Interoperability Resources; OMOP: Observation Medical Outcomes Partnership.
FHIR R410 for data retrieval;
FHIR Questionnaire11 for defining categories of data to be abstracted;
Clinical Quality Language (CQL)12 for defining specific elements to be abstracted;
Clinical Quality Framework Ruler (CQF)13 for maintaining and processing logic;
OMOP Common Data Model14 for storing longitudinal data;
OMOP on FHIR15 for connecting FHIR results to OMOP;
US Core Data for Interoperability Standards (USCDI)-compliant query definitions16;
An open-source NLP framework (ClarityNLP) for unstructured data abstraction.17
These tools are connected through a central processing hub, known as the SmartChart API (SC-API), which establishes links to both the CQF Ruler and ClarityNLP. The CQF Ruler is derived from the standard HAPI FHIR server18 and incorporates plugins to support the FHIR Clinical Reasoning Module.19 This structure allows CQF Ruler to function as both a knowledge artifact evaluator and repository, complying with the FHIR API interface for handling FHIR Library resources. CQF Ruler ingests logical queries defined using CQL and generates patient-level FHIR queries to match. For its unstructured data processing, the SmartChart Suite uses a lightweight version of ClarityNLP focused on patient-level rather than population-level queries. ClarityNLP ingests logical queries defined using Natural Language Processing Query Language (NLPQL).20
Job management and data storage in SmartChart Suite is overseen by a FHIR application called Registry Manager, which extends the OMOP-on-FHIR tool for the specific task of building and maintaining registries from a FHIR data source. Registry Manager holds information on the patients to be monitored, which may be loaded either manually or via triggers such as electronic lab reports. Each patient is identified for ongoing monitoring and is assigned a schedule for data retrieval (eg, daily, weekly, and monthly). The Registry Manager triggers the SmartChart API to retrieve the relevant data and return it as FHIR bundles, which are then converted to OMOP for persistence in an OMOP common data model (CDM) registry database. This database may be analyzed directly using OMOP-based tools or viewed via the Registry Viewer web application. The Registry Viewer is intended for health department personnel and allows authorized users to view, annotate, and longitudinally track comprehensive case data collected through the SmartChart Suite.
Clinical phenotype design
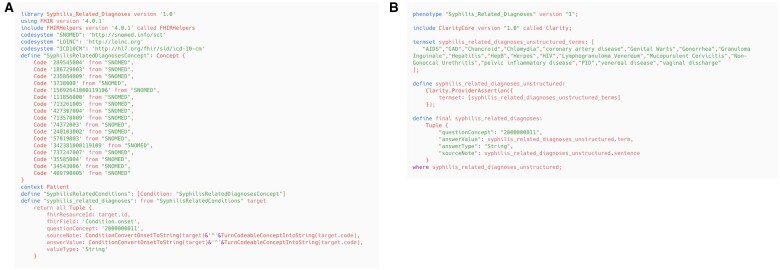
While the technical infrastructure is essential, the performance of a data retrieval system is ultimately dependent on the queries and clinical phenotypes that define the data elements and patient characteristics of interest. Our goal was to develop modular, reusable phenotypes that would allow for interoperability of health data queries across different systems and could be ported to other projects such as clinical decision support or case reporting or even research. As mentioned above, we utilized CQL for structured data queries and NLPQL for unstructured data queries. Our data elements for syphilis surveillance include laboratory results, clinical signs/symptoms, antibiotic treatments, comorbidities, and other medical history such as pregnancy and behavioral factors. Code lists for these domains were built through review of existing resources including the National Library of Medicine’s Value Set Authority Center,21 the OHDSI phenotype library,22 and the medical literature. These initial sets were then validated through expert review, in which STI domain experts assessed the completeness and accuracy of the concept sets and provided feedback for improvement. Additionally, we compared the concept sets to real-world data available the Grady Health System EHR to ensure that the terms and concepts were relevant and useful for information capture. For unstructured data, we developed term sets through a similar iterative process. Terms were culled from vocabularies such as SNOMED, expert review, and resources for acronyms, abbreviations, and lexical variants. Examples of CQL and NLPQL code for the determination of syphilis titers are shown in Figure 2A and B respectively, with full content available on GitHub.23
Figures 2.
Examples of CQL (A, left) and NLPQL (B, right) scripts for identifying syphilis-related diagnoses.
User interface design
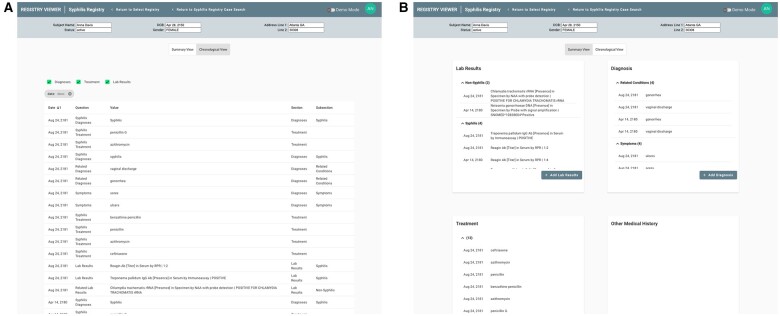
The Registry Viewer was developed through a user-centered design process to facilitate case review of patients in the registry. This design process included working with clinical and public health domain experts to review the workflow and key data elements for chart review in syphilis surveillance. The user interface can be customized for individual registries. All registry questions or elements of interest are defined via FHIR Questionnaire and given a category (eg, laboratory result) and a sub-category (eg, syphilis test). The Results Viewers organizes the display based on these categories, making it easy for the user to find and filter specific information. Figure 3 shows an example of the Registry Viewer’s standard chronological view (a) as well as a view grouped by categories (b).
Figures 3.
Registry Viewer user interface with both chronological (A, left) and “face sheet” (B, right) views.
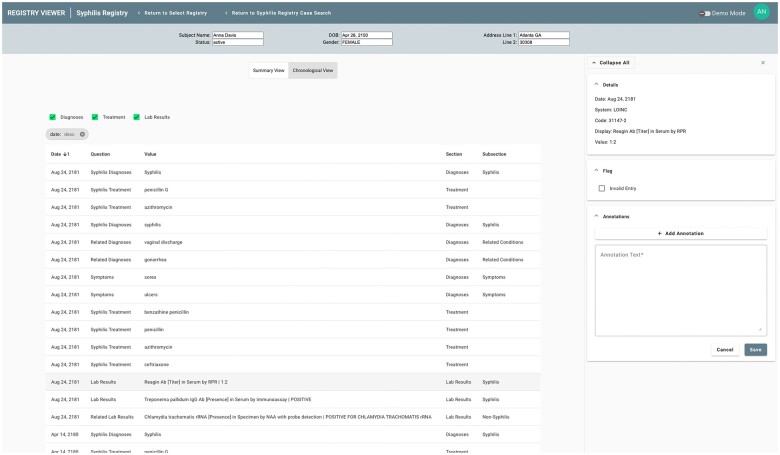
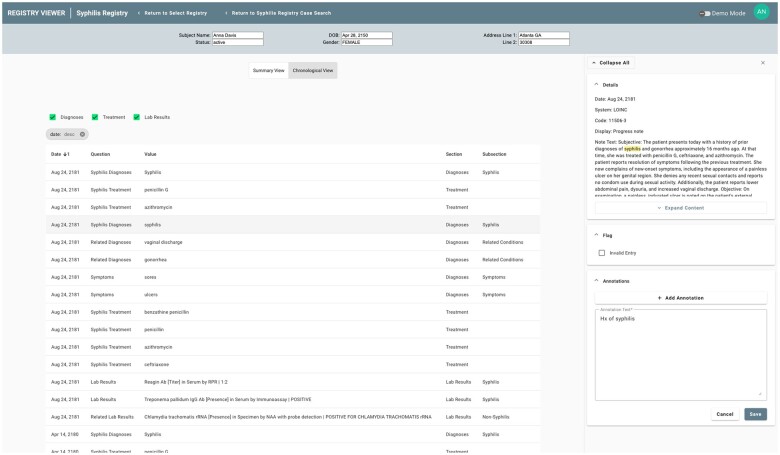
Given the automated nature of data extraction performed by the SmartChart Suite, it is essential to provide as much context as possible to the public health personnel regarding the source EHR data for the information being presented. This contextual information is shown through a sidebar that appears upon selection of any individual data element. For structured data, this may include the source code from the EHR as well as other data found in the FHIR resource (Figure 4). For unstructured data, this includes the body of the note in which the key terms were found as well as highlighting of these terms to expedite review (Figure 5).
Figure 4.
Registry Viewer sidebar displaying structured data results for a laboratory test.
Figure 5.
Registry Viewer sidebar displaying NLP results as well as a user annotation regarding the finding.
The Registry Viewer also supports data flagging and free-text annotation by users. This functionality was recognized as essential for public health personnel to highlight any information that might be incomplete or erroneous. These annotations are visible across all users of the system, ensuring that work done by one individual benefits others viewing the same case. A sample annotation is shown in Figure 5.
Deployment and evaluation
The SmartChart Suite was deployed in September 2023 at the Grady Health System in Atlanta, Georgia, a system whose catchment area has one of the highest rates of syphilis in the United States.24 SmartChart Suite was connected to Grady’s Epic EHR via Epic’s standard FHIR APIs. Since Epic FHIR APIs do not support searching by code for resources such as Conditions and MedicationRequests (eg, do not support <base_url>/Condition? code=XX queries), we developed a proxy application that pulls all patient data for these resources via Epic’s FHIR API and executes code-based searching in compliance with the FHIR standard. For FHIR servers that natively support code-based searching, the proxy is bypassed.
We sought to evaluate the algorithmic performance of the SmartChart Suite syphilis module. We first established a cohort of likely syphilis patients based on the following criteria: (1) a newly positive nontreponemal (lipoidal antigen) or treponemal antibody test and (2) at least 10 encounters at Grady since the initial positive test result. The number of encounters was set both to better evaluate performance and to simulate a real-world scenario where SmartChart is triggered multiple times per patient. From the resulting patient list of over 1000 patients, we then randomly selected 50 medical records for manual and automated chart review. The review was retrospective, with all available data in the chart being used for the pilot rather than simulating a gradual build of information as seen in real-time surveillance. The physician lead (I.K.) manually reviewed the patient charts for syphilis-related diagnoses, lab results, treatments, and pregnancy information via Epic. The same charts were processed by SmartChart Suite and the resulting data were shown in the Registry Viewer application. A spreadsheet-based template was used to classify all data retrieved by SmartChart Suite as true positive (confirmed by manual review) or false positive (not confirmed by manual review). All data elements found by manual review but not by SmartChart were automatically classified as false negative. The reviewer also was asked to add explanatory comments for any errors found. This study was approved by the Georgia Institute of Technology and Emory University Institutional Review Boards.
Results
The SmartChart Suite was successfully deployed as a standalone application and connected to the Epic system at Grady. The syphilis module included 21 related questions, and the majority of data found related to 4 categories: diagnoses, laboratory testing, treatment, and pregnancy information (full list of questions can be found in Supplementary Material S1). Captured information included concept name and date as well as value for results and dosage information for treatments. Overall, 67% of data elements were found via structured FHIR resources while 33% were found in free text documents. The overall performance results were precision of 97.6%, recall of 100.0%, and F-Score of 98.8%. Table 1 shows the metrics broken down by data types.
Table 1.
SmartChart performance metrics for abstraction of syphilis-related data elements.
| Name | True positive | False positive | False negative | Precision | Recall | F-Score |
|---|---|---|---|---|---|---|
| Overall | 2949 | 71 | 1* | 97.6% | 100.0% | 98.8% |
| Structured | 1972 | 9 | 1 | 99.5% | 99.9% | 99.7% |
| Unstructured | 977 | 62 | * | 94.0% | 100.0% | 96.9% |
| Syphilis diagnoses | 334 | 13 | * | 96.3% | 100.0% | 98.1% |
| Related diagnoses | 504 | 3 | * | 99.4% | 100.0% | 99.7% |
| Syphilis signs/symptoms | 135 | 4 | * | 97.1% | 100.0% | 98.5% |
| Syphilis labs | 688 | 0 | * | 100% | 100.0% | 100.0% |
| Related labs | 673 | 0 | 1 | 100.0% | 99.9% | 99.9% |
| Syphilis treatment | 499 | 51 | * | 90.7% | 100.0% | 95.1% |
| Pregnancy history | 115 | 0 | * | 100.0% | 100.0% | 100.0% |
Asterisks indicate false negatives that were not assessed.
The main causes for false positives were unstructured results that indicated incorrect dates, for example, a medication being identified in a note as having occurred on the date of the note entry rather than the date of the actual treatment. False negatives were only considered and calculated for structured data due to the large amount of unstructured data that the reviewer would need to read to determine any false negatives in clinical notes. There was only one false negative for structured data, which was due to a lab result that did not have an associated LOINC code. It thus appeared in the EHR but not in the FHIR results which relied on LOINC-based concept identification.
Discussion
Automated abstraction of EHR data for longitudinal public health surveillance has significant potential to improve public health surveillance and case investigation processes while reducing the resource burden on health departments and reporters. This is especially important as this could potentially free up resources at health departments used for collecting data that could be reallocated to perform other important public health actions. In the context of rising reported cases of syphilis, public health staff realign their focus on case investigations, offer partner service, and other surveillance and public health priorities.
The SmartChart Suite comprises a flexible open-source solution for registry development and maintenance across a wide spectrum of conditions and use cases. By design, its architecture is not revolutionary but rather follows standard interoperability paradigms and adheres to HHS Health IT Alignment policies. Moreover, SmartChart reuses common paradigms and tooling from non-public health FHIR initiatives such as Da Vinci,25 with the goal of minimizing resources required by health systems to support public health use cases alongside other activities. Moreover, the use of FHIR and OMOP standards expands the number of clinical sites that could contribute to enriched public health surveillance activities.
Implementing SmartChart within a health department requires IT support and familiarity with deploying a web application. The key technical component is the connection between the health department and the health system FHIR servers. There is an expectation that the Trusted Exchange Framework Common Agreement (TEFCA) will significantly simplify this process. Until that point, implementation will require coordination between the health department and health system IT teams to enable access to the FHIR server. SmartChart utilizes standard FHIR queries and will not require modifications or other actions on the part of the health system beyond enabling a SMART on FHIR application.
The SmartChart Suite syphilis module achieved a high level of performance on its data retrieval tasks. A significant proportion of data were identified via unstructured notes, underscoring the importance of leveraging free text for public health surveillance. It is important to note that the performance of the algorithms is most significantly driven by the query design strategy. Thus, when applying SmartChart to a new use case, careful query design and testing is essential to achieving high performance. While the ClarityNLP platform can integrate with large language model-based APIs, we did not evaluate such models’ performance in this pilot.
The major limitations of the SmartChart Suite are those familiar to any FHIR-based deployments. Health systems may differ in their implementation of FHIR or utilization of local code systems. In our pilot, we found the Epic FHIR API to be robust in terms of USCDI compliance and thus eliminated the need to incorporate local terms into queries. Another limitation, as noted above, was the need to develop a proxy to account for the divergence of Epic FHIR’s search functionality from standard FHIR protocols. There is additional work to be done in terms of incorporating and testing SmartChart Suite in the health department environment. Finally, it is important to note that having a syphilis-based cohort may have somewhat increased the precision of the NLP algorithms compared with a general population because the pretest probability of having a syphilis-related data element is higher in this group. Thus, the performance may not be fully generalizable.
Conclusion
SmartChart Suite’s syphilis module demonstrates the potential of automated chart abstraction to support disease surveillance. With the significant manual resources currently dedicated to chart review, HHS-compliant open-source tools such as SmartChart Suite can support more efficient human review by providing accurate and relevant data for critical public health activities. SmartChart Suite’s registry capabilities could be integrated with population-level analytics frameworks such as OHDSI Atlas or health department information systems for future population-level work.
Supplementary Material
Contributor Information
Andrew Stevens, Georgia Tech Research Institute, Atlanta, GA 30308, United States.
Saugat Karki, Division of STD Prevention, Centers for Disease Control and Prevention, Atlanta, GA 30333, United States.
Elizabeth Shivers, Georgia Tech Research Institute, Atlanta, GA 30308, United States.
Alejandro Pérez, Division of STD Prevention, Centers for Disease Control and Prevention, Atlanta, GA 30333, United States.
Myung Choi, Georgia Tech Research Institute, Atlanta, GA 30308, United States.
Andre Berro, Division of STD Prevention, Centers for Disease Control and Prevention, Atlanta, GA 30333, United States.
Michael Riley, Georgia Tech Research Institute, Atlanta, GA 30308, United States.
Jane Yang, Division of STD Prevention, Centers for Disease Control and Prevention, Atlanta, GA 30333, United States.
Plamen Tassev, Georgia Tech Research Institute, Atlanta, GA 30308, United States.
David Alexander Jackson, Division of STD Prevention, Centers for Disease Control and Prevention, Atlanta, GA 30333, United States.
Inho Kim, School of Medicine, Emory University, Atlanta, GA 30307, United States.
Jon D Duke, Georgia Tech Research Institute, Atlanta, GA 30308, United States.
Author contributions
The authors confirm their contribution to the paper as follows: study conceptualization: Andrew Stevens, Saugat Karki, Alejandro Pérez, Andre Berro, Jane Yang, David Alexander Jackson, Jon D. Duke; data curation: Andrew Stevens, Michael Riley, Jon D. Duke; formal analysis: Jon D. Duke; investigation: Saugat Karki, Inho Kim, Jon D. Duke; methodology: Elizabeth Shivers, Alejandro Pérez, Myung Choi, Andre Berro, Jane Yang, David Alexander Jackson, Jon D. Duke; software: Andrew Stevens, Elizabeth Shivers, Myung Choi, Michael Riley, Plamen Tassev; supervision: Jon D. Duke; writing—original draft: Andrew Stevens, Saugat Karki, Jon D. Duke. All authors reviewed the results and approved the final version of the manuscript.
Supplementary material
Supplementary material is available at JAMIA Open online.
Funding
This work was funded by the Centers for Disease Control and Prevention under University Affiliate Research Contract W31P4Q-18-D-0002-W31P4Q19F0584 with the Georgia Tech Research Institute.
Conflicts of interest
The authors have no competing interests to report.
Data availability
The full SmartChart Suite GitHub repository can be found at https://github.com/SmartChartSuite. The knowledge repository containing the FHIR Questionnaire and associated logic files (CQL and NLPQL) can be found at https://github.com/SmartChartSuite/KnowledgeRepoPublic. The data underlying this article cannot be shared due to privacy concerns and presence of protected health information.
References
- 1. Sexually transmitted infections surveillance, 2022. Accessed February 19, 2024. https://www.cdc.gov/std/statistics/2022/default.htm
- 2. Mishra N, Duke J, Karki S, et al. A modified public health automated case event reporting platform for enhancing electronic laboratory reports with clinical data: design and implementation study. J Med Internet Res. 2021;23:e26388. [DOI] [PMC free article] [PubMed] [Google Scholar]
- 3. Mishra N, Grant R, Patel MT, et al. Automating case reporting of Chlamydia and gonorrhea to public health authorities in Illinois clinics: implementation and evaluation of findings. JMIR Public Health Surveill. 2023;9:e38868. 10.2196/38868 [DOI] [PMC free article] [PubMed] [Google Scholar]
- 4. Karki S, Peterman TA, Johnson K, et al. An automated syphilis serology record search and review algorithm to prioritize investigations by health departments. Sex Transm Dis. 2021;48:909-914. 10.1097/OLQ.0000000000001489 [DOI] [PMC free article] [PubMed] [Google Scholar]
- 5. Matthias J, Keller G, Cha S, Wilson C, Peterman TA. Going off grid: modeling an automated record search to process electronically reported reactive nontreponemal syphilis tests. Sex Transm Dis. 2018;45:655-659. 10.1097/OLQ.0000000000000836 [DOI] [PMC free article] [PubMed] [Google Scholar]
- 6. Cha S, Matthias JM, Rahman M, et al. Reactor grids for prioritizing syphilis investigations: are primary syphilis cases being missed? Sex Transm Dis. 2018;45:648-654. 10.1097/OLQ.0000000000000833 [DOI] [PMC free article] [PubMed] [Google Scholar]
- 7. Matthias J, Khan AM, Craze K, Karki S, Newman DR. Evaluation of automated processing of electronically reported serological tests for syphilis using current and historical syphilis results compared with traditional reactor grid processing in Florida. Sex Transm Dis. 2024;51:420-424. 10.1097/OLQ.0000000000001952 [DOI] [PMC free article] [PubMed] [Google Scholar]
- 8. HHS Health IT Alignment Policy | HealthIT.gov. Accessed November 20, 2023. https://www.healthit.gov/topic/hhs-health-it-alignment-policy
- 9. Adopted standards for HHS use | HealthIT.gov. Accessed November 20, 2023. https://www.healthit.gov/topic/adopted-standards-hhs-use
- 10. Resourcelist—FHIR v4.0.1. Accessed November 20, 2023. https://hl7.org/fhir/R4/resourcelist.html
- 11. Questionnaire—FHIR v4.0.1. Accessed November 20, 2023. https://hl7.org/fhir/R4/questionnaire.html
- 12. CQL—clinical quality language | eCQI Resource Center. Accessed November 20, 2023. https://ecqi.healthit.gov/cql
- 13. CQF Ruler | eCQI Resource Center. Accessed November 20, 2023. https://ecqi.healthit.gov/tool/cqf-ruler
- 14. OMOP common data model. Accessed November 20, 2023. https://ohdsi.github.io/CommonDataModel/
- 15. OMOPonFHIR. Accessed November 20, 2023. https://omoponfhir.org/
- 16. United States Core Data for Interoperability (USCDI). Accessed November 20, 2023. http://www.healthit.gov/isa/united-states-core-data-interoperability-uscdi
- 17. ClarityNLP/ClarityNLP. Clarity NLP, September 5, 2023. Accessed November 20, 2023. https://github.com/ClarityNLP/ClarityNLP
- 18. HAPI FHIR—the open source FHIR API for Java. Accessed November 25, 2023. https://hapifhir.io/
- 19. Clinicalreasoning-module—FHIR v6.0.0-cibuild. Accessed November 25, 2023. https://build.fhir.org/clinicalreasoning-module.html
- 20. ClarityNLP at a Glance—ClarityNLP documentation. Accessed November 25, 2023. https://claritynlp.readthedocs.io/en/latest/user_guide/intro/overview.html#example-nlpql-phenotype-walkthrough
- 21. Value Set Authority Center. Accessed November 25, 2023. https://vsac.nlm.nih.gov/
- 22. OHDSI Phenotype Library. Accessed November 25, 2023. https://data.ohdsi.org/PhenotypeLibrary/
- 23. SmartChartSuite/KnowledgeRepoPublic. Accessed April 16, 2024. https://github.com/SmartChartSuite/KnowledgeRepoPublic/tree/main/SyphilisRegistry
- 24. Sexually Transmitted Disease Surveillance 2019. Accessed April 11, 2024. https://www.cdc.gov/std/statistics/2019/std-surveillance-2019.pdf
- 25. Home—Da Vinci Health Record Exchange (HRex) v1.0.0. Accessed November 26, 2023. https://build.fhir.org/ig/HL7/davinci-ehrx/
Associated Data
This section collects any data citations, data availability statements, or supplementary materials included in this article.
Supplementary Materials
Data Availability Statement
The full SmartChart Suite GitHub repository can be found at https://github.com/SmartChartSuite. The knowledge repository containing the FHIR Questionnaire and associated logic files (CQL and NLPQL) can be found at https://github.com/SmartChartSuite/KnowledgeRepoPublic. The data underlying this article cannot be shared due to privacy concerns and presence of protected health information.


