Abstract
Background
This study investigates the prognostic value of M0 macrophage-related genes (M0MRGs) in esophageal cancer (ESCA) and identifies novel targets for immunotherapy.
Methods
Differentially expressed genes (DEGs) were screened with ESCA-related expression profile data (GSE5364 and GSE17351) from the GEO database, followed by GO and KEGG pathway enrichment analyses. Then, immune cell infiltration was examined with the CIBERSORT algorithm and multiplex fluorescence-based immunohistochemistry (MP-IHC). ESCA-related gene expression data and relevant clinical information were retrieved from TCGA. M0MRGs were identified with TCGA-ESCA based on Spearman’s correlation coefficient. Additionally, LASSO and Cox regression analyses were conducted to further construct an M0MRG-related prognostic model. ATP6V0D2 and MMP12 expression in ESCA was analyzed with tissue microarray. Finally, the half maximal inhibitory concentrations (IC50) of commonly used chemotherapeutics in TCGA-ESCA were calculated with the “oncoPredict” R package.
Conclusion
In summary, ATP6V0D2 and MMP12 were crucial components in a prognostic risk model for ESCA and were associated with poor prognoses, implicating the involvement of elevated M0 macrophages in disease progression and providing potential therapeutic targets and strategies for ESCA.
Keywords: esophageal cancer, M0 macrophage, prognostic model, ATP6V0D2, MMP12
Introduction
Esophageal cancer (ESCA) is one of the most prevalent malignancies worldwide, ranking seventh among the most common cancers worldwide in 2020, with approximately 604,000 new cases and 544,000 deaths annually.1 Based on histological classification, ESCA is primarily allocated into two subtypes: esophageal squamous cell carcinoma (ESCC) and esophageal adenocarcinoma (EAC).2 ESCA has the highest incidence rate in Asia and Africa, where ESCC is the predominant subtype.3 Notably, more than half of the global ESCC cases occur in China.4,5 ESCC is tightly associated with various risk factors such as smoking, alcohol consumption, and other environmental exposures. In contrast, EAC is more prevalent in Western countries and is frequently linked to conditions such as gastroesophageal reflux disease, obesity, and Barrett’s esophagus.3 These two subtypes have significant differences in their epidemiological profiles, pathogenic mechanisms, and clinical presentations, which consequently affect their respective treatment strategies and prognostic outcomes. ESCA typically presents with non-specific clinical symptoms at an early stage, making it difficult to detect. As a result, most patients are diagnosed only when they progress to a locally advanced stage or have distant metastasis.6,7 Therefore, there is an urgent need to identify specific and sensitive biomarkers for the treatment and prognostic prediction of ESCA.
With the gradual deepening of domestic and international research on tumor immunology, immunotherapy, as a new treatment method, has experienced tremendous changes in cancer treatment and has become a hot spot in tumor research.8 Macrophages are essential components of the tumor microenvironment (TME) and the strategies targeting macrophages for cancer immunotherapy have attracted much attention.9,10 The anti-tumor potential of macrophages may provide novel therapeutic approaches. Macrophages possess versatile functions depending on their activation states, including resting (M0) and polarizing (M1 and M2) states.11 Conventionally, it’s believed that both M1 and M2 macrophages can originate from M0, a resting state without specific functions before polarization. However, a recent study has analyzed immunophenotyping of glioma-associated macrophages with matched blood monocytes, healthy donor monocytes, normal brain microglia, nonpolarized M0 macrophages, and polarized M1 and M2 macrophages; this study demonstrates that glioblastoma-associated myeloid cells sustain a continuum state and have characteristics of both M1- and M2-like phenotypes while resembling M0 macrophages and that the differentiation of M0 macrophages, rather than M1 or M2 macrophages, is associated with high-grade tumors and can predict the poor prognosis of glioma.12 The study illuminates the tumorigenic role of M0 macrophages in gliomas, unveiling a novel perspective. Furthermore, Chen et al have observed markedly higher levels of M0 macrophages in hepatocellular carcinoma tissues than in normal liver tissues, and based on these findings, they have subsequently developed a prognostic model.13 However, the cellular infiltration and molecular features of M0 macrophages and their correlation with clinicopathological characteristics of ESCA need further investigation.
In the present study, we aimed to explore an M0 macrophage-related biomarker for predicting the prognosis of ESCA. After Cox and LASSO regression analyses, a risk-score model was generated based on M0 macrophage-related genes (M0MRGs), matrix metallopeptidase 12 (MMP12), and ATP6V0D2. MMP12, also called macrophage metalloelastase, has first been found in human alveolar macrophages.14 MMP12 is a member of the family of zinc-dependent proteases that are responsible for the degradation of extracellular matrix components.15 A prior study has reported that MMP12 upregulation is significantly correlated with tumor grading and staging, nodal metastasis, and poor survival of ESCC, demonstrating that MMP-12 is an independent prognostic factor for ESCC.16 Lysosomal hydrolases require an acidic environment, which is facilitated by the proton-pumping activity of vacuolar-type ATPases (V-ATPases). V-ATPases is a complex consisting of a cytosolic V1 domain (8 subunits required for ATP hydrolysis) and an integral membrane V0 domain (6 subunits in yeast, with an Ac45 protein in complex eukaryotes for the proton-pumping activity), among which ATP6V0D2/subunit d2, ATP6V1D/subunit D, and ATP6V1F collectively constitute the central stalk of V-ATPases. This complex rotates with the relevant Atp6V0C/proteolipid ring and favors the transmembrane transport of protons via ATP hydrolysis in the V1 domain.17 ATP6V0D/subunit D has two isoforms, ATP6V0D1 and ATP6V0D2, which share 82% sequence identity.18 Of note, ATP6V0D2 functions as an oncogene in esophagus cancer and is associated with epithelial-mesenchymal transition.19 However, little is known about the impact of ATP6V0D2 and MMP12 on tumor grading and staging and anti-tumor immunity.
Hence, our study comprehensively delved into the correlation between ATP6V0D2 and MMP12 expressions and the malignancy level of ESCA using ESCA-related tissue microarray. Additionally, the immune microenvironment of ESCA was observed and macrophage infiltration in both high- and low-risk groups of ESCA patients was assessed using multiplex fluorescence-based immunohistochemistry (MP-IHC). This study may offer innovative targets for the immunotherapy and prognosis of ESCA.
Methods and Materials
Data Access and Differentially Expressed Gene (DEG) Screening
In this study, the transcriptomic, somatic mutation, and clinical data of the ESCA cohort were obtained from The Cancer Genome Atlas (TCGA) data portal (https://cancergenome.nih.gov/) and Gene Expression Omnibus (GEO, http://www.ncbi.nlm.nih.gov/geo/) datasets (GSE5364 and GSE17351). The study applied specific inclusion criteria, including patients histologically diagnosed with ESCA and had both gene expression data and clinical information. Cases lacking clinical data or having insufficient follow-up time were excluded, as detailed in Table S1. The gene expression profiles of ESCA patients in the GSE5364 and GSE17351 datasets were analyzed. A logarithmic (base 2) transformation was applied to normalize the dataset. The R package “limma” was used for differential analysis [P < 0.05 and log2 (fold change) > 2].20 Gene Ontology (GO) and Kyoto Encyclopedia of Genes and Genomes (KEGG) pathway enrichment analyses21–23 were performed in R software with the package “clusterProfiler”.24,25 The somatic mutation data were visualized using the “maftools” R package.26 M0MRGs were identified based on Spearman’s rank correlation coefficient (P < 0.001, |R| > 0.5).
Immune Cell Infiltration Analysis
CIBERSORT27 was utilized to quantify the relative proportions of 22 types of immune cells in each sample (GSE5364 and GSE17351) and analyze immune cell infiltration in samples of high-risk and low-risk groups (from TCGA-ESCA). The correlation of risk scores with immune infiltration and immune checkpoint was analyzed using Spearman’s correlation coefficient. M0MRG-associated biological functions in ESCA were identified using GO analysis.
Establishment of an M0MRG Signature
LASSO and Cox regression analyses were conducted to further construct the prognostic model of M0MRGs in the TCGA-ESCA dataset. The risk score was calculated with M0MRG expression and coefficient values as follows: coefficient 1 × M0MRG 1 expression + coefficient 2 × M0MRG 2 expression. ESCA patients were assigned to the low- and high-risk groups based on the mean risk score (0.734). Survival analysis was performed using the “survival” R package. The independent prognostic factors were determined through univariate and multivariate Cox regression analyses. The nomogram and calibration curves were formulated with the “rms” R package.28 The nomogram integrated the risk score with key clinical features (such as gender, tumor stage, and other significant covariates). Each variable was assigned a point value proportional to its predictive weight, derived from the model coefficients. These points were summed to calculate the total score for each patient, which was then mapped to specific survival probabilities on the nomogram. Calibration curves were generated to evaluate the agreement between the predicted survival probabilities and the actual observed outcomes, thereby ensuring the reliability of the nomogram’s predictions.
Gene-Set Enrichment Analysis (GSEA)
GSEA was performed using GSEA v4.1.1 software to interpret M0MRG-related pathways in the whole TCGA-ESCA cohort. The gene sets of “c2.cp.kegg.symbols.gmt” were selected for GSEA. A P-value < 0.05 (adjusted by false discovery rate) indicated a statistically significant difference.
Evaluation of Potential Model Significance in Clinical Treatment
A sensitivity analysis of chemotherapeutics was performed to identify the differences between the high- and low-risk groups to evaluate potential clinical heterogeneity. The half maximal inhibitory concentrations (IC50) of commonly used chemotherapeutics were calculated using the TCGA-ESCA project dataset with the “oncoPredict” R package.29
Immunohistochemistry and Tissue-Microarray Analysis
A total of 96 primary ESCA tissue samples and 6 adjacent normal esophageal tissue samples were collected from patients undergoing surgery at the West China Hospital of Sichuan University. After surgical removal, the samples were immediately frozen in liquid nitrogen. This study was conducted following the Declaration of Helsinki (as revised in 2013) and was approved by the Ethics Committee on Biomedical Research of West China Hospital of Sichuan University (No. 2019–318). Informed consent was obtained from all patients or their guardians.
All tissues were assembled into a tissue microarray. Immunostaining for ATP6V0D2 and MMP12 was performed following the standard procedures. ATP6V0D2 antibody (ab236375; Abcam) and MMP12 (ab137444, Abcam) antibodies were used. The percentage of positively stained cells was scored as 0 (cells < 5%), 1 (5% to 25%), 2 (26% to 50%), 3 (51% to 75%), and 4 (76% to 100%). The positive staining intensity was scored as 0 (no staining), 1 (weak staining), 2 (moderate staining), and 3 (strong staining). The expression levels of ATP6V0D2 and MMP12 were assessed to determine their immunoreactive scores (IRSs) using the algorithm IRS = Si × Pi (where Si and Pi represent the intensity and percentage of positively stained cells, respectively). Samples were allocated into four groups based on their IRS: 0, negative (-); 1–4, weakly positive ( +); 5–8, positive (+ +); and 9–12, strongly positive (+ + +).
MP-IHC
Eight markers were used for MP-IHC staining to detect pan-macrophages (CD68, ab213363), M1 macrophages (CD80, ab315832), M2 macrophages (CD163, ab182422), CD8+ T cells (CD8, ab237709), regulatory T (Treg) cells (Foxp3, ab20034), α-smooth muscle actin (α-SMA, ab7817), tumor cells (PanCK, ZM-0069), and 4′,6-diamidino-2-phenylindole (DAPI). The seven-color multiplex immunofluorescence was conducted using an Opal 7-Color Manual IHC kit (PerkinElmer, NEL811001KT) as per the manufacturer’s protocol and imaged by a PerkinElmer Vectra 3.0 (Perkin Elmer, Hopkinton, MA) multispectral microscope.
Statistical Analysis
All statistical analyses were carried out with the R package v4.1.1. A P-value of less than 0.05 was considered a statistically significant difference.
Results
DEG Expression Profiles in ESCA
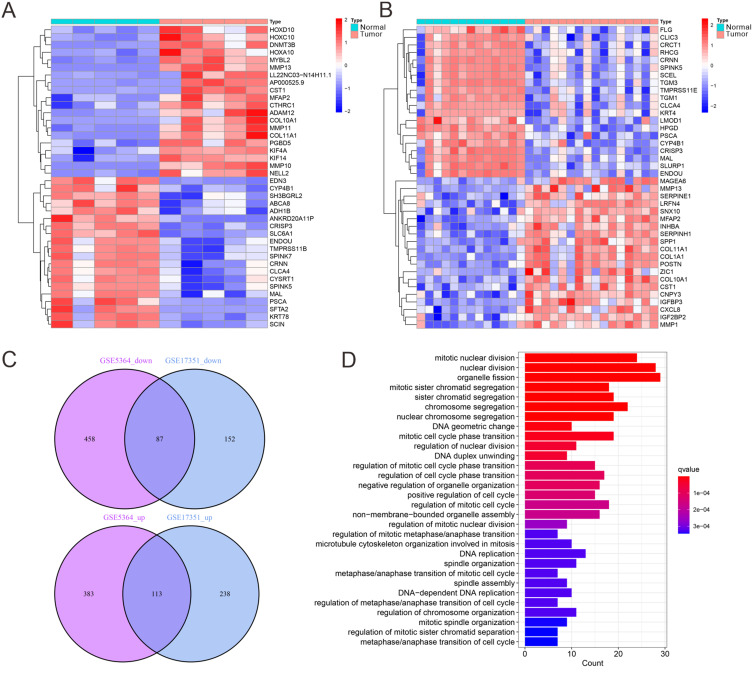
DEG analysis was performed to identify genes with altered expression between ESCA and normal tissues. Two independent datasets, GSE5364 and GSE17351, were analyzed using the “limma” and “heatmap” R packages to generate heatmaps of the top 20 DEGs (Figure 1A and B). After intersecting the two datasets, a total of 200 DEGs were identified, of which 113 were upregulated and 87 were downregulated in ESCA tissues compared to normal tissues (Figure 1C, Table S2). These DEGs were subsequently subjected to KEGG pathway enrichment analysis using the “clusterProfiler” R package. The results indicated significant associations with key pathways involved in ESCA development, including pathways related to cancer progression, immune modulation, and metabolism (Figure 1D). These findings underscored the complex molecular mechanisms driving ESCA and suggested potential therapeutic targets. However, further investigations are needed to fully understand the interaction networks and biological roles of these genes in the ESCA TME.
Figure 1.
DEG expression analysis. (A) Heatmap analysis of the top 20 DEGs based on the GSE5364 dataset (Normal = 13, Tumor = 16). (B) Heatmap analysis of the top 20 differential genes based on the GSE17351 dataset (Normal = 5, Tumor = 5). (C) Venn diagram of the DEGs in GSE5364 and GSE17351 datasets. (D) KEGG pathway enrichment analysis.
Analysis of Immune Cell Infiltration
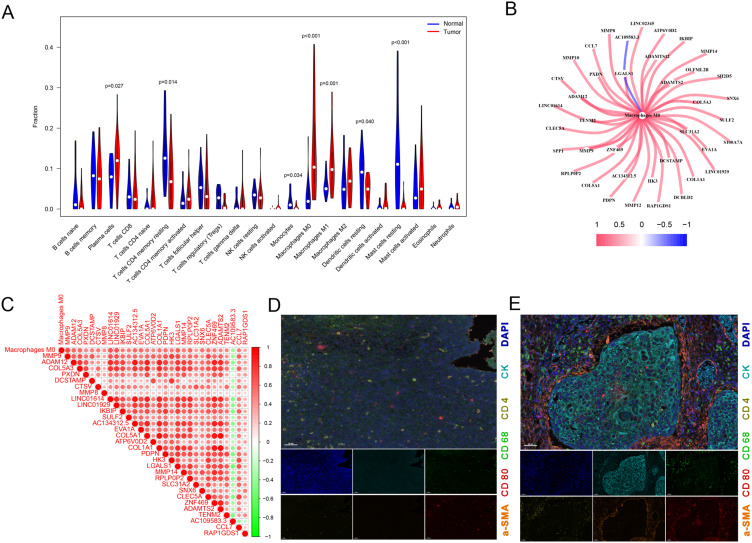
To investigate the immune landscape of ESCA, we utilized the “CIBERSORT” R package to quantify the infiltration levels of 22 immune cell types in both ESCA and normal tissue samples. The analysis revealed that plasma cells, M0 macrophages, and M1 macrophages were significantly enriched in ESCA tissues compared to adjacent normal tissues. Conversely, resting memory CD4+ T cells, monocytes, resting mast cells and resting dendritic cells were found to be more abundant in normal tissues, indicating a potential immune imbalance in the TME. Notably, M0 macrophages exhibited the highest enrichment in ESCA, highlighting their potential role in modulating the immune response in ESCA (Figure 2A). This observation suggested that M0 macrophages may play a crucial role in the tumor immune response, and further analysis of M0MRGs could provide valuable insights into ESCA prognosis. To investigate the relationship between M0 macrophage infiltration and gene expression, we performed a co-expression analysis using the TCGA-ESCA dataset (P < 0.001, |R| > 0.5). This analysis identified 39 M0MRGs that were significantly correlated with M0 macrophage infiltration (Figure 2B and C, Table S3). This result was validated through MP-IHC, which confirmed the localization of macrophages predominantly in the tumor stroma, near the tumor core, but not within the core region itself (Figure 2D and E). These findings suggested that macrophages play an important role in ESCA immunotherapy, and further studies on M0 macrophage biology may provide new therapeutic strategies for targeting the immune microenvironment in ESCA.
Figure 2.
M0MRG analyses. (A) Immune cell infiltration analysis in GSE5364 and GSE17351 datasets by CIBERSORT. (B) Co-expression network diagram of M0MRGs. (C) Heatmap of M0MRGs expression. (D and E) MP-IHC staining for normal esophageal tissues (D) vs ESCA tissues (E). Pan-macrophages: CD68; M1 macrophages cells: CD80; α-smooth muscle actin: α-SMA; tumor: CK.
Construction of a Prognostic Signature of M0MRGs
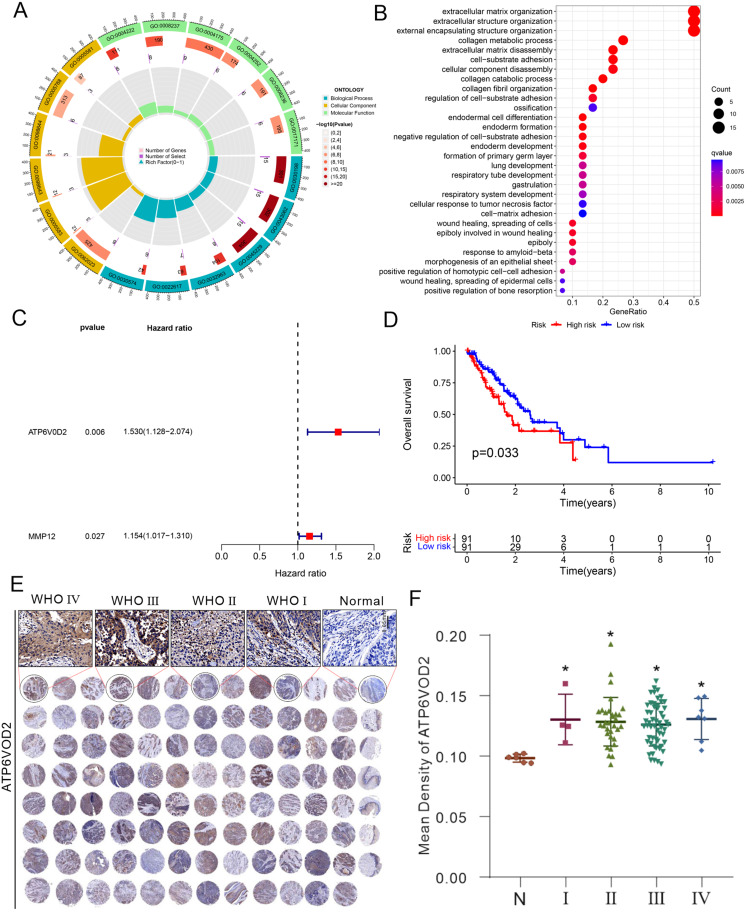
M0MRGs have been previously implicated in the prognosis of other cancers, such as hepatocellular carcinoma, but their role in ESCA has not been extensively explored.13 Our analysis of GO and KEGG enrichment pathways showed that M0MRGs were involved in various biological processes, including immune modulation and tumor progression, which are crucial for ESCA pathogenesis (Figure 3A and B). In this study, a prognostic model was constructed based on M0MRGs using Cox regression and Lasso regression methods. After univariate Cox analysis on the 39 identified M0MRGs, two genes were filtered, ATP6V0D2 and MMP12, as prognostic markers (Figure 3C, Table S4). The risk score was calculated based on the expression levels of ATP6V0D2 and MMP12, and patients were classified into the high-risk and low-risk groups based on the median risk score (0.734) (Table S5). High-risk patients exhibited a significantly poorer prognosis, with a three-year survival rate of only 36.8%, indicating that high-risk patients had shorter overall survival than low-risk patients, who had a three-year survival rate of 43.7% (Figure 3D). Protein expression levels of ATP6V0D2 and MMP12 were further validated using tissue microarray analysis. The results demonstrated that ATP6V0D2 and MMP12 expression levels were significantly higher in ESCA tissues compared to adjacent normal tissues, reinforcing their potential as prognostic biomarkers (Figure 3E and F, Figure S1). In summary, the risk score based on ATP6V0D2 and MMP12 expression levels was found to be an independent predictor of poor clinical outcomes in ESCA patients.
Figure 3.
Construction of a prognostic signature based on M0MRGs. (A) GO analysis and (B) KEGG pathway enrichment analysis of M0MRGs. (C) Multivariate prognostic analyses of M0MRGs. (D) Stratified survival analysis according to risk grouping. (E and F) Detection of ATP6V0D2 expression using tissue microarray and immunohistochemical staining. N: Normal (n = 6), I: WHO I (n = 4), II: WHO II (n = 32), III: WHO III (n = 54). IV: WHO IV (n = 7). ATP6V0D2 expression in different grades of ESCA tissues was detected, with normal tissues as the control. * P < 0.05 by one‐way analysis of variance with Tukey’s test.
Independent Prognostic Analysis of Risk Scores and Clinical Parameters
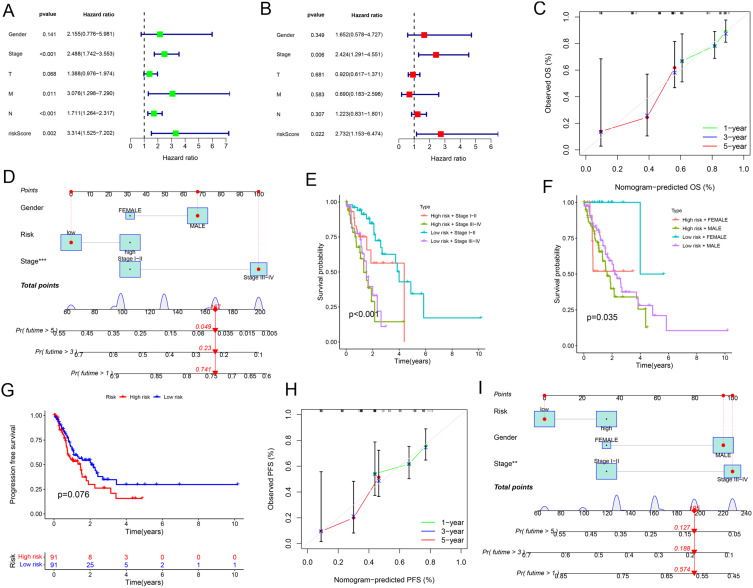
To assess the independent prognostic value of the risk score, we performed both univariate and multivariate Cox regression analyses. It was found that both the tumor stage and the risk score were independent prognostic factors for ESCA outcomes (Figure 4A and B). A prognostic nomogram was developed by integrating tumor stage and the risk score, enabling the prediction of the 1-, 3-, and 5-year survival for ESCA patients (Figure 4C and D, Table S6). Furthermore, the prognostic impact of the risk score was explored within subgroups of patients stratified by tumor stage. The analysis results showed that among patients with low-grade (stage I–II) ESCA, those in the high-risk group had a worse prognosis compared to those in the low-risk group. Similarly, in patients with high-grade (stage III–IV) ESCA, patients in the high-risk group also exhibited poorer outcomes (Figure 4E). The time-dependent AUC analyses further clarified the predictive ability of the risk score and ESCA staging for patient prognosis, demonstrating a modest improvement in prognostic ability after incorporating the risk score (Figure S2). This result was also observed across different genders, indicating that the prognostic value of the risk score was consistent regardless of sex (Figure 4F). These findings underscored the ability of the risk score to stratify patients within the same pathological stage, effectively identifying individuals at higher risk of poor prognosis.
Figure 4.
Independent prognostic analysis of risk scores and clinical parameters. (A) Univariate independent prognostic analysis of ESCA. (B) Multivariate independent prognostic analysis of ESCA. (C) Calibration curves for the overall survival. (D) Nomogram for predicting overall survival (predicting 1-year, 3-year, and 5-year). Red line: Represents the prediction trajectory corresponding to the specific variable values of an individual patient. Blue box: Represents the score range corresponding to the variable values, indicating the contribution of different variable values to the model. Probability density curve: Represents the distribution trend of variable values in the sample data, with peaks indicating the common value range of the variable. (E and F) Survival prediction by clinical parameters and risk scores. (G) PFS curves of patients with ESCA. (H) Calibration curves for the PFS nomogram. (I) Nomogram for predicting PFS (predicting 1-year, 3-year, and 5-year).
Abbreviations: T, Tumor; M, Metastasis; N, Node.
Furthermore, we further investigated the impact of the risk score on progression-free survival (PFS) in patients with ESCA. PFS was defined as the time interval from the date of initial diagnosis to the date of documented disease progression or death from any cause. Patients who were alive without disease progression at the last follow-up were censored at that point. By considering all deaths as PFS events, we provided a comprehensive assessment of patient outcomes. The analysis results showed that high-risk ESCA patients had significantly shorter PFS compared to low-risk patients (Figure 4G). Moreover, a PFS-based nomogram that incorporated both clinicopathological variables and the risk score was constructed to predict the 1-, 3-, and 5-year PFS for ESCA patients (Figure 4H and I). These findings indicated that the pathological stage and risk score based on M0MRGs were independent prognostic factors. While the pathological stage is a well-established marker for prognosis, the M0MRG risk score may provide additional advantages by offering molecular-level insights into tumor behaviors. Specifically, the M0MRG risk score can stratify patients within the same pathological stage and identify individuals with a high potential risk of poor prognosis despite having a low-stage disease. This can enhance the precision of risk assessment and guide personalized treatment strategies.
GSEA
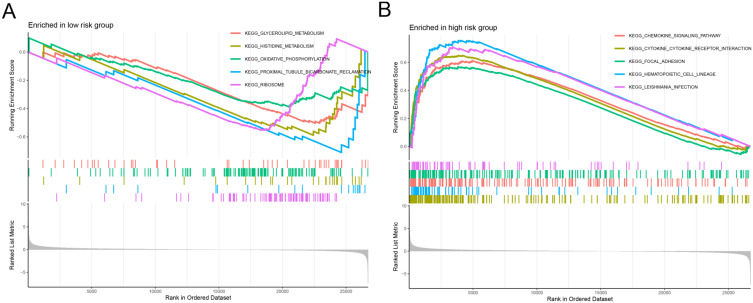
GSEA was performed to further explore the molecular pathways associated with the high- and low-risk groups. The low-risk group showed significant enrichment in pathways related to glycerolipid metabolism, oxidative phosphorylation, and histidine metabolism, which are indicative of a more metabolically active and less aggressive tumor phenotype (Figure 5A). In contrast, the high-risk group demonstrated significant enrichment in pathways related to chemokine signaling, cytokine-receptor interactions, and focal adhesion, which are associated with tumor progression, immune evasion, and metastasis (Figure 5B). These findings suggested that distinct treatment strategies may be required for patients with different risk profiles, highlighting the potential for pathway-specific interventions.
Figure 5.
GSEA. (A and B) GSEA of the low-risk and high-risk groups.
Immune Cell Infiltration and Tumor Mutation Burden (TMB) Between Different Risk Groups
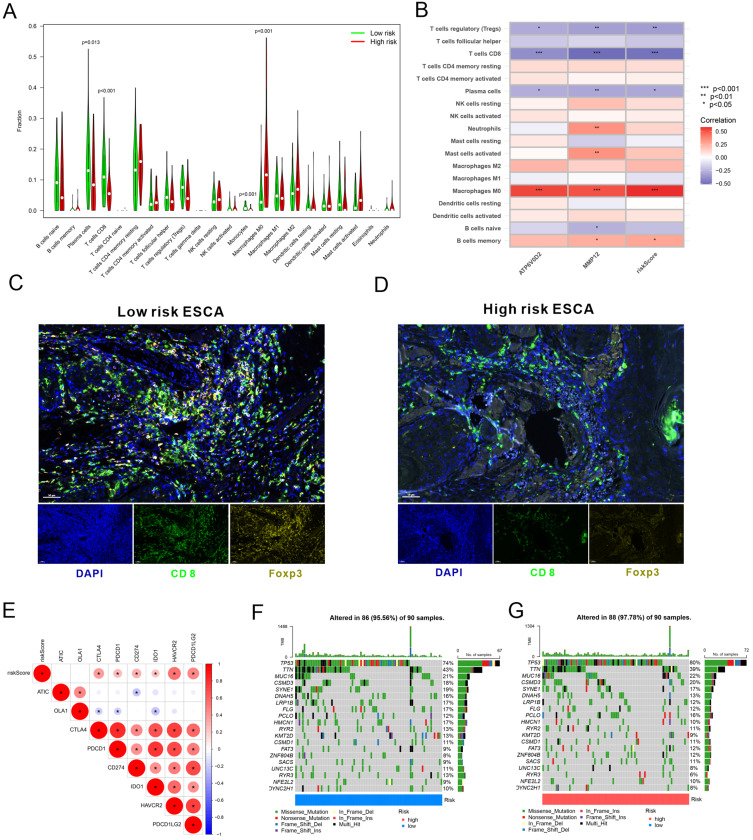
Immune cell infiltration analysis was conducted to deeply understand the differences in immune cell infiltration between the low-risk and high-risk groups. The results revealed a significant enrichment of M0 macrophages in the high-risk group and an obvious enrichment of plasma cells, CD8+ T cells, and monocytes in the low-risk group (Figure 6A). The risk score demonstrated a positive correlation with M0 macrophages and memory B cells but a negative correlation with Treg cells, CD8 T cells, and plasma cells. Additionally, ATP6V0D2 was positively associated with M0 macrophages and negatively associated with Treg cells, CD8+ T cells, and plasma cells. MMP12 shared a positive association with M0 macrophages, activated mast cells, neutrophils, and memory B cells and a negative association with naïve B cells, Treg cells, CD8+ T cells, and plasma cells (Figure 6B). Additionally, based on ATP6V0D2 and MMP12 expression levels, tissue samples were acquired from ESCA patients in the high-risk and low-risk groups, followed by MP-IHC. Our findings revealed that patients in the low-risk group showed significantly elevated infiltration of CD8+ T and Treg cells relative to those in the high-risk group (Figure 6C and D). These correlations suggested that the high-risk group may be characterized by a more immunosuppressive microenvironment, which could contribute to worse outcomes.
Figure 6.
Immune cell infiltration and TMB between the high- and low-risk groups. (A) Immune cell infiltration in high- and low-risk groups. (B) Correlation analysis between risk scores and immune cells. (C and D) MP-IHC staining for infiltration of immune cells. (E) Correlation analysis between risk scores and immune checkpoints. (F and G) TMB analysis in high- and low-risk groups. CD8+ T cells: CD8; regulatory T cells: Foxp3.
Furthermore, a correlation analysis was conducted to determine the relationship between risk scores and immune checkpoint molecules. The findings manifested that immune checkpoint molecules CTLA4, PDCD1, CD274, IDO1, HAVCR2, and PDCD1LG2 were upregulated in high-risk subjects versus low-risk individuals (Figure 6E). Additionally, the number of mutated genes in each tumor sample was calculated to determine the TMB; it was found that the high- and low-risk groups demonstrated substantial differences in TMB (Figure 6F and G). These findings may provide further support for the clinical relevance of the risk score in predicting immune response and therapeutic sensitivity.
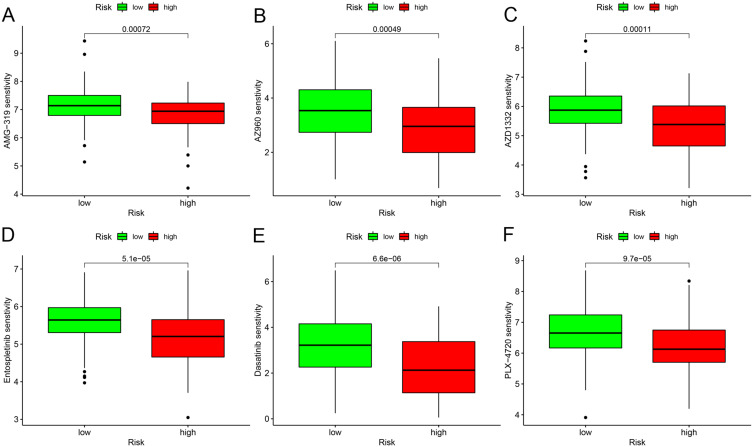
Finally, we explored the potential for drug sensitivity prediction based on the risk score using the “oncoPredict” R package. The findings unraveled that an elevated risk score was linked to diminished IC50 values for various drugs, including AMG-319 (Figure 7A), AZ960 (Figure 7B), AZD1332 (Figure 7C), Entospletinib (Figure 7D), Dasatinib (Figure 7E), and PLX-4720 (Figure 7F). This highlights the potential of the M0MRG-based risk score not only as a prognostic marker but also as a tool for guiding personalized treatment strategies.
Figure 7.
Drug sensitivity analysis by “oncoPredict”. (A–F) Drug sensitivity analysis in different risk groups based on risk scores.
Discussion
In ESCA, M0 macrophages as the predominant subset of immune cells exhibit diverse phenotypes and functions.9,30 Previous studies have provided evidence for the involvement of M0 macrophages in gliomas.12 In ESCA, the polarization of M0 macrophages towards M2 macrophages may promote immune evasion and tumor growth.31 However, due to the lack of specific markers, the analysis of the functions of M0 macrophages in the TME is hindered, resulting in their role in ESCA not being fully elucidated. This study aimed to investigate the potential contributions of M0MRGs in the TME and identify prognostic markers for ESCA.
Notably, our results indicated that elevated M0MRGs (ATP6V0D2 and MMP12) were associated with unfavorable prognoses. ESCA tissue microarray and multivariate analysis results confirmed that upregulated ATP6V0D2 and MMP12 in tumor tissues were reliable independent prognostic markers for ESCA patients. A recent study has demonstrated that ATP6V0D2, as a pivotal element in the macrophage-specific autophagosome-lysosome fusion mechanism, is crucial in preserving organelle homeostasis within macrophages, therefore impeding inflammation and mitigating bacterial infections.32 Moreover, another study has exhibited that lactate diminishes ATP6V0D2 expression in tumor-associated macrophages to boost HIF-2α-mediated tumor progression.33 Nevertheless, whether ATP6V0D2 affects the function of M0 macrophages in ESCA needs to be further explored. Li et al have analyzed MMP expression patterns in ESCC patients and found that MMP12 emerges as a significant predictor for the 5-year survival of ESCC patients and is positively correlated with advanced clinical stages. The impacts of MMP12 extend to key tumor-associated pathways and are associated with the infiltration of immune cells, especially activated mast cells and M0 macrophages, whilst MMP12 knockdown can effectively reduce ESCC cell proliferation, which collectively demonstrates that highly expressed MMP12 is a novel potential and valuable prognostic factor for ESCC.34 Based on the above studies, M0 macrophage aggregation, which was observed in our study, may lead to poor prognosis in tumor patients. Nonetheless, there is still a need to analyze the effect of M0MRGs on the function of M0 macrophages and to determine M0 macrophage-specific molecular markers with the use of ATP6V0D2 and MMP12 transgenic mice (knockout or overexpression) and single-cell sequencing techniques.
Through MP-IHC, the present study determined that although the overall number of macrophages in the vicinity of ESCA was elevated, M1 macrophage infiltration into the central region of the tumor was comparatively diminished, which suggested that there may be a potential issue pertaining to tumor cell evasion. Furthermore, patients with high ATP6V0D2 and MMP12 expressions showed substantially more CD8 T and Treg cells in the low-risk group than those in the high-risk group. CD8+ tumor-infiltrating lymphocytes play an essential role in tumor rejection by recognizing tumor antigens and directly killing transformed cells. Effector CD8+ T cells in TME can produce interleukin (IL)-2, IL-12, and interferon-gamma (IFN-γ), which increases the cytotoxic capacity of CD8+ T cells and facilitates targeted tumor cell killing. Elevated levels of cytotoxic CD8+ T cells in TME exert anti-tumor effects and can improve prognosis in all types of cancer,35 consistent with our findings that high-risk ESCA patients had low CD8+ T cell infiltration. However, our study also exhibited marked enrichment of Treg cells in the low-risk group, which is inconsistent with previous results that Treg cells are the principal barrier to initiating the immune effects of immunotherapy.36 These results fully validate that the heterogeneity of the tumor immune microenvironment is also a manifestation of the diverse responses of different patients to immunotherapy. Innovatively, our study constructed a risk prediction model based on M0MRGs to distinguish between high- and low-risk patients and screened out sensitive chemicals based on risk scores, thus providing a new complementary regimen for immunotherapy.
Undoubtedly, there are some limitations in the present study. Specifically, the present study exclusively identified ATP6V0D2 and MMP12 as prognostic indicators. However, the correlation of ATP6V0D2 and MMP12 with M0 macrophages and the therapeutic effects of targeting ATP6V0D2 and MMP12 was not verified through in vivo and in vitro experiments. Second, the distribution of sample sizes across different tumor stages is unequal. In short, samples in stages I and IV were fewer than those in stages II and III. This imbalance reflects the clinical presentation of ESCA and the availability of surgical specimens but may limit the generalizability of our findings across all disease stages. Therefore, larger and more balanced cohorts are needed in the future to validate our results and to further explore the roles of ATP6V0D2 and MMP12 in early and late-stage ESCA. Our study partially elucidated the functions of M0 macrophages, ATP6V0D2, and MMP12 in ESCA. By highlighting the potential significance of these factors, the present study may provide preliminary guidance for future research on the therapeutic potential of targeting M0 macrophages in ESCA management.
Conclusion
In conclusion, our results demonstrated the significance of ATP6V0D2 and MMP12 in the prognostic risk model for ESCA, linking the presence of ATP6V0D2 and MMP12 to unfavorable prognoses and unveiling a plausible involvement of increased M0 macrophages in ESCA progression. Additionally, our results also elucidated that high-risk scores were associated with diminished responsiveness to certain chemotherapeutics. Overall, this study may provide novel therapeutic targets and innovative treatment strategies for ESCA management.
Acknowledgments
We would like to appreciate the sample donors and research teams for the TCGA and GEO cohort that provided data for this article.
Funding Statement
This study was supported by the Key Research Project of Sichuan Province (No.2023YFS0199), Chengdu Science and Technology Project (No.2022-YF05-01833-SN), and Sichuan Cadre Health Care Research Project (GBKT23020).
Data Availability Statement
In this study, the transcriptomic, somatic mutation, and clinical data of the ESCA cohort were obtained from TCGA data portal (https://cancergenome.nih.gov/) and GEO datasets (GSE5364 and GSE17351) (http://www.ncbi.nlm.nih.gov/geo/). All data were publicly available.
Author Contributions
All authors made significant contributions to the work reported, whether in terms of conception, study design, execution, acquisition of data, analysis and interpretation, or in all these areas. All authors took part in drafting, revising, or critically reviewing the article and gave final approval of the version to be published. All authors have agreed on the journal to which the article is to be submitted and agreed to be responsible for all aspects of the work.
Disclosure
The authors declare no competing interests.
References
- 1.Sung H, Ferlay J, Siegel RL, et al.. global cancer statistics 2020: GLOBOCAN estimates of incidence and mortality worldwide for 36 cancers in 185 countries. CA Cancer J Clin. 2021;71(3):209–249. doi: 10.3322/caac.21660 [DOI] [PubMed] [Google Scholar]
- 2.Arnold M, Soerjomataram I, Ferlay J, Forman D. Global incidence of oesophageal cancer by histological subtype in 2012. Gut. 2015;64(3):381–387. doi: 10.1136/gutjnl-2014-308124 [DOI] [PubMed] [Google Scholar]
- 3.Then EO, Lopez M, Saleem S, et al.. Esophageal cancer: an updated surveillance epidemiology and end results database analysis. World J Oncol. 2020;11(2):55–64. doi: 10.14740/wjon1254 [DOI] [PMC free article] [PubMed] [Google Scholar]
- 4.Xia C, Dong X, Li H, et al.. Cancer statistics in China and United States, 2022: profiles, trends, and determinants. Chin Med J. 2022;135(5):584–590. doi: 10.1097/CM9.0000000000002108 [DOI] [PMC free article] [PubMed] [Google Scholar]
- 5.Chen R, Zheng S, Zhang S. Patterns and trends in esophageal cancer incidence and mortality in China: an analysis based on cancer registry data. J Natl Cancer Cent. 2023;3(1):21–27. doi: 10.1016/j.jncc.2023.01.002 [DOI] [PMC free article] [PubMed] [Google Scholar]
- 6.Hirano H, Kato K. Systemic treatment of advanced esophageal squamous cell carcinoma: chemotherapy, molecular-targeting therapy and immunotherapy. Jpn J Clin Oncol. 2019;49(5):412–420. doi: 10.1093/jjco/hyz034 [DOI] [PubMed] [Google Scholar]
- 7.Lee S, Cohen DJ. Pharmacotherapy for metastatic esophageal cancer: where do we need to improve?. Expert Opin Pharmacother. 2019;20(3):357–366. doi: 10.1080/14656566.2018.1551881 [DOI] [PubMed] [Google Scholar]
- 8.Miller JF, Sadelain M. The journey from discoveries in fundamental immunology to cancer immunotherapy. Cancer Cell. 2015;27(4):439–449. doi: 10.1016/j.ccell.2015.03.007 [DOI] [PubMed] [Google Scholar]
- 9.DeNardo DG, Ruffell B. Macrophages as regulators of tumour immunity and immunotherapy. Nat Rev Immunol. 2019;19(6):369–382. doi: 10.1038/s41577-019-0127-6 [DOI] [PMC free article] [PubMed] [Google Scholar]
- 10.Dinh HQ, Pan F, Wang G, et al. Integrated single-cell transcriptome analysis reveals heterogeneity of esophageal squamous cell carcinoma microenvironment. Nat Commun. 2021;12(1):7335. doi: 10.1038/s41467-021-27599-5 [DOI] [PMC free article] [PubMed] [Google Scholar]
- 11.Zhao YL, Tian PX, Han F, et al.. Comparison of the characteristics of macrophages derived from murine spleen, peritoneal cavity, and bone marrow. J Zhejiang Univ Sci B. 2017;18(12):1055–1063. doi: 10.1631/jzus.B1700003 [DOI] [PMC free article] [PubMed] [Google Scholar]
- 12.Gabrusiewicz K, Rodriguez B, Wei J, et al.. Glioblastoma-infiltrated innate immune cells resemble M0 macrophage phenotype. JCI Insight. 2016;1(2). doi: 10.1172/jci.insight.85841 [DOI] [PMC free article] [PubMed] [Google Scholar]
- 13.Zhang Y, Zou J, Chen R. An M0 macrophage-related prognostic model for hepatocellular carcinoma. BMC Cancer. 2022;22(1):791. doi: 10.1186/s12885-022-09872-y [DOI] [PMC free article] [PubMed] [Google Scholar]
- 14.Shapiro SD, Kobayashi DK, Ley T. Cloning and characterization of a unique elastolytic metalloproteinase produced by human alveolar macrophages. J Biol Chem. 1993;268(32):23824–23829. doi: 10.1016/S0021-9258(20)80459-1 [DOI] [PubMed] [Google Scholar]
- 15.Nagase H, Woessner JF. Matrix metalloproteinases. J Biol Chem. 1999;274(31):21491–21494. doi: 10.1074/jbc.274.31.21491 [DOI] [PubMed] [Google Scholar]
- 16.Han F, Zhang S, Zhang L, Hao Q. The overexpression and predictive significance of MMP-12 in esophageal squamous cell carcinoma. Pathol Res Pract. 2017;213(12):1519–1522. doi: 10.1016/j.prp.2017.09.023 [DOI] [PubMed] [Google Scholar]
- 17.Cotter K, Stransky L, McGuire C, Forgac M. Recent insights into the structure, regulation, and function of the V-ATPases. Trends Biochem Sci. 2015;40(10):611–622. doi: 10.1016/j.tibs.2015.08.005 [DOI] [PMC free article] [PubMed] [Google Scholar]
- 18.Nishi T, Kawasaki-Nishi S, Forgac M. Expression and function of the mouse V-ATPase d subunit isoforms. J Biol Chem. 2003;278(47):46396–46402. doi: 10.1074/jbc.M303924200 [DOI] [PubMed] [Google Scholar]
- 19.Qi M, Liu DM, Ji W, Wang HL. ATP6V0D2, a subunit associated with proton transport, serves an oncogenic role in esophagus cancer and is correlated with epithelial-mesenchymal transition. Esophagus. 2020;17(4):456–467. doi: 10.1007/s10388-020-00735-8 [DOI] [PubMed] [Google Scholar]
- 20.Ritchie ME, Phipson B, Wu D, et al.. Limma powers differential expression analyses for RNA-sequencing and microarray studies. Nucleic Acids Res. 2015;43(7):e47. doi: 10.1093/nar/gkv007 [DOI] [PMC free article] [PubMed] [Google Scholar]
- 21.Ogata H, Goto S, Sato K, Fujibuchi W, Bono H, Kanehisa M. KEGG: Kyoto encyclopedia of genes and genomes. Nucleic Acids Res. 1999;27(1):29–34. doi: 10.1093/nar/27.1.29 [DOI] [PMC free article] [PubMed] [Google Scholar]
- 22.Kanehisa M, Furumichi M, Sato Y, Kawashima M, Ishiguro-Watanabe M. KEGG for taxonomy-based analysis of pathways and genomes. Nucleic Acids Res. 2023;51(D1):D587–d592. doi: 10.1093/nar/gkac963 [DOI] [PMC free article] [PubMed] [Google Scholar]
- 23.Kanehisa M. Toward understanding the origin and evolution of cellular organisms. Protein Sci. 2019;28(11):1947–1951. doi: 10.1002/pro.3715 [DOI] [PMC free article] [PubMed] [Google Scholar]
- 24.Wu T, Hu E, Xu S, et al. clusterProfiler 4.0: a universal enrichment tool for interpreting omics data. Innovation. 2021;2(3):100141. doi: 10.1016/j.xinn.2021.100141 [DOI] [PMC free article] [PubMed] [Google Scholar]
- 25.Yu G, Wang LG, Han Y, He QY. clusterProfiler: an R package for comparing biological themes among gene clusters. Omics. 2012;16(5):284–287. doi: 10.1089/omi.2011.0118 [DOI] [PMC free article] [PubMed] [Google Scholar]
- 26.Mayakonda A, Lin DC, Assenov Y, Plass C, Koeffler HP. Maftools: efficient and comprehensive analysis of somatic variants in cancer. Genome Res. 2018;28(11):1747–1756. doi: 10.1101/gr.239244.118 [DOI] [PMC free article] [PubMed] [Google Scholar]
- 27.Chen B, Khodadoust MS, Liu CL, Newman AM, Alizadeh AA. Profiling Tumor Infiltrating Immune Cells with CIBERSORT. Methods Mol Biol. 2018;1711:243–259. doi: 10.1007/978-1-4939-7493-1_12 [DOI] [PMC free article] [PubMed] [Google Scholar]
- 28.Ma X, Zhang L, Huang D, et al. Quantitative radiomic biomarkers for discrimination between neuromyelitis optica spectrum disorder and multiple sclerosis. J Magn Reson Imaging. 2019;49(4):1113–1121. doi: 10.1002/jmri.26287 [DOI] [PubMed] [Google Scholar]
- 29.Maeser D, Gruener RF, S R. Huang: oncoPredict: an R package for predicting in vivo or cancer patient drug response and biomarkers from cell line screening data. Brief Bioinform. 2021;22(6). doi: 10.1093/bib/bbab260 [DOI] [PMC free article] [PubMed] [Google Scholar]
- 30.Gao J, Liang Y, Wang L. Shaping polarization of tumor-associated macrophages in cancer immunotherapy. Front Immunol. 2022;13:888713. doi: 10.3389/fimmu.2022.888713 [DOI] [PMC free article] [PubMed] [Google Scholar]
- 31.Schiffmann LM, Plum PS, Fuchs HF, Babic B, Bruns CJ, Schmidt T. Tumor microenvironment of esophageal cancer. Cancers. 2021;13(18):4678. doi: 10.3390/cancers13184678 [DOI] [PMC free article] [PubMed] [Google Scholar]
- 32.Xia Y, Liu N, Xie X, et al. The macrophage-specific V-ATPase subunit ATP6V0D2 restricts inflammasome activation and bacterial infection by facilitating autophagosome-lysosome fusion. Autophagy. 2019;15(6):960–975. doi: 10.1080/15548627.2019.1569916 [DOI] [PMC free article] [PubMed] [Google Scholar]
- 33.Liu N, Luo J, Kuang D, et al. Lactate inhibits ATP6V0d2 expression in tumor-associated macrophages to promote HIF-2α-mediated tumor progression. J Clin Invest. 2019;129(2):631–646. doi: 10.1172/jci123027 [DOI] [PMC free article] [PubMed] [Google Scholar]
- 34.Mao JT, Lu Q, Jing PY, et al.. Comprehensive analysis of prognostic value and immune infiltration of MMP12 in esophageal squamous cell carcinoma. J Oncol. 2022;2022:4097428. doi: 10.1155/2022/4097428 [DOI] [PMC free article] [PubMed] [Google Scholar]
- 35.van der Leun AM, Thommen DS, Schumacher TN. CD8(+) T cell states in human cancer: insights from single-cell analysis. Nat Rev Cancer. 2020;20(4):218–232. doi: 10.1038/s41568-019-0235-4 [DOI] [PMC free article] [PubMed] [Google Scholar]
- 36.Tay C, Tanaka A, Sakaguchi S. Tumor-infiltrating regulatory T cells as targets of cancer immunotherapy. Cancer Cell. 2023;41(3):450–465. doi: 10.1016/j.ccell.2023.02.014 [DOI] [PubMed] [Google Scholar]
Associated Data
This section collects any data citations, data availability statements, or supplementary materials included in this article.
Data Availability Statement
In this study, the transcriptomic, somatic mutation, and clinical data of the ESCA cohort were obtained from TCGA data portal (https://cancergenome.nih.gov/) and GEO datasets (GSE5364 and GSE17351) (http://www.ncbi.nlm.nih.gov/geo/). All data were publicly available.


