Abstract
The impact of rock bolts on the mechanical behavior of nonpersistent joints, including the intricate interactions between the joints, rock bridges, and rock bolts, has received limited investigation despite their effectiveness in reinforcing rock mass discontinuities. In order to tackle this issue, a variety of normal stresses were applied during direct shear tests conducted on artificial rock-like specimens with nonpersistent joints, both bolted and unbolted. Meanwhile, to measure the deformation in the rock bridge and joint plane region, a set of strain gauges were implemented. The findings indicated that the local shear deformation-shear displacement curves, whether with or without rock bolts, can be categorized into five distinct stages. Application of the rock bolts on the nonpersistent joint plane resulted in making the following two important statements: (a) The rock bolts delay the shear stress transmission along the joint plane from the joint parts to the rock bridge area; (b) The rock bolts limit the dilatancy occurring in both the joint parts and at the rock bridge area. Furthermore, the shear displacement of the bolted nonpersistent joint specimen at the peak shear strength was found to be greater than that of the unbolted nonpersistent joint specimen indicating protection of the rock bridge by the rock bolts. Whether bolted or unbolted, the stiffness values seem to be the same for the nonpersistent joint plane for a selected normal stress; this observation is significantly different from that observed for the persistent joint plane.
Keywords: Rock bridge, Bolt reinforcement, Nonpersistent joint plane, Shear deformation, Shear strength
Subject terms: Engineering, Civil engineering
Introduction
The application of bolting reinforcement on rock masses has proven to be a highly effective and cost-efficient method, extensively employed in mining and tunnelling endeavors1–3. Bolted connections have the potential for two different forms of motion: either opening in a direction perpendicular to the surface or shearing within the surface plane4,5. The failure of anchoring systems has been shown to be significantly influenced by shear loading, as demonstrated in a case study conducted by McHugh and Signer6. Several tests have been carried out to examine the ability of rock bolts to resist shear forces7. Several factors that have been systematically studied for their influence on shear behavior include bolt type8,9, bolt surface profile10,11, bolt material12, bolt inclination13, bolt pretension14and normal stress11,15. However, almost all the tests stated above were conducted on persistent joint planes, which is not the usual situation encountered in engineering practice. An observation as shown in Fig. 1 demonstrated that after the excavation of a tunnel considerable nonpersistent joints occurred in the surrounding rock masses. Disregarding the impact of rock bolt reinforcement on the shear characteristics of nonpersistent joint planes is not permissible.
Fig. 1.
The nonpersistent joints present in the rock masses surrounding an underground tunnel.
The mechanism between the bolt and nonpersistent joint plane is of great interest as rock bolts play a crucial role in preventing failure of bolted jointed rock masses. To the best of our knowledge, there is limited research documented regarding the interaction mechanism between bolt and nonpersistent joint plane in the field of rock engineering. In the present study, conventional strain gauges are used to monitor the local deformation of the nonpersistent joint plane for specimens with/without rock bolts in the direct shear test. Firstly, the state-of-the-art of rock bolts applied on persistent joints is briefly reviewed in Section "Literature review". Then, the experimental setup is presented in Sect. 3. Afterward, the local deformation behaviour of a nonpersistent joint plane with/without bolted rock joints is investigated in Sect. 4. In Sect. 5, the analysis was conducted to examine the impact of rock bolts on the overall shear characteristics of the discontinuous joint surface.
Literature review
As early as the late 1980s, the shear stress–shear displacement properties of a joint plane with anchors were examined by Ge et al16, who also studied the correlation between the shear strength properties of the persistent joint surface with anchors and the angle at which the bolts are inclined. A few years back, Wang et al.17 showed that prestressed rock bolts significantly improve the shear resistance and shear stiffness at the initial part of the shear stress-displacement curve. The shear strength of anchored persistent joints has been examined in relation to the JRC value and particle friction factor by Zhang et al.18. Teng et al.19have investigated the shear characteristics of a jointed rock mass under no anchor, end anchor, and full anchor conditions, among which the fully anchored bolt and joint plane sustained shear stress together. Through PFC numerical simulation, the impact of joint inclination on the shear strength and shear displacement of a continuously anchored jointed rock mass has been investigated. Subsequently, the shear strength of a continuously jointed rock mass with anchorage and the internal progression of micro-cracks were examined through laboratory experiments, considering various normal stresses and anchoring angles20. Guo et al.21 and Liu et al.22 have found that when the anchoring angle is 60°, the ultimate load of the anchored joint surface reaches the maximum value.
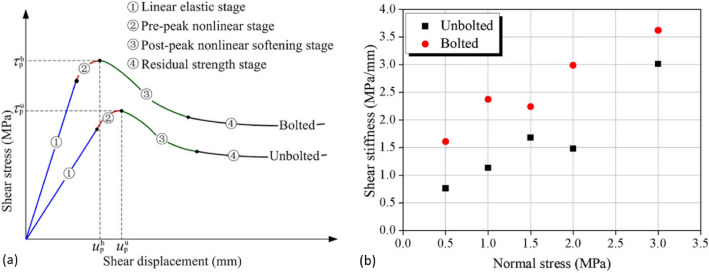
Figure 2(a) illustrates the standard shear stress–shear displacement graphs obtained from conducting a direct shear test on a continuous jointed rock formation, both with and without the implementation of rock bolts. An increase in peak shear strength was noted when the applied normal stress increased for both bolted and unbolted specimens23. The authors also noted a variation in shear stiffness under different normal stresses, with the bolted joints exhibiting greater shear stiffness compared to the unbolted joint specimens, as depicted in Fig. 2(b). It is important to acknowledge that rock bolts not only restrict the displacement of the joint along the shear plane but also induce additional normal stress due to bolt expansion.
Fig. 2.
Direct shear test results obtained for bolted and unbolted persistent joint planes23.
Experimental program
A simplified model of a nonpersistent joint plane
A model of a nonpersistent joint plane first proposed by Lajtai24, which is shown in Fig. 3, was adopted in the present study. This model consists of a rock bridge with length Lr separating a pair of coplanar rough joints with length Lj. Thus, the joint persistence, k, could be given by:
| 1 |
Fig. 3.
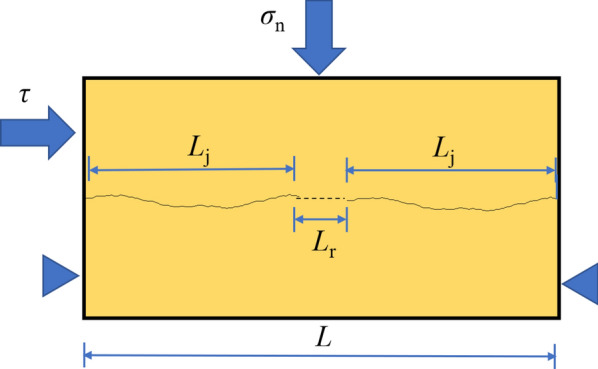
A model of a nonpersistent joint plane.
Barton and Choubey25have devised ten standardized roughness profiles that have been extensively employed by scholars to measure the roughness of rock joints. Researchers have extensively utilized ten standard roughness profiles that were developed to measure the roughness of rock joints. In this paper, one rough profile (JRC = 17.6) was selected to create joint templates by using the 3D printing technique. Note that the original JRC value of the chosen roughness profile was modified according to Li and Xiao26 to include the scale effect.
Preparation of specimens
The rock-like specimens with rough joint planes were produced using cement mortar material. An orthogonal experimental design was used to combine water, portland cement (grade 42.5), and fine sand (particle diameter < 1 mm) in a weight ratio of 1:2:4, in order to prepare the cement mortar. Table 1 displays the mechanical characteristics of the rock-like substance utilized in the experiments.
Table 1.
Mechanical properties of the rock-like material used in the experiments.
| Property | Density: g/cm3 |
UCS: MPa |
Tensile strength: MPa | Young’s modulus: GPa | Poisson’s ratio | Cohesion: MPa |
Friction angle |
|---|---|---|---|---|---|---|---|
| Value | 2.57 | 48.6 | 4.97 | 11.26 | 0.20 | 13.87 | 31.23° |
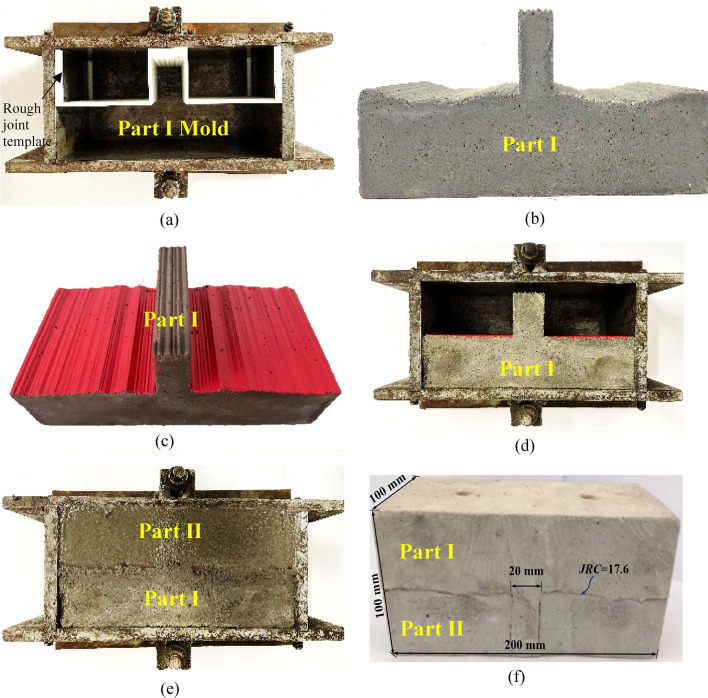
The dimensions of the joined specimens were chosen as 200 mm in length, 100 mm in width, and 100 mm in height. The length of the rock bridge, denoted as Lr, remained constant at 20 mm. The fabrication process of the specimens is depicted in Fig. 4. The figure indicates that the specimens were manufactured in two distinct sections, specifically Part I and Part II, to guarantee a seamless and appropriately linked joint. The rough joint template was placed inside the mold, as shown in Fig. 4a to cast Part I (Fig. 4b). Furthermore, a crimson artificial resin emulsion coating containing a water barrier was evenly administered onto the connecting surface to hinder the sticking together of the two segments of the sample (Fig. 4c). Subsequently, Part I was reinserted into the mold (Fig. 4d), and Part II was cast next to it (Fig. 4e). After a period of 24 h, the specimen was shaped and extracted from the mold (Fig. 4f.). Afterwards, the sample was carefully stored for an extra period of 28 days under controlled conditions in a laboratory, maintaining a temperature of 20 ± 2 °C and a relative humidity of 95%.
Fig. 4.
The fabricating procedure used for specimens.
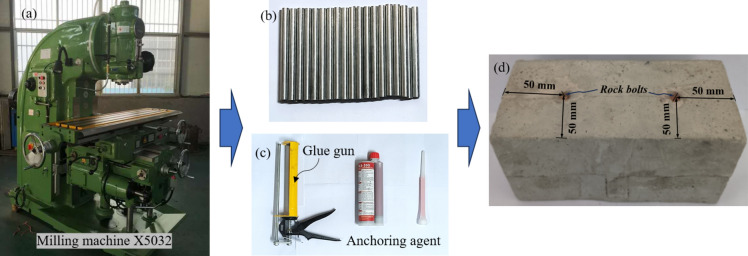
The installation procedure of the rock bolt is shown in Fig. 5. Firstly, the rock bolt boreholes perpendicular to the joint plane were prepared by using the milling machine X5032 (Fig. 5a). The diameter of the two rock bolt holes is 10 mm. Figure 5b shows the choice of solid aluminum rods to imitate rock bolts, which have a diameter of 6.0 mm and a length of 100 mm. Table 2 displays the rock bolts’ mechanical characteristics. Then, the anchoring agent named epoxy planting adhesive (RLS-390) (shown in Fig. 5c), which has high strength after curing, was poured into the rock bolt holes by the glue gun. Finally, each rock bolt was installed along the created hole immediately (Fig. 5d). In Fig. 5d, the rock bolts were symmetrically arranged with a horizontal perpendicular distance of 50 mm from the specimen’s edge, and a spacing of 100 mm between the two rock bolts. Once the adhesive agent had fully cured, the specimens secured with bolts underwent direct shear testing. For comparison, the same number of specimens without rock bolts were prepared and tested.
Fig. 5.
Installation of aluminum bolts: (a) Drilling hole by milling machine X5032; (b) Aluminum rods; (c) Anchoring agent; (d) Jointed model material specimen reinforced by aluminum bolts.
Table 2.
Mechanical parameters of the aluminum bolts used in the experiment.
| Diameter: mm | Young’s modulus: GPa | Yield strength: MPa |
Ultimate strength: MPa |
Poisson’s ratio | Elongation rate |
|---|---|---|---|---|---|
| 6 | 200 | 204 | 240 | 0.25 | 14% |
Test program
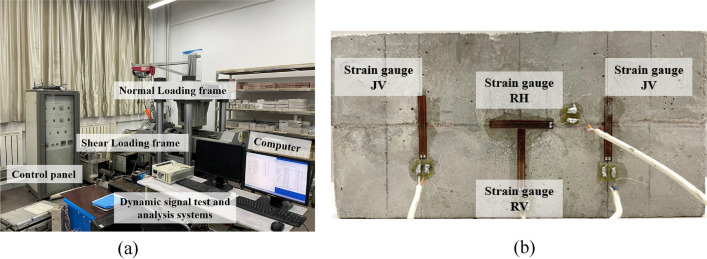
The objective of this study was to investigate the impact of rock bolt reinforcement on the shearing characteristics of the nonpersistent joint surface at varying levels of normal stresses. Shear tests were performed at normal stresses, σn, ranging from 2 to 10 MPa in increments of 2 MPa. The experiments were carried out utilizing a self-constructed JAW-600 shear testing apparatus (Fig. 6a) accessible at Shandong University of Science and Technology. In order to maintain a nearly stationary condition throughout the test, a consistent rate of shear loading at 0.10 mm/min was implemented. To measure the horizontal strain (RH) and vertical strain (RV) in the rock bridge region, a set of perpendicular strain gauges were implemented. Furthermore, two strain gauges were mounted at right angles to the left and right connections in order to measure their vertical strain (JV), as illustrated in Fig. 6(b).
Fig. 6.
Test system and layout of the strain gauges.
Local deformation occurring along the nonpersistent joint plane
For specimens without the rock bolts
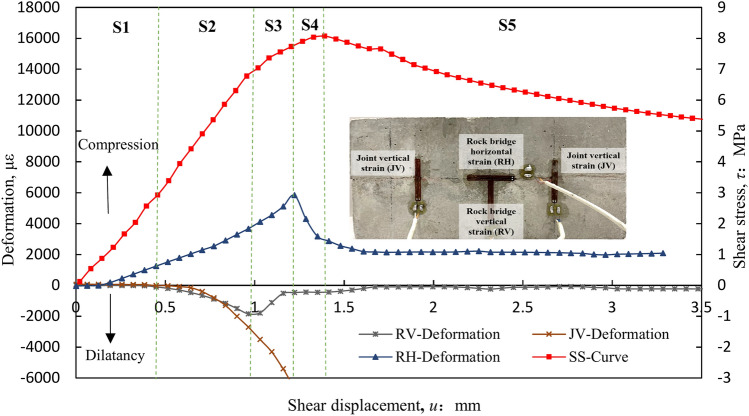
Figure 7 illustrates the typical deformation curves of the unbolted nonpersistent joints plane with the shear displacement (taking σn = 8.0 MPa as an example).
Fig.7.
Deformation – shear displacement curves of the nonpersistent joint plane without rock bolt reinforcement (σn = 8.0 MPa).
According to Fig. 7, the deformation of the nonpersistent joint plane could be divided into five stages:
S1 stage: As the shear displacement increases, there is no vertical deformation observed at the rock bridge (RV) or on the joint plane (JV) during the stage S1. In the early part of S1, no horizontal deformation occurs at the rock bridge (RH) too. During the early part of the S1 stage, the increase of shear stress mainly occurs at the joint parts. Afterward, RH increases with the shear displacement, which means that the rock bridge starts to bear the shear loading together with the joint parts.
S2 stage: During this phase, the RH continues to increase as the shear displacement increases, whereas the RV and JV show expansion. It means that with the shearing process, dilatancy occurs along the nonpersistent joint plane. According to Fig. 7, it is clear that the dilatancy occurring at the joint parts is larger than that occurring at the rock bridge area during the latter part of this stage. Thus, part of the dilatancy occurring at the rock bridge might be attributed to that occurring at the joint parts due to their mutual dependence.
S3 stage: JV shows rapid expansion, which means the dilatancy of the joint increases significantly at this stage. On the other hand, RV shows a reduction of dilation, indicating the appearance of cracks at the joint tip (Fig. 8). When cracks appear, the interdependence between the joints and rock bridge diminishes, resulting in a decrease in the amount of dilatancy that occurs at the rock bridge. The SS curve flattens and enters the yield stage, but the shear stress–shear displacement relationship has not yet reached its peak shear strength. At the conclusion of this phase, as a result of the significant vertical deformation of the joint (JV), the strain gauges exceed their maximum strains and are unable to effectively monitor the data.
Fig. 8.
Cracks occurring at the joint tips.
S4 stage: During the initial phase of S4, the RH curve experiences a significant decline as the SS curve rises, primarily caused by the emergence of cracks in the rock bridge region. During this stage, the stability of the vertical deformation of the rock bridge (RV) suggests that the shear loading is no longer transferred to the area of the rock bridge. While the rock bridge’s shear bearing capacity starts to diminish, the bearing stress on the joint plane continues to rise. It implies that the joint parts contribute more to the global bearing capability of the joint plane. The SS curve reaches its maximum value at the conclusion of this stage.
S5 stage: The horizontal deformation of the rock bridge (RH) decreases slowly with the shear displacement and RV remains stable. This suggests that the cracks in the rock bridge area have developed fully. At this point, the SS curve demonstrates a declining trend as a result of the further shearing causing the abrasion of joint components.
For specimens with the rock bolts
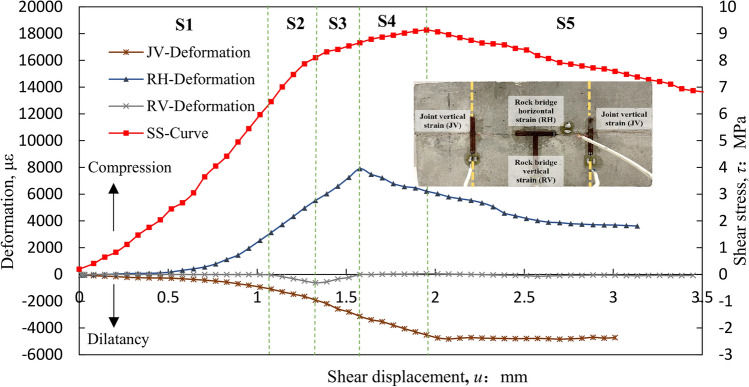
Figure 9 shows the deformation curves of the bolted nonpersistent joint plane with shear displacement. Additionally, the bolted nonpersistent joint plane undergoes a deformation process consisting of five distinct stages. Compared with the deformation of the specimen without the rock bolts, some changes have taken place in the deformation curve under the action of the rock bolts. The main observations are as follows:
Fig. 9.
Deformation—shear displacement curves of the nonpersistent joint plane with the rock bolt reinforcement (σn = 8.0 MPa).
S1 stage: The RV behavior is similar to the nonpersistent joint plane specimen without the rock bolts. RH curve, herein, also shows no deformation at first and then rises with the SS curve. Nevertheless, the shear displacement corresponding to the rise point is greater than that for the unbolted specimen (as shown in Fig. 7). This means that the time of the shear stress transmitted to the rock bridge is delayed because of the presence of the rock bolts. The JV curve shows an increasing trend from the beginning indicating that the joint parts bear more shear stress than that for the unbolted specimen at this stage.
S2 stage: The vertical deformation occurring at the rock bridge (RV) starts to indicate dilation together with JV. But both RV and JV dilation values are much less than those for the unbolted joint plane as shown in Fig. 7. This means that the dilatancy of the rock bridge and joint parts decreases under the action of the rock bolts. In this study, fully anchored bolts are adopted and they restrict the joint plane movement and limit the occurrence of dilatancy.
S3 stage: The overall behavior is the same as for the specimens without the rock bolts. The RV shows a reduction in dilation implying that cracks appear at the joint tips. Nevertheless, as shown in Fig. 9, the shear displacement corresponding to the cracking point for the bolted specimen is 1.3 mm, while that for the unbolted specimen is about 1.0 mm, indicating that the rock bolts could delay the occurrence of cracks at joint tips. Moreover, even though the JV indicates an increase in dilatancy, the values are less than those for the unbolted joint plane confirming that the rock bolts limit the dilatancy of joint parts.
S4 stage: For this stage, the trends of the deformation curves shown in Fig. 9 are similar to the specimens without the rock bolts. Cracks start to appear in the rock bridge region, causing the shear strength to become less variable as the shear displacement increases. Nevertheless, the shear displacement corresponding to the peak value of RH for the case of with the rock bolts (approximately 1.6 mm) is more than that of the specimen without the rock bolts (approximately 1.25 mm), which further confirms that the rock bolts limit the occurrence of cracks inside the rock bridge area, and the rock bridge, to some extent, gets protected.
S5 stage: This stage provides the post-peak stress behavior. RH continues to decrease, implying the continuous occurrence of new cracks in the rock bridge area; while JV and RV remain unchanged. That is to say, although failure keeps developing along the nonpersistent joint plane, dilatancy is controlled by the application of the rock bolt reinforcement.This partially explains the increased residual durability of the bolted specimen (Fig. 9) compared to that of the unbolted specimen (Fig. 7).
By comparing Fig. 9 with Fig. 7 it could be concluded that the application of the rock bolts on the nonpersistent joint plane leads to the following two important statements: Firstly, the rock bolts delay the shear stress transmission along the joint plane from joint parts to the rock bridge area, and protect the rock bridge; secondly, the rock bolts reduce the dilatancy occurring in both the joint parts and rock bridge area.
Influence of normal stress on local deformation
In order to further examine the impact of rock bolt reinforcement on the nonpermanent joint plane, the analysis focused on the shear displacement test results for bolted and unbolted specimens at five different normal stress levels, corresponding to a specific condition of JV, RH, and RV.
Figure 10 shows the difference in the shear displacement between the bolted and unbolted specimens corresponding to the beginning of dilatancy of the joint plane (i.e., when JV begins to expand as shown in Figs. 7 and 9) under different normal stresses. The shear displacement difference is obtained by subtracting the unbolted specimen shear displacement from the corresponding bolted specimen shear displacement.
Fig.10.
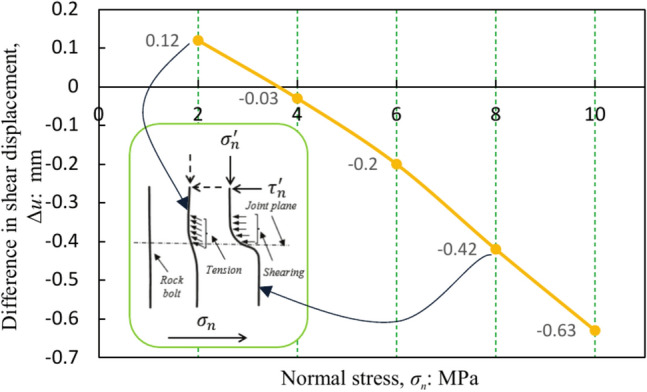
Variation of difference in shear displacement between the bolted and unbolted nonpersistent joint specimens (when JV shows the start of dilation) with normal stress.
As shown in Fig. 10, the result indicated that the deformation behaviour of the nonpersistent joint plane is strongly influenced by the rock bolts. The difference in shear displacement decreased slowly as the normal stress increased. When the normal stress reaches 2.0 MPa, it is observed that the shear displacement difference is greater than zero. This suggests that the expansion time of JV in the bolted specimen is delayed in comparison to the unbolted specimen. In situations with low normal stress (e.g., σn = 2.0 MPa), the rock bolts have a greater impact than the normal stress in restricting the occurrence of dilatancy on the joint plane. Consequently, the expansion of JV necessitates a higher shear displacement under the bolted condition as opposed to the unbolted condition. The limitation of dilatancy was provided by the tensile resistance of the rock bolt acting on the joint plane, as shown in Fig. 11a. For high normal stress situations, the normal stress plays a larger role than the rock bolt tensile resistance in limiting the dilation of the joint. This leads to more shear deformation occurring in the rock bolt (Fig. 11b) under elevated normal stress in comparison to lower normal stress prior to dilatancy onset. Moreover, with the shear deformation of the rock bolt, as shown in Fig. 11b, the dilatancy might occur due to the slip of the joint wall along the rock joint. Herein, the deformed rock bolt serves as a slide rail27. As the normal stress increases, the rock bolt experiences greater shear deformation, leading to an elevated level of joint wall sliding. That leads to the decreasing trend of shear displacement difference with increasing normal stress as shown in Fig. 10.
Fig. 11.
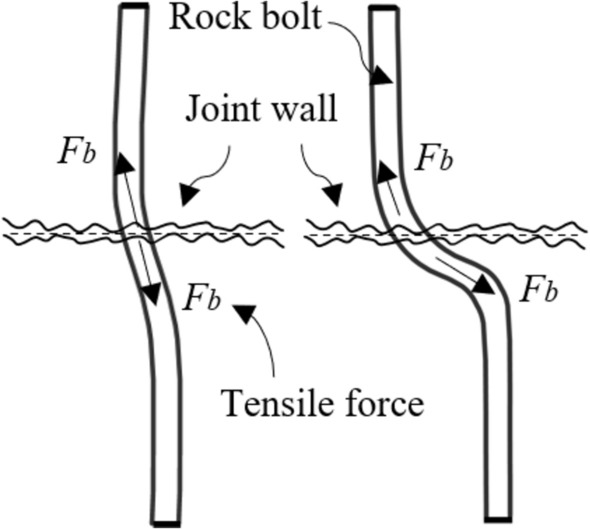
Rock bolt actions on the joint plane under different normal stress conditions. (a) low normal stress; (b) high normal stress.
Under various normal stresses, the discrepancy in shear displacement between the bolted and unbolted nonpersistent joint plane specimens is measured by Fig. 12, corresponding to the maximum vertical deformation of the rock bridge (RV) and the maximum horizontal deformation of the rock bridge (RH).
Fig.12.
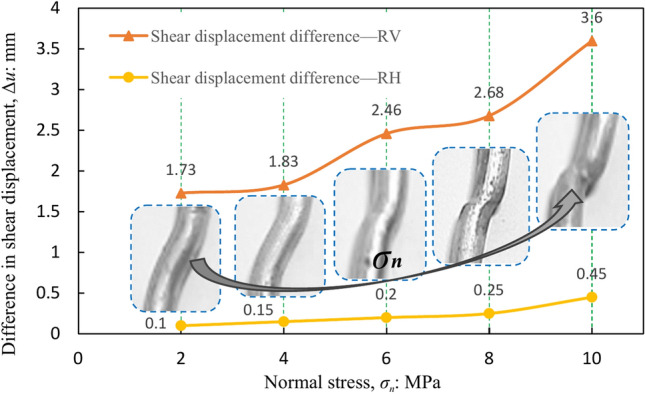
Variation of difference in shear displacement between the bolted and unbolted nonpersistent joint specimens at peak RV and peak RH with normal stress.
The shear displacement difference curves in Fig. 12 increase gradually with the normal stress. The deformation of the rock bolts was observed by pulling out the rock bolts from the nonpersistent joint specimens. At low normal stress levels, the vertical separation of the two joint halves is facilitated by the dilatancy effect, enabling the transmission of shear stress along the joint plane from the joint parts to the rock bridge area. As a result, cracks develop at the ends of the connections and progress in the rock bridge region for the bolted specimen. Consequently, the shear displacement difference is small for both the horizontal deformation of the rock bridge (RH) and the vertical deformation of the rock bridge (RV) when subjected to low normal stress circumstances. Conversely, the expansion impact has a tendency to diminish as the normal stress increases, resulting in a delay in the formation of cracks at joint tips and cracks at the rock bridge for specimens with bolts. Consequently, the variation in shear displacement between bolted and unbolted specimens at peak RV and RH rises in accordance with the applied normal stress. Figure 12 shows that the global value of the shear displacement difference is larger for the RV than for the RH. This means that the rock bolts limit the rock bridge’s vertical dilatancy more than that of the rock bridge’s horizontal dilatancy.
Global shearing behavior of the nonpersistent joint specimens
Typical shear stress–shear displacement behaviour.
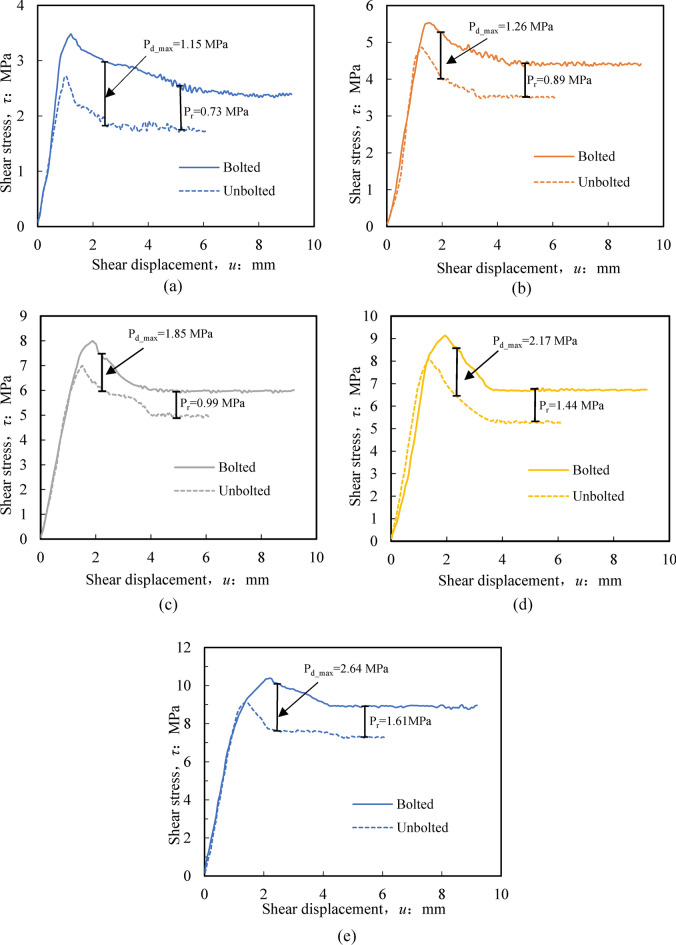
The shear stress and shear displacement curves for joint specimens without bolts and with bolts are presented in Fig. 13, considering different normal stresses. Consequently, the shear shear rose linearly as the shear displacement increased until reaching a nonlinear stage before the peak. During the nonlinear stage, the shear stress progressively converges towards its maximum shear strength. Subsequently, as the shear displacement continues to increase, a consistent post-peak softening phase is observed, followed by a residual stress phase, which is consistent across all conducted experiments. From analysing the plots depicting shear stress–shear displacement, several conclusions can be drawn.
For all tests, the maximum shear displacement that corresponds to the maximum shear stress does not exceed 3 mm. It is consistent with the study results of persistent joint anchoring specimens.
Compared with those of unbolted nonpersistent joint specimens, the peak shear displacement of bolted joint specimens is generally higher under selected normal stress. This suggests that despite the rock bolts having resistance against shearing in the opposite direction, they are capable of withstanding considerable deformation prior to reaching the maximum shear strength.
In the case of a nonpersistent joint, the peak shear strength exhibited an upward trend as the applied normal stress increased for both the bolted and unbolted specimens. Nevertheless, the bolted specimens demonstrated a superior peak shear strength compared to the unbolted specimens.
Fig. 13.
Shear stress–shear displacement curves under various normal stresses for nonpersistent bolted and unbolted specimens.
Figure 14 presents the schematic graphs illustrating the correlation between shear stress and shear displacement for joint specimens with and without bolts, based on the preceding analysis. There are four distinct stages that can be used to classify the entire shear process. In comparison to bolted and unbolted persistent joint specimens (as shown in Fig. 2a), the bolted and unbolted nonpersistent joint specimens exhibit the following variations.
Fig. 14.
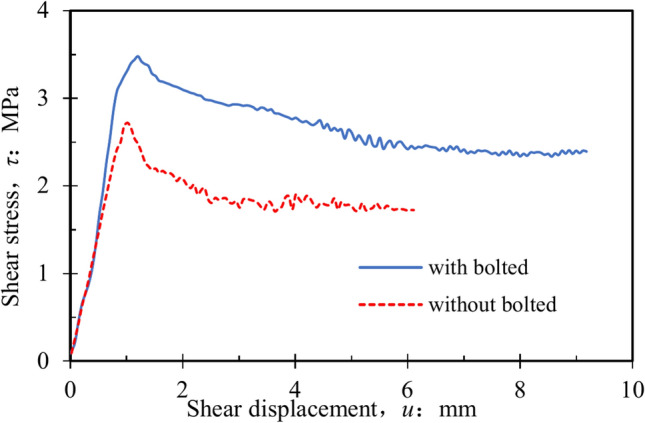
Typical features of shear stress–shear displacement curves for nonpersistent bolted and unbolted specimens.
(1) In the early part of shearing, the curves of both persistent and nonpersistent show an approximately linear relationship. It is worth mentioning that the gradient of the bolted and unbolted curves exhibits significant disparity when considering persistent joint specimens. Nevertheless, the curves of the nonpersistent joint bolted sample nearly align with those of the unbolted samples during the initial stage of linear elasticity. The reason for this is the major role the rock bridge plays compared to the rock bolt in the elastic range which is limited to very small shear displacement.
(2) The bolted specimens exhibit a greater shear displacement () at peak strength () compared to the unbolted specimens because the rock bolts delay the transmission of shear stress along the joint plane, thus protecting the rock bridge. On the other hand, the rock bridge of the unbolted nonpersistent joint sample deteriorates prematurely in comparison to the nonpersistent joint sample that is bolted. Unlike the unbolted joints, achieving peak shear strength in the bolted joint necessitates shearing along a greater displacement.
(3) Figure 15 illustrates the difference in shear displacement at peak strength between the bolted and unbolted specimens for the nonpersistent joint plane under the influence of normal stress. The results display that the difference in shear displacement gradually increases with the normal stress. The shear displacement at the maximum shear strength of the unbolted nonpersistent joint sample remains nearly unchanged regardless of the applied normal stress (Fig. 13). It is clear that the deformation of rock bolts from BC to B’C’ gradually increases with the normal stress (Fig. 15).
Fig. 15.
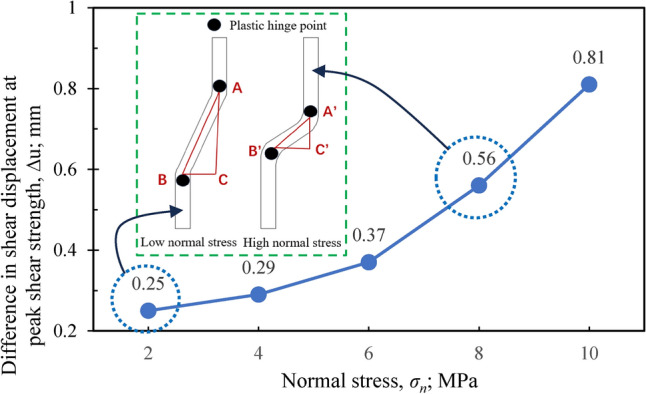
Variation of difference in shear displacement at peak strength for nonpersistent bolted and unbolted specimens.
with normal stress.
(4) Compared to persistent joint specimens (Fig. 2a), in the post-peak nonlinear softening stage, the bolted nonpersistent joint specimen exhibits a lower decline rate compared to the unbolted specimens. Even though the rock bolt of the nonpersistent joint specimen has reached the yield condition in this stage, the rock bolt continues to provide the bearing resistance. Furthermore, the rock bridge remains partially intact in the bolted nonpersistent joint specimen. The shear resistance of the bolted nonpersistent joint specimen is shared by the rock bolts, rock bridge, and friction of the joint plane. However, the unbolted nonpersistent joint specimen mainly relies on the joint planes to resist the shear force during the post-peak stage.
Shear strength characteristics
To evaluate the shear strength characteristics of nonpersistent joint specimens, an investigation was carried out on the test results of the (the peak shear strength) and Pd_max (the difference of maximum peak post shear strength between the bolted and unbolted nonpersistent joint specimens) and Pr (difference of residual strength between the bolted and unbolted nonpersistent joint specimens) for bolted and unbolted nonpersistent joint specimens. This analysis was performed at five distinct normal stress levels. Both bolted and unbolted nonpersistent joint specimens were utilized, and the difference was determined by subtracting the value of the unbolted specimen from that of the bolted specimen.
The comparison of peak shear strength between the bolted and unbolted nonpersistent joint specimens is conducted in Fig. 16. The peak shear strength of bolted and unbolted specimens increased with increasing normal stress. The occurrence of this outcome is a result of the increased compressive force between the two halves of the joint as the normal stress increases. For each normal stress, the bolted specimens show a higher peak shear strength than the unbolted specimens. This is due to the additional resistance of the rock bolts.Furthermore, it is observed that the disparity in maximum shear resistance between the bolted and unbolted samples has increased with the applied normal stress, rising from 0.76 MPa to 1.24 MPa. The resistance to shearing of the rock bolts, along with the applied normal stress, plays a role in determining the shear capacity of the nonpersistent joint plane. As the normal stress rises, greater shear deformations are required to achieve the rock bolts’ yield capacities; consequently, the disparity in maximum shear strength increases with the normal stress. In general, the shear strength of nonpersistent joint specimens is improved by bolt anchorage.
Fig. 16.
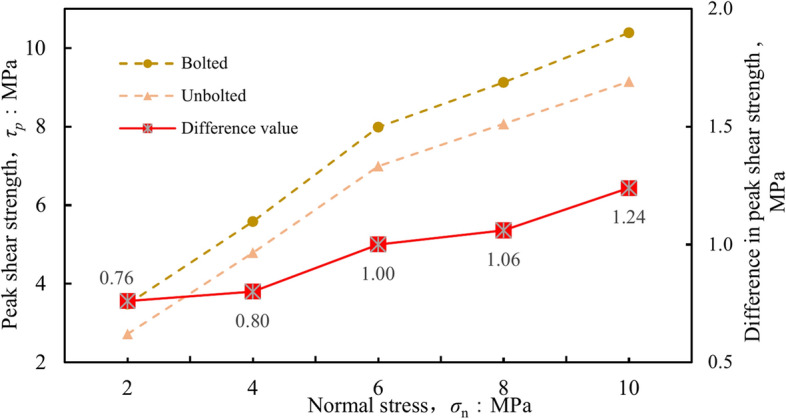
Variation of the peak shear strength with the normal stress for bolted and unbolted nonpersistent joint specimens.
Figure 13 shows that the Pd_max commonly occurs at the post-peak stage, which is similar to the findings claimed by Wu et al.28and Ding29. It is also important to consider the residual strength difference (Pr) between the bolted and unbolted nonpersistent joint specimens. For a better understanding of the variation of Pd_max and Pr with the normal stress, the Pd_max and Pr values were collected from Fig. 13 and re-plotted in Fig. 17.
Fig. 17.
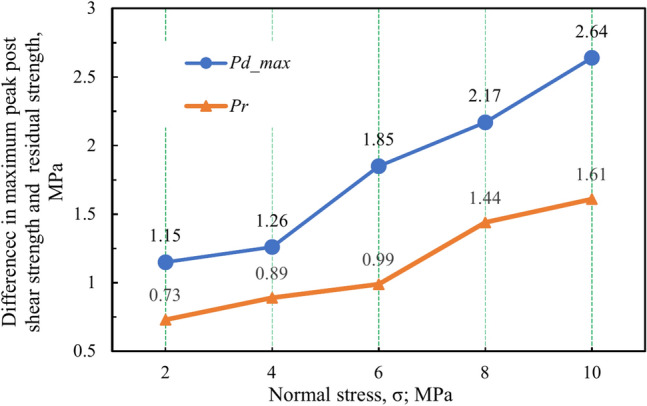
Variation of Pd_max and Pr with the normal stress.
As can be seen from Fig. 17, the result suggest that the Pd_max and Pr behaviors are significantly impacted by the normal stress. The Pd_max and Pr values rise in response to the applied normal stress. The Pd_max and maximum residual strength difference are 2.64 MPa and 1.61 MPa, respectively. The combined contribution of the rock bolts and rock bridge is responsible for Pd_max and Pr, and the shear resistance of the rock bolts protects the rock bridge in the case of the nonpersistent joint plane. Furthermore, the rock bolts’ capacity to resist shear also escalates in proportion to the applied normal stress. These reasons lead to an increase of Pd_max and Pr with the normal stress. However, the variation of the residual strength difference (Pr) for the persistent joint specimens is different from the nonpersistent joint specimens. There is minimal disparity in the residual durability between bolted and unbolted persistent joint specimens. For nonpersistent joint plane specimens, because the rock bridge is protected by the rock bolts, the behaviour is different from that of the persistent joint plane specimens during the residual stage.
Shear stiffness
The characterization of shear deformability in rock joints necessitates the consideration of shear stiffness as a significant parameter. Through an analysis of the shear mechanism, the shear stiffness of bolted nonpersistent joint specimens can be divided into three components: the shear stiffness of rock joints, the shear stiffness of rock bridge, and the supplementary shear stiffness resulting from the pin effect of the rock bolt. The shear stiffness for both bolted and unbolted specimens was determined in this specific investigation by extracting the linear section of the shear stress–shear displacement graphs (see Fig. 13). The shear stiffness was determined by quantifying the slopes of the linear section of the plots. Fig 18 illustrates the shear stiffness values of both the bolted and unbolted specimens, showcasing the impact of bolt reinforcement on shear stiffness.
Fig. 18.
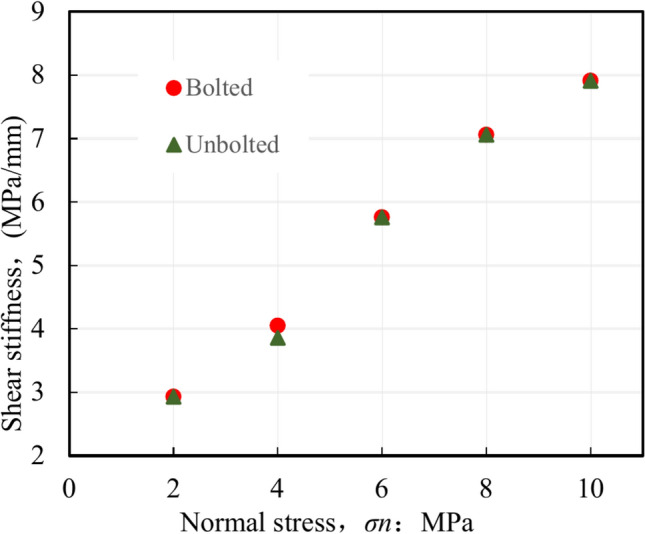
Shear stiffness of anchored and unanchored nonpersistent joint specimens under difference normal stresses.
For both bolted and unbolted nonpersistent joint specimens, there is a significant increase in shear stiffness as the normal stress increases, as shown by Fig. 18. It is important to mention that the shear stiffness outcomes of the bolted and unbolted nonpersistent joint samples noticeably differ from those of the persistent joint samples (as seen in the comparison shown in Fig. 2b and Fig. 18). In the case of joint specimens that are nonpersistent, the shear stiffness of the bolted joint specimen closely matches that of the unbolted joint specimen for all five normal stresses, as shown in Fig. 18. Fig 2b shows that the bolted joint specimen has a higher shear stiffness than the unbolted joint specimen for any chosen normal stress, in the case of persistent joint specimens. The rock bridge of the bolted nonpersistent joint specimen is crucial during the pre-peak linear stage, which is the underlying cause. A recent report given by Paronuzzi et al.30 indicates that a tiny rock bridge can contribute up to 25%−40% shear resistance. Typically, the rock bolt has minimal impact on the shear stiffness of nonpersistent joint specimens.
Conclusions
The objective of this research was to examine how rock bolts affect the shear deformation and shear strength of an nonpersisitent joint plane when different normal stresses are applied. The primary outcomes of this research are outlined as follows:
The shearing process of rock masses with nonpersistent closed rough joints with/without rock bolts can be divided into five stages as detailed in the paper. By comparing the shear deformation curves of the bolted and unbolted nonpersistent joint specimens, it is possible to make the following two important statements: (a) The rock bolts delay the shear stress transmission along the joint plane from the joint parts to the rock bridge area, and protect the rock bridge; (b) The rock bolts limit the dilatancy occurring in both the joint parts and rock bridge area.
The maximum shear displacement associated with the peak shear stress does not exceed 3 mm in any of the tests. This aligns with the findings documented in the existing literature on persistent joint anchoring samples.The amount of displacement needed to achieve the maximum shear strength of the bolted nonpersistent joint specimen exceeds that of the unbolted nonpersistent joint specimen. The presence of rock bolts causes a delay in shear stress transmission along the joint plane from joint parts to the rock bridge area.
The variation in peak shear strength between the joint specimens with bolts and without bolts increases as the normal stress increases; the obtained values for the difference range from 0.76 MPa to 1.24 MPa. It should be emphasized that the shear strength of the bolted nonpersistent joint plane is influenced by both the normal resistance and the shear resistance offered by the rock bolts. As the normal stresstypical pressure rises, greater shear deformations are required to achieve the rock bolts’ yield capacities; consequently, the disparity in peak shear strength amplifies with the normal stress.
The shear stiffness results of the bolted and unbolted nonpersistent joint specimens are different from those of the persistent joint specimens.The shear stiffness of the bolted joint specimens was nearly identical to the unbolted specimens for each of the five normal stresses in the case of nonpersistent joint specimens. This is due to the same vital role the rock bridge plays on both the bolted and unbolted nonpersistent joint specimens.
Acknowledgements
The research reported in this manuscript was financially supported by the National Natural Science Foundation of China (Grant No. 52274088) and the Natural Science Foundation of Shandong Province, China (Grant No. ZR2022ME056).
Author contributions
X.X. and H.Y. wrote the main manuscript text; X.X. , H.Y. and G.L. made investigation; H.Y. prepared Figs. 1–6 and G.L. prepared 10–18 and X.X. , H.Y. prepared Figs. 7–9; H.Y.wrote the original draft; X.X. and P.H. made reviewing and editing; All authors reviewed the manuscript.
Funding
National Natural Science Foundation of China, 52274088, Natural Science Foundation of Shandong Province, ZR2022ME056.
Data availability
Data sets generated during the current study are available from the corresponding author on reasonable request.
Declarations
Competing interests
The authors declare no competing interests.
Footnotes
Publisher’s note
Springer Nature remains neutral with regard to jurisdictional claims in published maps and institutional affiliations.
References
- 1.Chappell, B. Rock bolts and shear stiffness in jointed rock masses. J. Geotech. Engrg.115(2), 179–197 (1989). [Google Scholar]
- 2.Pellet, F. et al. Analytical model for the mechanical behaviour of bolted rock joints subjected to shearing. Rock. Mech. Rock. Eng.29(2), 73–97 (1989). [Google Scholar]
- 3.Fahimifar, A. et al. Analytical approach for the design of active grouted rockbolts in tunnel stability based on convergence-confinement method. Tunn. Undergr. Sp. Tech.24(4), 363–375 (2009). [Google Scholar]
- 4.Srivastava, L. P. et al. Effect of fully grouted passive bolts on joint shear strength parameters in a blocky mass. Rock. Mech. Rock. Eng.48, 1197–1206 (2015). [Google Scholar]
- 5.Li, L. et al. Shear resistance contribution of support systems in double shear test. Tunn. Undergr. Sp. Tech.56, 168–175 (2016). [Google Scholar]
- 6.McHugh, E.et al. Roof bolt response to shear stress: laboratory analysis. In: Proceedings of 18th International Conference on Ground Control in Mining. Morgantown: WV University, 232–238 (1999)
- 7.Li, L. et al. Parametric study of rockbolt shear behaviour by double shear test. Rock. Mech. Rock. Eng.49(12), 4787–4797 (2016). [Google Scholar]
- 8.Grasselli, G. 3D behaviour of bolted rock joints: experimental and numerical study. Int. J. Rock. Mech. Min. Sci.42, 13–24 (2005). [Google Scholar]
- 9.Chen, Y. et al. Performance of fully encapsulated rebar bolts and D-Bolts under combined pull-and-shear loading. Tunn. Undergr. Space. Technol.45, 99–106 (2015). [Google Scholar]
- 10.Jalalifar, H. et al. The effect of surface profile, rock strength and pretension load on bending behaviour of fully grouted bolts. Geotech. Geol. Eng.24, 1203–1227 (2006). [Google Scholar]
- 11.Jalalifar, H. et al. Experimental and 3D numerical simulation of reinforced shear joints. Rock. Mech. Rock. Eng.43, 95–103 (2010). [Google Scholar]
- 12.Ferrero, A. M. The shear strength of reinforced rock joints. Int. J. Rock. Mech. Mining. Sci.32(6), 595–605 (1995). [Google Scholar]
- 13.Chen, Y. et al. Influence of loading condition and rock strength to the performance of rock bolts. Geotech. Test. J.38(2), 208–218 (2015). [Google Scholar]
- 14.Li, X. et al. Behaviour of fiberglass bolts, rock bolts and cable bolts in shear. Rock. Mech. Rock. Eng.49, 2723–2735 (2016). [Google Scholar]
- 15.Spang, K. et al. Action of fully-grouted bolts in jointed rock and factors of infuence. Rock. Mech. Rock. Eng.23, 201–229 (1990). [Google Scholar]
- 16.Ge, X. R. Study on shear behaviour of anchorage joint surface. Chin. J. Geotech. Eng.10(1), 8–19 (1988). [Google Scholar]
- 17.Wang, G. et al. Rate-dependent mechanical behavior of rough rock joints. Int. J. Rock. Mech. Min. Sci.83, 231–240 (2016). [Google Scholar]
- 18.Zhang, Y. Z. et al. Macro and micro study on failure mechanism of anchoring joint with different roughness. J. Cent. South. Univ.48(12), 3373–3383 (2017). [Google Scholar]
- 19.Teng, J. Y. et al. Experimental study on the influence of anchorage mode on shear performance of jointed rock mass. Rock. Soil. Mech.38(8), 2279–2285 (2017). [Google Scholar]
- 20.Song, Y. et al. Macro and micro shear failure characteristics of rock mass with bolted nonpersistent joint. The Chinese Journal of Geological Hazard and Control.32(01), 95–101 (2021). [Google Scholar]
- 21.Guo, H.X. 2019 Analysis of the influence of anchoring angle on shear characteristics of anchoring joint. Ph.D. thesis. South China University of Technology, Guangdong, China
- 22.Liu, S. G. et al. Shear test of frictionless joint plane with anchorage at different anchoring angles. Chin. J. Underg. Space. Eng.18(3), 824–831 (2022). [Google Scholar]
- 23.Chen, N. et al. Shear behavior of rough rock joints reinforced by bolts. Int. J. Geomech.18(1), 04017130 (2018). [Google Scholar]
- 24.Lajtai, E. Z. Strength of discontinuous rocks in direct shear. Géotechnique.19, 218–332 (1969). [Google Scholar]
- 25.Barton, N. The shear strength of rock joints in theory and practice. Rock. Mech.10(1), 1–54 (1977). [Google Scholar]
- 26.Li, R. et al. Research on a new JRC calculation formula for rock joints based on fine digital processing of Barton standard section line. Chin. J. Rock. Mech. Eng.37(S1), 3515–3522 (2018). [Google Scholar]
- 27.Song, H. W. et al. Numerical simulation on bolted rock joint shearing performance. Int. J. Rock. Mech. Min. Sci.20(3), 460–465 (2011). [Google Scholar]
- 28.Wu, X. Z. et al. Influence of joint roughness on the shear behavior of fully encapsulated rockbolts. Rock. Mech. Rock. Eng.51(3), 953–959 (2018). [Google Scholar]
- 29.Ding, S.X. 2019 Anchoring bearing characteristics and engineering application of deep roadway surrounding rock with weak interlayer Ph.D. thesis China University of Mining and Technology, Xuzhou, China
- 30.Paronuzzi, P. et al. 3D stress-strain analysis of a failed limestone wedge influenced by an intact rock bridge. Rock. Mech. Rock. Eng.49, 3223–3242 (2016). [Google Scholar]
Associated Data
This section collects any data citations, data availability statements, or supplementary materials included in this article.
Data Availability Statement
Data sets generated during the current study are available from the corresponding author on reasonable request.


