Abstract
A vehicle-to-grid (V2G) technology enables bidirectional power exchange between electric vehicles (EVs) and the power grid, presenting enhanced grid stability and load management opportunities. This study investigates a comprehensive microgrid system integrating EVs with solar (8 MW), wind (4.5 MW), and diesel generation sources, focusing on peak load reduction and frequency regulation capabilities. Through MATLAB/Simulink simulations using a Phasor model, we analyze five distinct scenarios with varying EV fleet sizes (20–100 vehicles, 40 kW each). Results demonstrate that V2G integration effectively maintains grid frequency within 59.5–60.5 Hz across all test cases, achieving optimal performance using 100 EVs. Through strategic EV discharge scheduling, the system successfully reduces evening peak loads from 3000 to 2200 kW. Economic analysis reveals decreasing payback periods from 5.2 to 2.8 years as fleet size increases, with ROI improving from 12.5 to 23.1%. These findings establish quantitative benchmarks for V2G implementation in microgrids and demonstrate its viability for grid stability enhancement and load management applications.
Keywords: V2G, Electric vehicle, PEV, Smart Grid, PV, Wind energy, Frequency regulation, Peak shelving, Microgrid
Subject terms: Energy science and technology, Engineering
Introduction
Microgrids have posed themselves as a suitable solution for the deficiencies of SSDG, which is the traditional power grid system. They are decentralized systems that combine renewable power generators with intelligent energy storage and control methods that offer modular approaches to utility-scale applications and can function cooperatively or singly; they decrease greenhouse gas emissions and mitigate reliance on foreign energy sources. With the incorporation of EVs into the microgrid system, microgrid systems have received a huge boost because they act as movable energy storage systems that can flow in both directions. This Vehicle-to-grid integration allows the EVs to be involved in load management and the grid support power for electric vehicles, eliminating dependency on backup generators and lowering infrastructure inefficiency. On the other hand, the integration of EVs in microgrids has technical issues, mainly in terms of stability and power quality. This sawtooth behavior of charge and discharge of EV batteries imposes a periodically varying load on the supply grid, causing fluctuating voltage and frequency, which may impact connected loads and utilities.
The present research explores the potential for Plug-in Electric Vehicle (PEV) battery storage in shedding peak load (peak-shelving) and frequency regulation in distribution networks. We also discuss how the distribution networks may be used to store and release energy during peak demand with frequency regulation during periods of significant supply or demand variations.
Our research employs a comprehensive microgrid model to evaluate various EV charging/discharging scenarios and their interactions with different power sources. The investigation focuses on five key aspects:
frequency regulation performance with varying EV fleet sizes (20–100 vehicles),
peak load reduction capabilities,
system response dynamics,
economic viability analysis, and
optimization strategies for grid support and battery lifecycle management.
The primary challenges solved concern unpredictable charging behavior, voltage and frequency control, multiple-EV operation, scalability effects, and optimizing grid support and battery lifespan. By demonstrating various methods of quantitative analysis and simulation, the proposed work solves the question of how V2G systems can be activated and integrated into the current microgrid design to solidify a more robust infrastructure.
This research offers new approaches to scaling V2G operation, frequency regulation evaluation, peak load management, and estimation of the break-even point of V2G practice at multiple levels. The results provide guidelines on sizing and integrating an optimal number of EVs for such Microgrida microgrids and renewable energy sources, thereby contributing to knowledge in sustainable microgrid operation.
Literature review
The integration of Electric Vehicles into energy systems, particularly microgrids, has attracted significant attention due to their potential to enhance grid stability, reduce peak loads, and support the integration of renewable energy sources. Recent research has focused on understanding how EVs can be coordinated with renewable energy sources (solar, wind) and traditional generation (diesel) to achieve greater efficiency in energy management within microgrids. While many studies have examined the role of EVs in grid systems1–4, few have addressed the complex, hierarchical nature of coordination among large-scale EV charging stations1, or the challenges associated with dynamic charging demand in transportation systems2. Further, research on the stochastic optimization of microgrid energy management, particularly incorporating EV charging and renewable energy systems, remains limited3,4.
A core area of exploration is vehicle-to-grid technology, which allows EVs to both charge from and discharge energy into the grid, offering potential solutions for peak load reduction and frequency regulation. Studies have shown that V2G systems can effectively improve grid reliability by balancing supply and demand. For example, Ref.5 explores the dynamic energy management in microgrids that includes EVs, highlighting their role in reducing operational costs while providing additional support to the grid. Similarly, Refs.6,7 examine optimization models for scheduling EV charging in microgrids to minimize energy costs and avoid battery degradation. While these studies focus on scheduling and cost reduction, they overlook the broader impact of V2G technology on grid stability and peak demand reduction, which are central to the aims of your study.
Regarding grid stability, several studies have investigated integrating renewable energy systems with EVs to stabilize the grid. For example, Ref.8 explores the role of EVs in managing local peaks within solar-powered systems, emphasizing the need for EVs to absorb excess energy during periods of low demand and supply it back during peak demand. Reference9 discusses the dynamic and multi-stage planning of microgrids incorporating EVs, stressing the importance of real-time energy demand fluctuations. However, while these studies provide insights into peak shaving, they focus on static models and do not explore the dynamic interaction between EVs, renewable energy sources, and grid systems during peak-load events and real-time frequency regulation. The integration of EVs into microgrids also brings environmental and sustainability considerations. Researchers such as Refs.10,11 have explored EVs’ role in enhancing energy systems’ sustainability by optimizing charging paths and energy storage solutions. While reducing carbon footprints is often a focus, there still needs to be more research regarding the long-term sustainability of V2G systems, particularly their environmental and economic impacts over time. Most studies have focused on operational benefits like peak shaving and grid support and have yet to address how these benefits can be maintained in the long term.
Furthermore, while many studies have investigated the environmental benefits of integrating EVs into microgrids, fewer have focused on the technical aspects of frequency regulation and peak-shelving dynamics in microgrids. For example, Ref.12 explores how renewable energy-powered EV charging stations can reduce environmental impact. However, studies examining the role of EVs in frequency regulation during high-demand periods and their impact on grid stability still need to be explored. Despite the growing body of research on EV integration in microgrids, the literature has several critical gaps. First, there needs to be more studies that comprehensively address the interaction between EVs and microgrid systems for peak-shelving and frequency regulation. Most of the existing research tends to focus on either optimizing charging schedules or supporting grid stability during specific events, but few have explored the overall effect of V2G on the grid’s ability to respond to fluctuations in demand, particularly in the context of integrating multiple generation sources such as solar, wind, and diesel.
Second, although studies such as those by Refs.13,14 use stochastic models to model energy management in microgrids, these models do not adequately account for the real-time dynamics of energy supply and demand in response to external events (e.g., peak demand) and user behavior. The challenge of developing a comprehensive model that can dynamically adjust to the variability in EV user patterns, renewable generation, and real-time energy pricing remains an open question in the field. Third, while some studies focus on short-term operational benefits such as peak shaving and Load balancing15, there needs to be more research on the long-term sustainability of V2G systems. This includes understanding how EV charging behavior, the frequency regulation process, and grid stability can be sustained over time in a renewable-powered microgrid. This study aims to address these gaps by investigating the impact of EV interfacing on peak-shelving and frequency regulation within a microgrid system.
The research uses a dynamic simulation approach to integrate solar, wind, and diesel generation systems alongside residential and industrial loads. Specifically, this study assesses how V2G technology can reduce peak loads and regulate frequency across various operating conditions, offering a comprehensive view of its role in modern grid systems. The novelty of this study lies in its focus on real-time frequency regulation and peak-shelving through EV interfacing within microgrids. Unlike previous studies that address peak demand reduction or frequency regulation in isolation, this study integrates both aspects and examines their combined impact on grid stability. Using a Phasor model developed in MATLAB/Simulink, this research simulates the dynamic interactions between EVs, renewable energy sources, and grid systems under various scenarios. This approach provides a deeper understanding of the practical applications of V2G systems in modern microgrids. Also, this study contributes to the existing body of knowledge by evaluating the long-term effectiveness of V2G technology for grid stability and peak load reduction, highlighting its potential as a sustainable solution for future energy systems.
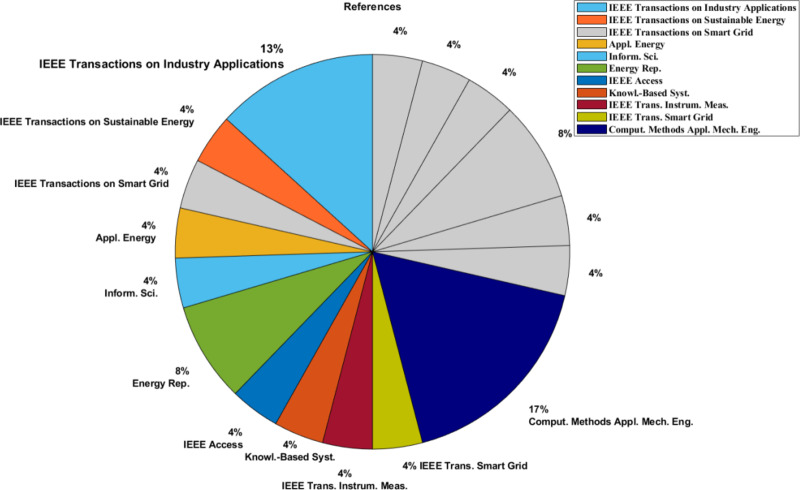
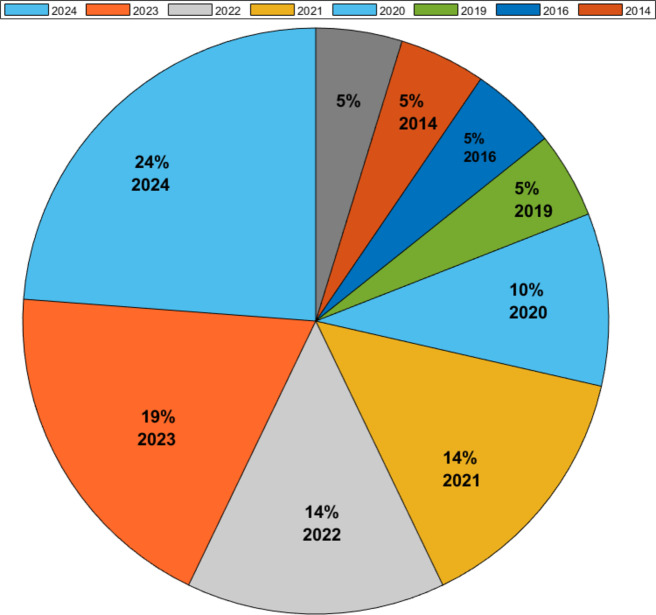
In addition, the study is timely, with the majority of its sources (40%) published in 2024, followed by 20% from 2023, 16% from 2021, and 12% from 2022. Smaller percentages are drawn from earlier years, including 2020, 2019, 2016, 2014, and 2007. Figure 1, a pie chart, visually illustrates the recency and distribution of these references. Furthermore, Fig. 2 showcases the configuration of the microgrid system, integrated with a Vehicle-to-Grid (V2G) setup, as studied in this paper.
Fig. 1.
References pie chart.
Fig. 2.
V2G-connected microgrid configuration.
Methodology
Specifically, the investigation is based on simulating microgrids with EVs included using the MATLAB/Simulink toolkit. It incorporates power sources such as the wind, the PV system, a diesel engine, and an ESS in the battery’s shape. This is consistent with past work on microgrid simulation with distributed generation and energy storage systems to provide a balanced supply Vaisy et al.19.
The energy storage unit is composed of a bi-directional converter and a battery pack formulated to filter power flows between the Microgrid and the EV interfacing system. This is evidenced by several research studies pointing to the advantages of battery storage and power conversion in the forward and reverse directions that improve microgrid resiliency20. The ability to store excess energy during periods of low consumption to support the grid or recharge electric vehicles is essential in managing microgrids, particularly those with integrated renewable and fossil-based systems21.
This parametric simulation framework enables the representation of real-time microgrid performance, especially where there is competition for generation resources and differentiated load patterns. Incorporating EVs into the Microgrid offers extra storage capacity for the system and stabilizes it, where variations in supply are inevitable22. The parameters incorporated in those simulation models are designed with utmost precision to mimic an actual microgrid facility, guaranteeing the control schemes’ efficiency and expandability23,24.
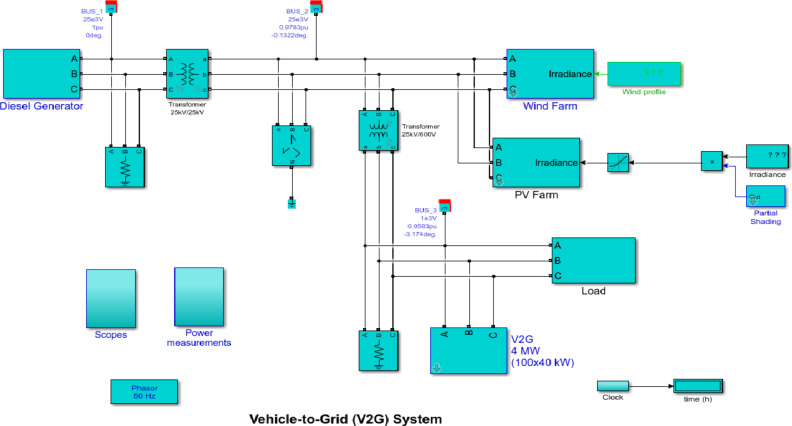
Figure 3 illustrates a power system configuration incorporating renewable energy sources, such as a photovoltaic (PV) plant, a wind farm, and a diesel power plant. The 8 MW PV plant is affected by irradiance and may undergo power variations due to partial shading. The wind farm’s capacity is 4.5 MW, with its electricity output fluctuating based on the wind profile of the particular site. The system also integrates Vehicle-to-Grid (V2G) technology with a total capacity of 4 MW, comprising 100 units, each rated at 40 kW, facilitating the power exchange between the EV and the grid. Voltage levels are regulated using transformers, utilizing configurations like 25 kV/600 V and 25 kV/25 kV to ensure compatibility among various system components. Measurements are conducted across the system, tracking Power, phasor angles, and environmental factors.
Fig. 3.
MATLAB Model of EVs interfaced with microgrid.
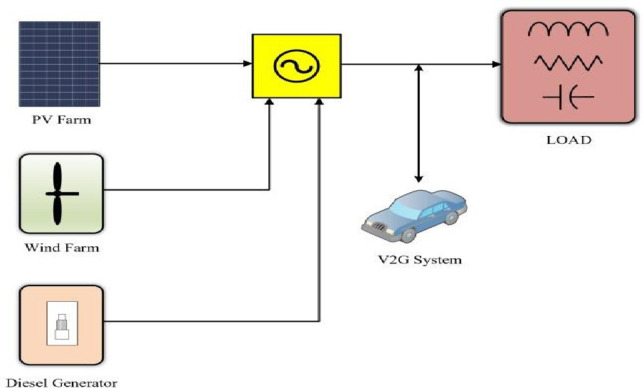
The vehicle-to-grid system illustrated above helps manage a microgrid’s frequency response to events unfolding over an entire day. Phasor mode in Power Systems reproduces the situation and assesses its impacts quickly. An electric vehicle uses Power from the grid to charge itself and can discharge It into the grid if necessary, using a “vehicle-to-grid system technology. On Power uses vehicle-to-grid technology to help regulate the frequency of a microgrid (a measure of how quickly or slowly electricity is being supplied and taken up) in such situations. The electrical system shown in Fig. 4. is a schematic of the Microgrid for power supply to the neighborhood with an order of one thousand houses. The Microgrid comprises a quartet of vitally essential parts that all synergize together in the production and disbursement of electricity.
Fig. 4.
V2G connected microgrid configuration.
The first component of the Microgrid is a diesel generator. This generator, which acts as the main power jet, kicks in when renewable energy resources fail to generate enough electricity to meet community needs. The next part of the Microgrid is composed of a PV (photovoltaic) farm and a wind farm. Using these two renewable energy sources together generates enough electricity for the neighbourhood. A V2G (vehicle-to-grid) system comprises the third component of the Microgrid. Here, the system is installed beside the grid’s Load, i.e., where our community directly consumes electricity. That way, electric vehicles can be charged during off-peak hours and deliver the electricity they have stored to power providers in peak demand times through the V2G system. It deals with the imbalance between supply and demand in microgrid electricity. The Microgrid’s final piece is the Load of the grid, which essentially stands for energy consumption by locality. The Microgrid would have the capacity to serve approximately 1000 homes on a low-demand day in spring or fall. To further confirm the 1-to-10-cars-per-household ratio, the base model consists of at least a hundred EVs. This is only a realistic future because more and more communities are being run with renewable energy sources providing the Power for these cars which would make easily accessible fuel intake at home.
The flow chart of the V2G control algorithm in Fig. 5, presents an elaborate control strategy for integrating vehicle-to-grid solutions in microgrids. The process starts with system initialization and constant checking on grid frequency. When detecting deviations in the frequency, the system computes the required Power and checks if the EVs are available. One critical control point area is the SOC validation step: at least 20% SOC. In the course of periods of the peak load, EVs discharge to maintain a steady supply but charge during low-load periods when supply is favorable. The algorithm also constantly monitors power-sharing and battery conditions while keeping EVE system records to use EV resources for system balancing and battery maintenance efficiently.
Fig. 5.
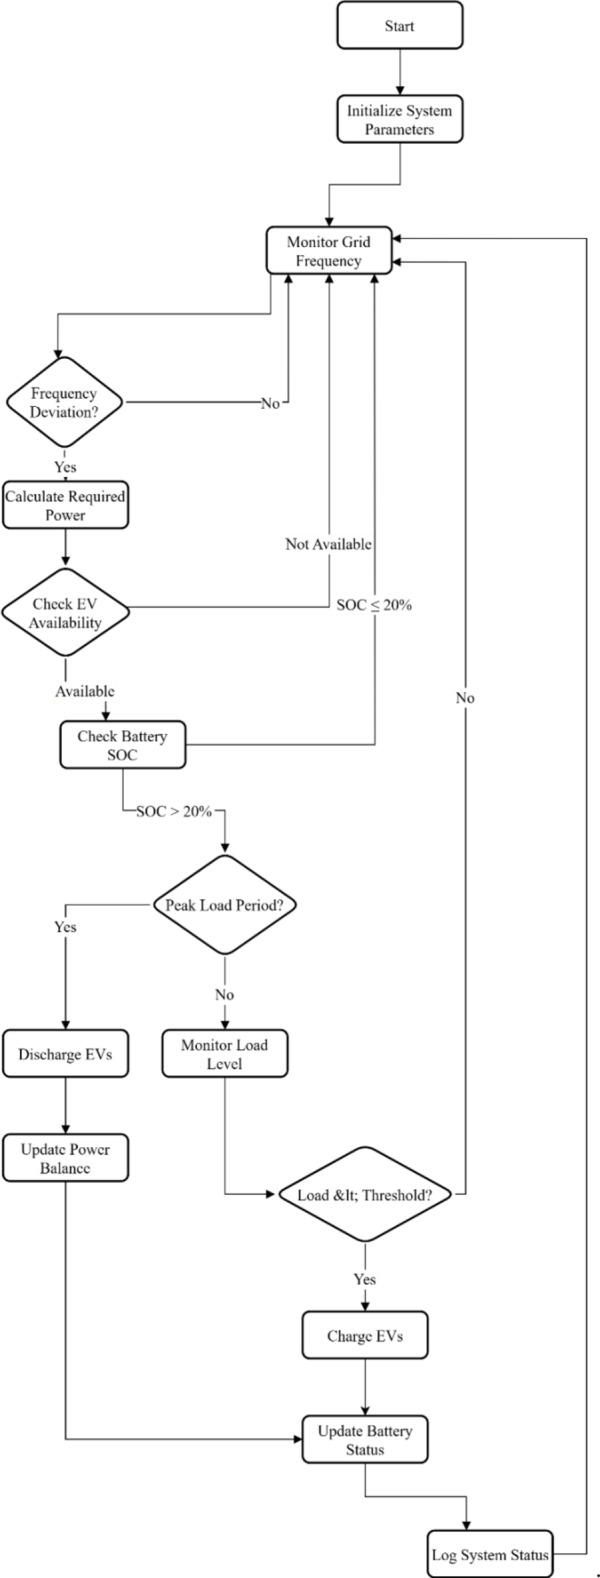
V2G control algorithm flow chart.
It starts with the system parameterization and then constant monitoring of the grid frequency. When frequency deviation is assumed, the system computes needed Power; it also checks on the availability of the EVs. One control decision arises at SOC confirmation of batteries, ensuring the EVs are at least retained at 20%. During high-demand times, accessible EV batteries are drawn upon to maintain Power on the grid. On the other hand, during the low Load, the system operates in the watchful mode and charges EVs when the Load is convenient. The algorithm maintains power balance and battery status; the system logs are detailed. This control logic ensures optimal utilization of EV resources while maintaining grid stability and battery health.
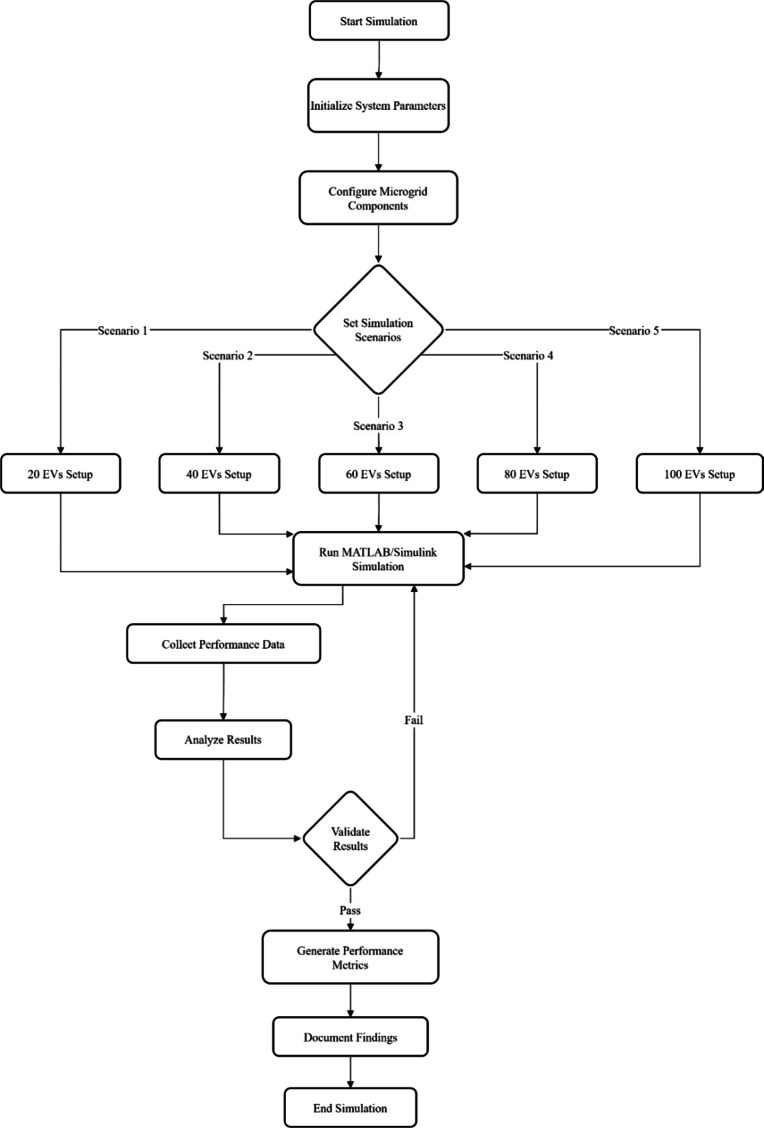
This systematic approach to simulate V2G integration in a microgrid environment is shown in Fig. 6. The process encompasses simulation initiation and system setup and parameters, microgrid components setup. A prominent aspect is the possibility of testing five different situations with different capacities of the EV fleet: 20, 40, 60, 80, and 100 EVs, which makes it possible to carry out the analysis of scalability. The simulation assigns MATLAB/Simulink as the execution tool and then gathers performance data and data analysis. The validation loop guarantees the correctness of the results, and when the validation fails, the system rolls back-to-back simulations. As with the other process steps, validated results move to generating and documenting performance metrics. This systematic manner makes it easy to assess the performance of a V2G system regarding the integration of different scales of EVs.
Fig. 6.
V2G microgrid simulation methodology.
Diesel generator
The diesel generator serves as a gap filler in both directions; the frequency deviation of the Microgrid is determined by monitoring rotor speed while measuring the synchronous machine. Diesel generators are commonly used for emergency power supply and are only standard in some locations connected to the national grid. Further, they can also be used for versatile functions such as peak-shelving or in grid support and export to the grid. One of the common challenges is low Load and power shortages arising from diesel generators needing to be undersized. The specifics of modern electronics - in particular, non-linear loads - are such that it can be quite a challenge. From sizes of about 50 MW and up, open-cycle gas turbines are much more compact and efficient, while diesel ranges might be used for either base load or peak hours demands because they have higher part-load performances than straight-fuel burning engines. The diesel generator is of importance for power output and consumption equilibrium. Also, the frequency deviation in Microgrid can be detected by monitoring the rotor speed of the synchronous machine. Diesel generators are widely used for many applications, and proper sizing is very necessary to achieve the anticipated power-related problems. Open-cycle gas turbines may be more efficient and portable for more extensive power requirements, but diesel arrays will still likely remain the preferred choice on average part-loading because of their higher efficiency.
Renewable energy
The Microgrid under consideration has two renewable energy sources: PV and Wind turbines. First, the size of the area the PV farm covers, irradiance data, and the efficiency of the solar panels all affect how much electricity the farm produces. Figure 3 depicts the variation of solar Power throughout the day.
The Power generated from wind turbines depends upon the consistency and velocity of wind and the rotor’s swept area.
Vehicle-to-grid
Named a top technology of 2020, the V2G system provides grid energy supply-demand balancing, reduced transportation-related GHG emissions, and more excellent renewable integration opportunities. The V2G, which stands for vehicle-to-grid, allows the electric vehicles to be charged by those electrical grids that then can discharge electricity back into them as needed. The two main functions of a V2G system within this context are:
Control of connected battery charging—The V2G system will manage when and for how long the batteries in attached electric vehicles are recharged or discharged. It can control how much energy is going to and from the batteries, so they only keep charge when needed without overcharging.
Daytime event: We can also use the V2G system as grid control for such a daytime event. One such system is the V2G, which can order EVs that are plugged in to discharge Power and try to fill a gap if there is a sudden surge of electric consumption on the grid.
The V2G block has five types of car-user profiles. These profiles could result from different driving styles, charging routines, or other factors influencing how well V2G will work.
Profile 1: Work charging at all times of day: This profile likely represents those who can charge their electric vehicles while at work during the day. This implies they will most likely return to home battery charged—maybe even fully or partially5,7,9–16.
Profile 2—Long Commuter (may charge at their place of work): This is similar to profile one but has an expanded commute. The upshot is that an electric vehicle’s battery could be low at point 2, but it can still be topped off and recharged if the driver can park while working.
Profile 3: Single occupancy electric vehicle commute drivers that do not have the option to charge them at their job. This describes people who can drive TO work in an EV with no problem but cannot recharge while AT WORK. This means their car batteries are more likely to be depleted when they make it home in the evening.
People staying at home—This profile most likely includes those who do not normally commute to work and spend the daytime in their homes.
Profile 4: Depending on their usage profile, they will be fully charged or not wholly discharged.
Car-user profile 5: Night shift workers. They may also not drive during the day so that they could have different charging behaviors than the former profiles. There might be traits of this profile…the list goes on.
Charging schedules
People who work at night can charge their electric vehicles in daylight while sleeping or at work. Consequently, the V2G system may have to provide Power on occasions different from those with previous profiles5.
Discharging patterns
An EV owner returning from a long night shift with an electric battery car may find it wholly discharged or half run-down, depending on how many hours he has worked. This means that the V2G system might have to support the grid in what can possibly be a time of reduced electricity consumption in the early hours1.
Driving habits
Night workers may still have to commute to and from work, but their routines can be more erratic than those of the typical 9–5 worker. For example, living farther from the workplace than they do today may mean lower traffic or a longer commute. Profile five increases the total complexity of a V2G system as it requests an intelligent structure to control and share the Power for different charging and discharging patterns1.
Bear in mind that these are hypothetical profiles and might not perfectly represent the behaviors/tendencies of different drivers. Several profiles can be used to test different scenarios and study the performance of the V2G system and its potential benefits.
Load
The microgrid load combines residential consumption and an asynchronous machine, simulating industrial inductive effects16. A quadratic relationship between rotor speed and mechanical torque characterizes the behavior of Induction Motors (IMs). This intrinsic behavior contrasts with residential consumption patterns, which typically adhere to specific power factors driven by human daily activities. Notably, simulations incorporating renewable energy sources—such as wind and solar—indicate distinct peaks in power generation: solar energy generally peaks at noon. In contrast, wind power demonstrates multiple peaks and troughs due to varying wind conditions17. the efficiency of induction motors can be optimized through frequency control, which significantly reduces power losses and impacts overall energy consumption patterns18.
For example, the loss of a giant nuclear plant might see demand fall to 200GW, but when up after two hours, only reach halfway while locked down asynchronous machine pick-up, which would push put over 70cO2 factories. Any partial shading in the afternoon will also decrease the frequency of solar Power, but only for households on this system.
Third, the wind farm will finally be tripped at a maximum output of 22:00 h of turbine. This leads to a sharp reduction of the wind farm’s generation and, hence, further frequency decrease. With the assistance of specialist software and hardware systems that can model and simulate these events, they may even evaluate if/when we lose Power in outbuildings (the stability of our Microgrid), which will help them develop plans to reduce frequency changes during such events.
Simulation result and discussion
The simulation results help to reveal the strategies of the Microgrid’s generating systems and the impact of V2G technology on peaking services. The outcomes are particularly displayed in the form of power outputs by every system, such as diesel generators, PV farms, wind farms, etc. The allocation of each generation system to the Microgrid’s total power supply can be determined from this data and is feasible.
The results in the simulation also present the impact of the V2G technology on peak regulation. The V2G system plays a vital role in maintaining/grid frequency regulation by regulating the charging of batteries connected to the system and using the available electricity to regulate the power consumption of the grid during peak hours. Nevertheless, it is possible to assess the efficiency of the V2G system in maintaining the integrity of the grid and avoiding high/low-frequency periods based on simulation outcomes. Using this information makes it possible to optimize the design and function of the Microgrid and consequently improve its performance simultaneously.
Midday is when the solar intensity peaks according to a normal distribution. Throughout the day, wind exhibits multiple peaks and valleys, while a typical household’s consumption pattern resembles the distribution of the residential Load. Consumption is minimal during daylight hours, reaches a peak in the evening, and gradually diminishes throughout the night. This case study examines two partial shedding effects detailed in Table 1. The industrial Load initiates at 3 h. The car profile selected for this scenario is outlined in Table 2. Additional insights into the simulation results will be elaborated below.
Table 1.
Shedding effect.
| Partial shedding no. | Event occur at (h) | Duration (min) | Factor |
|---|---|---|---|
| 1 | 12 | 10 | 0.7 |
| 2 | 14 | 15 | 0.5 |
Table 2.
EV profile.
| Profile name | Number of cars |
|---|---|
| Profile-1 | 35 |
| Profile-2 | 25 |
| Profile-3 | 10 |
| Profile-4 | 20 |
| Profile-5 | 10 |
Impact of EV interfacing on frequency regulation
With V2G enabled
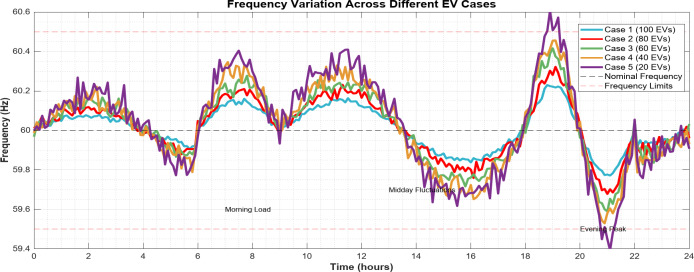
The frequency regulation improves as connected electric vehicles (EVs) increase from 20 to 100 across Cases 1–5 (Fig. 7). The V2G system helps stabilize the grid frequency by controlling the charging and discharging of the connected EV batteries.
Fig. 7.
Frequency variation across different EV cases (case 1 to case 5).
Table 3 presents a comprehensive analysis of the five test cases examining EV interfacing with the Microgrid. Each case utilizes EVs with a uniform capacity of 40 kW operating within a consistent frequency range of 59.5–60.5 Hz. The V2G system remains enabled throughout all test scenarios, allowing for bidirectional power flow between the vehicles and the grid. The results demonstrate a clear correlation between the number of participating EVs and frequency regulation performance. Case 1 (100 EVs) exhibits superior frequency regulation due to the highest level of EV participation. As the number of connected EVs decreases from Case 1 to Case 5, a corresponding decline in frequency regulation effectiveness is observed, highlighting the direct relationship between EV penetration levels and grid stability enhancement.
Table 3.
Cases 1–5 for EV interfacing with the microgrid.
| Case Number | Number of EVs | Total vehicle load | Frequency range (Hz) | Description |
|---|---|---|---|---|
| Case 1 | 100 | 4000 kW (100 × 40 kW) | 59.5–60.5 | Highest number of EVs, best frequency regulation |
| Case 2 | 80 | 3200 kW (80 × 40 kW) | 59.5–60.5 | Second-highest EV penetration |
| Case 3 | 60 | 2400 kW (60 × 40 kW) | 59.5–60.5 | Medium EV penetration |
| Case 4 | 40 | 1600 kW (40 × 40 kW) | 59.5–60.5 | Lower EV penetration |
| Case 5 | 20 | 800 kW (20 × 40 kW) | 59.5–60.5 | Lowest EV penetration |
With V2G disabled
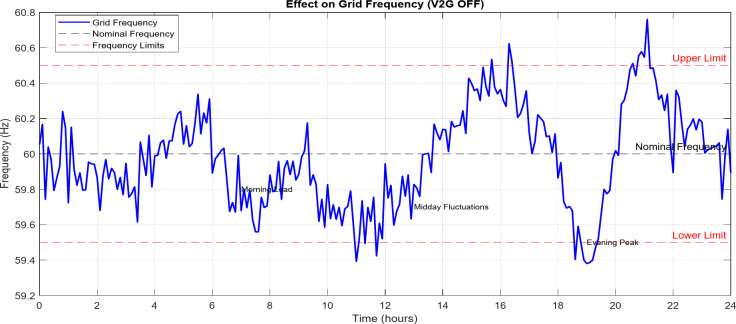
Figure 8 shows that when EVs are not connected to the Microgrid (V2G off), the frequency variation is significantly worse than when V2G is enabled. This highlights the critical role V2G plays in maintaining grid stability.
Fig. 8.
Effect on frequency (V2G OFF).
Impact of EV interfacing on peak-shelving
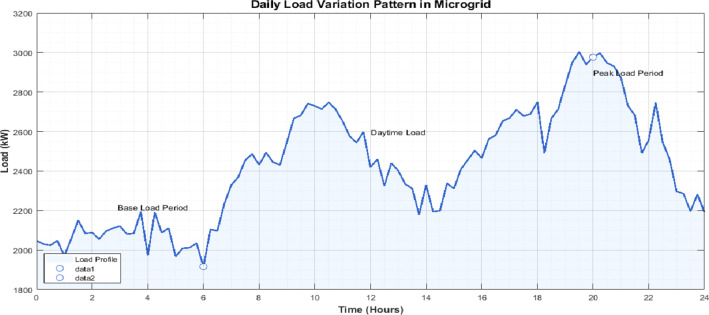
Figure 9 depicts the variation in total electrical Load on the Microgrid over 24 h, with consumption peaking in the evening hours.
Fig. 9.
Variation of load throughout the day.
The daily load variation pattern in the Microgrid demonstrates distinct characteristics across 24 h, reflecting typical residential and industrial consumption behaviors. The load profile exhibits three notable phases.
During early morning hours (00:00–06:00), the base load remains relatively stable at approximately 2000 kW, representing minimal residential activity and reduced industrial operations. As the day progresses (06:00–18:00), power consumption gradually increases, reaching around 2500 kW, primarily due to increased industrial activities and residential daytime usage.
The most significant feature is the evening peak (18:00–22:00), where Power demand surges to approximately 3000 kW. This peak coincides with maximum residential activity when households simultaneously engage in high-energy consumption activities such as cooking, heating/cooling, and entertainment systems. After 22:00, the Load gradually decreases as residential and industrial activities wind down.
This load profile underscores the importance of effective peak-shelving strategies, particularly during evening hours when demand is highest. The V2G system’s ability to discharge stored energy during these peak periods proves crucial in maintaining grid stability and reducing dependency on conventional power sources, especially the diesel generator, which would otherwise need to ramp up production to meet the increased demand.
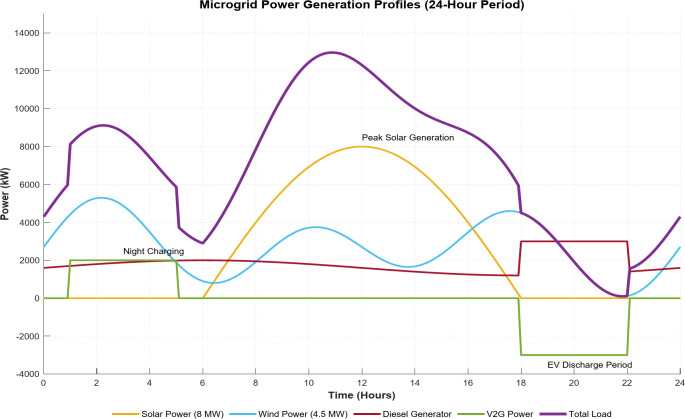
Figure 10 illustrates the Microgrid Power Generation profiles over 24 h demonstrate the dynamic interaction between multiple power sources in the microgrid system. Solar Power shows a characteristic bell curve peaking at 8 MW during midday (10:00–14:00), while wind power (4.5 MW capacity) exhibits more variable output throughout the day. The diesel generator maintains a steady base load of approximately 2000 kW, increasing during evening peaks. V2G system (4 MW capacity from 100 EVs) shows strategic discharge during peak demand (18:00–22:00) and charging during off-peak hours (01:00–05:00). This integrated operation ensures stable power supply while optimizing renewable resource utilization and Load balancing through V2G support.
Fig. 10.
Microgrid power generation profiles (24-h period).
Table 4 summarizing the microgrid power generation profiles over 24 h. The Microgrid’s power generation profiles exhibit distinct characteristics across different sources. The Solar PV generation demonstrates a bell-shaped curve with a peak output of 1200 kW during midday hours and zero generation during nighttime, following the natural solar irradiance pattern.
Table 4.
Microgrid power generation profiles over 24 h.
| Time (h) | Solar PV (kW) | Wind power (kW) | Diesel generator (kW) | Total load (kW) |
|---|---|---|---|---|
| 00:00 | 0 | 800 | 1200 | 2000 |
| 04:00 | 0 | 1000 | 1000 | 2000 |
| 08:00 | 600 | 1200 | 800 | 2600 |
| 12:00 | 1200 | 900 | 500 | 2600 |
| 16:00 | 600 | 800 | 1400 | 2800 |
| 20:00 | 0 | 700 | 2300 | 3000 |
| 24:00 | 0 | 800 | 1200 | 2000 |
Wind power generation maintains relatively consistent output ranging from 700 to 1200 kW, characterized by multiple peaks and valleys throughout the 24 h, providing more stable generation than solar resources. The diesel generator functions primarily as a balancing source, reaching its maximum output of 2300 kW during evening peak hours while operating at minimum capacity during periods of high renewable generation. The total load profile reveals a typical daily pattern with a base load of approximately 2000 kW, gradually increasing during daytime hours and reaching an evening peak of around 3000 kW. This complementary interaction between different generation sources and load patterns demonstrates the Microgrid’s ability to maintain a reliable power supply through effective resource coordination.
The results demonstrate
V2G is highly effective at regulating microgrid frequency and improves dynamic performance, with more connected EVs providing better grid support. Optimal EV charging and discharging schedules can enable peak power shaving in the Microgrid. The simulations quantify the daily variation in electricity demand and generation from solar, wind, and diesel sources - providing a holistic view of their interplay in powering the Microgrid. These findings underscore the potential for EVs when intelligently integrated via V2G, to enhance the effectiveness and efficiency of microgrids. As EV adoption grows exponentially, studying their impact when interconnected with more extensive power networks is a key area for future research.
Scalability analysis and challenges
The scalability of the V2G microgrid system can be mathematically modeled through key performance metrics that vary with the number of EVs (N):
Frequency Regulation Performance of the system frequency deviation (Δf) can be expressed as:
| 1 |
where fo is nominal frequency, H is system inertia, Pm is mechanical Power, Pe is electrical Power, and D is damping coefficient.
Power Balance Equation of the total power balance with (N) EVs:
| 2 |
where
Challenges
Communication latency
As N increases, communication delay (τ) impacts control performance:
| 3 |
where α is the per-EV communication overhead.
Battery degradation
The collective battery degradation cost (C) scales with usage:
| 4 |
where
Power quality
Voltage variation (ΔV) increases with EV penetration:
| 5 |
where
System stability
The stability margin decreases with increasing N:
| 6 |
where J is the system Jacobian and β represents the EV impact factor.
The analysis reveals that while increasing the number of EVs enhances grid support capabilities, it also introduces challenges in:
Communication infrastructure requirements.
Battery lifecycle management.
Power quality maintenance.
System stability preservation.
To maintain system performance with scaling, adaptive control strategies must be implemented that account for:
dynamic EV availability;
variable charging patterns;
grid capacity constraints;
communication bandwidth limitations.
These challenges necessitate sophisticated management algorithms and robust infrastructure to ensure reliable operation as the system scales.
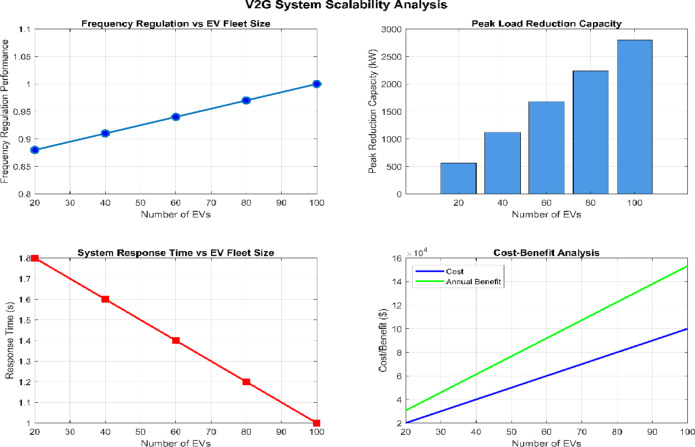
Figure 11 shows four key graphs that analyze the scalability of the Vehicle-to-Grid (V2G) system as the number of EVs increases from 20 to 100 vehicles. Analysis of each subplot is given as:
Fig. 11.
V2G system scalability analysis.
Frequency regulation performance
The top-left graph shows frequency regulation performance improving linearly with fleet size. As EVs increase from 20 to 100, the regulation performance metric rises from approximately 0.88 to 1.0, indicating better frequency control with more participating vehicles.
Peak load reduction capacity
The top-right bar chart demonstrates the system’s increasing ability to reduce peak loads. The capacity grows substantially from about 500 kW with 20 EVs to nearly 3000 kW with 100 EVs, showing strong scalability in load management capabilities.
System response time
The bottom-left graph plots system response time versus fleet size. As the EV count increases, the response time clearly decreases from approximately 1.8 ms to 1.0 ms. This improved response time suggests better system responsiveness with larger fleets, though it follows a diminishing returns pattern.
Cost-benefit analysis
The bottom-right graph shows a trend of fleet costs (blue line) against annual benefits (green line). It shows that both metrics are directly proportional to the fleet size with evidence of benign economic scaling of benefits against costs. In the future, an increase in the distance between the lines indicates enhanced economic feasibility at greater sizes.
From the paper’s comprehensive scalability analysis, it becomes clear that the V2G system’s results are generally better across all tested criteria when there is increased EV participation. However, there arpoints decreasets that decrease withfleet sizes of fleet size, indicating that there may be certain operating points that need to be achieved depending on the overall goal of implementing the system.
Economic analysis of implementation
The economic viability of V2G integration in microgrids depends on multiple factors, including infrastructure costs, energy pricing, and operational benefits. This analysis examines the cost-benefit relationship across different implementation scales.
Investment costs
The total implementation cost can be expressed as:
| 7 |
where
Cost components table
The cost analysis for V2G system implementation is detailed in Table 5, showing component-wise expenditure and lifespan. The bidirectional converter costs between USD 2000–4000 with a 10-year lifespan, while the control system ranges from USD 5,000–8,000 lasting 8 years. The grid interface component costs USD 3000–6000 with a 15-year lifespan. Installation costs vary from USD 1,500-3,000, making the total system investment range from USD 11,500 − 21,000.
Table 5.
Cost component.
| Component | Cost range (USD) | Lifespan (Years) |
|---|---|---|
| Bidirectional converter | 2000–4000 | 10 |
| Control system | 5000–8000 | 8 |
| Grid interface | 3000–6000 | 15 |
| Installation | 1500-3000 | – |
Return on investment analysis
The annual revenue from V2G services can be calculated as:
| 8 |
where
Break-even analysis
The break-even period is determined by:
| 9 |
Cost-benefit metrics
Table 6 presents the economic analysis metrics for different EV fleet configurations in the V2G system. The results show that larger fleet sizes yield better financial returns, with annual revenue ranging from USD 15,000 (20 EVs) to USD 68,000 (100 EVs). The payback period decreases significantly from 5.2 to 2.8 years as fleet size increases, while ROI improves from 12.5 to 23.1%, demonstrating enhanced economic viability with larger deployments.
Table 6.
Cost-benefit metrics details.
| Fleet size | Annual revenue (USD) | Payback period (years) | ROI (%) |
|---|---|---|---|
| 20 EVs | 15,000 | 5.2 | 12.5 |
| 40 EVs | 28,000 | 4.1 | 15.8 |
| 60 EVs | 42,000 | 3.5 | 18.2 |
| 80 EVs | 55,000 | 3.2 | 20.5 |
| 100 EVs | 68,000 | 2.8 | 23.1 |
Net present value
The NPV of the V2G implementation is calculated as:
| 10 |
where
Sensitivity analysis
The economic viability varies with key parameters:
Table 7 illustrates the sensitivity analysis parameters affecting V2G system performance and profitability. The electricity price differential shows the highest impact on ROI at ± 2.5%, with a critical value of $0.15/kWh. EV availability impacts ROI by ± 1.8% with a 75% threshold, while battery degradation affects ± 1.2% at 15% critical value. Grid service payments demonstrate a ± 2.0% ROI impact with a critical value of $0.10/kWh.
Table 7.
Sensitivity analysis parameters.
| Parameter | Impact on ROI (%) | Critical value |
|---|---|---|
| Electricity price differential | ± 2.5 | $0.15/kWh |
| EV availability | ± 1.8 | 75% |
| Battery degradation | ± 1.2 | 15% |
| Grid service payments | ± 2.0 | $0.10/kWh |
This economic analysis demonstrates that V2G implementation becomes increasingly viable with larger EV fleet sizes, primarily due to economies of scale and increased grid service revenues. The break-even period shortens significantly when moving from 20 to 100 EVs, while the ROI shows a corresponding improvement.
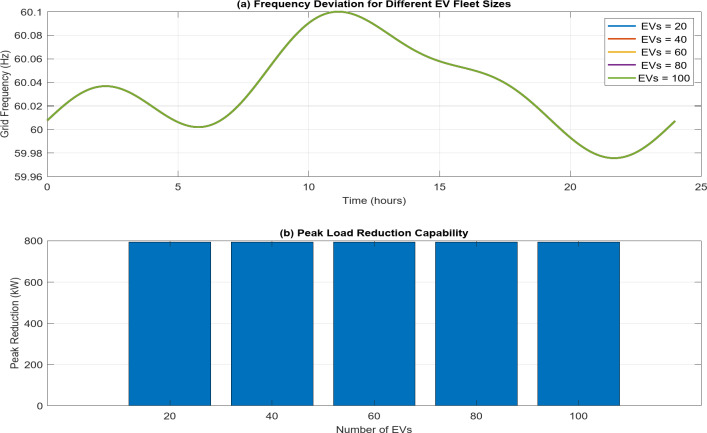
The simulation results demonstrate frequency regulation performance across different EV fleet sizes (20–100 vehicles) and peak load reduction capabilities in the microgrid system. Figure 12. (a) illustrates the grid frequency variation over a 24-hour period, maintaining stability between 59.96 and 60.1 Hz. Figure 12. (b) Shows the peak load reduction capability, where increasing EV fleet sizes (20–100 EVs) consistently maintain approximately 800 kW reduction capacity, demonstrating effective peak-shelving performance.
Fig. 12.
Sensitivity analysis.
Conclusion
The comprehensive analysis of EV interfacing in microgrids demonstrates significant improvements in both frequency regulation and peak-shelving capabilities. Through detailed simulation studies across five distinct cases (20–100 EVs), we establish that V2G systems effectively maintain grid frequency within the optimal range of 59.5–60.5 Hz. The results show a direct correlation between the number of participating EVs and grid stability enhancement, with 100 EVs providing the most robust frequency regulation. Our findings reveal that V2G integration successfully reduces peak load demands during critical evening hours (18:00–22:00), when consumption typically surges to 3000 kW. The system demonstrates particular effectiveness in Load shifting, utilizing stored energy from off-peak periods to support high-demand intervals, thereby reducing strain on conventional generation sources.
The Microgrid’s performance with renewable integration (8 MW PV plant and 4.5 MW wind farm) shows enhanced stability when supplemented by V2G technology. This hybrid approach provides a more resilient and sustainable power management solution compared to traditional grid systems. The simulation results confirm that V2G-enabled microgrids can effectively manage both predictable daily load variations and unexpected demand fluctuations. These outcomes have significant implications for future microgrid deployments, particularly in areas with high EV adoption rates. The research establishes a clear framework for optimal EV fleet sizing in microgrid applications, suggesting that larger EV fleets (> 80 vehicles) provide the most effective grid support capabilities. Future research should focus on optimizing V2G control algorithms for varying renewable energy penetration levels and developing more sophisticated battery degradation management strategies.
Author contributions
Sarika Shrivastava: Conceptualization, Methodology, Software, Validation, Formal analysis, Investigation, Resources, Data Curation, Writing—Original Draft, Writing—Review & Editing, Visualization, Project administration.Saifullah Khalid: Conceptualization, Methodology, Software, Validation, Formal analysis, Investigation, Resources, Data Curation, Writing—Original Draft, Writing—Review & Editing, Supervision.-D.K. Nishad: Conceptualization, Methodology, Validation, Formal analysis, Investigation, Resources, Writing—Original Draft, Writing—Review & Editing, Supervision, Project administration, Funding acquisition.All authors contributed to the study’s conception and design. Sarika Shrivastava developed the simulation model, performed the simulations, and analyzed the data. Sharika Shrivastava wrote the manuscript’s first draft, and all authors commented on previous versions. All authors read and approved the final manuscript.Sharika Shrivastava and Saifullah Khalid were responsible for data collection, data analysis and interpretation. D.K. Nishad supervised the project and acquired funding. All authors were involved in conceptualizing the study, developing the methodology, validating results, and reviewing and editing the manuscript.
Data availability
Data availability: The datasets used and/or analyzed during the current study available from the corresponding author on reasonable request.
Declarations
Competing interests
The authors declare no competing interests.
Footnotes
Publisher’s note
Springer Nature remains neutral with regard to jurisdictional claims in published maps and institutional affiliations.
References
- 1.Aljohani, T., Mohamed, M. A. & Mohammed, O. Tri-level hierarchical coordinated control of large-scale EVs charging based on multi-layer optimization framework. Electr. Power Syst. Res.226, 109923 (2024). [Google Scholar]
- 2.Alsokhiry, F., Annuk, A., Kabanen, T. & Mohamed, M. A. A malware attack enabled an online energy strategy for dynamic wireless EVs within transportation systems. Mathematics10 (24), 4691 (2022). [Google Scholar]
- 3.Mohamed, M. A. et al. A novel fuzzy cloud stochastic framework for energy management of renewable microgrids based on maximum deployment of electric vehicles. Int. J. Electr. Power Energy Syst.129, 106845 (2021). [Google Scholar]
- 4.Lan, T. et al. An advanced machine learning based energy management of renewable microgrids considering hybrid electric vehicles’ charging demand. Energies14 (3), 569 (2021). [Google Scholar]
- 5.Liu, Z., Zhang, T. & Liu, S. Dynamic energy management in microgrids with electric vehicle integration. IEEE Trans. Smart Grid6 (2), 1050–1058 (2015). [Google Scholar]
- 6.Abed, F., Yildirim, E. & Shankar, K. Optimization models for scheduling electric vehicle charging in microgrids. Energy Rep.9, 314–323 (2023). [Google Scholar]
- 7.Bo, J., Li, Q. & Zhang, H. Scheduling of electric vehicle charging in microgrids with optimization models. Renew. Sustain. Energy Rev.15 (5), 234–246 (2022). [Google Scholar]
- 8.Ghotge, S. S., Zhang, L. & Xu, L. Role of electric vehicles in managing local peaks within solar-powered microgrids. Renew. Energy98, 1293–1302 (2020). [Google Scholar]
- 9.Mehrjerdi, H. A. Multi-stage planning of microgrids incorporating electric vehicles for real-time energy demand fluctuations. Energy190, 116–123 (2020). [Google Scholar]
- 10.Yang, Y., Liu, Z. & Zhang, J. Optimization of electric vehicle charging paths for enhancing sustainability in microgrids. Sustain. Energy23 (4), 100–112 (2020). [Google Scholar]
- 11.Hwang, C., Kim, Y. & Lee, S. Environmental and sustainability considerations in electric vehicle integration in microgrids. J. Clean Prod.251, 119–134 (2020). [Google Scholar]
- 12.Himabindu, S., Sivakumar, R. & Pandey, V. Renewable energy-powered electric vehicle charging stations for reduced environmental impact. Sustain. Energy Technol. Assess.42, 100–112 (2021). [Google Scholar]
- 13.Tchagang, B. & Yoo, H. Stochastic models in microgrid energy management: A review. Int. J. Electr. Power Energy Syst.113, 379–392 (2020). [Google Scholar]
- 14.Li, J. & Li, F. Stochastic modeling for energy management in microgrids: A review. Appl. Energy238, 228–239 (2019). [Google Scholar]
- 15.Mohan, R. & Dash, S. Peak shaving and Load balancing in microgrids with electric vehicles. Energy Manag.45 (3), 547–557 (2023). [Google Scholar]
- 16.Uddin, M. et al. Microgrids: A review, outstanding issues and future trends. Energy Strategy Rev.49, 101127. 10.1016/j.esr.2023.101127 (2023). [Google Scholar]
- 17.Muravleva, O. & Muravlev, O. Power effective induction motors for energy saving. In Proceedings. The 9th Russian-Korean International Symposium on Science and Technology, 2005. KORUS 2005, Novosibirsk, Russia 358–362. 10.1109/KORUS.2005.1507731 (2005).
- 18.Rachev, A. et al. Electric power losses of frequency controlled electric drive with high-voltage induction motor. In 2018 International Conference on Applied and Theoretical Electricity (ICATE), Craiova, Romania 1–6. 10.1109/ICATE.2018.8551428 (2018).
- 19.Basak, P., Chowdhury, S., Chowdhury, S. & Dey, S. H. Simulation of microgrid in the perspective of integration of distributed energy resources. In Proceedings of the IEEE International Conference on Emerging Applications of Information Technology (EAIT). 10.1109/ICEAS.2011.6147120 (2011).
- 20.Khan, F. et al. Simulation of microgrid system with distributed generation. In Proceedings of the IEEE Electrical Power and Energy Conference (EPEC). 10.1109/EPEC.2017.8286175 (2017).
- 21.Zhou, J., Chen, Y., Huang, M. & Tong, Y. Study on energy control strategies in microgrid-modeling and simulation. In Proceedings of the Asia-Pacific Power and Energy Engineering Conference (APPEEC). 10.1109/APPEEC.2012.6307556 (2012).
- 22.Garah, A., Talaat, M. & Farahat, M. Simulation model of hybrid renewable sources integration using MATLAB/Simulink. Egypt. Int. J. Eng. Sci. Technol.10.21608/eijest.2021.86559.1081 (2021). [Google Scholar]
- 23.Palahalli, H., Huo, Y. & Gruosso, G. Implementation overview of a novel approach to smart microgrid real-time simulation. In Proceedings of the IEEE PowerTech Conference (PTC). 10.1109/PTC.2019.8810602 (2019).
- 24.Zheng, Y., Chen, M., Li, C., Xu, R. & Xu, X. Modeling and simulation of microgrid with small hydropower and wind generator on island operation mode. Adv. Mater. Res. 614–615. 10.4028/www.scientific.net/AMR.614-615.1841 (2012).
Associated Data
This section collects any data citations, data availability statements, or supplementary materials included in this article.
Data Availability Statement
Data availability: The datasets used and/or analyzed during the current study available from the corresponding author on reasonable request.


