Abstract
This study aimed to explore a deep learning radiomics (DLR) model based on grayscale ultrasound images to assist radiologists in distinguishing between benign breast lesions (BBL) and malignant breast lesions (MBL). A total of 382 patients with breast lesions were included, comprising 183 benign lesions and 199 malignant lesions that were collected and confirmed through clinical pathology or biopsy. The enrolled patients were randomly allocated into two groups: a training cohort and an independent test cohort, maintaining a ratio of 7:3.We created a model called CLDLR that utilizes clinical parameters and DLR to diagnose both BBL and MBL through grayscale ultrasound images. In order to assess the practicality of the CLDLR model, two rounds of evaluations were conducted by radiologists. The CLDLR model demonstrates the highest diagnostic performance in predicting benign and malignant BI-RADS 4 lesions, with areas under the receiver operating characteristic curve (AUC) of 0.988 (95% confidence interval : 0.949, 0.985) in the training cohort and 0.888 (95% confidence interval : 0.829, 0.947) in the testing cohort.The CLDLR model outperformed the diagnoses made by the three radiologists in the initial assessment of the testing cohorts. By utilizing AI scores from the CLDLR model and heatmaps from the DLR model, the diagnostic performance of all radiologists was further enhanced in the testing cohorts. Our study presents a noninvasive imaging biomarker for the prediction of benign and malignant BI-RADS 4 lesions. By comparing the results from two rounds of assessment, our AI-assisted diagnostic tool demonstrates practical value for radiologists with varying levels of experience.
Supplementary Information
The online version contains supplementary material available at 10.1038/s41598-024-83347-x.
Keywords: Deep learning, Radiomics, Breast cancer, BI-RADS 4, Ultrasound
Subject terms: Biological techniques, Biotechnology, Cancer, Computational biology and bioinformatics, Developmental biology, Medical research, Oncology
Introduction
Breast cancer is the most frequent cancer in women globally. It comprises a significant portion of new female cancer cases, contributing to 25% of them. Moreover, it ranks high as a leading cause of cancer mortality among women worldwide1,2.The early detection of breast cancer can lead to a 40% reduction in mortality rates3.
Though US imaging is the primary modality for early breast cancer screening in China, favored for its convenience, cost-effectiveness, non-invasive nature, minimal radiation risk, and widespread availability, the quality of US imaging is influenced by various factors, including noise levels, contrast, illumination, and image resolution4.According to the fifth edition of the BI-RADS, biopsies should be carried out for category 4 lesions unless clinically contraindicated5.This recommendation is part of the BI-RADS lexicon developed by the American College of Radiology to streamline the interpretation of breast cancer screening images and the subsequent recommendations for patient management. However, the standardization process is not without its drawbacks, including the subjective evaluation of imaging findings and the persistent issue of variation in interpretation among different physicians6.These issues can result in the avoidable biopsy of many BI-RADS category 4 lesions, contributing to both economic and psychological burdens for patients7.
Hence, A reliable approach to US imaging analysis is still being sought, particularly for the early detection of breast cancer in BI-RADS category 4 lesions to circumvent unnecessary needle punctures and surgical procedures. The accurate early identification of malignant lesions, represents significant clinical work. Artificial intelligence (AI) technology has made substantial contributions to numerous oncological challenges, notably in the areas of cancer diagnosis, treatment planning, and outcome prediction8.The field of radiomics involves the extraction of high-throughput quantitative features from medical images, employing primarily two analytical strategies in the realm of artificial intelligence, namely machine learning and deep learning9–12.
When utilized for the analysis of medical images, DLR often faces difficulties in small-sample learning due to limited data. The integration of clinical parameters and DLR enables a synergistic approach, effectively combining clinical information with network characteristics. This integration provides complementary insights into image features and promotes collaborative utilization of both clinical information and ultrasound image features during model construction. Ultimately, this leads to an improved performance of the model13.Our research aims to investigate whether the combination of clinical parameters and DLR can enhance the accuracy of diagnosing BI-RADS 4 lesions, distinguishing between benign and malignant cases.Second, many similar studies14–17 failed to explore the practical advantages of employing radiomics in authentic diagnostic situations for radiologists.In this research, we employed AI scores from CLDRL model and heatmaps from DLR model as valuable aids for radiologists in diagnosing BI-RADS lesions, and the actual clinical advantages were assessed through two rounds of evaluation by radiologists.The potential use of our models in actual clinical practice was finally confirmed.
Methods
Patients
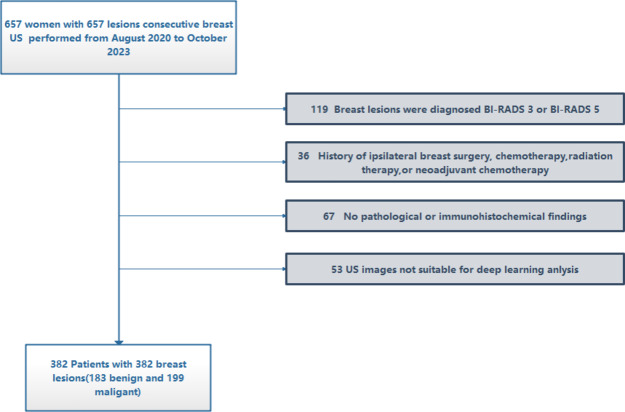
The present retrospective study was conducted using data obtained from the same hospital in China. It was performed in strict accordance with the principles outlined in the Declaration of Helsinki and received approval from the hospital’s ethics committee. Due to the retrospective nature of this study, the requirement for informed consent was waived.Between August 2020 and October 2023, a total of 657 patients with breast lesions underwent ultrasound examinations at our hospital, and ultimately, following the application of screening and selection criteria, a total of 382 patients were considered for analysis. The inclusion criteria were as follows: (a) women with US-suspected breast lesions and diagnosed as BI-RADS 4; (b) availability of clinical data; (c) breast lesions with confirmed pathological diagnosis and absence of preoperative treatment .The exclusion criteria were as follows: (a) Breast lesions were diagnosed as BI-RADS 3 or BI-RADS 5. (b) History of ipsilateral breast surgery, chemotherapy, radiation therapy, or neoadjuvant chemotherapy. (c) No pathological or immunohistochemical findings.(d)US images not suitable for deep learning anlysis.The recruitment flowchart was showed in Fig. 1.
Fig. 1.
Workflow for recruiting patients.
Grayscale US images acquisition and processing
The images were captured using three different US devices (LIGIQ E9, USA; HITACHI, Japan; Mindray, China) equipped with an linear array probe.
Prior to each examination, the appropriate contrast mode parameters, including gain, depth, acoustic window settings, mechanical index adjustments, and focal zone configurations were meticulously calibrated. The patient was positioned supine and each breast was sequentially scanned in different positions to record the maximum diameter of any detected masses. The 2D grayscale images of the breast masses were subsequently acquired. The radiologist initially identified the lesion area based on the 2D grayscale images, and then delineated the region of interest (ROI) using the open-source software ITK-Snap 3.8.0.
Deep learning radiomics model and multi-sources features fusion model
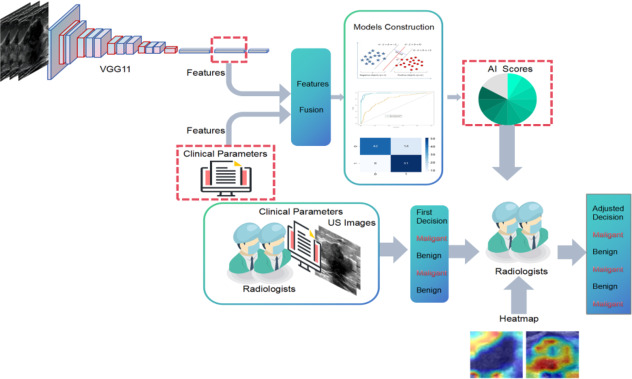
The patients who were enrolled in the study were randomly assigned to two groups: a training cohort and an independent test cohort, with a ratio of 7:3. The model parameters were optimized using the training cohort. Figure 2 illustrates the entire pipeline of our model. We utilized VGG11 as the base model, which had been pre-trained on Imagenet18.The raw US images were used to extract rectangular ROIs based on the tumor segmentation mask. These ROIs were then resized to 224 × 224 pixels and subjected to normalization.We employed the Adam optimizer to update the model parameters, utilizing a learning rate of 0.005. The model underwent training for 200 epochs with a batch size of 16.The one-dimensional vector obtained from the fully connected (FC) layer is ultimately passed through the softmax activation function to transform the prediction result into a probability distribution.
Fig. 2.
The comprehensive research framework of the study.
Following the training process, we extracted deep learning features from the penultimate FC layer and replaced it with a support vector machine (SVM) as a classifier and combined clinical features and network features to jointly make decisions. In order to evaluate the predictive performance of breast lesion status, SVMs were directly trained using clinical features, DLR features and fusion features that combined DLR and clinical features .The detailed process of constructing Clinical, DLR and CLDLR models is provided in supplementary material: Method S1.
Two- round radiologist assessment
Two -round radiologists assessment was carried out to examine the practical advantages that radiologists were able to achieve with the support of the CLDLR and DLR model (Fig. 2).In this research, a two-round assessment was conducted by three radiologists who had 5, 7, and 15 years of experience in diagnostic procedures respectively. A total of 115 lesions from the testing cohorts were presented in a random sequence for validation purposes. Throughout the assessment process, the radiologists remained unaware of each other’s evaluations, as well as the initial diagnostic reports and final pathology results.
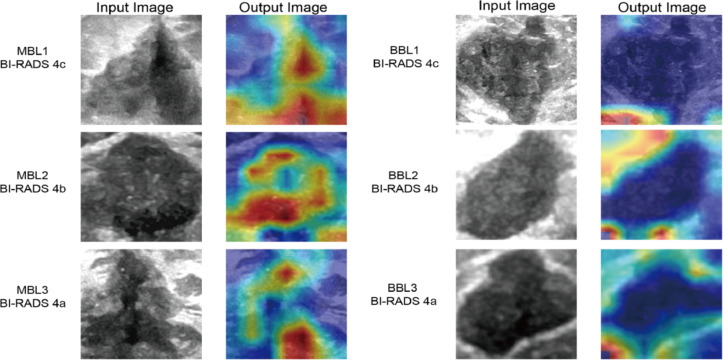
In the first round of diagnosis, radiologists made preliminary judgments based solely on patient demographic information related to BL, raw images, and resized grayscale ROI images.The results of this round were directly compared with the CLDLR model to demonstrate its advantages. In the second round, radiologists were instructed to enhance their initial diagnoses by integrating additional AI scores from the CLDLR model and incorporating heatmap details derived from the DLR model. Heatmaps were generated using Grad-CAM (Gradient-weighted Class Activation Mapping) technique applied on the DLR model19, a visualization technique that effectively highlights important areas contributing to BL evaluation.As depicted in Fig. 3, the final convolutional layer of the last max pooling was visualized as transparent to facilitate the prediction of BL status.
Fig. 3.
Visualization of Heatmaps generated by our DLR model: demonstrating variations between malignant and benign breast lesions calssified as BI-RADS 4. The highlighted area of the MBLs is observed to be larger than that of the BBLs in the heatmaps, with a predominant distribution within the tumor region. The highlighted areas of the MBLs tend to concentrate towards the center of the heatmaps, while those of the BBLs are primarily located along the boundary. The boundary of MBLs is less clear than that of BBLs. MBL malignant breast lesion, BBL benign breast lesion, ROI region of interest, DLR deep learning radiomics.
This design allowed researchers to assess and explore how the CLDLR and DLR models help radiologists improve diagnostic accuracy.
Statistical analysis
Statistical analyses were conducted using RStudio 4.2.0 and Python 3.8.0 software. Continuous variables were described by their mean and standard deviation (SD), while categorical variables were presented as percentages and numbers. The detailed clinical parameters differences between MBL and BBL were compared using t-tests or Mann-Whitney U tests. The performance of models, including DLR based solely on images, Clinical model based on clinical data, and CLDLR combining clinical parameters with DLR, as well as different radiologists, was evaluated using AUC and compared utilizing the Delong et al. .Models performance estimation also incorporated measurements such as accuracy, sensitivity, specificity, positive predictive value (PPV), and negative predictive value (NPV). All statistical analyses were two-sided and a P-value below 0.05 indicated statistical significance.
Result
Clinical data
Table 1 presents a concise overview of the comprehensive patient demographics and characteristics of breast lesions.The pathological classifications of all lesions are summarized in Table S1.
Table 1.
A concise overview of the comprehensive patient demographics and characteristics of breast lesions.
| Clinical parameter | Training_ALL (%) | Benign (%) | Malignant (%) | pvalue | Testing_ALL (%) | Benign (%) | Malignant (%) | P value |
|---|---|---|---|---|---|---|---|---|
| Age (years) | 50.03 ± 12.81 | 44.68 ± 11.72 | 54.89 ± 11.81 | < 0.001 | 49.86 ± 13.28 | 45.71 ± 12.52 | 53.80 ± 12.87 | < 0.001 |
| Maxdiameter (cm) | 1.93 ± 1.00 | 1.58 ± 0.99 | 2.26 ± 0.89 | < 0.001 | 2.05 ± 1.16 | 1.66 ± 1.21 | 2.42 ± 0.99 | < 0.001 |
| Family_history | 1 | 0.042 | ||||||
| No | 260 (97.38) | 124 (97.64) | 136 (97.14) | 109 (94.78) | 56 (100.00) | 53 (89.83) | ||
| Yes | 7 (2.62) | 3 (2.36) | 4 (2.86) | 6 (5.22) | null | 6 (10.17) | ||
| Marriage | 0.008 | 0.394 | ||||||
| No | 8 (3.00) | 8 (6.30) | null | 7 (6.09) | 5 (8.93) | 2 (3.39) | ||
| Yes | 259 (97.00) | 119 (93.70) | 140 (100.00) | 108 (93.91) | 51 (91.07) | 57 (96.61) | ||
| Fertility | 0.002 | 0.394 | ||||||
| No | 10 (3.75) | 10 (7.87) | null | 7 (6.09) | 5 (8.93) | 2 (3.39) | ||
| Yes | 257 (96.25) | 117 (92.13) | 140 (100.00) | 108 (93.91) | 51 (91.07) | 57 (96.61) | ||
| Menopause | < 0.001 | 0.015 | ||||||
| No | 149 (55.81) | 90 (70.87) | 59 (42.14) | 68 (59.13) | 40 (71.43) | 28 (47.46) | ||
| Yes | 118 (44.19) | 37 (29.13) | 81 (57.86) | 47 (40.87) | 16 (28.57) | 31 (52.54) | ||
| Shape | 0.069 | 1 | ||||||
| Regular | 31 (11.61) | 20 (15.75) | 11 (7.86) | 15 (13.04) | 7 (12.50) | 8 (13.56) | ||
| Irregular | 236 (88.39) | 107 (84.25) | 129 (92.14) | 100 (86.96) | 49 (87.50) | 51 (86.44) | ||
| Margin | < 0.001 | < 0.001 | ||||||
| Smooth | 104 (38.95) | 81 (63.78) | 23 (16.43) | 49 (42.61) | 36 (64.29) | 13 (22.03) | ||
| Spiculated | 50 (18.73) | 17 (13.39) | 33 (23.57) | 22 (19.13) | 7 (12.50) | 15 (25.42) | ||
| Angular | 31 (11.61) | 3 (2.36) | 28 (20.00) | 8 (6.96) | null | 8 (13.56) | ||
| Indistinct | 82 (30.71) | 26 (20.47) | 56 (40.00) | 36 (31.30) | 13 (23.21) | 23 (38.98) | ||
| Echo_pattern | 0.007 | 0.625 | ||||||
| Hypoechoic | 226 (84.64) | 116 (91.34) | 110 (78.57) | 102 (88.70) | 51 (91.07) | 51 (86.44) | ||
| Complex | 41 (15.36) | 11 (8.66) | 30 (21.43) | 13 (11.30) | 5 (8.93) | 8 (13.56) | ||
| Calcifcation | 0.01 | 0.003 | ||||||
| No | 140 (52.43) | 73 (57.48) | 67 (47.86) | 60 (52.17) | 37 (66.07) | 23 (38.98) | ||
| Macro | 28 (10.49) | 18 (14.17) | 10 (7.14) | 15 (13.04) | 8 (14.29) | 7 (11.86) | ||
| Micro | 99 (37.08) | 36 (28.35) | 63 (45.00) | 40 (34.78) | 11 (19.64) | 29 (49.15) | ||
| Posterior_acoustic_features | < 0.001 | 0.006 | ||||||
| No change | 176 (65.92) | 110 (86.61) | 66 (47.14) | 84 (73.04) | 48 (85.71) | 36 (61.02) | ||
| Enhance | 35 (13.11) | 4 (3.15) | 31 (22.14) | 10 (8.70) | 1 (1.79) | 9 (15.25) | ||
| Decrease | 56 (20.97) | 13 (10.24) | 43 (30.71) | 21 (18.26) | 7 (12.50) | 14 (23.73) | ||
| Doppler_blood_flow | < 0.001 | 0.004 | ||||||
| No | 95 (35.58) | 64 (50.39) | 31 (22.14) | 51 (44.35) | 33 (58.93) | 18 (30.51) | ||
| Yes | 172 (64.42) | 63 (49.61) | 109 (77.86) | 64 (55.65) | 23 (41.07) | 41 (69.49) | ||
| BIRADS | < 0.001 | < 0.001 | ||||||
| 4a | 85 (31.84) | 78 (61.42) | 7 (5.00) | 40 (34.78) | 35 (62.50) | 5 (8.47) | ||
| 4b | 77 (28.84) | 30 (23.62) | 47 (33.57) | 40 (34.78) | 15 (26.79) | 25 (42.37) | ||
| 4c | 105 (39.33) | 19 (14.96) | 86 (61.43) | 35 (30.43) | 6 (10.71) | 29 (49.15) | ||
| Tumor_position | 0.207 | 0.762 | ||||||
| Upper outer quadrant | 143 (53.56) | 66 (51.97) | 77 (55.00) | 65 (56.52) | 33 (58.93) | 32 (54.24) | ||
| Lower outer quadrant | 42 (15.73) | 16 (12.60) | 26 (18.57) | 17 (14.78) | 7 (12.50) | 10 (16.95) | ||
| Upper inner quadrant | 58 (21.72) | 33 (25.98) | 25 (17.86) | 23 (20.00) | 10 (17.86) | 13 (22.03) | ||
| Lower inner quadrant | 22 (8.24) | 10 (7.87) | 12 (8.57) | 4 (3.48) | 3 (5.36) | 1 (1.69) | ||
| Other | 2 (0.75) | 2 (1.57) | null | 6 (5.22) | 3 (5.36) | 3 (5.08) |
Base model selection
The base model’s function as a feature encoder significantly influenced our classification approach. Therefore, we compared several image classification backbones, such as AlexNet20, VGG19_bn18, and DenseNet20121, to find the most suitable for BL prediction tasks. Table S2 shows the network performances, and VGG11, with its highest AUC, was chosen for feature extraction. VGG11 exhibited the lowest loss value, indicating its exceptional performance in reducing errors during the training process22, Additionally, it demonstrated quicker convergence compared to three other deep learning models (FigS1).
Evaluation between different models
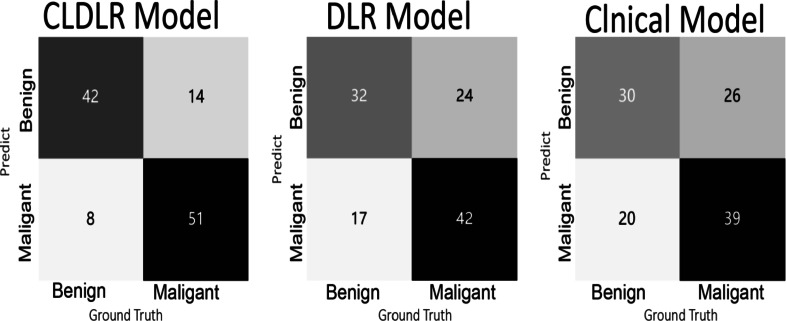
The DLR model that integrates clinical data was referred to as CLDLR, with CL representing the inclusion of clinical parameters.We included clinical parameters with a significance level of P < 0.05 and excluded BI-RADS assessments based on subjective judgments made by radiologists, in order to establish our Clinical model.The detailed results were summarized in Table 2. The CLDLR model, which integrates clinical parameters with DLR, demonstrated superior performance. In the training group DLR based solely on images achieved an AUC of 0.981 while the Clinical model had an AUC of 0.778; however, CLDLR surpassed both with an AUC of 0.988. In the testing group, although there was a slight decrease in the AUC for CLDLR to 0.888, it remained significantly higher than that of DLR model (AUC: 0.710, Delong test P < 0.05) and Clinical model(AUC: 0.708, Delong test P < 0.05). So the predicted probability of each breast lesion obtained by the CLDLR model was used as the AI score .The comparisons are visually represented by the ROC curves shown in Fig. 4a and b.The confusion matrix depicting the classification performance of various models in distinguishing between benign and malignant breast lesions within the testing group is presented in Fig. 5.
Table 2.
The performance comparison of different models.
| ModelName | AUC(95% CI) | Accuracy | Sensitivity | Specificity | PPV | NPV | Cohort |
|---|---|---|---|---|---|---|---|
| Clinical | 0.778 (0.723–0.834) | 0.73 | 0.829 | 0.622 | 0.707 | 0.767 | Training |
| 0.708 (0.614–0.802) | 0.67 | 0.525 | 0.821 | 0.756 | 0.622 | Testing | |
| DLR | 0.981 (0.969–0.993) | 0.929 | 0.914 | 0.945 | 0.948 | 0.909 | Training |
| 0.710 (0.612–0.807) | 0.722 | 0.932 | 0.5 | 0.663 | 0.875 | Testing | |
| CLDLR | 0.988 (0.949–0.985) | 0.948 | 0.95 | 0.945 | 0.95 | 0.945 | Training |
| 0.888 (0.829–0.947) | 0.817 | 0.881 | 0.75 | 0.788 | 0.857 | Testing |
Fig. 4.
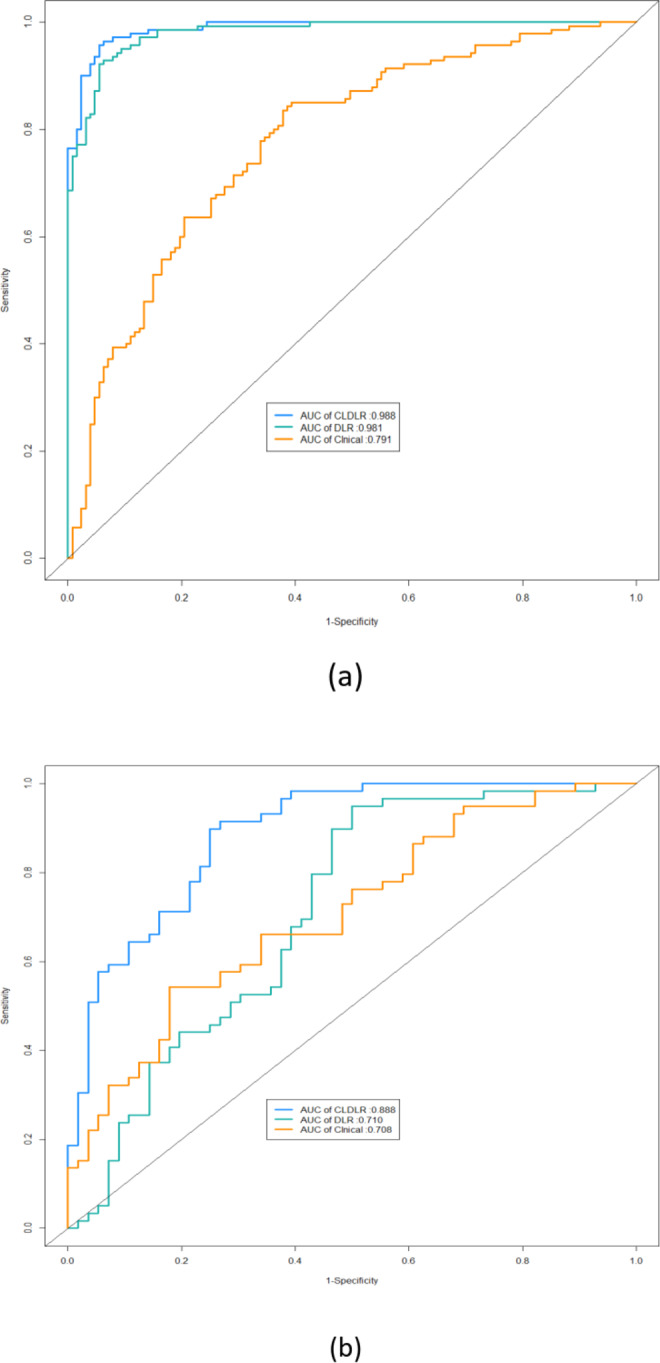
The ROC curves for different models in both training and testing set. (a) ROC curves of different models in training set. (b) ROC curves of different models in testing set.
Fig. 5.
Confusion matrix showing classification performance of multiple models for identifying benign and malignant breast lesions in the testing cohort.
Improved diagnosis for radiologists with AI assistance
The study analyzed the diagnostic changes provided by three radiologists during two rounds of assessment, both with and without AI assistance. Further details on these changes can be found in Table 3 and in FigS2. The ROC curves of the CLDLR model, as well as the diagnoses of each radiologist with and without AI assistance, are displayed in Fig. 6a and b. The AUC values for Junior, Senior, and Specialist with AI assistance were higher than their corresponding AUC values without AI assistance.All P-values from the Delong test were statistically significant and less than 0.05.
Table 3.
Detailed changes in diagnoses provided by the three radiologists both with and without AI assistance.
| Radiologists | Accuracy | Sensitivity | Specificity | PPV | NPV | Cohort |
|---|---|---|---|---|---|---|
| Junior | 0.713 | 0.847 | 0.571 | 0.676 | 0.780 | Without AI |
| 0.870 | 0.915 | 0.821 | 0.844 | 0.902 | With AI | |
| Senior | 0.748 | 0.847 | 0.643 | 0.714 | 0.800 | Without AI |
| 0.896 | 0.949 | 0.839 | 0.862 | 0.940 | With AI | |
| Specialist | 0.826 | 0.949 | 0.696 | 0.767 | 0.929 | Without AI |
| 0.930 | 0.966 | 0.893 | 0.905 | 0.962 | With AI |
Fig. 6.
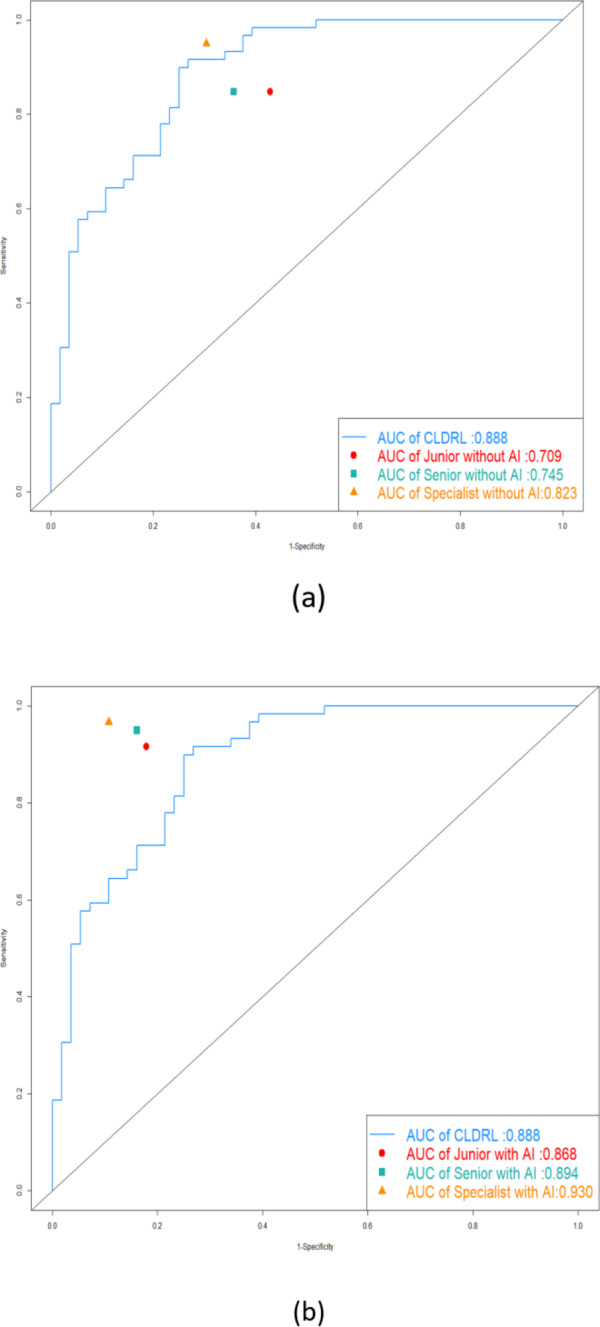
The ROC curves of the CLDLR model and the diagnoses of each radiologist with and without AI assistance. (a) The ROC curve of the CLDLR model and the diagnoses of each radiologist without AI assistance. (b)The ROC curve of the CLDLR model and the diagnoses of each radiologist witht AI assistance.
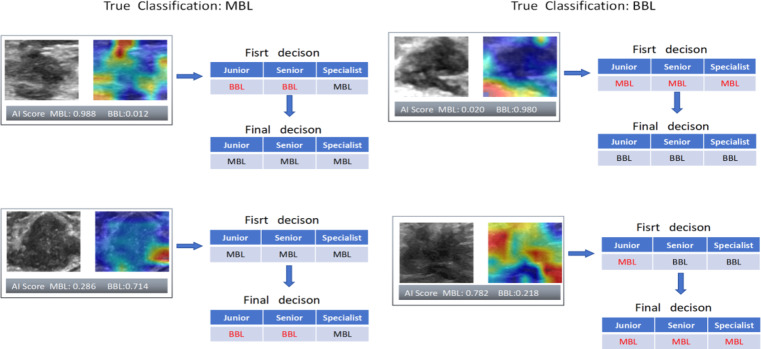
Figure 7 vividly depicts the clinical importance of our models by presenting some successful and unsuccessful cases where radiologists changed their frst-round decisions due to AI assistance. While the AI scores from the CLDLR and heatmaps from the DLR occasionally confused the radiologists, the testing set results indicated that the three radiologists benefited from AI aid, resulting in better evaluation performance.The accuracy, sensitivity, and specificity of Junior improved by 15.7%, 8.8%, and 25% respectively. For Senior, the corresponding improvements were 14.8%, 10.2%, and 19.6%. As for specialist, the improvements were 10.4%, 1.7%, and 19.7%.
Fig. 7.
Typical cases of our AI score and heatmap guiding radiologists to make correct and incorrect decisions. The left side represents breast lesions with a true malignant value, while the right side represents breast lesions with a true benign value. Black indicates correct judgments, whereas red indicates incorrect judgments.
Discussion
In this study, we have developed and validated a CLDLR model that combines clinical parameters with the DLR method based on breast grayscale ultrasound images for preoperative prediction of benign and malignant BI-RADS 4 lesions.The proposed method significantly outperformed any single method in distinguishing between patients with Malignant Breast Lesions (MBLs) and Benign Breast Lesions (BBLs).Our model achieved superior overall performance compared to human experts in the testing cohort. Additionally, the integration of AI scores derived from CLDRL model and heatmaps generated by DRL model has been demonstrated to enhance radiologists’ decision-making, underscoring the clinical value of employing AI-assisted diagnostic tools. A key feature of our study was the use of a two-stage assessment involving three radiologists, marking a distinction from other radiomics studies.
A significant number of investigations have been published concerning the identification and categorization of lesions in breast US images through the application of artificial intelligence models23–26. Our research possesses several advantages. Initially, Comparing to previous investigations, our study specifically concentrated on distinguishing between benign and malignant conditions of BI-RADS 4 lesions.It is important to acknowledge that clinicians face a significant challenge when deciding whether to upgrade or downgrade BI-RADS 4 lesions. As per the guidelines provided by the American College of Radiology BI-RADS Atlas5, confirming a diagnosis of BI-RADS 4 requires biopsy results indicating the presence or absence of breast cancer. To minimize unnecessary biopsies for patients categorized as BI-RADS 4, there is a strong demand for an AI diagnostic tool that offers enhanced clinical insights, particularly for this specific category27.
Secondly, the CLDLR model was developed by integrating clinical parameters with the DLR concept, based on an analysis of breast B-mode US images28. In contrast to previous studies employing deep learning network29–31, our research achieved superior diagnostic performance through a focus on combining clinical parameters with the DLR method.This approach enhances the model’s robustness by incorporating additional information alongside image features.The model achieved AUC, accuracy, sensitivity, and specificity values of 0.988, 0.948, 0.950, and 0.945 respectively in the training group. In the testing group, it obtained corresponding values of 0.888, 0.817, 0.881 and 0.75 for AUC, accuracy, sensitivity, and specificity(shown in Table 2).Our CLDLR model achieved signifcantly higher compared with the three radiologists in our first-round assessment(shown in Fig. 6a).
Furthermore, We explored the actual advantages that radiologists experience when using CLDLR and DLR in their clinical practice.To make our DLR model more aligned with clinical usability, we’ve integrated explainable elements, such as heatmaps, to render the AI’s decision-making processes transparent and comprehensible to human experts. This approach aims to overcome the “black box” issue associated with deep learning, which can hinder the trust of professionals in clinical fields32.Examining AI scores and heatmaps closely reveals their efficacy in helping radiologists. The AI scores, which predicts the probability of malignancy or benignity from the CLDLR model, stands out as a significant indicator to radiologists, especially with extreme model predictions.Despite the strengths of AI and radiomics models, clinicians are crucial for final evaluations. The heatmaps and AI scores are designed to enhance their understanding of AI prediction, assisting them in reviewing and reassessing marked regions within imaging studies when necessary. This support could lead to refined judgments.With the assistance of AI scores and heatmaps, the clinical performance of three radiologists was improved. Details are shown in Table 3 and FigS2. Despite the model’s positive impact on all readers, the greatest gains were realized by the junior radiologist.This suggests that the approach could be instrumental in rapidly advancing the skills of newly trained radiologists.
The study has several limitations that require attention. Firstly, the sample size was limited, and both the training and testing sets consisted of only a few lesion images from a single hospital. Additionally, the enrolled patient population may not accurately represent the natural distribution of cancer patients in the screening population, potentially impacting the accuracy of our models. Therefore, future studies might necessitate multicenter collaboration to thoroughly evaluate the robustness of our models. Secondly, this retrospective study included a subset patients with histologically confirmed biopsy results, leading to an absence of subsequent follow-up data. Furthermore, incorporating patients’ medical histories and BRCA gene test outcomes into its development is crucial to enhance the performance of our AI decision system. Thirdly, routine diagnostic procedures involve clinical evaluation along with mammography and magnetic resonance imaging in addition to AI technology. However, our study solely utilized static grayscale US images for obtaining results through AI technology, without incorporating US elastography images, US doppler images and US dynamic video. Although this study demonstrates that AI can assist in avoiding unnecessary biopsies, it remains critical for medical professionals to consider patients’ expectations and potential malignancy by using using AI results as a consultative benchmark rather than a final judgment.
Conclusion
Our study presents a noninvasive imaging biomarker for the prediction of benign and malignant BI-RADS 4 lesions. By comparing the results from two rounds of assessment, our AI-assisted diagnostic tool demonstrates practical value for radiologists with varying levels of experience.
Electronic Supplementary Material
Below is the link to the electronic supplementary material.
Abbreviations
- US
Ultrasound
- AI
Artificial intelligence
- BL
Breast lesion
- DLR
Deep learning radiomics
Author contributions
Conception and design: Liu Yang and Zhe Ma. Development of methodology, writing, review, and/or revision of the manuscript: Liu Yang. Acquisition of data: Naiwen Zhang, Junying Jia. Analysis and interpretation of data: Liu Yang. Study supervision: Zhe Ma.all authors commented on the previous version of the manuscript.
Funding
This study was supported by the Provincial Key Research and Development Fund of Shandong Province, China (Grant #: 2016GSF201141).
Data availability
The data that support the findings of this study are available from our Ultrasound Clinic but restrictions apply to the availability of these data, which were used under license for the current study, and so are not publicly available. Data are however available from the Corresponding Author upon reasonable request and with permission of our Ultrasound Clinic. This study complied with ethical standards, and all patient data was anonymized and properly protected, including encrypted storage of patient information, strict control of access, and timely destruction of unnecessary information.
Declarations
Competing interests
The authors declare no competing interests.
Ethical approval and informed consent
Ethical approvals for the study were obtained from the Institutional Review Boards of The First Affiliated Hospital of Shandong First Medical University & Shandong Provincial Qianfoshan Hospital (YXLL-KY-2023(045)).Patient consent was waived due to the retrospective nature of the study and the analysis used anonymous clinical data. The study was conducted according to the guidelines of the the Declaration of Helsinki (2013 revision).
Footnotes
Publisher’s note
Springer Nature remains neutral with regard to jurisdictional claims in published maps and institutional affiliations.
References
- 1.Siegel, R. L., Miller, K. D. & Jemal, A. Cancer statistics, 2018. CA Cancer J. Clin.68, 7–30 (2018). [DOI] [PubMed] [Google Scholar]
- 2.WHO. WHO report on cancer: setting priorities, investing wisely and providing care for all (2020).
- 3.Duggan, C. et al. National health system characteristics, breast cancer stage at diagnosis, and breast cancer mortality: a population-based analysis. Lancet Oncol.22 (11), 1632–1642 (2021). [DOI] [PubMed] [Google Scholar]
- 4.Sadoughi, F. et al. Artificial intelligence methods for the diagnosis of breast cancer by image processing: a review. Breast Cancer. 10, 219–230 (2018). [DOI] [PMC free article] [PubMed] [Google Scholar]
- 5.Mendelson, E. B. et al. ACR BI-RADS® Ultrasound In ACR BI-RADS® Atlas, Breast Imaging Reporting and Data System (American College of Radiology, 2013).
- 6.Lee, H. J. et al. Observer variability of Breast Imaging Reporting and Data System (BI-RADS) for breast ultrasound. Eur. J. Radiol.65, 293–298 (2008). [DOI] [PubMed] [Google Scholar]
- 7.Yang, Y. et al. A new nomogram for predicting the malignant diagnosis of breast imaging reporting and Data System (BI-RADS) ultrasounography category 4A lesions in women with dense breast tissue in the diagnostic setting. Quant. Imaging Med. Surg.11 (7), 3005–3017 (2021). [DOI] [PMC free article] [PubMed] [Google Scholar]
- 8.Szolovits, P., Patil, R. S. & Schwartz, W. B. Artificial intelligence in medical diagnosis. Ann. Intern. Med.108 (1), 80–87 (1988). [DOI] [PubMed] [Google Scholar]
- 9.Gillies, R. J., Kinahan, P. E. & Hricak, H. Radiomics: images are more than pictures, they are data. Radiology278, 563–577 (2016). [DOI] [PMC free article] [PubMed] [Google Scholar]
- 10.Zheng, X., Yao, Z. et al. Deep learning radiomics can predict axillary lymph node status in early-stage breast cancer. Nat. Commun.6 (1), 1236. 10.1038/s41467-020-15027-z (2020). [DOI] [PMC free article] [PubMed]
- 11.Wang, Z. et al. Multi-modality deep learning model reaches high prediction accuracy in the diagnosis of ovarian cancer. iScience4 (4), 109403. 10.1016/j.isci.2024.109403 (2024). [DOI] [PMC free article] [PubMed] [Google Scholar]
- 12.Gu, J. et al. Deep learning radiomics of ultrasonography can predict response to neoadjuvant chemotherapy in breast cancer at an early stage of treatment: a prospective study. Eur. Radiol. (2021). [DOI] [PubMed]
- 13.Xie, Y. T., Zhang, J. P., Xia, Y., Fulham, M. & Zhang, Y. N. Fusing texture, shape and deep model-learned information at decision level for automated classification of lung nodules on chest CT. Inf. Fusion. 42, 102–110 (2018). [Google Scholar]
- 14.Li, J. Yunyun Bu,et al.Development of a deep learning-based model for diagnosing breast nodules with ultrasound. J. Ultrasound Med. Mar.40 (3), 513–520. 10.1002/jum.15427 (2021). [DOI] [PubMed] [Google Scholar]
- 15.He, J. Y. Z. H. L. et al. Ultrasound-based radiomics analysis for differentiating benign and malignant breast lesions: From static images to CEUS video analysis. Front. Oncol.16, 12:951973. 10.3389/fonc.2022.951973 (2022). [DOI] [PMC free article] [PubMed] [Google Scholar]
- 16.Kiran Jabeen Muhammad Attique Khan,et al.Breast cancer classification from ultrasound images using probability-based optimal deep learning feature fusion. Sensors (Basel) 22(3), 807. 10.3390/s22030807 (2022). [DOI] [PMC free article] [PubMed]
- 17.Ma, Q., Shen, Q. et al. Radiomics analysis of breast lesions in combination with coronal plane of ABVS and strain elastography. Breast Cancer (Dove Med. Press)26 15, 381–390. 10.2147/BCTT.S410356 (2023). [DOI] [PMC free article] [PubMed]
- 18.Simonyan, K. & Zisserman, A. Very deep convolutional networks for large scale image recognition. Preprint at http://arxiv.org/arXiv:14091556 (2014).
- 19.Selvaraju, R. R. et al. Grad-CAM: Visual explanations from deep networks via gradient-based localization. Int. J. Comput. Vis.128, 336–359 (2020). [Google Scholar]
- 20.Krizhevsky, A. & Sutskever, I. and Geoffrey E. Hinton. Imagenet classification with deep convolutional neural networks. Adv. Neural. Inf. Process. Syst., 1097–1105 (2012).
- 21.Huang, G., Liu, Z., van der Maaten, L. & Weinberger, K. Q. Densely connected convolutional networks. Preprint at http://arxiv.org/arXiv:160806993 (2016).
- 22.Zhang, H. et al. Research on the classification of benign and malignant parotid tumors based on transfer learning and a convolutional neural network. IEEE Access9, 40360–40371. 10.1109/ACCESS.2021.3064752 (2021). [Google Scholar]
- 23.Fleury, E., Marcomini, K. Performance of machine learning software to classify breast lesions using BI-RADS radiomic features on ultrasound images. Eur. Radiol. Exp. 3(1), 34. 10.1186/s41747-019-0112-7 (2019). [DOI] [PMC free article] [PubMed]
- 24. Zhao, Z. et al. Application of deep learning to reduce the rate of malignancy among BI-RADS 4A breast lesions based on ultrasonography. Ultrasound Med. Biol. 48(11), 2267–2275. 10.1016/j.ultrasmedbio.2022.06.019 (2022). [DOI] [PubMed]
- 25.Zhang, N. et al. Application of deep learning to establish a diagnostic model of breast lesions using two-dimensional grayscale ultrasound imaging. Clin. Imaging79, 56–63. 10.1016/j.clinimag.2021.03.024 (2021). [DOI] [PubMed] [Google Scholar]
- 26.Valeria R. et al. Clinical value of radiomics and machine learning in breast ultrasound: a multicenter study for differential diagnosis of benign and malignant lesions. Eur. Radiol.31(12), 9511–9519. 10.1007/s00330-021-08009-2 (2021). [DOI] [PMC free article] [PubMed]
- 27.Destrempes, F. et al. Added value of quantitative ultrasound and machine learning in BI-RADS 4–5 assessment of solid breast lesions. Ultrasound Med. Biol.46, 436–444 (2020). [DOI] [PubMed] [Google Scholar]
- 28.Wang, K. et al. Deep learning radiomics of shear wave elastography significantly improved diagnostic performance for assessing liver fibrosis in chronic hepatitis B: a prospective multicentre study. Gut68, 729–741 (2019). [DOI] [PMC free article] [PubMed] [Google Scholar]
- 29.Cao, Z. et al. An experimental study on breast lesion detection and classification from ultrasound images using deep learning architectures. BMC Med. Imaging19(1), 51. 10.1186/s12880-019-0349-x (2019). [DOI] [PMC free article] [PubMed]
- 30.Qian, X. et al. .A combined ultrasonic B-mode and color Doppler system for the classification of breast masses using neural network. Eur. Radiol.30 (5), 3023–3033. 10.1007/s00330-019-06610-0 (2020). [DOI] [PubMed] [Google Scholar]
- 31.Nasim Sirjani,Mostafa Ghelich Oghli. .A novel deep learning model for breast lesion classification using ultrasound Images: A multicenter data evaluation. Phys. Med. Mar.107, 102560. 10.1016/j.ejmp.2023.102560 (2023). [DOI] [PubMed] [Google Scholar]
- 32.Castelvecchi, D. Can we open the black box of AI? Nature538, 20–23 (2016). [DOI] [PubMed] [Google Scholar]
Associated Data
This section collects any data citations, data availability statements, or supplementary materials included in this article.
Supplementary Materials
Data Availability Statement
The data that support the findings of this study are available from our Ultrasound Clinic but restrictions apply to the availability of these data, which were used under license for the current study, and so are not publicly available. Data are however available from the Corresponding Author upon reasonable request and with permission of our Ultrasound Clinic. This study complied with ethical standards, and all patient data was anonymized and properly protected, including encrypted storage of patient information, strict control of access, and timely destruction of unnecessary information.


