Abstract
To address the challenges related to active power dissipation and node voltage fluctuation in the practical transformation of power grids in the field of new energy such as wind and photovoltaic power generation, an improved Dung Beetle Optimization Algorithm Based on a Hybrid Strategy of Levy Flight and Differential Evolution (LDEDBO) is proposed. This paper systematically addresses this issue from three aspects: firstly, optimizing the DBO algorithm using Chebyshev chaotic mapping, Levy flight strategy, and differential evolution algorithm; secondly, validating the algorithm’s feasibility through real-time network reconfiguration at random time points within a 24-h period; and finally, applying the LDEDBO to address the dynamic reconfiguration problems of the IEEE-33 and IEEE-69 node bus. The simulation indicates that the power dissipation of the IEEE-33 node bus is decreased by 28.94% and the minimum node voltage is elevated from 0.9273 p.u to 0.9447 p.u after the reconstruction with LDEDBO. The power dissipation of the IEEE-69 node bus is reduced by 36.45%, and the minimum node voltage is increased from 0.9224 p.u to 0.9481 p.u. The LDEDBO enhances both the pace of convergence and the precision of the optimization model, leading to a superior solution for the switching combination.
Supplementary Information
The online version contains supplementary material available at 10.1038/s41598-024-83307-5.
Keywords: Distribution network reconfiguration, LDEDBO algorithm, Optimization algorithm, Dynamic reconfiguration, Time-varying load
Subject terms: Electrical and electronic engineering, Energy grids and networks, Power distribution, Solar energy, Wind energy
Introduction
In 2022, the global energy landscape underwent a significant shift, with the carbon intensity of global power generation historically dropping to 436 gCO2/kWh. Solar power generation increased by a substantial 24%, and wind power by 17%, making a crucial contribution to the clean and renewable energy sector1. The new distribution grid seamlessly integrates clean energy with the power system. Simultaneously, the application of intelligent management technology further improves the efficiency and controllability of the energy system. Together, these transformations shape a clean and sustainable energy future. The restructuring of the distribution grid, as a key component of this paradigm shift, aims to redesign and optimize the distribution system to better accommodate the large-scale integration of clean energy2.
When small power generation and storage devices (such as photovoltaic cells, wind generators, and energy storage cells.) are connected to the grid system as distributed generation (DG), they can cause voltage fluctuations, frequency distortion, and changes in power flow3. In this case, it is imperative to reconfigure the power grid by formulating the goal function and adjusting the state of the grid-connected switch and the segment switch4. Chandramohan et al.5 proposed the minimization of operating costs and the maximization of operational reliability as objective functions. Operating costs include the price of both active and reactive power, while operational reliability is achieved by minimizing total system outage costs. Additionally, Gözel et al.6 determined the optimal scale and location of DG by minimizing total power loss. Gupta et al.7 transformed various power quality and reliability objectives such as feeder power losses, system’s nodal voltage deviations, system’s average interruption frequency index, system’s average interruption unavailability index, and unserved energy into a single objective function, which was then genetic algorithm is used to solve this single objective problem. Besides, several commonly used objective functions include minimum investment cost8,9, minimum voltage stability index10, minimum load balancing index11, among others.
However, the aforementioned studies primarily focus on the static reconfiguration problem at individual time points, unable to address the dynamic changes during the operation of the power system. Dynamic reconfiguration involves real-time monitoring and adjustments to the system state to adapt to the evolving operational conditions of the power system. This encompasses dynamic adjustments to load, power sources, and network topology to meet the real-time demands and fluctuations of the power system. Therefore, many researchers define distribution grid reconfiguration as a dynamic issue requiring real-time monitoring, system feedback, and efficient decision algorithms to ensure the smooth operation of the power system in a dynamic environment12. Considering the inherent uncertainty associated with distributed photovoltaic (PV) systems, a recent study by Xu et al.13 introduced a novel multi-objective and robust optimization strategy aimed at maximizing the utilization of renewable energy resources. Besides, Pan and Wang et al.14,15 considered the restriction of load demand curve on network changing action, the reconstruction cycle is divided according to load monotonicity and amplitude variation. Li et al.16 constructed an ADN integrated optimization model considering photovoltaic, wind power, dynamic load and real-time electricity price. The MOSSA-based approach formulates an excellent optimization scheme with the highest power quality and the best energy and economic benefits.
Metaheuristic algorithms, due to their versatility and flexibility, have been widely applied in the field of power systems. For example, Senapati et al.17 proposed a novel intelligent control system based on the TS fuzzy algorithm to address power quality issues in power systems, such as voltage sags, voltage harmonics, nonlinear loads, and load imbalance, thereby improving the overall performance of the power system. Senapati et al.18 introduced a priority-based load shedding algorithm aimed at enhancing the stability of hybrid DC microgrids, maintaining power balance among various energy sources and storage devices during independent or prolonged islanding operation modes. Senapati et al.19 proposed a hybrid maximum power point tracking (MPPT) technique that combines an improved invasive weed optimization (MIWO) algorithm with the traditional perturb and observe (P&O) algorithm, enhancing the searching performance of PV systems under partial shading conditions (PSCs) and rapid climatic changes. Finally, they also proposed a hybrid firefly algorithm-particle swarm optimization (FA-PSO) approach, which combines the global search capability of the firefly algorithm with the rapid convergence of particle swarm optimization. This method can more effectively optimize the parameters of Takagi-Sugeno fuzzy inference systems (TSFIS) and adaptive neuro-fuzzy inference systems (ANFIS), thereby improving the voltage regulation performance and adaptability of DC microgrids20.
Due to their ability to handle complex, high-dimensional, and nonlinear optimization problems, metaheuristic algorithms have recently been applied to the dynamic reconfiguration of distribution networks. For instance, an improved binary particle swarm optimization algorithm has been proposed to solve the low-power reconstruction model by effectively generating and updating particles to break loop constraints21. Additionally, a new hybrid optimization algorithm that combines chaotic particle swarm optimization and chicken swarm optimization has been proposed to overcome the limitations of traditional optimization algorithms in the reconfiguration of distribution networks22.
In recent years, more meta-heuristic algorithms have been developed successively, such as Harmonious Search algorithm (HS)23, Grasshopper Optimization algorithm (GOA)24, Gray Wolf Optimization algorithm (GWO)25, Moth Flame Optimization algorithm (MFO)26, Whale Optimization algorithm (WOA)27, Dragonfly algorithm (DA)28 and Dung Beetle algorithm (DBO)29. Among them, DBO has a strong advantage in dealing with complex dynamic reconfiguration problems in distribution network. First of all, there are four different types of dung beetle individuals in DBO, each with different optimization methods, which gives the DBO a powerful global search ability, enabling it to effectively explore the solution space and quickly converge to the optimal reconstruction scheme. In addition, DBO is very suitable to deal with the nonlinear constraints that often occur in the distribution network reconstruction task, which ensures the accuracy of the reconstruction scheme. Its adaptive characteristics enable it to adapt to different load conditions in real time, thus maintaining the reliability of the system. These characteristics make DBO a powerful tool to realize efficient and reliable dynamic reconfiguration of distribution network. Although DBO has advantages such as global search capability and adaptability to dynamic conditions, there are also some challenges. Distribution network may also lead to multiple local optimal solutions under different reconfiguration schemes, which will hinder the ability of the algorithm to find the global optimal solution and limit its reliability in large-scale distribution networks.
Improvement methods for metaheuristic algorithms vary, leading to differences in the performance of the improved algorithms. To maximize the optimization ability and convergence of the algorithms while meeting the algorithm constraints, this study employs the Chebyshev chaotic mapping to enhance the population initialization stage of the DBO algorithm, enabling the individuals to be uniformly distributed randomly in the search space. Subsequently, the population is divided into four different types of beetles in a 6:6:7:11 ratio, and the Levy flight strategy is introduced into the population update mode to find the optimal position within the population and record the initial optimal values. In the subsequent phases of the procedure, the DE technique is introduced to choose, alter, and combine the initial optimal values, averting the algorithm from getting trapped in local minima. The resulting algorithm, named LDEDBO, is then applied to the dynamic reconstruction of the IEEE-33 and IEEE-69 node bus, obtaining the optimal switch com-bination solution with minimized network losses and minimal node voltage deviations.
The main findings of this paper are summarized as follows:
A novel algorithm, LDEDBO, is introduced in this study.
The proposed LDEDBO algorithm is applied to the optimal reconstruction of distribution network, and the feasibility of LDEDBO in the reconstruction of distribution network is verified by real-time load data.
The proposed LDEDBO algorithm is applied to the dynamic reconfiguration of distribution network. Compared with PSO, GA and DBO algorithms, LDEDBO significantly increases the voltage of each node and reduces the active power loss of the system.
The organization of the remaining part of this document is outlined below: In “Issue definition”, the mathematical framework for distribution network reconstruction is introduced; In “Methodology”, an improved LDEDBO is presented. “Experimental design and results analysis” presents and scrutinizes the dynamic reconfiguration outcomes of the LDEDBO and the control group algorithm that have been validated. “Conclusion” gives a comprehensive conclusion.
Issue definition
Objective function
Active power dissipation
To enhance the economic efficiency of grid operation, the focus of this study is on pinpointing the most effective combination of network switches to minimize the active power dissipation within the grid6,30. The formal representation of active power dissipation is as follows:
| 1 |
where,
Node voltage deviation
To fortify the stability of the power distribution system operation, this paper incorporates the minimization of node voltage deviation as one of its key objectives31. The formalized expression for node voltage deviation is presented below:
| 2 |
where, M is the total number of nodes within the system,
Objective function normalization
When normalizing multi-objective functions, the method of judgment matrix is utilized to calculate the weight of each objective function32, with the total objective function designated as Eq. (3):
| 3 |
where,
| 4 |
| 5 |
where, n is the number of objective functions.
Sum each column of the judgment matrix to get the sum
| 6 |
The calculation formula of weight coefficient
| 7 |
The weight coefficients of the two objective functions obtained by the weight coefficient method are as follows:
Operational constraints
To prevent impractical outcomes that compromise the principles of safe and stable network operation, the refurbishment of the grid must comply with power transmission, nodal voltage, branch power, power generation, and network configuration constraints33. Equation (8) illustrates the load flow restrictions.
| 8 |
where,
| 9 |
where,
Equation (10) shows the constraints of branch power:
| 10 |
where,
Equation (11) is the constraints of DG power:
| 11 |
where,
Equation (12) is the constraint of network structure:
| 12 |
where, g indicates the configuration of the power distribution system. G encompasses the entire set of network structures within the distribution system.
Methodology
DBO algorithm
The DBO algorithm is an intelligent optimization algorithm inspired by the motion process of rolling dung beetles29. The population consists of four types of individuals: rolling beetles, female beetles, larvae beetles, and thief beetles, in the proportions of 6:6:7:11. Throughout the iterative procedure, the positional data of rolling beetles undergoes various updates, as defined by Eq. (13).
| 13 |
| 14 |
where, i = 1, 2, 3, …, NP;
When a rolling beetle hits a barrier, it updates its position as Eq. (15):
| 15 |
Here,
Female dung beetle spawning boundary and egg position update as follow:
| 16 |
| 17 |
| 18 |
where,
The position of larvae in the population is simulated as Eq. (21):
| 19 |
| 20 |
| 21 |
where,
The equation for adjusting the location of the thief beetles, which emerge in the population to compete for food, is as Eq. (22):
| 22 |
where, setting
LDEDBO algorithm
To achieve a uniform distribution of the initial beetle population in the search space, the DBO utilizes Chebyshev chaotic mapping to improve the initialization, ensuring that individuals are uniformly distributed. Furthermore, the introduction of the Levy flight strategy equips beetle individuals with the ability to make long jumps, enabling them to explore the optimal solution in a wide space when updating their position information. Furthermore, to avert the algorithm from becoming ensnared in local optima during subsequent iterations, the DE is employed to modify the optimal solution of the DBO through a series of operations including mutation, crossover, and selection. This is referred to as the LDEDBO algorithm, and its implementation can further improve the overall performance and effectiveness of the algorithm.
Chebyshev chaotic mapping
The Chebyshev chaotic mapping is a nonlinear dynamical system that generates a series of numerical sequences with chaotic properties through recursive iteration. In the DBO algorithm, the Chebyshev chaotic mapping is introduced to initialize the dung beetle population, simulating the random search behavior of individual dung beetles, and increasing the variability and heterogeneity within the population. The position of the individual i is
| 23 |
In this context, h represents the order of the Chebyshev mapping. When the value of h is greater than 2, it generates an infinite-length chaotic sequence without a periodic pattern. It is common to set
Levy flight strategy
The long-tail distribution of Levy flight steps makes it possible to have large jumps in the search space. This method is introduced into the DBO algorithm to improve the location modification mode of beetles and help to escape from the local optimum. The particular equation is outlined below:
| 24 |
| 25 |
The function first defines the parameter c of the Levy distribution as 1.5 and calculates e according to the formula. Subsequently, the
DE algorithm
DE approach is a parallel direct search technique employed to handle non-differentiable, complex and multi-peaked objective functions34. After the DBO algorithm obtains the initial optimal solution
| 26 |
where,
| 27 |
where,
Following the selection operation,
| 28 |
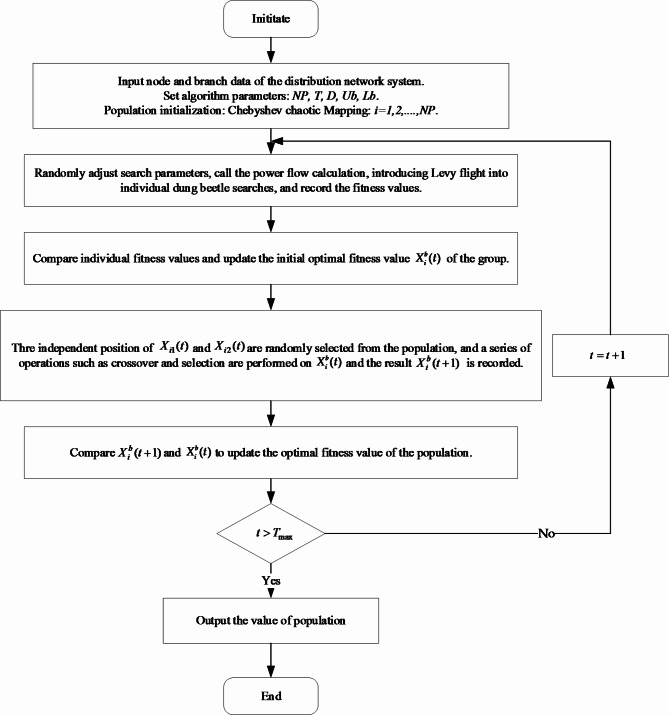
The algorithm diagram for LDEDBO can be seen in Fig. 1.
Fig. 1.
Flowchart of LDEDBO algorithm.
Algorithm testing
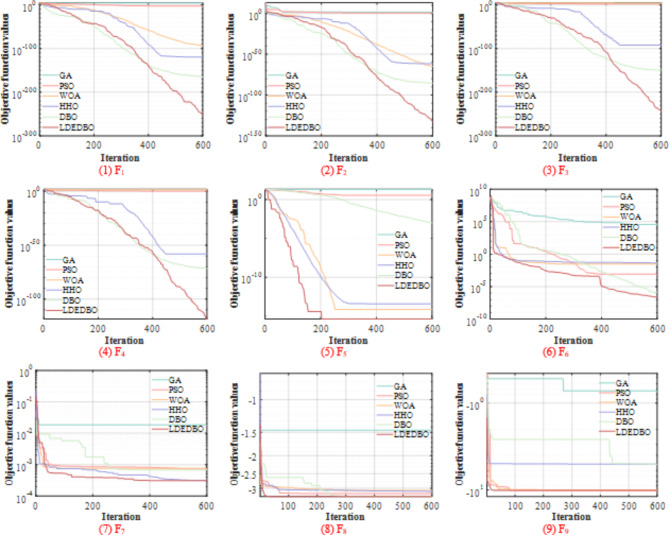
This study selects 9 common test functions to evaluate LDEDBO’s algorithm performance. The test results of GA, PSO, WOA, HHO, and DBO as control algorithms are compared with those of the LDEDBO algorithm. We set key performance indicators such as best value (BEST), average value (MEAN), standard deviation (STD), and algorithm runtime (TIME) to evaluate its convergence accuracy, stability, robustness, and time complexity. Algorithm parameters are set as shown in Table 1. The formulas and parameters of relevant test functions are shown in Table 2. Each algorithm is initialized with a total initial population size of 30, runs 30 times, and iterates 600 times each. The test results are shown in Table 3, and the convergence curve of each algorithm is shown in Fig. 2.
Table 1.
GA, PSO, DBO and LDEDBO parameter configurations.
| Algorithms | Parameters |
|---|---|
| GA |
|
| PSO |
|
| WOA |
|
| HHO |
|
| DBO |
|
| LDEDBO |
|
Table 2.
Test function settings.
| Function | Dim | Min |
|---|---|---|
|
|
30 | 0 |
|
|
30 | 0 |
|
|
30 | 0 |
|
|
30 | 0 |
|
|
30 | 0 |
|
|
30 | 0 |
|
|
4 | 0.0003075 |
|
|
6 | − 3.32 |
|
|
4 | − 10 |
Table 3.
Algorithm test results.
| Functions | Index | GA | PSO | WOA | HHO | DBO | LDEDBO |
|---|---|---|---|---|---|---|---|
| F1 | BEST | 10499.1679 | 0.0002756 | 3.53E−101 | 7.04E−133 | 1.78E−204 | 8.07E−302 |
| MEAN | 19498.0397 | 0.015439 | 5.98E−89 | 1.42E−115 | 1.69E−134 | 5.82E−214 | |
| STD | 7150.4176 | 0.02492 | 3.26E−88 | 5.02E−115 | 8.91E−134 | 0 | |
| TIME | 0.075835 | 0.055012 | 0.046318 | 0.09976 | 0.10209 | 0.1048 | |
| F2 | BEST | 33.6167 | 0.065757 | 4.10E−67 | 3.64E−74 | 2.19E−100 | 1.26E−138 |
| MEAN | 53.6898 | 1.6907 | 5.97E−59 | 3.26E−60 | 5.63E−65 | 4.46E−114 | |
| STD | 11.5429 | 1.5793 | 3.26E−58 | 1.45E−59 | 3.08E−64 | 2.44E−113 | |
| TIME | 0.078982 | 0.058725 | 0.049809 | 0.10234 | 0.11028 | 0.11333 | |
| F3 | BEST | 32900.2626 | 52.4841 | 13943.721 | 2.27E−115 | 1.84E−164 | 4.88E−257 |
| MEAN | 55324.6567 | 369.984 | 35695.095 | 8.21E−92 | 2.87E−85 | 4.93E−99 | |
| STD | 16505.4311 | 247.9008 | 9007.6008 | 3.09E−91 | 1.57E−84 | 2.70E−98 | |
| TIME | 0.24504 | 0.22134 | 0.2136 | 0.51225 | 0.27849 | 0.27978 | |
| F4 | BEST | 45.353 | 1.4891 | 4.196 | 3.77E−65 | 4.64E−98 | 2.27E−129 |
| MEAN | 70.5708 | 3.2491 | 57.158 | 3.31E−58 | 3.60E−66 | 8.92E−105 | |
| STD | 11.2342 | 0.94879 | 26.5668 | 1.79E−57 | 1.95E−65 | 4.88E−104 | |
| TIME | 0.079827 | 0.060015 | 0.048497 | 0.13013 | 0.1093 | 0.11103 | |
| F5 | BEST | 19.3088 | 1.3514 | 4.44E−16 | 3.95E−14 | 0.00058442 | 4.44E−16 |
| MEAN | 20.0295 | 2.1246 | 2.58E−15 | 4.20E−14 | 0.0008647 | 4.44E−16 | |
| STD | 0.33065 | 0.62958 | 2.48E−15 | 3.76E−15 | 0.00029371 | 0 | |
| TIME | 0.10421 | 0.075533 | 0.062343 | 0.14602 | 0.37277 | 0.12631 | |
| F6 | BEST | 218.4346 | 0.0008395 | 0.0023575 | 0.01312 | 3.82E−07 | 2.43E−08 |
| MEAN | 8156864.642 | 1.094 | 0.016944 | 0.03715 | 1.19E−06 | 0.00011169 | |
| STD | 13960298.39 | 1.0965 | 0.022174 | 0.014297 | 7.00E−07 | 0.00029825 | |
| TIME | 0.37941 | 0.34449 | 0.34241 | 0.42971 | 0.69909 | 0.41919 | |
| F7 | BEST | 0.0009885 | 0.0003075 | 0.0003095 | 0.00030749 | 0.0003136 | 0.00030749 |
| MEAN | 0.010339 | 0.0008148 | 0.001156 | 0.0050124 | 0.0027021 | 0.0008233 | |
| STD | 0.008073 | 0.0003494 | 0.0020847 | 0.0086136 | 0.0059902 | 0.00038043 | |
| TIME | 0.076245 | 0.026711 | 0.039919 | 0.047216 | 0.052875 | 0.096752 | |
| F8 | BEST | −2.9317 | −3.322 | −3.3218 | −3.322 | −3.322 | −3.322 |
| MEAN | −1.692 | −3.2744 | −3.2152 | −3.2776 | −3.2201 | −3.2348 | |
| STD | 0.57755 | 0.059241 | 0.12122 | 0.072339 | 0.052668 | 0.092416 | |
| TIME | 0.095941 | 0.040054 | 0.055393 | 0.069391 | 0.071979 | 0.11859 | |
| F9 | BEST | −1.9565 | −10.1532 | −10.1531 | −10.0781 | −10.1532 | −10.1532 |
| MEAN | −0.95066 | −6.1035 | −8.8556 | −5.5473 | −7.7833 | −7.619 | |
| STD | 0.48134 | 3.1181 | 2.3653 | 1.5112 | 2.5736 | 2.5768 | |
| TIME | 0.10913 | 0.046623 | 0.06135 | 0.18155 | 0.12547 | 0.12346 |
Fig. 2.
Algorithm test curve.
According to the test results, the optimal value of LDEDBO algorithm is obviously better than that of the control algorithm, which indicates that LDEDBO algorithm has good optimization ability. The average index is close to the optimal value, reflecting the average result of LDEDBO’s overall performance in many runs, which indicates that it has good stability. And the standard deviation index is small, indicating that LDEDBO algorithm has good robustness. Although the LDEDBO algorithm is slightly worse than the control group in terms of runtime, the gap is not significant, and considering its advantages in other performance indicators, LDEDBO algorithm still shows a strong overall performance. The slight increase in the running time of LDEDBO algorithm may be due to the complexity of the calculation process caused by the addition of an improved strategy on the basis of the original DBO algorithm, but it also provides LDEDBO with higher accuracy and better robustness. Therefore, in summary, LDEDBO algorithm shows excellent performance in the test results, especially in solving complex problems, which is worthy of further promotion and application.
Experimental design and results analysis
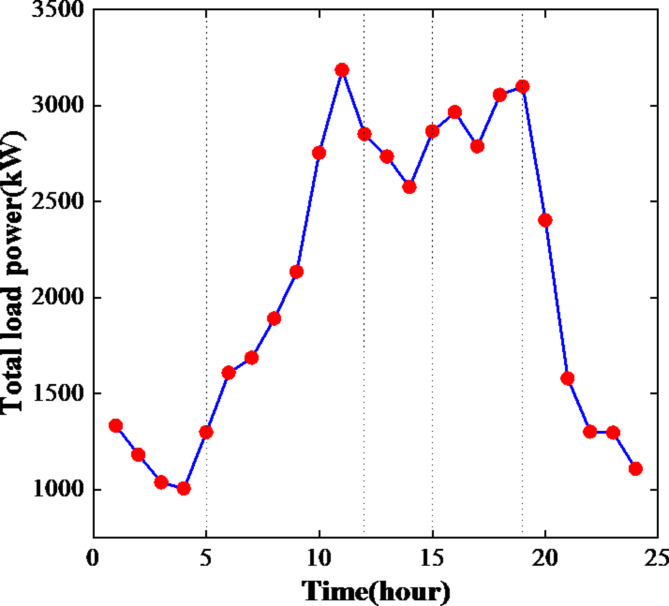
When reconfiguring dispersed electricity distribution networks, the fluctuating nature of actual load demand necessitates a shift from static reconfiguration at a single time point to dynamic reconfiguration. In this study, we address this by reconfiguring the time-varying load into five distinct periods based on the rising and falling trends observed in the load power curve depicted in Fig. 3. Subsequent simulation experiments were conducted using the MATLAB platform. Throughout all experimental scenarios, control group experiments were conducted using DBO, PSO, and GA algorithms, with specific parameter settings detailed in Table 1. Each algorithm underwent independent runs 30 times, with varying numbers of iterations designed according to the experimental plan. Key metrics including average active network losses, minimum nodal voltage, and the switch configuration linked to the minimum performance value were recorded for analysis.
Fig. 3.
Aggregate power consumption fluctuation curve of the network throughout a 24-h timeframe.
Simulation and analysis of case 1: IEEE-33 node bus
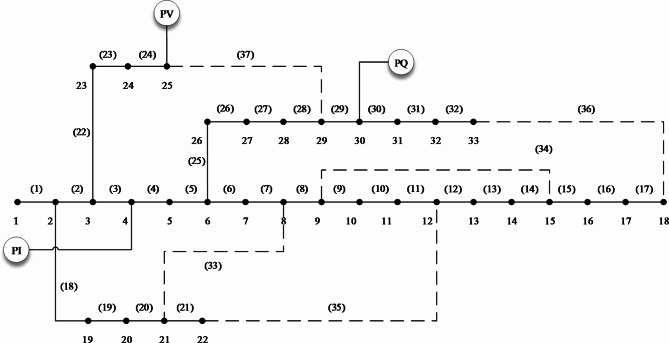
In the structure of the IEEE-33 node bus, there are 32 feeders, 33 connection points, 32 isolating switches, 5 interconnection switches, and 5 primary loops. The initial base capacity of the network is 10 MVA, with a standard load of 3715 kW + j2300 kVar, and a reference voltage of 12.66 kV. In the experiment, wind energy sources are used as PQ-type nodes, photovoltaic sources as PI-type nodes, and gas turbines are linked to the distribution network as PV-type components, with the installation positions of DG shown in Fig. 4. Table 4 provides the specific parameters of the DG. Real-time load data at 05:00, 10:00, and 20:00 are randomly selected from the daily load curve for the purpose of reconfiguration. Each algorithm is set to undergo 50 iterations.
Fig. 4.
Installation position of the DG in the IEEE-33 small-scale node bus.
Table 4.
The characteristics of various DG categories in the IEEE-33 small-scale node bus.
| DG type | Node | Parameters |
|---|---|---|
| PI | 4 |
|
| PV | 25 |
|
| PQ | 30 |
|
The experimental results presented in Table 5 clearly demonstrate the superior performance of LDEDBO over other control methods for optimizing the two objective functions, namely minimum active power dissipation and voltage fluctuation. The discovery strongly supports the potential use of LDEDBO for addressing the reconstruction challenge in minor distribution grids. Figure 5 illustrates the voltage restoration outcomes at three randomly selected moments, revealing a smoother overall contour of the voltage curve reconstructed by the LDEDBO compared to other algorithms. Furthermore, Fig. 6 showcases the convergence behavior of the different algorithms during the reconstruction process at these three moments. At 05:00, the LDEDBO exhibits a slightly slower convergence speed than the PSO algorithm. However, when considering the convergence curves across all three moments, the PSO algorithm demonstrates unstable convergence speed and fails to effectively find the optimal solution. In contrast, the LDEDBO consistently achieves convergence within 15 iterations, highlighting its exceptional accuracy and stability.
Table 5.
GA, PSO, DBO and LDEDBO algorithms time reconstruction results of IEEE-33 small-scale node bus.
| Method | Moments | Power dissipation (kW) | Minimum node voltage (p.u) | Open switches |
|---|---|---|---|---|
| 05:00 | 255.5795 | 0.9408 | 33, 34, 35, 36, 37 | |
| Before | 10:00 | 481.5029 | 0.8621 | 33, 34, 35, 36, 37 |
| 20:00 | 573.9049 | 0.8385 | 33, 34, 35, 36, 37 | |
| 05:00 | 139.2407 | 0.9705 | 33, 13, 9, 32, 28 | |
| GA | 10:00 | 259.6344 | 0.9141 | 33, 14, 9, 32, 28 |
| 20:00 | 338.8216 | 0.8979 | 33, 9, 7, 36, 28 | |
| 05:00 | 136.6211 | 0.9686 | 33, 14, 9, 32, 28 | |
| PSO | 10:00 | 275.378 | 0.9071 | 33, 34, 11, 32, 28 |
| 20:00 | 332.3553 | 0.9040 | 33, 14, 9, 32, 28 | |
| 05:00 | 146.6389 | 0.9470 | 33, 34, 11, 36, 28 | |
| DBO | 10:00 | 250.1139 | 0.9142 | 33, 14, 9, 32, 28 |
| 20:00 | 378.2845 | 0.8943 | 7, 9, 35, 36, 28 | |
| 05:00 | 134.7648 | 0.9686 | 33, 14, 9, 32, 28 | |
| LDEDBO | 10:00 | 247.8874 | 0.9152 | 7, 14, 10, 32, 28 |
| 20:00 | 318.453 | 0.9040 | 7, 14, 9, 32, 28 |
Fig. 5.
Node voltage distribution in case 1: (a) At 05:00; (b) At 10:00; (c) At 20:00.
Fig. 6.
Convergence curve in case 1: (a) At 05:00; (b) At 10:00; (c) At 20:00.
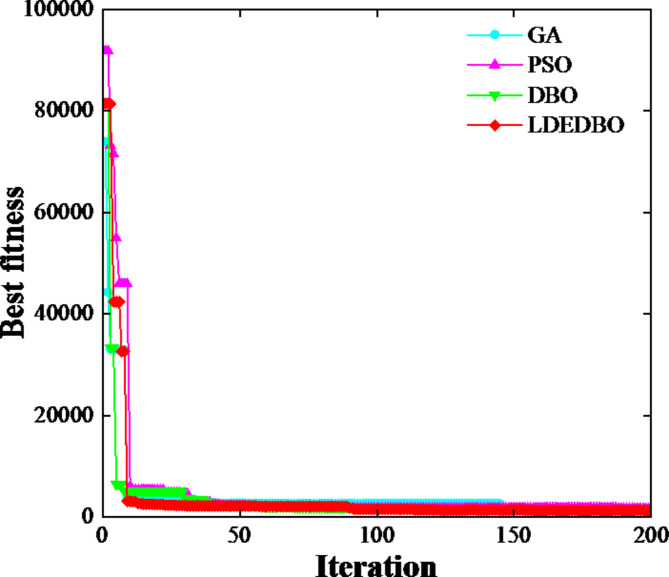
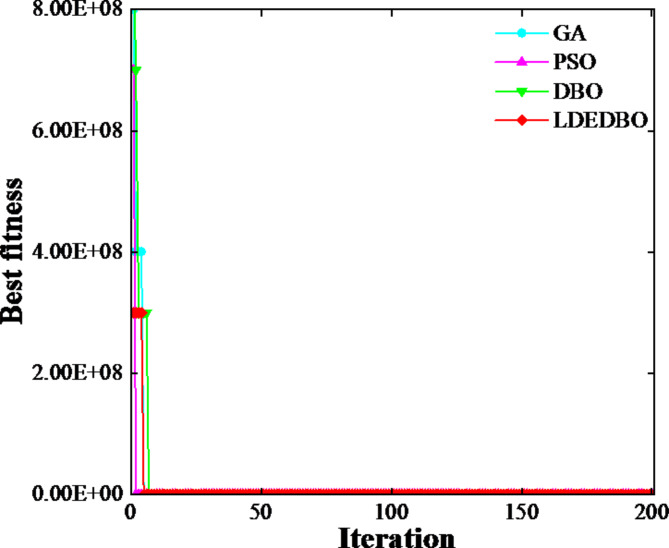
Following that, this article investigates the dynamic reconfiguration problem of small-scale distribution networks and designs the reconfiguration period according to the trend of daily load curve. The number of iterations for each algorithm is fixed at 200. The convergence plots of different algorithms are compared in Fig. 7. The LDEDBO achieves a superior switching combination solution compared to other algorithms at the 28th step.
Fig. 7.
The convergence curve for LDEDBO in comparison to alternative algorithms.
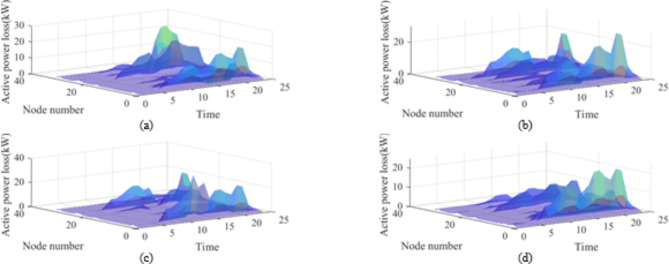
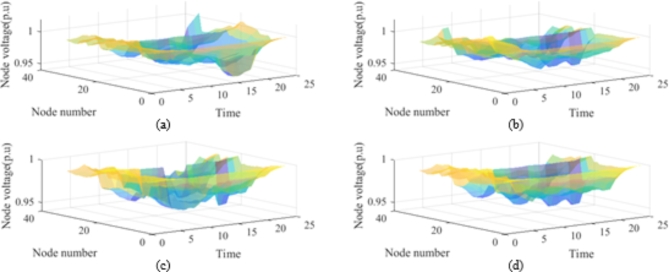
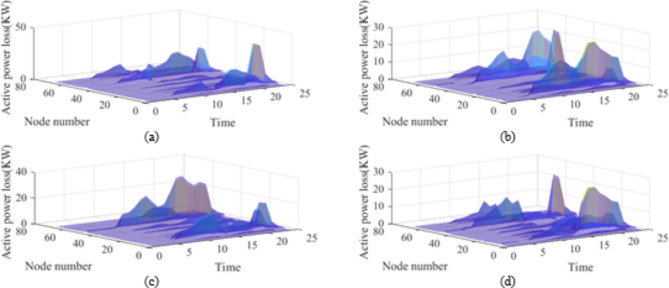
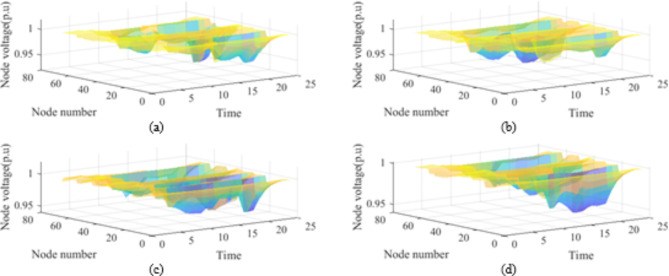
Table 6 presents the experimental data recorded under this set of switching combinations. The results indicate a significant decrease in active power dissipation from 1950.4 kW to 1385.9 kW, representing a decrease of 28.94%. In comparison, the reductions achieved by GA, PSO, and DBO algorithms are 19.82%, 15.79%, and 20.53% respectively. Additionally, the minimum node voltage stands at 0.9447 p.u, surpassing the previous value of 0.9273 p.u. Figure 8 illustrates the active power loss curves under different reconstruction algorithms. It clearly shows that after the LDEDBO reconstruction, the active power dissipation at each node in the IEEE33 node bus is less than 20 kW per hour. Figure 9 compares the overall voltage curves under various reconstruction algorithms. It shows that after the LDEDBO reconstruction, the node voltages fluctuate more smoothly over 24 h. This indicates the stability and optimization ability of the LDEDBO.
Table 6.
GA, PSO, DBO and LDEDBO multi-period dynamic reconfiguration analyses of IEEE-33 small-scale node bus.
| Method | Power Dissipation(kW) | Minimum node voltage (p.u) | Time period | Open switches |
|---|---|---|---|---|
| Before | 1950.4 | 0.9273 | Total period | 33, 34, 35, 36, 37 |
| GA | 1563.9 | 0.9416 | 00:00–04:00 | 6, 12, 10, 16, 28 |
| 05:00–11:00 | 6, 14, 8, 16, 26 | |||
| 12:00–14:00 | 3, 13, 10, 16, 28 | |||
| 15:00–19:00 | 6, 13, 11, 15, 26 | |||
| 20:00–24:00 | 7, 13, 11, 16, 27 | |||
| PSO | 1684.5 | 0.9311 | 00:00–04:00 | 18, 12, 11, 29, 28 |
| 05:00–11:00 | 20, 13, 10, 15, 28 | |||
| 12:00–14:00 | 33, 13, 10, 30, 37 | |||
| 15:00–19:00 | 33, 13, 11, 31, 28 | |||
| 20:00–24:00 | 33, 13, 10, 31, 28 | |||
| DBO | 1550.0 | 0.9439 | 00:00–04:00 | 7, 34, 9, 29, 25 |
| 05:00–11:00 | 7, 13, 11, 31, 37 | |||
| 12:00–14:00 | 7, 13, 10, 32, 26 | |||
| 15:00–19:00 | 7, 34, 10, 36, 28 | |||
| 20:00–24:00 | 33, 14, 7, 32, 37 | |||
| LDEDBO | 1385.9 | 0.9447 | 00:00–04:00 | 7, 13, 8, 16, 22 |
| 05:00–11:00 | 7, 13, 9, 16, 37 | |||
| 12:00–14:00 | 7, 14, 9, 16, 37 | |||
| 15:00–19:00 | 7, 12, 35, 16, 37 | |||
| 20:00–24:00 | 7, 14, 11, 16, 37 |
Fig. 8.
Active power dissipation of IEEE-33 small-scale node bus in 24 h: (a) GA; (b) PSO; (c) DBO; (d) LDEDBO.
Fig. 9.
Voltage fluctuation of IEEE-33 small-scale node bus in 24 h: (a) GA; (b) PSO; (c) DBO; (d) LDEDBO.
Simulation and analysis of case 2: IEEE-69 node bus
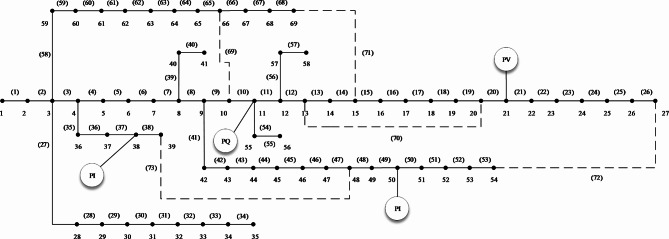
The structure of the IEEE-69 bus medium-scale power grid includes 73 branches, 69 nodes, and 68 isolating switches, 5 interconnection switches, and 5 primary loops. The initial reference capacity of the network is 10 MVA, with a standard load of 3802 kW + j2694.6 kVar, and a reference voltage of 12.66 kV. In the experiment, the installation positions of wind energy sources, photovoltaic sources, and gas turbines are shown in Fig. 10, with specific parameters detailed in Table 7. Real-time load data at 05:00, 10:00, and 17:00 are randomly selected from the daily load curve for reconstruction. Each algorithm is set to undergo 100 iterations.
Fig. 10.
Installation position of the DG in the IEEE-69 medium-scale node bus.
Table 7.
The characteristics of various DG categories in the IEEE-69 medium-scale node bus.
| DGs type | Node | Parameters |
|---|---|---|
| PQ | 11 |
|
| PV | 21 |
|
| PI | 38 |
|
| PI | 50 |
|
The reconstruction results are presented in Table 8, further validating the feasibility of the LDEDBO in the reconstruction of medium-scale distribution networks. In Fig. 11, the overall voltage profile after reconstruction using the LDEDBO appears smoother compared to other algorithms, meeting the stability requirements of the power grid operation. In Fig. 12, the LDEDBO converges to the optimal value within 10 iterations in all three scenarios, demonstrating the exceptional optimization performance and rapid convergence of the LDEDBO in addressing medium-scale distribution network reconstruction problems.
Table 8.
GA, PSO, DBO and LDEDBO algorithms time reconstruction results of IEEE-69 medium-scale node bus.
| Method | Moments | Power dissipation (kW) | Minimum Node voltage (p.u) | Open switches |
|---|---|---|---|---|
| Before | 05:00 | 247.8767 | 0.9074 | 69, 70, 71, 72, 73 |
| 10:00 | 654.0593 | 0.8569 | 69, 70, 71, 72, 73 | |
| 17:00 | 832.9785 | 0.8403 | 69, 70, 71, 72, 73 | |
| GA | 05:00 | 125.4677 | 0.9313 | 10, 70, 71, 25, 47 |
| 10:00 | 301.4934 | 0.9110 | 10, 70, 71, 72, 47 | |
| 17:00 | 373.1925 | 0.9051 | 69, 70, 12, 72, 47 | |
| PSO | 05:00 | 122.0973 | 0.9313 | 69, 70, 12, 25, 47 |
| 10:00 | 328.6242 | 0.9110 | 69, 70, 71, 72, 47 | |
| 17:00 | 373.4850 | 0.9251 | 69, 70, 11, 72, 47 | |
| DBO | 05:00 | 120.5803 | 0.9297 | 10, 14, 11, 72, 47 |
| 10:00 | 295.5287 | 0.9110 | 10, 70, 12, 72, 47 | |
| 17:00 | 343.5375 | 0.9052 | 100, 14, 11, 72, 47 | |
| LDEDBO | 05:00 | 101.3712 | 0.9394 | 69, 14, 11, 50, 47 |
| 10:00 | 236.5193 | 0.9293 | 10, 13, 11, 50, 47 | |
| 17:00 | 307.4457 | 0.9052 | 69, 13, 11, 50, 47 |
Fig. 11.
Node voltage distribution in case 2: (a) At 05:00; (b) At 10:00; (c) At 17:00.
Fig. 12.
Convergence curve in case 2: (a) At 05:00; (b) At 10:00; (c) At 17:00.
After confirming the effectiveness of the LDEDBO in the reconstruction challenge of medium-scale power grids, the LDEDBO was utilized for the dynamic reconstruction of the IEEE-69 medium-scale node bus. All algorithm parameters remained constant, with the iteration count fixed at 200. Figure 13 presents a comparison of the convergence patterns of the various algorithms. The LDEDBO achieved the optimal solution at the 32nd iteration.
Fig. 13.
Comparison of convergence curve of LDEDBO with other algorithms.
Table 9 records the reconstruction results of each algorithm under the optimal network switch combination. The power dissipation after reconstruction by the LDEDBO decreased from 2498.7 kW before reconstruction to 1588.0 kW, a reduction of 36.45%, which is significantly higher than the reductions achieved by the GA, PSO, and DBO algorithms, which were 30.52%, 24.00%, and 33.43%, respectively. Figure 14 shows the power dissipation curves under the reconstruction of each algorithm, and after reconstruction by the LDEDBO, the power dissipation curve of each time period in the IEEE-69 node bus is notably reduced compared to the other algorithms. Following the reconstruction by the LDEDBO algorithm, the minimum node voltage increased from 0.9224 p.u to 0.9481 p.u, as shown in Fig. 15, which presents the overall voltage curves under the reconstruction of each algorithm. The voltage profiles of individual nodes after reconstruction through the LDEDBO approach the standard value of 1 within 24 h. This outcome substantiates the effectiveness of the introduced LDEDBO approach in tackling the dynamic reconstruction challenge of medium-scale distribution networks under time-varying loads.
Table 9.
GA, PSO, DBO and LDEDBO multi-period dynamic reconfiguration analyses of IEEE-69 medium-scale node bus.
| Method | Power dissipation (kW) | Minimum node voltage (p.u) | Time period | Open switches |
|---|---|---|---|---|
| Before | 2498.7 | 0.9224 | Total period | 69, 70, 71, 72, 73 |
| GA | 1736.0 | 0.9213 | 00:00–04:00 | 69, 70, 71, 53, 73 |
| 05:00–11:00 | 10, 70, 14, 53, 73 | |||
| 12:00–14:00 | 69, 13, 11, 72, 47 | |||
| 15:00–19:00 | 69, 70, 71, 72, 47 | |||
| 20:00–24:00 | 69, 70, 71, 72, 38 | |||
| PSO | 1899.1 | 0.9224 | 00:00–04:00 | 69, 70, 71, 47, 38 |
| 05:00–11:00 | 69, 70, 12, 72, 73 | |||
| 12:00–14:00 | 69, 70, 14, 53, 73 | |||
| 15:00–19:00 | 69, 70, 12, 72, 38 | |||
| 20:00–24:00 | 69, 70, 71, 72, 46 | |||
| DBO | 1663.5 | 0.9465 | 00:00–04:00 | 69, 70, 68, 26, 47 |
| 05:00–11:00 | 65, 70, 71, 26, 45 | |||
| 12:00–14:00 | 65, 70, 68, 26, 47 | |||
| 15:00–19:00 | 69, 70, 13, 25, 47 | |||
| 20:00–24:00 | 65, 70, 68, 26, 46 | |||
| LDEDBO | 1588.0 | 0.9481 | 00:00–04:00 | 69, 70, 71, 72, 73 |
| 05:00–11:00 | 69, 70, 14, 53, 46 | |||
| 12:00–14:00 | 10, 70, 71, 72, 47 | |||
| 15:00–19:00 | 69, 70, 71, 49, 38 | |||
| 20:00–24:00 | 69, 70, 71, 72, 46 |
Fig. 14.
Active power dissipation of IEEE-69 medium-scale node bus in 24 h: (a) GA; (b) PSO; (c) DBO; (d) LDEDBO.
Fig. 15.
Voltage fluctuation of IEEE-69 medium-scale node bus in 24 h: (a) GA; (b) PSO; (c) DBO; (d) LDEDBO.
Conclusion
The present study proposes a dynamic reconfiguration model for distribution networks that integrates an improved meta-heuristic algorithm. First, the DBO algorithm is enhanced using Chebyshev chaotic mapping, Levy flight, and differential evolution algorithms to develop the intelligent algorithm LDEDBO. Next, the feasibility of the LDEDBO algorithm in addressing the reconfiguration problem of distribution networks is validated under specific equivalent load conditions. Finally, for distribution networks with load fluctuations, reconfiguration time periods are determined based on the load curve trends, and the LDEDBO algorithm is employed to obtain the optimal reconfiguration schemes for each time period, ensuring minimal active power losses and minimal voltage deviations.
The experimental results are as follows: in the IEEE-33 small node bus, network active power losses are reduced by 28.94%, while the node voltage increases from 0.9273 p.u to 0.9447 p.u; in the IEEE-69 medium node bus, network active power losses are reduced by 36.45%, with the node voltage rising from 0.9224 p.u to 0.9481 p.u.
Based on the established model, future research needs to delve deeper into the following aspects: (1) Considering the impact of time-varying DG on the dynamic reconfiguration model of distribution networks based on time-varying loads; (2) Exploring more reasonable methods for dividing reconfiguration time periods; (3) Reducing the time complexity of the algorithm while enhancing its convergence accuracy, stability, and robustness.
Electronic Supplementary Material
Below is the link to the electronic supplementary material.
Author contributions
Conceptualization, Y.W., L.W. and Z.W.; Methodology, Y.W. and L.W.; Software, Y.W. and L.W.; Validation, L.W., J.L. and Y.W.; Formal analysis, L.W., J.L. and Y.W.; Investigation, Y.W.; Data curation, L.W.; Writing—original draft, Y.W., and L.W.; Writing—review & editing, Y.W., L.W., Y.A. and X.Z.; Visualization, Y.W.; Supervision, L.W.; Funding acquisition, Y.W. and D.F.
Data availability
All data included in this study are available upon request by contact with the corresponding author.
Declarations
Competing interests
The authors declare no competing interests.
Footnotes
Publisher’s note
Springer Nature remains neutral with regard to jurisdictional claims in published maps and institutional affiliations.
References
- 1.Wiatros-Motyka, M. Global Power Review EMBER. https://ember-climate.org/insights/research/global-electricity-review-2023/ (2023).
- 2.Bui, V. H. & Su, W. Real-time operation of distribution network: A deep reinforcement learning-based reconfiguration approach. Sustain. Energy Technol. Assess.50, 101841 (2022). [Google Scholar]
- 3.Ahmadi, H. & Martí, J. R. Distribution system optimization based on a linear power-flow formulation. IEEE Trans. Power Deliv. 30, 25–33 (2015). [Google Scholar]
- 4.Azad-Farsani, E., Sardou, I. G. & Abedini, S. Distribution Network Reconfiguration based on LMP at DG connected busses using game theory and self-adaptive FWA. Energy215, 119146 (2021). [Google Scholar]
- 5.Chandramohan, S., Atturulu, N., Devi, R. P. K. & Venkatesh, B. Operating cost minimization of a radial distribution system in a deregulated electricity market through reconfiguration using NSGA method. Int. J. Electr. Power Energy Syst.32, 126–132 (2010). [Google Scholar]
- 6.Gözel, T. & Hocaoglu, M. H. An analytical method for the sizing and siting of distributed generators in radial systems. Electr. Power Syst. Res.79, 912–918 (2009). [Google Scholar]
- 7.Gupta, N., Swarnkar, A. & Niazi, K. R. Distribution network reconfiguration for power quality and reliability improvement using Genetic Algorithms. Int. J. Electr. Power Energy Syst.54, 664–671 (2014). [Google Scholar]
- 8.Hamour, H. et al. and Distribution network reconfiguration using grasshopper optimization algorithm for power loss minimization. In International Conference on Smart Energy Systems and Technologies (SEST). (2018).
- 9.Hui, W. et al. In The 27th Chinese Control and Decision Conference 1243–1247 (CCDC, 2015).
- 10.Jafar-Nowdeh, A. et al. Meta-heuristic matrix moth–flame algorithm for optimal reconfiguration of distribution networks and placement of solar and wind renewable sources considering reliability. Environ. Technol. Innov.20, 101118 (2020). [Google Scholar]
- 11.Young-Jae, J., Jae-Chul, K., Jin, O. K., Joong-Rin, S. & Lee, K. Y. An efficient simulated annealing algorithm for network reconfiguration in large-scale distribution systems. IEEE Trans. Power Deliv. 17, 1070–1078 (2002). [Google Scholar]
- 12.Kovački, N. V., Vidović, P. M. & Sarić, A. T. Scalable algorithm for the dynamic reconfiguration of the distribution network using the Lagrange relaxation approach. Int. J. Electr. Power Energy Syst.94, 188–202 (2018). [Google Scholar]
- 13.Xu, T. et al. Multi-objective robust optimization of active distribution networks considering uncertainties of photovoltaic. Int. J. Electr. Power Energy Syst.133, 107197 (2021). [Google Scholar]
- 14.Pan, J. S., Wang, H. J., Nguyen, T. T., Zou, F. M. & Chu, S. C. Dynamic reconfiguration of distribution network based on dynamic optimal period division and multi-group flight slime mould algorithm. Electr. Power Syst. Res.208, 107925 (2022). [Google Scholar]
- 15.Wang, J., Wang, W., Yuan, Z., Wang, H. & Wu, J. A. Chaos disturbed beetle antennae search algorithm for a multiobjective distribution network reconfiguration considering the variation of load and DG. IEEE Access.8, 97392–97407 (2020). [Google Scholar]
- 16.Li, L. L., Xiong, J. L., Tseng, M. L., Yan, Z. & Lim, M. K. Using multi-objective sparrow search algorithm to establish active distribution network dynamic reconfiguration integrated optimization. Expert Syst. Appl.193, 116445 (2022). [Google Scholar]
- 17.Senapati, M. K. & Khamari, R. C. Improving power quality with intelligent control. J. Electr. Syst.20 (10s), pp3118–3130 (2024). [Google Scholar]
- 18.Senapati, M. K., Pradhan, C., Samantaray, S. R. & Nayak, P. K. Improved power management control strategy for renewable energy-based DC micro-grid with energy storage integration. IET Gener. Transm. Distrib.13, 838–849 (2019).
- 19.Senapati, M. K., Pradhan, C. & Calay, R. K. A computational intelligence based maximum power point tracking for photovoltaic power generation system with small-signal analysis. Optimal Control Appl. Methods. 44, 617–636 (2023). [Google Scholar]
- 20.Senapati, M. K. et al. Advancing electric vehicle charging ecosystems with intelligent control of DC microgrid stability. IEEE Trans. Ind. Appl.60, 7264–7278 (2024). [Google Scholar]
- 21.Wang, C., Gu, J., Sun, W., Mou, H. & Naiyuan, X. In 2015 11th International Conference on Natural Computation (ICNC) 1285–1289 (2015).
- 22.Wu, Y., Liu, J., Wang, L., An, Y. & Zhang, X. Distribution network reconfiguration using chaotic particle swarm chicken swarm fusion optimization algorithm. Energies24, 3251–3259 (2024). [Google Scholar]
- 23.Rao, R. S., Narasimham, S. V. L., Raju, M. R. & Rao, A. S. Optimal network reconfiguration of large-scale distribution system using harmony search algorithm. IEEE Trans. Power Syst.26, 1080–1088 (2011). [Google Scholar]
- 24.Hamour, H., Kamel, S., Abdel-mawgoud, H., Korashy, A. & Jurado, F. In 2018 International Conference on Smart Energy Systems and Technologies (SEST) 1–5 (2018).
- 25.Mirjalili, S., Mirjalili, S. M. & Lewis, A. Grey wolf optimizer. Adv. Eng. Softw.69, 46–61 (2014).
- 26.Mirjalili, S. Moth-flame optimization algorithm: A novel nature-inspired heuristic paradigm. Knowl. Based Syst.89, 228–249 (2015). [Google Scholar]
- 27.Mirjalili, S. & Lewis, A. The whale optimization algorithm. Adv. Eng. Softw.95, 51–67 (2016). [Google Scholar]
- 28.Shaheen, A. M., El-Sehiemy, R. A. & Farrag, S. M. In 2018 International Conference on Innovative Trends in Computer Engineering (ITCE) 344–349 (2018).
- 29.Xue, J. & Shen, B. Dung beetle optimizer: a new meta-heuristic algorithm for global optimization. J. Supercomput. 79, 7305–7336 (2023). [Google Scholar]
- 30.Sultana, B., Mustafa, M. W., Sultana, U. & Bhatti, A. R. Review on reliability improvement and power loss reduction in distribution system via network reconfiguration. Renew. Sustain. Energy Rev.66, 297–310 (2016). [Google Scholar]
- 31.Nguyen, T. T., Nguyen, T. T., Truong, A. V., Nguyen, Q. T. & Phung, T. A. Multi-objective electric distribution network reconfiguration solution using runner-root algorithm. Appl. Soft Comput.52, 93–108 (2017). [Google Scholar]
- 32.Algafri, M., Alghazi, A., Almoghathawi, Y., Saleh, H. & Al-Shareef, K. Smart City Charging Station allocation for electric vehicles using analytic hierarchy process and multiobjective goal-programming. Appl. Energy. 372, 123775 (2024). [Google Scholar]
- 33.Senapati, M. K. & Sarangi, S. Secured zone 3 protection during load encroachment using synchrophasor data. Sustainable Energy Grids Networks. 27, 100522 (2021). [Google Scholar]
- 34.Slowik, A. & Kwasnicka, H. Evolutionary algorithms and their applications to engineering problems. Neural Comput. Appl.32, 12363–12379 (2020). [Google Scholar]
Associated Data
This section collects any data citations, data availability statements, or supplementary materials included in this article.
Supplementary Materials
Data Availability Statement
All data included in this study are available upon request by contact with the corresponding author.


