Abstract
Breast cancer is a leading cause of cancer-related deaths among women globally. It is imperative to explore novel biomarkers to predict breast cancer treatment response as well as progression. Here, we collected six breast cancer samples and paired normal tissues for high-throughput sequencing. By differential expression analysis, we found 1687 DEGs and identified the top 10 hub genes, including TOP2A, CDK1, BUB1B, KIF11, CCNA2, BUB1, CCNB1, KIF20A, DLGAP5 and CDC20. Univariate and multivariate Cox analyses on the METABRIC database and GSE96058 dataset demonstrated that KIF20A was an independent prognostic predictor for overall survival. KIF20A was positively correlated with cell cycle phases, including the cell cycle process, cycle G2 M phase transition and cell cycle DNA replication initiation. Single-cell analyses revealed that KIF20A was enriched in fibroblasts and endothelial within breast cancer stroma. Meanwhile, multidrug resistance (MDR) genes ABCB1, ABCC1 and ABCG2 were co-expressed with KIF20A in fibroblasts and endothelial cells within the stroma. MTABRIC database confirmed that high expression of KIF20A was positively correlated with treatment efficacy in patients with breast cancer. In conclusion, KIF20A could be served as a predictive biomarker for breast cancer prognosis and treatment outcomes. KIF20A may play a significant role by regulating cell cycle progression and modulating stromal progression in breast cancer. Our findings provided novel molecular insights that can guide personalized treatment strategies in breast cancer.
Supplementary Information
The online version contains supplementary material available at 10.1038/s41598-024-83362-y.
Keywords: breast cancer, KIF20A, tumor microenvironment, prognosis, treatment resistance
Subject terms: Cancer, Cell biology, Biomarkers, Oncology
Introduction
Breast cancer is the most common diagnosed cancer among women. In 2024, there will be 310,720 new cases of breast cancer in the United States, accounting for 32% of all female cancers, and 42,250 deaths from breast cancer, accounting for 15% of all cancer deaths1. Breast cancer has become a major burden of public health globally2. Although the combination of systematic treatment (chemotherapy, endocrine therapy and target therapy ) and local treatment (surgery and radiotherapy) were effective, treatment failure such as drug resistance still needs to be addressed3.
Breast cancer is a heterogeneous disease characterized by various gene mutations, genomic instabilities, and tumor microenvironment (TME)4. The tumor microenvironment consists of non-cancerous components within the tumor that produce and secrete molecules interacting with cancer cells, contributing to the initiation, progression, metastasis, and therapeutic resistance of cancer5–7. These hallmarks of breast cancer are closely related to different responses to different treatment strategies8. Current treatment strategies for breast cancer mainly depend on clinicopathological characteristics and molecular classification9,10. However, even if patients with the same tumor grade and the same molecular subtype, treatment response may be different, leading to different clinical outcomes11,12. Thus, the current breast tumor staging system and molecular classification system are no longer adequate to explain the heterogeneity of breast tumors. Novel molecular markers are urgently needed to better predict the heterogeneity and prognosis of breast cancer. The application of single-cell analysis techniques is conducive to precise diagnosis and treatment of breast cancer13,14. Deep genetic analysis, such as next-generation sequencing (NGS) can provide new insights into breast cancer heterogeneity, which is widely used in diagnosis, treatment and prognosis prediction for breast cancer15,16.
KIF20A, which is part of the kinesin protein family, participates in the transportation of chromosomes during the mitotic process and is essential for the proper execution of cellular division. KIF20A is overexpressed in a variety of malignant tumors and is associated with poor patient prognosis17–20. For instance, KIF20A promotes progression to castration-resistant prostate cancer through autocrine activation of the androgen receptor18. In hepatocellular carcinoma, KIF20A expression is induced by Gli2 via the FoxM1-MMB complex and is associated with poor outcomes21. In previous research, KIF20A has been implicated in the regulation of cell growth and the cell cycle. Inhibiting KIF20A expression has been shown to curtail the proliferation and invasion of breast cancer cells22. However, the biological function and relevant mechanism of KIF20A in breast cancer remain elusive.
In the present study, high-throughput sequencing was performed based on breast cancer tissues and paired normal tissues. Differentially expressed genes (DEGs) and hub genes were identified and functional enrichment analyses were performed. Validation through public databases revealed the correlation between KIF20A expression and breast cancer prognosis. Subsequently, we explored the correlation between KIF20A and treatment efficacy and investigated the potential mechanism. Our study will provide the potential molecules for breast cancer diagnosis and treatment.
Materials and methods
Samples and datasets
Six breast cancer tissues and paired normal tissues were obtained from patients underwent mastectomy in the First Affiliated Hospital of Jinan University. None of the patients had received radiotherapy or chemotherapy before surgery (Table S1). The Ethics Association of the First Affiliated Hospital of Jinan University approved all experiments. All 6 patients included in the study signed informed consent forms. Six breast cancer tissues and paired normal tissues were collected by specialized breast surgeons and were rapidly stored in liquid nitrogen immediately after excision. The high-throughput whole transcriptome sequencing results of these 6 pairs of tissues were performed and analyzed by Guangzhou IGE Biotechnology Co, Ltd. The transcriptome data and clinical data of breast cancer patients of the validation set were obtained from the Molecular Taxonomy of Breast Cancer International Consortium (METABRIC) database (1980 samples) and GSE96058 in the Gene Expression Omnibus (GEO) database (3409 samples). After excluding cases without prognostic information, 1980 patients in the METABRIC database and 3409 patients in GSE96058 were used as validation sets for further research. Single-cell RNA sequencing (scRNA) data of 18 primary breast cancer patients was retrieved from GSE159284 dateset. All methods were performed in accordance with the relevant guidelines and regulations.
Different expression genes identification
The counts of expression profile data were estimated and the “DEseq2” R package was utilized to perform differential analysis of the expression profiles of 6 pairs of breast cancer tissues. The R package “DESeq2” normalizes the counts data using size factors and performs log transformation through methods such as regularized log (rlog) or variance stabilizing transformation (vst). The filtering criteria are p < 0.05 and |log2 foldchange (FC)|>2.
Functional enrichment analysis
The gene ontology (GO) analyses and Kyoto Encyclopedia of Genes and Genomes (KEGG) enrichment analyses of DEGs were performed by “clusterProfiler”, “org. Hs.eg.db”, “enrichpolt” and “ggplot2” in R package23. The GO terms and KEGG pathways with the enriched gene count ≥ 2 and the significance threshold p < 0.05 were considered significant24.
Construction and analysis of protein-protein interaction (PPI) network and ceRNA network
The STRING database (http://string-db.org) was utilized to construct a protein-protein interaction (PPI) network to investigate the interplay among DEGs. Networks with the highest confidence score > 0.9 were retained. The network visualization was achieved by Cytoscape software. The cytoHubba in Cytoscape was used to find the Hub genes based on the degree calculation method. The Online website (networkanalyst.ca/ and miRTarBase) and Cytoscape software were used to predict miRNAs and TFs (Transcription factors) related to hub genes25.
Validation of survival-related independent signals
In order to further verify the correlation between hub genes and prognosis, we performed univariate and multivariate Cox analyses using METABRIC database and GSE96058 data sets by R software.
Single cell analysis
We performed single-cell analysis on the GSE159284 data set using the “Seurat” and “dplyr” package in R software. Cells with less than 200 gene profiles and cells with more than 20% mitochondrial gene expression were excluded according to previous literature26,27. Principal component analyses (PCA) of a maximum of 2000 variable genes were performed to visualize the transcriptional variability across the entire scRNA-seq dataset. T-distributed stochastic neighbor embedding (t-SNE) was used to further reduce the dimensionality of the principal components.
Gene set variation analysis (GSVA) and drug repurposing by molecular docking analysis
The gene list of cell cycle processes is obtained from gene ontology. Under default parameters, the provided package (R environment) was used to calculate functional enrichment scores for each sample. The correlation between KIF20A and cell cycle processes was determined by Pearson correlation analysis. Ten hub genes were used as drug target proteins (receptors) to explore KIF20A-guided drug candidates through molecular docking analyses. Subsequently, target molecules related to hub genes were screened through the GSCALite database.
Cell culture
Human breast cancer cell lines ( MDA-MB-231, MDA-MB-468) and normal breast epithelial cell (MCF-10A) were purchased from Pricella (Guangzhou, China). MDA-MB-231 and MDA-MB-468 cells were cultured in DMEM medium (Gibco) containing 10% fetal bovine serum (FBS) and 1% penicillin-streptomycin (Gibco). MCF-10A cultured in a special culture medium purchased by Pricella. All cells were cultured at 37 °C with 5% CO2. These cells were free of mycoplasma contamination.
Quantitative real-time PCR (qRT-PCR)
RNAs were extracted using TRIzol and cDNAs were generated using a cDNA synthesis kit (Vazyme). The SYBR Green PCR kit (MCE) was mixed with specific primers for PCR. The GAPDH gene was used as an internal reference gene for normalization analysis. The comparative CT method was used to calculate the relative expression of target gene. Primer sequences are listed in supplementary Table S2.
Statistical analysis
All gene expression profiles were processed in statistical analysis using R software (version 4.3.1). The statistical analysis of differences between multiple components is accomplished through one-way analysis of variance (ANOVA), which is a form of single-factor contrast analysis. The comparison between the two groups is implemented through paired t-test. P<0.05 was considered statistically significant.
Results
Identification and functional analysis of differentially expressed genes
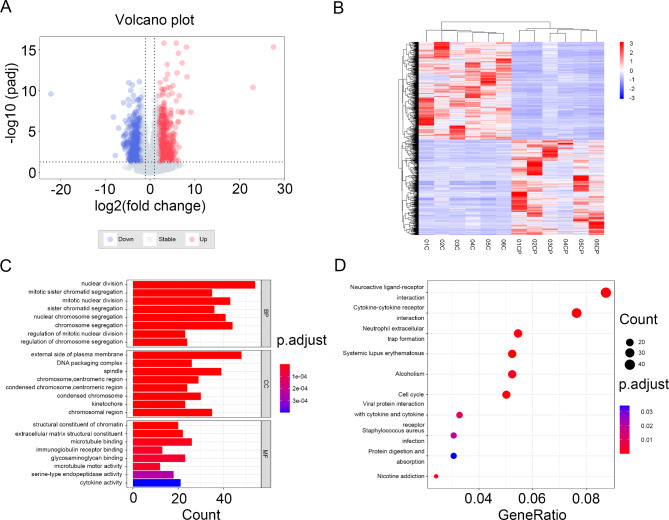
To investigate differently expressed genes (DEGs) between breast cancer and normal tissues, 6 pairs of tissues were obtained for high-throughput whole transcriptome sequencing analysis. The volcano diagram clearly shows the differential genes in cancer and normal tissues (Fig. 1A). According to the screening criteria, 1687 DEGs were identified, including 857 up-regulated genes and 830 down-regulated genes. Hierarchical clustering analysis of DEGs further revealed differential gene expression (Fig. 1B).
Fig. 1.
The screen of different expression genes and functional enrichment analysis of DEGs. (A) Volcano of DEGs, where blue dots indicate downregulated DEGs and red dots indicate upregulated DEGs. (B) Heatmap of DEGs, where blue indicates downregulated DEGs and red indicates upregulated DEGs. (C) Gene ontology terms of top8. (D) KEGG pathway.
In order to explore the potential functions of the DEGs, we performed functional enrichment analysis on all DEGs. The top 8 enriched terms of Gene Ontology (GO) analysis are shown in Fig. 1C. We found that differentially expressed genes (DEGs) were significantly concentrated in the following biological processes (BP): nuclear division, mitotic sister chromatid segregation, and mitotic nuclear division. According to cellular components (CC) analyses, the DEGs exhibited substantial enrichment at the external side of the plasma membrane, within the DNA packaging complex, and associated with the spindle apparatus. In the category of molecular function (MF), the DEGs exhibited pronounced enrichment in functions such as structural constituent of chromatin, extracellular matrix structural constituent, and microtubule binding.
Additionally, the result of the Kyoto Encyclopedia of Genes and Genomes (KEGG) enrichment analyses indicated that the DEGs were involved in “neuroactive ligand-receptor interaction”, “cytokine-cytokine receptor interaction” and “neutrophil extracellular trap formation” (Fig. 1D).
Construction of the PPI network and functional analysis of hub genes
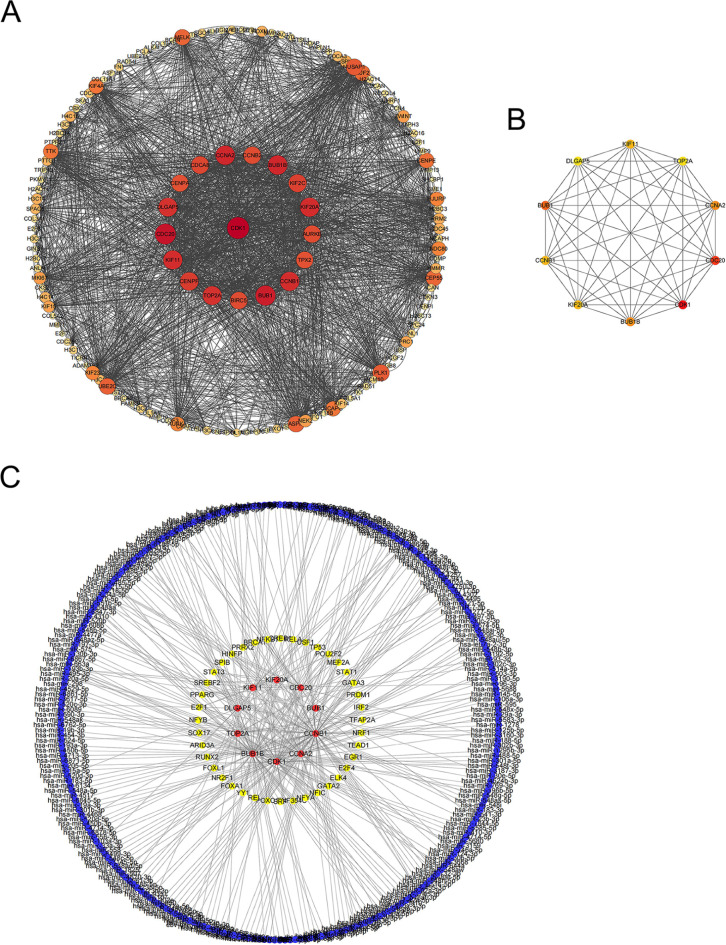
Using the STRING database, we constructed a PPI network of all DEGs and obtained a network including 957 nodes and 1292 edges. We hid dispersed proteins and visualized the PPI network with Cytoscape. Figure 2A shows the correlation of the central PPI network, where the larger and darker the color of each point, the higher its degree values. Next, we used the cytohubba plug-in in Cytoscape software to obtain hub genes. According to the degree algorithm, we got the key 10 hub genes, including TOP2A,CDK1,BUB1B,KIF11, CCNA2,BUB1,CCNB1,KIF20A,DLGAP5, and CDC20 (Fig. 2B). Hub genes were involved in numerous critical signaling pathways, and their dysregulation may lead to the progression of breast cancer (Table 1). The ceRNA regulatory interaction network was constructed, where red represents hub genes, blue represents miRNAs and yellow represents transcription factors (Fig. 2C). The ceRNA regulatory network revealed a potential regulatory network underlying the progression of breast cancer.
Fig. 2.
PPI network analysis of DEGs. (A) PPI network of DEGs, in which the darker the color and the larger the diameter, the higher the degree. (B) Hub genes of DEGs, calculated according to degree. Red represents high degree, yellow represents low degree. (C) CeRNA network of hub genes, red represents hub genes, yellow represents transcription factors, and blue represents miRNA.
Table 1.
The top 10 hub upregulated genes in PPI network.
| Hub gene | Express | Degree | Pathway |
|---|---|---|---|
| CDK1 | Up | 112 | Cell cycle |
| CDC20 | Up | 104 | Cell cycle |
| BUB1 | Up | 100 | Cell cycle |
| BUB1B | Up | 96 | Cell cycle |
| CCNA2 | Up | 96 | Cell cycle |
| KIF11 | Up | 94 | Motor proteins |
| CCNB1 | Up | 94 | FoxO signaling pathway |
| KIF20A | Up | 94 | Motor proteins |
| TOP2A | Up | 92 | Platinum drug resistance |
| DLGAP5 | Up | 92 | blank |
To further investigate the function of key hub genes, we performed functional enrichment analysis on them. We found that hub genes were predominantly enriched in the biological process (BP) categories of sister chromatid segregation, regulation of mitotic sister chromatid segregation, and nuclear chromosome segregation. In the cellular component (CC) category, hub genes were mainly enriched in the spindle, chromosomal region, and spindle pole areas. For molecular function (MF), they were primarily enriched in activities associated with cyclin-dependent protein serine/threonine kinase regulator, microtubule binding, and microtubule motor activity (Figure S1A). In addition, the KEGG enrichment analysis of hub genes demonstrated that hub genes were mainly involved in cell cycle, progesterone-mediated oocyte maturation, and oocyte meiosis (Figure S1B). Taken together, we found that hub genes are closely related to cell division and proliferation.
Survival analysis of hub genes
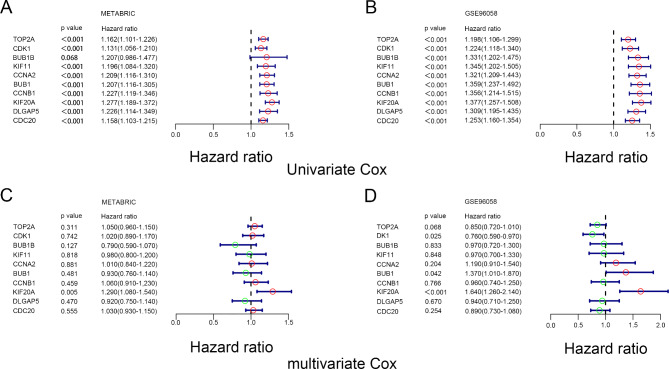
To investigate whether the screened hub genes were related to the survival of breast cancer patients, we performed univariate and multivariate Cox analyses on hub genes in the METABRIC data set and GSE96058 data set, respectively. Univariate Cox analysis shows that all genes with the exception of BUB1B were positively correlated with OS of breast cancer patients in the METABRIC data set. Meanwhile, univariate Cox analysis results in the GSE96058 data set also showed that all hub genes were significantly associated with OS of BC patients (Fig. 3A and B). However, multivariate Cox analysis demonstrated that only KIF20A was an independent prognostic predictor (Fig. 3C and D). Thus, we took KIF20A for further analysis.
Fig. 3.
Univariate COX and multivariate COX analysis of hub genes in MEABRIC data set and GSE96058 data set. (A) Univariate COX analysis of hub genes in METABRIC data set. (B) Univariate COX analysis of hub genes in GSE96058 data set. (C) Multivariate COX Univariate COX analysis of hub genes in METABRIC data set. (D) Multivariate COX Univariate COX analysis of hub genes in GSE96058 data set.
KIF20A as a potential biomarker for breast cancer
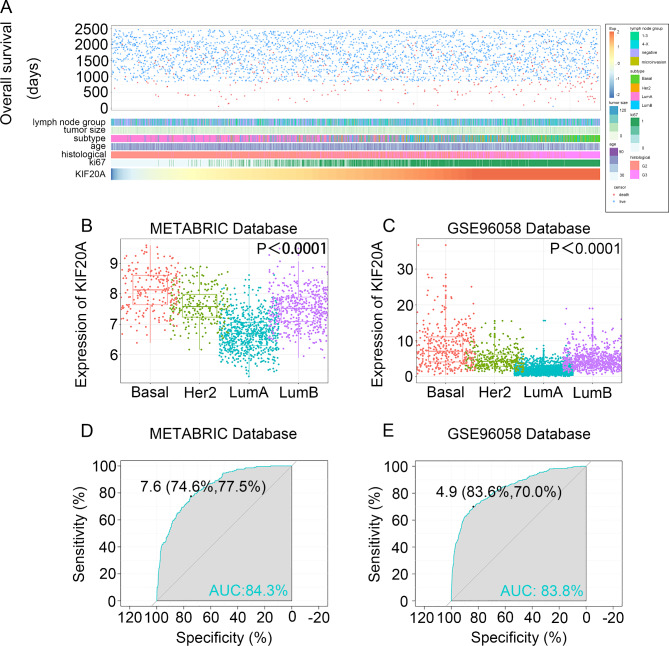
To investigate whether KIF20A could serve as a novel biomarker, the expression of KIF20A in breast cancer tissues was validated based on the Human Protein Atlas in the first place (Figure S2). Then, the correlation between KIF20A with clinicopathological parameters was explored using the GSE96058 dataset. We found that patients with different KIF20A expression levels exhibited different clinical and pathological features (Fig. 4A). Elevated KIF20A expression was correlated with more aggressive features, such as positive lymph nodes, larger tumor size, high histological grade and higher ki67 rates (Figure S3).
Fig. 4.
Relationship between KIF20A and clinical and pathological features. (A) KIF20A and clinical and pathological characteristics map in GES96058 data set. (B) and (C), KIF20A is enriched in triple-negative breast cancer subtypes in the METABRIC dataset and the GSE96058 dataset. P < 0.0001 by one-way ANOVA. (D) and (E), Receiver operating characteristic (ROC) curve showed that KIF20A has high expression specificity in triple-negative breast cancer in METABRIC and GSE96058 datasets. AUC, area under the curve.
Furthermore, we explored the distribution of KIF20A among different molecular subtypes and found that KIF20A level was significantly higher in the basal-like subtype, HER2 positive and Luminal B subtypes compared with Luminal A subtypes in METABRIC and GSE96058 datasets (Fig. 4B and C). Additionally, the expression of KIF20A was examined in the normal cell line MCF-10 A and triple-negative breast cancer cell lines MDA-MB-231 and MDA-MB-468 using qRT-PCR. We found that KIF20A was significantly highly expressed in MDA-MB-231 and MDA-MB-468, further validating the predictive role of KIF20A in triple-negative breast cancer (Figure S4).
Thus, the receptor operating characteristic (ROC) curve was used to evaluate the expression specificity of KIF20A in breast cancer. As was shown in Fig. 4D, the area under the curve (AUC) was 84.3% and 83.8% in the METABRIC dataset and the GSE96058 dataset, respectively (Fig. 4E). An AUC value of the ROC curve exceeding 0.8 indicates very strong predictive power, approaching perfection. These results indicate that KIF20A may serve as a potential biomarker for patients with breast cancer.
KIF20Ais positively related to the cell cycle progression
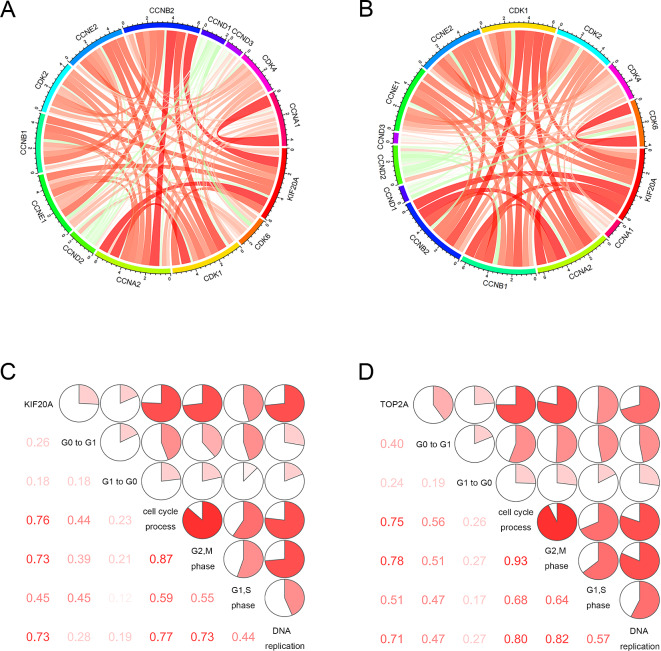
To further identify whether KIF20A was involved in cell cycle progression, the correlation between KIF20A and cell cycle checkpoints was analyzed in the METABRIC and GSE96058 datasets. The results demonstrated that there was a positive correlation between KIF20A and cell cycle checkpoints, indicating that KIF20A may be positively related to tumor cell proliferation (Fig. 5A and B). Moreover, we selected six key phases in the cell cycle as markers of breast cancer proliferation, including G0 to G1 transition, G1 to G0 transition, cell cycle process, cycle G2 M phase transition, cycle G1 S phase transition, and cell cycle DNA replication initiation and then investigated which phases of cell cycle that KIF20A may be involved in. The results showed that KIF20A was positively correlated with breast cancer proliferation, especially with the cell cycle process, cycle G2 M phase transition and cell cycle DNA replication initiation (Fig. 5C and D). These results suggest that KIF20A is involved in breast cancer proliferation and may act as a tumor-promoting biomarker.
Fig. 5.
Correlation between KIF20A expression and cell cycle in METABRI and GSE96058 data sets. (A) and (B), Pearson correlation between KIF20A and cell cycle checkpoints. The width and color of the band represented the R-value. (C) and (D), KIF20A and cell cycle-associated matrix. The correlation coefficient is shown in the lower left corner. The correlation coefficient is expressed as a pie chart scale. The red part represents a positive correlation.
KIF20Aexpression is correlated with breast cancer treatment response.
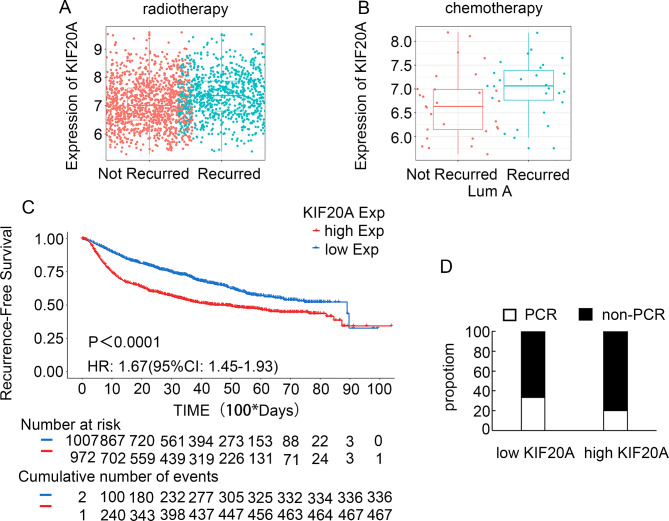
In order to further verify whether KIF20A is related to treatment resistance, we conducted statistical analysis on patients who had undergone radiotherapy in the MTABRIC data set and found that high expression of KIF20A after radiotherapy was positively correlated with breast cancer recurrence (Fig. 6A). Similarly, patients with high KIF20A expression have a higher recurrence rate than those with low KIF20A after chemotherapy, especially in the luminal A subtype (Fig. 6B). Kaplan-Meier analysis further confirmed that patients with high KIF20A expression had a worse disease-free survival than those with low KIF20A expression after treatment (HR 1.67 (95% CI: 1.45–1.93), p < 0.0001) (Fig. 6C). To further investigate the correlation between KIF20A expression and treatment response, we further analyzed the correlation of KIF20A levels with the response to anthracycline and/or taxane-containing neoadjuvant chemotherapy. We obtained 60 tissues from patients who underwent neoadjuvant chemotherapy in our department, measured KIF20A expression, and correlated KIF20A expression with PCR rate. A decreased pCR rate was observed in patients with high KIF20A expression. Eleven patients (37%) achieved a pCR in low KIF20A expression, whereas only six patients (20%) achieved a pCR in high KIF20A expression (p < 0.01, Fig. 6D). These data showed that patients with high KIF20A expression achieved less treatment response than those with low KIF20A expression.
Fig. 6.
The relationship between KIF20A expression and treatment. (A) Recurrence of high and low expression of KIF20A after radiotherapy. (B) Recurrence of high and low expression of KIF20A in lumA subtype breast cancer after chemotherapy. (C) Recurrence-Free Survival rates of high and low expression of KIF20A in the METABRIC database. (D) Percentage of pCR in patients stratified by KIF20A expression. Patients with low KIF20A expression showed relatively higher pCR rate than those with high KIF20A expression (n = 30/group). p < 0.01.
The above results indicated that KIF20A may be a tumor promoter and a potential target of treatment. Thus, we wondered whether there were any candidate drugs targeting KIF20A. We performed a molecular docking analysis of KIF20A as well as other hub genes using the GSCALite database. Unfortunately, as shown in Figure S5, the correlation between KIF20A and candidate drugs is positive, suggesting that these candidate molecules are not sensitive to target KIF20A.
KIF20A is enriched in the microenvironment and co-expressed with multidrug resistant genes.
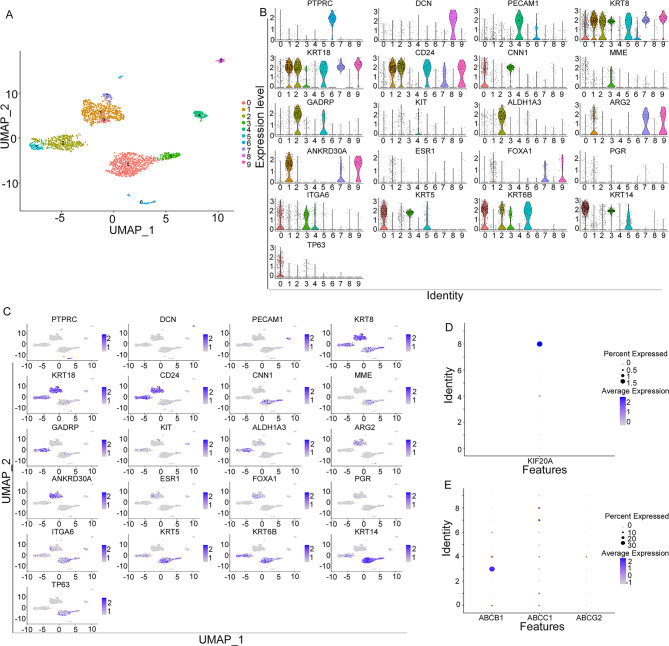
The single-cell sequencing analysis was performed using the GSE159284 data set. A total of 2359 cells from 18 samples were analyzed to identify and characterize cell populations based on screening criteria. Cell types were assigned by cross-referencing differentially expressed genes in each cluster with previously reported cell type-specific marker genes. Using Seurat, a total of 10 cell clusters were identified (Fig. 7A). According to the expression of cell markers, clusters 1, 7, and 9 were defined as mature luminal cells, clusters 2, and 5 were defined as luminal progenitor cells, clusters 0, and 3 were defined as basal progenitor cells and basal epithelial cells, clusters 4 were defined as endothelial cells, clusters 6 were defined as immune cells, and clusters 8 were defined as fibroblasts cells (Fig. 7B& C).
Fig. 7.
Single-cell analysis in the GSE159284 data set. (A) Breast cancer cell subtype in the GSE159284 dataset. (B) and (C) Biomarker expression of different subtypes of tumor cells and stromal cells in GSE159284 data set. (D) Enrichment of KIF20A in various cell subtypes in the GSE196284 data set. (E) Expression of drug resistance-related genes ABCB1, ABCC1, and ABCG2 in different cell subtypes of GSE1096284.
We further explore the expression of KIF20A in various clusters of breast cancer. We found that KIF20A was enriched in cell clusters 4 (endothelial cells) and clusters 8 (fibroblast cells), which were important components of the tumor microenvironment (Fig. 7D). We also observed that genes associated with drug resistance in cancer treatment (ABCB1,ABCC1,ABCG2) were co-expressed with KIF20A in cell clusters 4 and 8 (Fig. 7E). Based on our bold hypothesis, KIF20A plays a crucial role in breast cancer stromal cells, which may contribute to the development of drug resistance.
Discussion
In the present study, we collected six breast cancer tissues and paired normal tissues for RNA sequencing analyses to explore potential tumor predictor. 1687 DEGs, including 857 up-regulated genes and 830 down-regulated genes were identified. Upregulated genes may be potential oncogenes that promote the progression of breast cancer, while downregulated genes may serve as protective factors against breast cancer progression. To further explore the potential key genes that influence breast cancer, we constructed a PPI network and identified 10 hub genes, including TOP2A, CDK1, BUB1B, KIF11, CCNA2, BUB1, CCNB1, KIF20A, DLGAP5 and CDC20. The results of the KEGG analysis indicated that the hub genes were associated with cell cycle regulation, which was closely linked to tumor progression28. Among these hub genes, univariate and multivariate Cox analyses confirmed that KIF20A was an independent prognostic predictor. Further validation indicated that KIF20A expression was elevated in breast cancer and correlated with treatment response. Moreover, KIF20A was mainly enriched in the breast cancer microenvironment based on single-cell analysis. Our study will not only provide a novel potential biomarker for breast cancer diagnosis and treatment but also reveal the probable mechanism of breast cancer progression and treatment resistance in the future.
To our knowledge, the role and mechanism of KIF20A in breast cancer is not fully elucidated. KIF20A, also known as Kinesin Family 20 A, has been implicated in the progression of several malignancies, including bladder carcinoma, prostatic adenocarcinoma, pancreatic ductal adenocarcinoma and hepatic cancer18,21,29–33. In our study, differential analysis and hub gene analysis were performed, revealing that KIF20A exhibited differential expression between breast cancer tissues and normal tissues and occupied a key position in the regulation of network protein interactions. Subsequently, the association of KIF20A with poor prognosis was validated based on the mRNA-seq data and clinical data from a cohort comprising 1,980 patients from the METABRIC database and 3409 patients from the GSE9605 dataset. The analysis of these independent patient cohorts further supported the notion that high expression of KIF20A was correlated with unfavorable prognosis among breast cancer patients. Our results further elucidated that KIF20A was enriched in triple-negative subtype than other subtypes. Similarly, we observed high expression of KIF20A in the triple-negative breast cancer cell lines MDA-MB-231 and MDA-MB-468 cells.
Previous studies indicated that KIF20A has a significant role in cell division, particularly in constructing the mitotic spindle during the division of the cells34. Thus, we further explore the mechanism underlying the involvement of KIF20A in cell cycle progression. As anticipated, KIF20A was closely associated with the cell cycle process and exhibited positive correlations with cell cycle regulating genes35, such as CCNA2, CCNB2 and CCNB1. Additionally, KIF20A was mainly involved in cellular cycle processes, specifically the transition from G2 to M phase of the cell cycle and the initiation of DNA replication associated with cell division. These findings highlight the crucial role of KIF20A in regulating the cell cycle and its potential significance in breast cancer progression.
Many previous reports have shown that KIF20A is associated with resistance to various tumor treatments36–40. For instance, KIF20A promotes progression to castration-resistant prostate cancer through autocrine activation of the androgen receptor18; KIF20A may confer resistance to oxaliplatin in colorectal cancer (CRC) by inhibiting ferroptosis through the NUAK1/PP1β/GPX4 pathway36. Here, we for the first time found that patients with high KIF20A expression were more likely to relapse after radiotherapy in the METABRIC database. Moreover, patients with high KIF20A expression were more likely to relapse after chemotherapy. Neoadjuvant chemotherapy is widely used in breast cancer treatment, providing opportunities to observe the response to chemotherapy in vivo. Thus, we analyzed the correlation of KIF20A expression with the response to neoadjuvant chemotherapy and confirmed that KIF20A expression was associated with response to neoadjuvant chemotherapy. In addition, the GSCALite database online tool was utilized to predict potential therapeutic small molecule drugs for hub genes. Although no drugs with a sensitive response were identified, we for the first time found that KIF20A was associated with resistance to multiple small-molecule drugs, implying that targeting KIF20A may become a potential strategy for treatment resistant41. Here, we validated that the high expression of KIF20A may contribute to the development of therapy resistance in breast cancer and attempted to further explore the potential mechanism.
Accumulating evidence showed that treatment resistance is closely associated with tumor microenvironment. For instance, endothelial cells and other stromal cells induced chemoresistance and metastasis through producing TNF-α and subsequently enhancing CXCL1/2 expression in breast cancer42,43; recent single-cell profiling studies showed that endothelial cell subtypes also participated in immune response via lipid processing44. Fibroblasts are another key component of the tumor microenvironment and are involved in the progression, metastasis, and treatment resistance of malignancies45. Recently, Liu et al.46 reported that CD16 fibroblasts may contribute to breast cancer drug resistance by increasing extracellular matrix stiffness and reducing drug delivery. Several biomarkers, such as CRTAM,CLEC2D and KLRB1, have been shown targeting exhausted CD8 + T cells (CD8Tex) in breast cancer, indicating the correlation between potential biomarkers with microenvironment47. To explore the potential mechanism underlying the involvement of KIF20A in treatment resistance, we for the first time investigated the relationship between KIF20A and the microenvironment. Breast cancer tissues were classified into mature luminal cells, luminal progenitor cells, basal progenitor cells, basal epithelial cells, endothelial cells, immune cells and fibroblast cells48. Single-cell analyses were then performed and we found that KIF20A was predominantly enriched in endothelial cells and fibroblast cells, which were closely related to drug resistance. We also observed that genes associated with drug resistance in cancer treatment (ABCB1, ABCC1, ABCG2) were co-expressed with KIF20A in cell clusters 4 and 849, which may explain KIF20A’s involvement in treatment resistance. Cancer biomarkers can better assist in early diagnosis, precision therapy, prognosis assessment and the development of new drugs50–52. It is inappropriate to directly use genes that are highly expressed in tumors as definitive markers of tumor progression in high-throughput sequencing. Subsequent bioinformatics analysis and experimental validation are crucial for identifying the roles of these genes in the disease. Meanwhile, single-cell sequencing results provide new insights into gene expression in specific cell types and tumor locations, but they are limited by resolution53. Similarly, these findings shed new light on the potential roles of KIF20A in the interaction between cancer cells and the tumor microenvironment, suggesting that KIF20A may induce treatment resistance by regulating the angiogenic and fibrotic processes in breast cancer.
In conclusion, our study identified and validated that KIF20A may serve as a novel predictor for the prognosis and treatment response in patients with breast cancer. KIF20A may induce treatment resistance by regulating the tumor microenvironment, which suggests a potential therapy target for breast cancer. Targeting KIF20A may provide a new therapeutic target for breast cancer patients. However, we did not elucidate the full mechanism of how KIF20A regulates fibroblasts. Additionally, the exploration of potential molecular drugs that could target KIF20A remains a significant challenge. Further experimental validations are required to be performed.
Electronic Supplementary Material
Acknowledgements
Not applicable.
Author contributions
Mei Yang, Hui Huang and Shaohua Qu Conceptualization and Writing-Original Draft Preparation. Yan Zhang, Yiping Wang, Junhao Zhao, and Peiyao Lee Formal Analysis and Methodology. Yuhua Ma and Shaohua Qu Resources and Supervision. Shaohua Qu Funding Acquisition, and Writing-Review & Editing. All authors meet the authorship criteria detailed in the Authorship section of these guidelines, and all authors agree with the contents of the manuscript.
Funding
This work was supported by the Guangdong Basic and Applied Research Foundation (2023A1515010553); Science and Technology Projects in Guangzhou (2023A03J1005); Youth Science Foundation of National Natural Science Foundation of China (81702598); The Science Foundation of Guangdong Province (2017A030313803); The Science and Technology Program of Guangzhou (201804010011) and the Flagship specialty construction project-General surgery (711003).
Data availability
Public datasets for the current study are available for download on the GEO website and the METABRIC website. Home - GEO - NCBI (nih.gov). cBioPortal for Cancer Genomics.
Declarations
Competing interests
The authors declare no competing interests.
Ethical approval
Consent was obtained from all patients and ethical approval was obtained from the ethics committee of the first affiliated hospital of jinan university.
Footnotes
Publisher’s note
Springer Nature remains neutral with regard to jurisdictional claims in published maps and institutional affiliations.
These authors contribute equally to this article
Contributor Information
Yuhua Ma, Email: mayuhua2110@126.com.
Shaohua Qu, Email: qushaohua2009@163.com.
References
- 1.Siegel, R. L., Giaquinto, A. N. & Jemal, A. Cancer statistics, 2024. CA Cancer J. Clin.74, 12–49. 10.3322/caac.21820 (2024). [DOI] [PubMed] [Google Scholar]
- 2.Arnold, M. et al. Current and future burden of breast cancer: Global statistics for 2020 and 2040. Breast66, 15–23. 10.1016/j.breast.2022.08.010 (2022). [DOI] [PMC free article] [PubMed] [Google Scholar]
- 3.Sonkin, D., Thomas, A. & Teicher, B. A. Cancer treatments: Past, present, and future. Cancer Genet.286–287, 18–24. 10.1016/j.cancergen.2024.06.002 (2024). [DOI] [PMC free article] [PubMed] [Google Scholar]
- 4.Nolan, E., Lindeman, G. J. & Visvader, J. E. Deciphering breast cancer: From biology to the clinic. Cell186, 1708–1728. 10.1016/j.cell.2023.01.040 (2023). [DOI] [PubMed] [Google Scholar]
- 5.Xiao, Y. & Yu, D. Tumor microenvironment as a therapeutic target in cancer. Pharmacol. Ther.221, 107753. 10.1016/j.pharmthera.2020.107753 (2021). [DOI] [PMC free article] [PubMed] [Google Scholar]
- 6.Zhang, H. et al. Define cancer-associated fibroblasts (CAFs) in the tumor microenvironment: new opportunities in cancer immunotherapy and advances in clinical trials. Mol. Cancer. 22, 159. 10.1186/s12943-023-01860-5 (2023). [DOI] [PMC free article] [PubMed] [Google Scholar]
- 7.Wu, S. Y., Fu, T., Jiang, Y. Z. & Shao, Z. M. Natural killer cells in cancer biology and therapy. Mol. Cancer. 19, 120. 10.1186/s12943-020-01238-x (2020). [DOI] [PMC free article] [PubMed] [Google Scholar]
- 8.Yeo, S. K. & Guan, J. L. Breast cancer: Multiple subtypes within a tumor? Trends Cancer. 3, 753–760. 10.1016/j.trecan.2017.09.001 (2017). [DOI] [PMC free article] [PubMed] [Google Scholar]
- 9.McDonald, E. S., Clark, A. S., Tchou, J., Zhang, P. & Freedman, G. M. Clinical diagnosis and management of breast cancer. J. Nucl. Med.57 (Suppl 1), 9S–16S. 10.2967/jnumed.115.157834 (2016). [DOI] [PubMed] [Google Scholar]
- 10.Burstein, H. J. et al. Customizing local and systemic therapies for women with early breast cancer: the St. Gallen International Consensus Guidelines for treatment of early breast cancer 2021. Ann. Oncol.32, 1216–1235. 10.1016/j.annonc.2021.06.023 (2021). [DOI] [PMC free article] [PubMed] [Google Scholar]
- 11.Li, Y. et al. Recent advances in therapeutic strategies for triple-negative breast cancer. J. Hematol. Oncol.15, 121. 10.1186/s13045-022-01341-0 (2022). [DOI] [PMC free article] [PubMed] [Google Scholar]
- 12.Hanker, A. B., Sudhan, D. R. & Arteaga, C. L. Overcoming endocrine resistance in breast cancer. Cancer Cell.37, 496–513. 10.1016/j.ccell.2020.03.009 (2020). [DOI] [PMC free article] [PubMed] [Google Scholar]
- 13.Yeo, S. K. et al. Single-cell RNA-sequencing reveals distinct patterns of cell state heterogeneity in mouse models of breast cancer. Elife910.7554/eLife.58810 (2020). [DOI] [PMC free article] [PubMed]
- 14.Liu, S. Q. et al. Single-cell and spatially resolved analysis uncovers cell heterogeneity of breast cancer. J. Hematol. Oncol.15, 19. 10.1186/s13045-022-01236-0 (2022). [DOI] [PMC free article] [PubMed] [Google Scholar]
- 15.Larson, N. B., Oberg, A. L., Adjei, A. A. & Wang, L. A clinician’s guide to bioinformatics for next-generation sequencing. J. Thorac. Oncol.18, 143–157. 10.1016/j.jtho.2022.11.006 (2023). [DOI] [PMC free article] [PubMed] [Google Scholar]
- 16.Mosele, F. et al. Recommendations for the use of next-generation sequencing (NGS) for patients with metastatic cancers: a report from the ESMO Precision Medicine Working Group. Ann. Oncol.31, 1491–1505. 10.1016/j.annonc.2020.07.014 (2020). [DOI] [PubMed] [Google Scholar]
- 17.Jin, Z. et al. Expression, regulating mechanism and therapeutic target of KIF20A in multiple cancer. Heliyon9, e13195. 10.1016/j.heliyon.2023.e13195 (2023). [DOI] [PMC free article] [PubMed] [Google Scholar]
- 18.Copello, V. A. & Burnstein, K. L. The kinesin KIF20A promotes progression to castration-resistant prostate cancer through autocrine activation of the androgen receptor. Oncogene41, 2824–2832. 10.1038/s41388-022-02307-9 (2022). [DOI] [PMC free article] [PubMed] [Google Scholar]
- 19.Shen, T. et al. KIF20A Affects the Prognosis of Bladder Cancer by Promoting the Proliferation and Metastasis of Bladder Cancer Cells. Dis. Markers. 2019 (4863182). 10.1155/2019/4863182 (2019). [DOI] [PMC free article] [PubMed]
- 20.Sheng, Y. et al. Upregulation of KIF20A correlates with poor prognosis in gastric cancer. Cancer Manag Res.10, 6205–6216. 10.2147/CMAR.S176147 (2018). [DOI] [PMC free article] [PubMed] [Google Scholar]
- 21.Shi, C. et al. Aberrantly activated Gli2-KIF20A axis is crucial for growth of hepatocellular carcinoma and predicts poor prognosis. Oncotarget7, 26206–26219. 10.18632/oncotarget.8441 (2016). [DOI] [PMC free article] [PubMed] [Google Scholar]
- 22.Nakamura, M. et al. Characterization of KIF20A as a prognostic biomarker and therapeutic target for different subtypes of breast cancer. Int. J. Oncol.57, 277–288. 10.3892/ijo.2020.5060 (2020). [DOI] [PubMed] [Google Scholar]
- 23.Kanehisa, M., Furumichi, M., Sato, Y., Kawashima, M. & Ishiguro-Watanabe, M. KEGG for taxonomy-based analysis of pathways and genomes. Nucleic Acids Res.51, D587–D592. 10.1093/nar/gkac963 (2023). [DOI] [PMC free article] [PubMed] [Google Scholar]
- 24.Liu, Z. et al. A glycolysis-related two-gene risk model that can effectively predict the prognosis of patients with rectal cancer. Hum. Genomics. 1610.1186/s40246-022-00377-0 (2022). [DOI] [PMC free article] [PubMed]
- 25.Rajadnya, R. et al. Novel systems biology experimental pipeline reveals matairesinol’s antimetastatic potential in prostate cancer: an integrated approach of network pharmacology, bioinformatics, and experimental validation. Brief. Bioinform. 2510.1093/bib/bbae466 (2024). [DOI] [PMC free article] [PubMed]
- 26.Li, Y., Zhao, X., Liu, Q. & Liu, Y. Bioinformatics reveal macrophages marker genes signature in breast cancer to predict prognosis. Ann. Med.53, 1019–1031. 10.1080/07853890.2021.1914343 (2021). [DOI] [PMC free article] [PubMed] [Google Scholar]
- 27.Grun, D. & van Oudenaarden, A. Design and analysis of single-cell sequencing experiments. Cell163, 799–810. 10.1016/j.cell.2015.10.039 (2015). [DOI] [PubMed] [Google Scholar]
- 28.Matthews, H. K., Bertoli, C. & de Bruin, R. A. M. Cell cycle control in cancer. Nat. Rev. Mol. Cell. Biol.23, 74–88. 10.1038/s41580-021-00404-3 (2022). [DOI] [PubMed] [Google Scholar]
- 29.Mandal, K. et al. Role of a kinesin motor in cancer cell mechanics. Nano Lett.19, 7691–7702. 10.1021/acs.nanolett.9b02592 (2019). [DOI] [PMC free article] [PubMed] [Google Scholar]
- 30.Li, Y. et al. Cyclin F and KIF20A, FOXM1 target genes, increase proliferation and invasion of ovarian cancer cells. Exp. Cell. Res.395, 112212. 10.1016/j.yexcr.2020.112212 (2020). [DOI] [PubMed] [Google Scholar]
- 31.Stangel, D. et al. Kif20a inhibition reduces migration and invasion of pancreatic cancer cells. J. Surg. Res.197, 91–100. 10.1016/j.jss.2015.03.070 (2015). [DOI] [PubMed] [Google Scholar]
- 32.Meng, X. et al. KDELR2-KIF20A axis facilitates bladder cancer growth and metastasis by enhancing Golgi-mediated secretion. Biol. Proced. Online. 2410.1186/s12575-022-00174-y (2022). [DOI] [PMC free article] [PubMed]
- 33.Jin, Z., Tao, S., Zhang, C., Xu, D. & Zhu, Z. KIF20A promotes the development of fibrosarcoma via PI3K-Akt signaling pathway. Exp. Cell. Res.420, 113322. 10.1016/j.yexcr.2022.113322 (2022). [DOI] [PubMed] [Google Scholar]
- 34.Hadders, M. A. & Lens, S. M. A. Changing places: Chromosomal passenger complex relocation in early anaphase. Trends Cell. Biol.32, 165–176. 10.1016/j.tcb.2021.09.008 (2022). [DOI] [PubMed] [Google Scholar]
- 35.Montagnoli, A., Moll, J. & Colotta, F. Targeting cell division cycle 7 kinase: A new approach for cancer therapy. Clin. Cancer Res.16, 4503–4508. 10.1158/1078-0432.CCR-10-0185 (2010). [DOI] [PubMed] [Google Scholar]
- 36.Yang, C., Zhang, Y., Lin, S., Liu, Y. & Li, W. Suppressing the KIF20A/NUAK1/Nrf2/GPX4 signaling pathway induces ferroptosis and enhances the sensitivity of colorectal cancer to oxaliplatin. Aging (Albany NY). 13, 13515–13534. 10.18632/aging.202774 (2021). [DOI] [PMC free article] [PubMed] [Google Scholar]
- 37.Khongkow, P. et al. Paclitaxel targets FOXM1 to regulate KIF20A in mitotic catastrophe and breast cancer paclitaxel resistance. Oncogene35, 990–1002. 10.1038/onc.2015.152 (2016). [DOI] [PMC free article] [PubMed] [Google Scholar]
- 38.Yu, H. et al. FOXM1 modulates docetaxel resistance in prostate cancer by regulating KIF20A. Cancer Cell. Int.20, 545. 10.1186/s12935-020-01631-y (2020). [DOI] [PMC free article] [PubMed] [Google Scholar]
- 39.Yu, H., Zhang, W., Xu, X. R. & Chen, S. Drug resistance related genes in lung adenocarcinoma predict patient prognosis and influence the tumor microenvironment. Sci. Rep.13, 9682. 10.1038/s41598-023-35743-y (2023). [DOI] [PMC free article] [PubMed] [Google Scholar]
- 40.Rahman, K. U. et al. Mir-153-3p modulates the breast cancer cells’ chemosensitivity to doxorubicin by targeting KIF20A. Cancers (Basel). 1510.3390/cancers15061724 (2023). [DOI] [PMC free article] [PubMed]
- 41.Wong, R. S., Ong, R. J. & Lim, J. S. Immune checkpoint inhibitors in breast cancer: Development, mechanisms of resistance and potential management strategies. Cancer Drug Resist.6, 768–787. 10.20517/cdr.2023.58 (2023). [DOI] [PMC free article] [PubMed] [Google Scholar]
- 42.Acharyya, S. et al. A CXCL1 paracrine network links cancer chemoresistance and metastasis. Cell150, 165–178. 10.1016/j.cell.2012.04.042 (2012). [DOI] [PMC free article] [PubMed] [Google Scholar]
- 43.Pelon, F. et al. Cancer-associated fibroblast heterogeneity in axillary lymph nodes drives metastases in breast cancer through complementary mechanisms. Nat. Commun.11, 404. 10.1038/s41467-019-14134-w (2020). [DOI] [PMC free article] [PubMed] [Google Scholar]
- 44.Geldhof, V. et al. Single cell atlas identifies lipid-processing and immunomodulatory endothelial cells in healthy and malignant breast. Nat. Commun.13, 5511. 10.1038/s41467-022-33052-y (2022). [DOI] [PMC free article] [PubMed] [Google Scholar]
- 45.Jung, Y. Y., Kim, H. M. & Koo, J. S. The role of cancer-associated fibroblasts in breast cancer pathobiology. Histol. Histopathol. 31, 371–378. 10.14670/HH-11-700 (2016). [DOI] [PubMed] [Google Scholar]
- 46.Liu, X. et al. CD16(+) fibroblasts foster a trastuzumab-refractory microenvironment that is reversed by VAV2 inhibition. Cancer Cell 40, 1341–1357 e1313. 10.1016/j.ccell.2022.10.015 (2022). [DOI] [PubMed]
- 47.Liu, H., Dong, A., Rasteh, A. M., Wang, P. & Weng, J. Identification of the novel exhausted T cell CD8 + markers in breast cancer. Sci. Rep.14, 19142. 10.1038/s41598-024-70184-1 (2024). [DOI] [PMC free article] [PubMed] [Google Scholar]
- 48.Hu, L. et al. Single-cell RNA sequencing reveals the cellular origin and evolution of breast cancer in BRCA1 mutation carriers. Cancer Res.81, 2600–2611. 10.1158/0008-5472.CAN-20-2123 (2021). [DOI] [PubMed] [Google Scholar]
- 49.Gote, V., Nookala, A. R., Bolla, P. K. & Pal, D. Drug resistance in metastatic breast cancer: Tumor targeted nanomedicine to the rescue. Int. J. Mol. Sci.2210.3390/ijms22094673 (2021). [DOI] [PMC free article] [PubMed]
- 50.Liu, H., Weng, J., Huang, C. L. & Jackson, A. P. Voltage-gated sodium channels in cancers. Biomark. Res.12, 70. 10.1186/s40364-024-00620-x (2024). [DOI] [PMC free article] [PubMed] [Google Scholar]
- 51.Liu, H., Dilger, J. P. & Lin, J. A pan-cancer-bioinformatic-based literature review of TRPM7 in cancers. Pharmacol. Ther.240, 108302. 10.1016/j.pharmthera.2022.108302 (2022). [DOI] [PubMed] [Google Scholar]
- 52.Liu, H. & Tang, T. Pan-cancer genetic analysis of disulfidptosis-related gene set. Cancer Genet.278–279, 91–103. 10.1016/j.cancergen.2023.10.001 (2023). [DOI] [PubMed] [Google Scholar]
- 53.Hengrui Liu, Z. G. & Wang, P. Genetic expression in cancer research: Challenges and complexity. Gene Rep.10.1016/j.genrep.2024.102042 (2024). [Google Scholar]
Associated Data
This section collects any data citations, data availability statements, or supplementary materials included in this article.
Supplementary Materials
Data Availability Statement
Public datasets for the current study are available for download on the GEO website and the METABRIC website. Home - GEO - NCBI (nih.gov). cBioPortal for Cancer Genomics.


