Abstract
A cost-effective industrial TiOSO4 solution was employed to fabricate visible light active sulfur-doped titanium dioxide (S-TiO2) via a facile hydrothermal method. The effect of calcination temperature on morphology, particle size, crystallinity, and photocatalytic property of S-TiO2 was systematically investigated. Successful incorporation of sulfur into TiO2 was confirmed by carbon-sulfur analysis, X-ray photoelectron spectroscopy (XPS), and Energy dispersive spectrometer (EDS). The research results demonstrated that calcination temperature significantly impacted the crystallinity, specific surface area, sulfur content, and light absorption properties of S-TiO2. The catalyst calcined at 400 °C revealed the highest photocatalytic activity, with a rate constant of 0.02408 min−1, approximately 25 times higher than commercial P25 catalyst. The higher activity was attributed to the synergistic effect of well-crystallized anatase phase, specific surface area, and red shift of spectral absorption.
Supplementary Information
The online version contains supplementary material available at 10.1038/s41598-024-82640-z.
Keywords: Sulfur-doped TiO2, Hydrothermal, Industrial TiOSO4 solution, In-situ synthesis
Subject terms: Environmental sciences, Chemistry
Introduction
In recent decades, semiconductor-based heterogeneous photocatalysis has attracted lot of attention as an emerging alternative technology, exhibiting unique advantages in pollutant degradation1–4, hydrogen production5–8, sterilization9, water oxidation10 and other applications. Among the many catalysts, such as SnO2, ZnO, TiO2, V2O5, WO3, and PbS, TiO2 stands out as a superior one due to its strong oxidation ability, good stability, chemical inertness, biocompatibility, non-toxicity, and environmental friendliness11–13. However, two major drawbacks hinder the practical application of TiO2: (i) the high recombination rate of electrons and holes, and (ii)wide bandgap energy, which can only be activated by ultraviolet. Various strategies have used to overcome these limitations, including metal doping14,15, non-metal doping16,17, physical modification18–20, and heterostructure construction21,22.
Numerous studies have demonstrated that sulfur doping is a most effective approach to improve photocatalytic activity due to it can enhance thermal stability and reduce bandgap energy of TiO2. Ramacharyulu et al. synthesized S-TiO2and employed them for the degradation of sulfur mustard under sunlight23. They found that S-doping could efficiently reduced bandgap energy and enhanced visible light absorption of TiO2, thus exhibited superior activity in photocatalytic degradation of sulfur mustard compared to undoped and commercial TiO2 catalysts. Gomathi Devi et al. prepared S-TiO2and investigated its catalytic performance for phenol degradation24. They discovered S6+ ions doped into the TiO2 lattice after calcination under atmospheric conditions, and the surface sulfur was modified into SO42−. Geetha et al.25 prepared sulfated TiO2 by sol-gel method. The sulfated TiO2 (5wt% SO42−) showed excellent catalytic activity in the multicomponent synthesis of highly functionalized piperidines due to the increased Bronsted acidity. Xu et al.26 investigated the activity of pristine TiO2 and sulfated TiO2. They found that bidentate chelating SO42− and monodentate SO42− coexisted in sulfated TiO2. The presence of SO42− enhanced the adsorption of dye molecules and visible light absorption. Li et al. prepared SO42−-TiO2 by and found the sample with higher activity and longer lifetime in phenol degradation compared to undoped TiO227. However, synthesis routes of catalyst in these studies are often complex, and the employed titanium precursors (e.g., titanium alkoxides or titanium tetrachloride) are relatively expensive. This renders the overall photocatalytic process less economical.
This study utilized a low-cost industrial TiOSO4 solution as titanium precursor to synthesize S-TiO2 via a simple hydrothermal method. The effect of heat treatment temperature on morphology, particle size, crystallinity, and catalytic property of S-TiO2 was systematically investigated. The prepared S-TiO2 with better light absorption and exhibits good photocatalytic behaviors for degradation Rhodamine B (Rh.B). In addition, the degradation mechanism of S-TiO2 was discussed.
Experimental
Chemicals and materials
The industrial TiOSO4 solution used in this work was obtained from titanium dioxide pigment factory, and its primary compositions are: TiO2 = 189 g/L, F = [effective H2SO4/TiO2] = 1.87. Commercial P25 was purchased from Degussa. Commercial anatase TiO2 (A-TiO2) and Rh.B was bought from Fuchen Chemical Reagent Co., Ltd (Tianjin China). Disodium ethylenediamine tetraacetate (EDTA-2Na), isopropyl alcohol (IPA), and benzoquinone (BQ) were obtained from Guanghua Sci-Tech Co., Ltd (Guangdong China). Silver nitrate (AgNO3) were obtained from Dongjulong Chemical Technology Development Co., Ltd (Tianjin China).
Preparation of S-TiO2
The S-TiO2 was synthesized by using hydrothermal route. In a typical prepare process, 92 ml industrial TiOSO4 solution and 50 ml water were heated to 96 ± 1 °C, respectively. Afterwards, the heated TiOSO4 solution was added into the heated water in 20 min (using Peristaltic pump) under constant stirring. After adding off, the mixed was transferred into a autoclave (200 ml) and aged at 110 °C for 3 h. After the reaction, the precipitate was centrifuged, washed, and dried at 60 °C overnight. Finally, the solid was calcined in air at 300 °C, 400 °C, 500 °C, 600 °C and 700 °C for 2 h ( heating rate 10 °C/min). The resulting samples were labeled as ST-x, where x represents the calcination temperature (300 °C, 400 °C, 500 °C, 600 °C, or 700 °C).The synthetic process of S-TiO2 is depicted in Fig. S1.
Characterization
The X-ray powder diffraction(XRD) were obtained on X’ Pert3 Powder diffractometer (Malvern Panalytical), with Cu Kα1 irradiation. Raman spectra were obtained using inVia (Renishaw). The TG-DSC test was obtained in thermal analyzer (STA449C, NETZSCH) under nitrogen atmosphere. Fourier transform infrared (FTIR) tests were carried out using NICOLET 380 (Thermo Electron Corporation). XPS experiments were obtained on Thermo Scientific K-Alpha (PerkinElmer) using Al Kα radiation (hv = 1253.6 eV) with an operating voltage and heater current of 12.0 kV and 6 mA, respectively. Scanning electron microscopy (SEM) was performed on a ZEISS MERLIN Compact (SU8010). Transmission electron microscopy (TEM) tests carried out by FEI Tecnai F20 electron microscope operated at 80 keV. Aomic force microscope (AFM, MFP3D Infinity, America) was employed to characterize the nanoparticle size. UV-visible diffuse reflection spectra (UV-Vis DRS) were conducted on a UV-vis-NIR spectrophotometer (UV-3600, Shimadzu). Nitrogen adsorption apparatus (ASAP 2460, Micromeritics) is used for research specific surface area and pore size distribution. The content of S was determined by Carbon Sulfur Analyzer (CS230, LECO).
Photocatalytic activity
The activity of each ST-x and P25 was evaluated by degradation Rh.B (10 mg/L). A 300 W xenon lamp (λ ≥ 420 nm) was used as light source. For each photocalytic experiment, 100 mg catalyst was added to 100 mL Rh.B. Before irradiation, the mixed solution was avoided light for 30 min. At constant intervals, a specified amount of the sample was taken out and centrifuged. The supernatant was detected on spectrophotometer (Model 721, Shanghai Xinmao Instrument Co., Ltd. China) at λ = 554 nm to investigate the degradation extent of the model compound Rh.B.
Electrochemical performance test
Electrochemical performance were tested by an electro-chemical workstation (CHI760E instruments, Shanghai Chenhua Instrument Co., Ltd. China) in a standard three-electrode with the Pt plate as the counter electrode, Ag/AgCl as the reference electrode, and FTO glass as the working electrode. The sample areas in the electrolyte for 0.2826 cm2. The electrolyte 0.2 M Na2SO3. A 300 W Xe lamp as the light source (> 420 nm) was used for the photocurrent tests.
Results and discussion
Characterization of composition
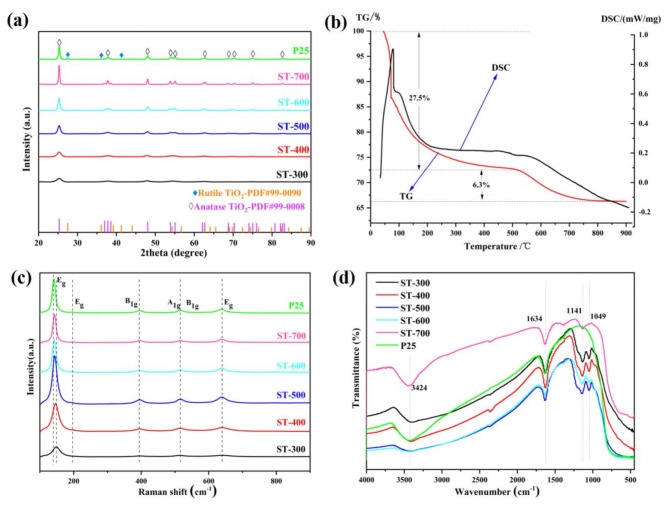
Figure 1a shows a comparison of XRD analysis of different samples. Unlike commercial P25 (normally displays both anatase and rutile phases), all S-TiO2 samples shows only anatase phase of TiO2 (JCPDS 99 − 0008), even after calcination at 700 °C, which clearly demonstrates the excellent thermal stability of S-TiO2. The incorporation of sulfur is generally favorable for the formation of anatase TiO2crystals28. No diffraction peaks of single S elemental is detected, indicating that S probably doped into the TiO2 crystals. The average crystallite size is listed in Table 1. In brief, the crystallite size of anatase TiO2grows from 5.6 nm to 24.1 nm with the increase of heat treatment temperature. In general, crystallinity is an important factor for photocatalytic29. The carbon-sulfur analysis results (see Table 1) shows that the sulfur content decreases from 2.13 to 0.17% with the calcination temperature increases from 300 °C to 700 °C. Therefore, a lower heat treatment temperature is beneficial for obtaining a higher sulfur content.
Fig. 1.
Comparison of XRD analysis (a), TG and DSC analysis profiles of un-calcined catalyst (b), Raman (c) and FTIR (d) spectra of the photocatalysts.
Table 1.
Comparison summary of average crystallite size (L) and sulfur content (S) of the photocatalysts.
| Photocatalyst | L (nm) | S (wt%) |
|---|---|---|
| ST-300 | 5.6 | 2.13 |
| ST-400 | 6.8 | 2.11 |
| ST-500 | 10.3 | 2.05 |
| ST-600 | 14.8 | 0.93 |
| ST-700 | 24.1 | 0.17 |
TG and DSC analysis profiles of the un-calcined catalyst are shown in Fig. 1b. The TG analysis reveals two main weight loss stages: (i) from 100 °C to 500 °C and (ii) from 500 °C to 800 °C. The first stage accounts for approximately 27.5% weight loss, primarily the loss of free and bound water. The second stage, with a weight loss of 6.3%, is likely due to the decomposition of strongly bonded sulphate species. The DSC profile exhibits a small endothermic effect around 550 °C, which is associated with the decomposition of sulphates30. Consequently, the sulfate species will gradually decrease with the increase of heat treatment temperature. A higher heat treatment temperature, such as above 700 °C, ensures the almost complete removal of sulfur species. This result is consistent with the carbon-sulfur analysis.
Raman spectra was further used to study the structure of TiO2 (Fig. 1c). Anatase always exhibits six Raman peaks at about 144 cm−1, 197 cm−1, 399 cm−1, 513 cm−1, 519 cm−1, and 639 cm−1, while rutile typically displays four Raman bands at 143 cm−1, 447 cm−1, 612 cm−1, and 826 cm−131,32. It can be seen that all samples shows similar peaks (Fig. 1c). According to the literature comparison, all S-TiO2 samples belong to anatase phase which is consistent with the corresponding XRD patterns. Meanwhile, comparison with P25, the peaks at 144 cm−1 have a slight shift for S-TiO2, which may be due to the S doped into the TiO2crystals33. With increasing calcination temperature, this shift decreasing due to the decrease in sulfur content (see Table 1).
FTIR measurements were performed to study the functional groups and bonding characteristics of the catalysts. Figure 1d shows a comparison of the FTIR spectra of catalysts. The absorption peak at 3424 cm−1 is recognized as the OH groups, and the peak at 1630 cm−1is recognized as the bending vibration of adsorbed water on the surface34. Compared with P25, prepared S-TiO2 samples has two distinct peaks at about 1141 cm−1 and 1049 cm−1. The former is recognized as the stretching vibrations of S-O bond, and the latter represent Ti-O-S bond, confirm the S is successful doped into TiO235. The peak of Ti-O-S gradually weaken and almost disappears in the ST-700 sample. This result indicates that the sulfur content decreases with the increase of heat treatment temperature, which is consistent with the TG analysis and carbon-sulfur analysis. A broad peaks between 700 and 1000 cm−1 is the librational band of adsorbed water36. In addition, the absorption band between 400 and 800 cm−1is belonged to Ti-O stretching vibration37.
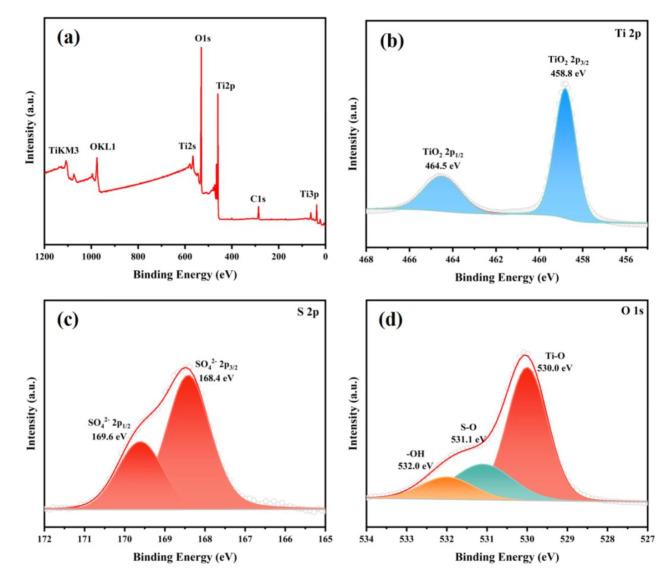
XPS was used to investigate the surface chemical composition and element valence states, and the results are revealed in Fig. 2. According to Fig. 2a, the XPS survey spectrum of the ST-400 sample shows clear peaks of Ti, O, and C elements, but only a very small S peak is noticed at 169 eV due to its low content. The high-resolution spectra of Ti 2p, O 1s, and S 2p are presented in Fig. 2b–d. Figure 2b shows Ti 2p3/2 and Ti 2p1/2 at 458.8 eV and 464.5 eV, respectively, indicating a Ti4+oxidation state38. The high-resolution S peak (Fig. 2c) exhibits two peaks at 168.4 eV and 169.6 eV, which belong to S6+ such as sulfur in SO42−. In general, the peaks of elemental S usually appears between 163 eV and 164 eV39. Therefore, no elemental sulfur peak is present in the prepared ST-400 catalyst. The deconvolution of O 1s peak (Fig. 2d) reveals three oxygen peaks, corresponding to 530.0 eV (lattice oxygen, such as in Ti-O bonds), 531.1 eV (oxygen in SO42−40), and 532.0 eV (oxygen in surface hydroxyl groups and absorbed water molecules41).
Fig. 2.
XPS analysis of ST-400: (a) complete spectra of sample, (b) deconvoluted Ti 2p peak, (c) deconvoluted 2p peak of sulfur, and (d) deconvoluted peak of O 1s.
Characterization of structure and morphology
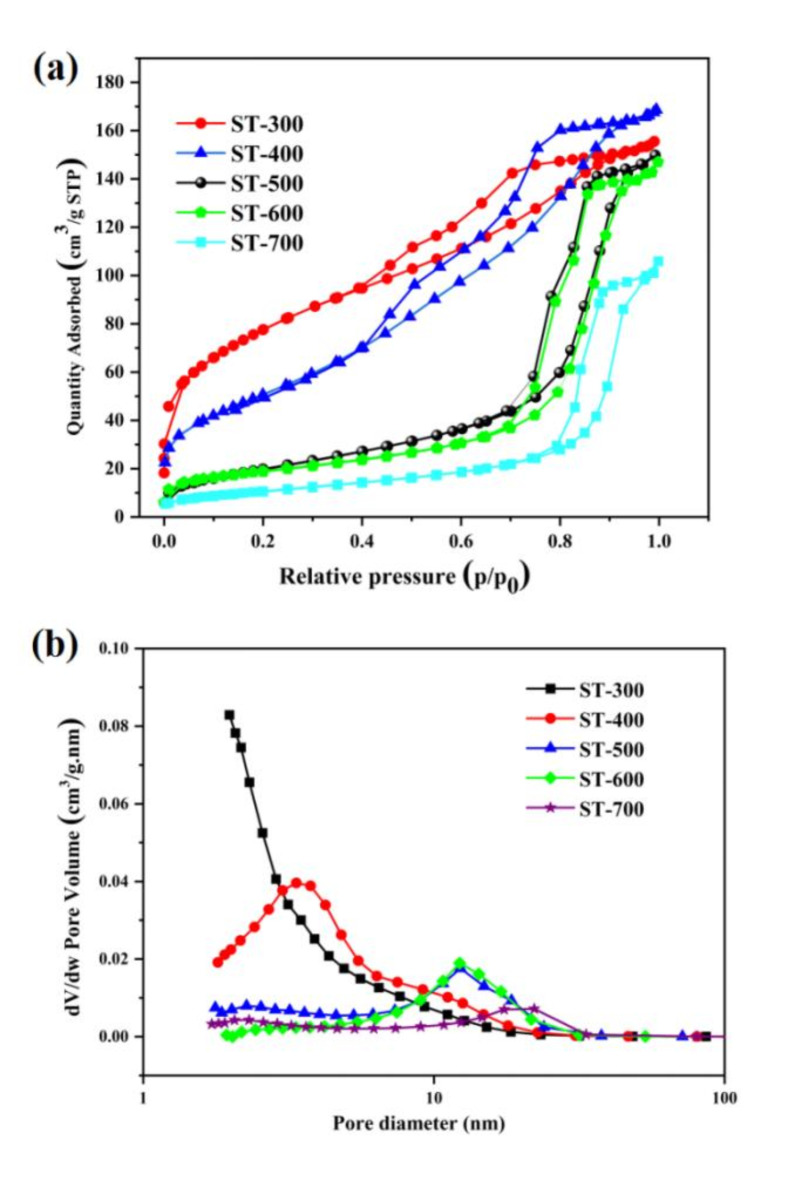
N2 adsorption-desorption measurements was used to test surface areas and pore size distributions of catalysts. As depicted from Fig. 3a, all S-doped TiO2 samples exhibit a distinct hysteresis loop with a typical IV Langmuir adsorption-desorption isotherm shape, indicating that all samples are typical mesoporous materials. With increase of calcination temperature from 300 °C to 700 °C, the hysteresis loop appears at high relative pressures and become cragginess due to the increase of pore diameter. In addition, pore size distribution (Fig. 3b) becomes wider with increasing calcination temperature. The pore structure parameters were shown in Table 2. The specific surface area gradually decreases with increasing calcination temperature because of the growth of TiO2crystallite. Extraordinary, the specific surface areas was significantly decreased for ST-500, probaly because of the crystal growth lead to collapse of the pore structure. So, a lower calcination temperature facilitates to forming a higher specific surface area, which is beneficial for providing abundant active sites and enhancing the adsorption of reactants42. The pore volume generally decreases with increasing calcination temperature. Higher calcination temperatures also lead to an increase in average pore diameter, especially when the calcination temperature is higher than 400 °C. In summary, higher calcination temperatures results in smaller surface area and pore volume, but larger pore diameter.
Fig. 3.
N2 adsorption and desorption isotherms (a), pore-size distribution (b) of S-TiO2.
Table 2.
Specific surface area (SBET), pore volume (VP), and average pore diameter (DBJH) of the photocatalysts.
| Photocatalyst | SBET (m2/g) | Vp (cm³/g) | DBJH (nm) |
|---|---|---|---|
| ST-300 | 280.9 | 0.214409 | 4.2 |
| ST-400 | 186.8 | 0.258151 | 5.2 |
| ST-500 | 73.7 | 0.233120 | 10.1 |
| ST-600 | 67.6 | 0.228768 | 12.6 |
| ST-700 | 39.1 | 0.164780 | 13.9 |
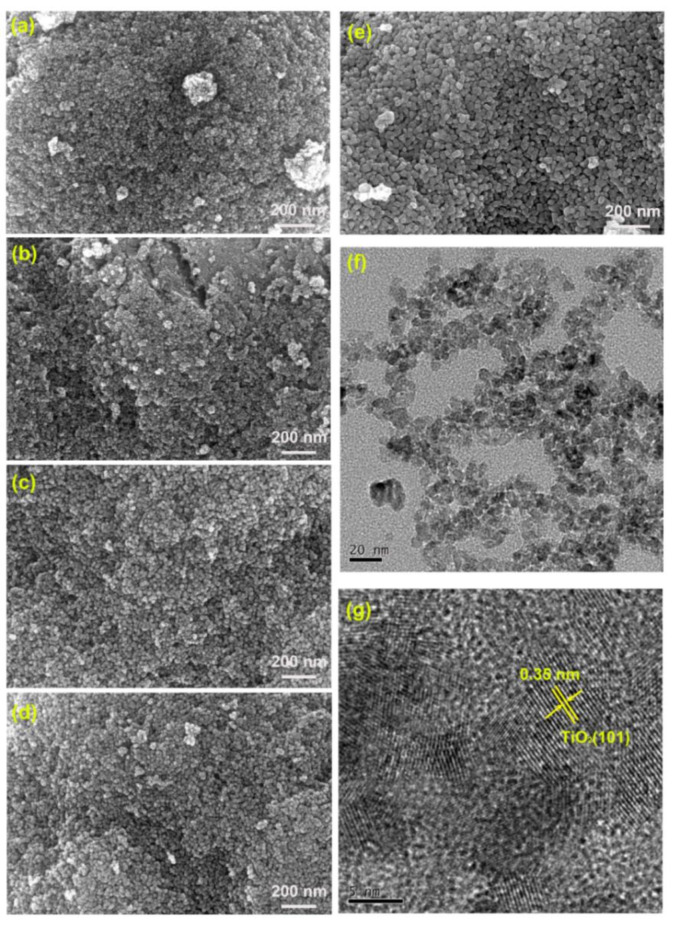
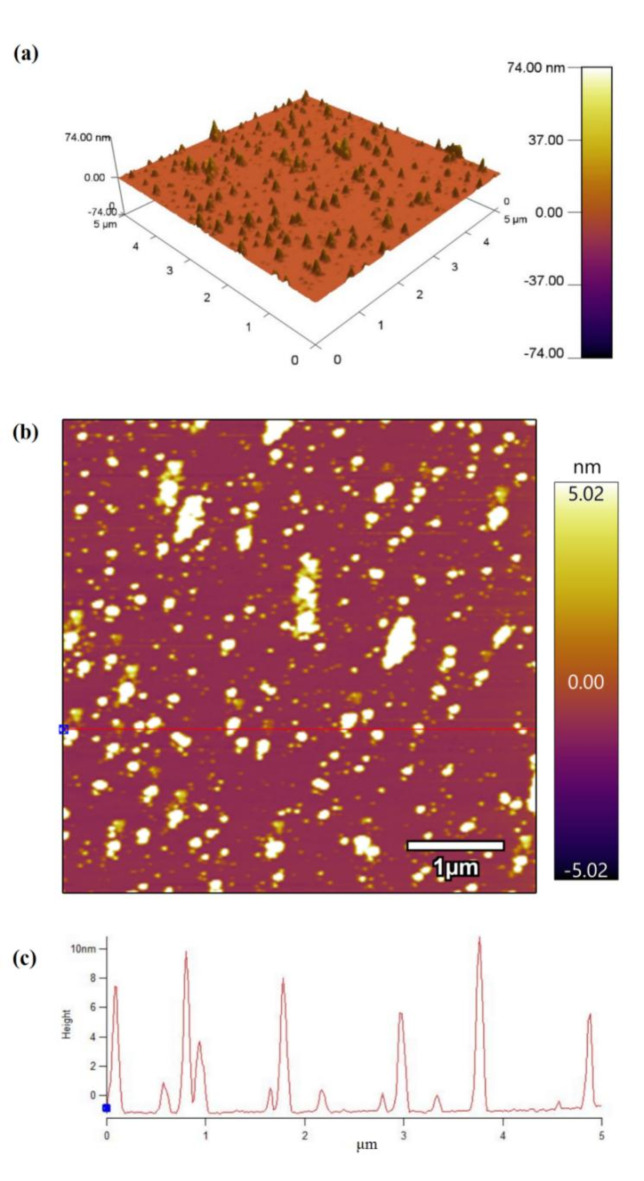
The morphologies of the prepared S-TiO2 were analyzed using SEM. Figure 4a–e reveals the SEM images of prepared samples. All samples exhibit a spherical morphology and high degree of agglomeration. The XRD results indicate that the crystallite size of the samples is 5.6 ~ 24.1 nm, which can lead to agglomerate and reduce the surface energy of the system. Additionally, it can be seen that the particle size become larger with the increase of calcination temperature. Further analysis of ST-400 was carried out by TEM and HR-TEM. Figure 4f shows that the morphology of ST-400 is spherical and the diameter is about 7 nm. The HR-TEM image (Fig. 4g) shows the lattice fringes of the ST-400 sample. The interplanar spacing (~ 0.35 nm) corresponds to the (101) plane of anatase TiO243. AFM measurements are performed to further investigate the microscopic size of the ST-400 sample (Fig. 5). According to Fig. 5a, b, the sample particles are evenly distributed on the mica sheet. Figure 5c shows the particles size is about 2 ~ 10 nm, which is similar to the TEM test.
Fig. 4.
SEM images of (a) ST-300, (b) ST-400, (c) ST-500, (d) ST-600, (e) ST-700; (f) TEM and (g) HR-TEM images of ST-400.
Fig. 5.
AFM images of ST-400: (a) 3D morphology, (b) top view morphology, and (c) corresponding profile map of the particles.
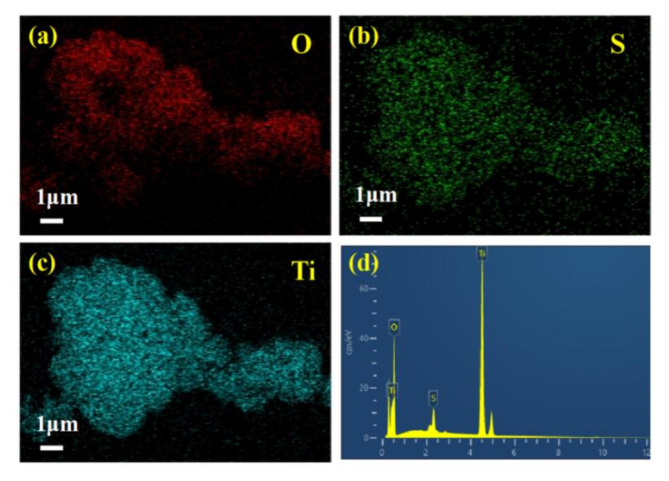
The elemental composition of the ST-400 sample was analyzed using EDS mapping (Fig. 6). As exhibited in Fig. 6a–c, O, S and Ti elements are observed and uniformly distribution in the ST-400 sample, which confirmed that S is doped into TiO2. A detailed elemental line scan (Fig. 6d) reveals a weight% of 2.03% for S, which is similar to the carbon-sulfur analysis.
Fig. 6.
EDS mapping of elements (a) O, (b) S, (c) Ti and (d) EDS spectrum of ST-400.
Optical properties
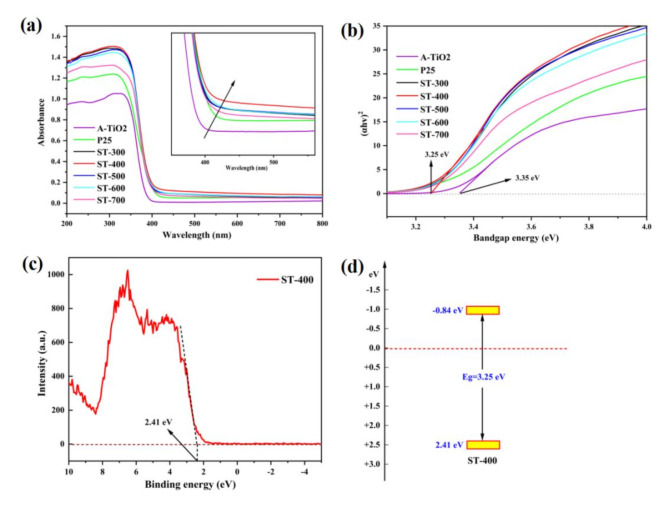
The optical properties was analyzed using UV-vis spectra. Considering that laboratory-prepared S-TiO2 samples were anatase TiO2, we added the test of commercial titanium dioxide (A-TiO2) for better comparison. As shown in Fig. 7a, all samples exhibit effective UV-light absorption. As depicted in the enlarged image (inset), the absorption spectra of each S-TiO2 shows increased absorption intensity in compared to P25 and A-TiO2. This is duo to the incorporation of S elements into the TiO2crystal structure44. High visible light absorption is a premise for high visible light photocatalysis. Additionally, the bandgap energy was estimated by the equation: (Ahν)2 = hν − Eg45,46 (see Fig. 7b). As displayed in Fig. 7b, the bandgap energies of ST-400 and A-TiO2are 3.25 eV and 3.35 eV, respectively. The ST-400 sample exhibits the lowest optical bandgap, which favors visible light response. This finding is attributed to the probable formation of hybridized states near the valence band due to S doping47. Figure 7c is the XPS valence band spectrum of ST-400, and the obtained valence band (VB) values are 2.41 eV. The corresponding band structures are illustrated in Fig. 7d.
Fig. 7.
(a) UV-vis spectra of catalyts and enlarged image (inset). (b) Their corresponding estimated band gaps. (c) XPS valence band spectrum of ST-400. (d) band structures of ST-400.
Photocatalytic properties and mechanism
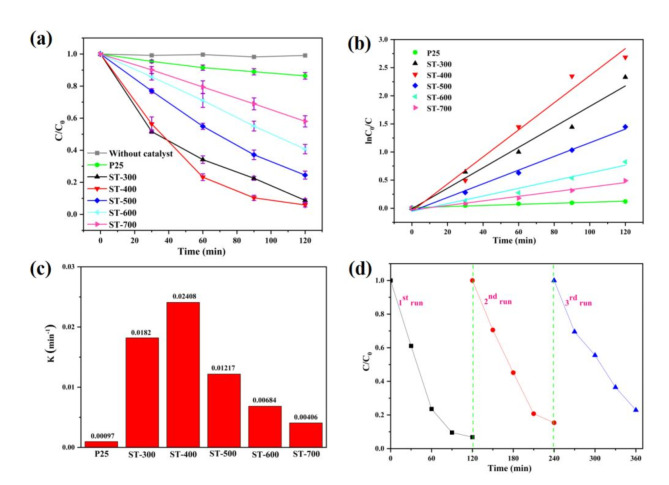
The photocatalytic degradation of Rh.B of different samples were manifested in Fig. 8. Apparently, only negligible Rh.B degradation could be observed without a catalyst (Fig. 8a). Compared to P25, all S-TiO2 exhibited better activity for degradation Rh.B. Meanwhile, the activity of S-TiO2 is significant effected by calcination temperature. Except for ST-400, the photocatalytic activity of S-TiO2 decreased gradually with the increase of calcination temperature. This is attributed to the synergetic effect of sulfur content, specific surface area, visible light absorption, et al. As seen from Fig. 8b, the linear dynamics curve of ln(C0/C) vs. time is consistent with the first-order dynamics of Langmuir-Hinshelwood (L-H) model48. The calculated rate constants for all catalysts are shown in Fig. 8c. Obviously, the ST-400 sample exhibits the highest rate constant (0.02408 min−1), much higher than the commercial P25 (0.00097 min−1). In general, the excellent activity of the ST-400 sample is attributed to its good crystallinity, larger specific surface area, and good light absorption. The photocatalytic activity in this work were comparable with other photocatalysts and shows relatively good activity (Table S1). The stability of the ST-400 photocatalyst was investigated by cycle experiments, and the results were revealed in Fig. 8d. The sample was recycled from the solution by centrifugation, washed and dried at 80 °C for 10 h between tests during cyclic stability. The photodegradation efficiency of Rh.B was 93.2%, 84.6%, and 77.1% in three cycles, respectively. The decrease in activity may be caused by partial inactivation of the catalyst. The efficiency decreases by only 16.1% after three cycles, which reveals the ST-400 sample has good stability.
Fig. 8.
(a) Comparison of photocatalytic activity for Rh.B (λ ≥ 420 nm, repeated three times). (b) Kinetic curves of different TiO2 samples. (c) Corresponding degradation rate constants. (d) Cycling stability of ST-400.
The chemical stability of ST-400 was also investigated by XRD and FT-IR. The XRD patterns (Fig. S2a) of the fresh and used ST-400 nearly remain the same, indicating the relatively higher stability of the prepared ST-400. As shown in Fig. S2b, the fresh ST-400 shows similar FT-IR spectra as those of the used ST-400, also indicating the higher stability of the prepared ST-40049.
Electrochemical performance of ST-400 and P25 were measured, and the results is revealed in Fig. S3. The transient photocurrent response curves are shown in Fig. S3a. It can be see that the ST-400 produced the higher photocurrent than P25, suggesting that the sample of ST-400 could efficiently transfer of photoexited charge carriers50. Fig. S3b illustrates the electrochemical impedance spectroscopy profiles (EIS) of ST-400 and P25. Compared with P25, ST-400 exhibited smaller radius of EIS, suggesting that the S-doping beneficial to the internal carrier transfer resistance and further speed up electron transport.
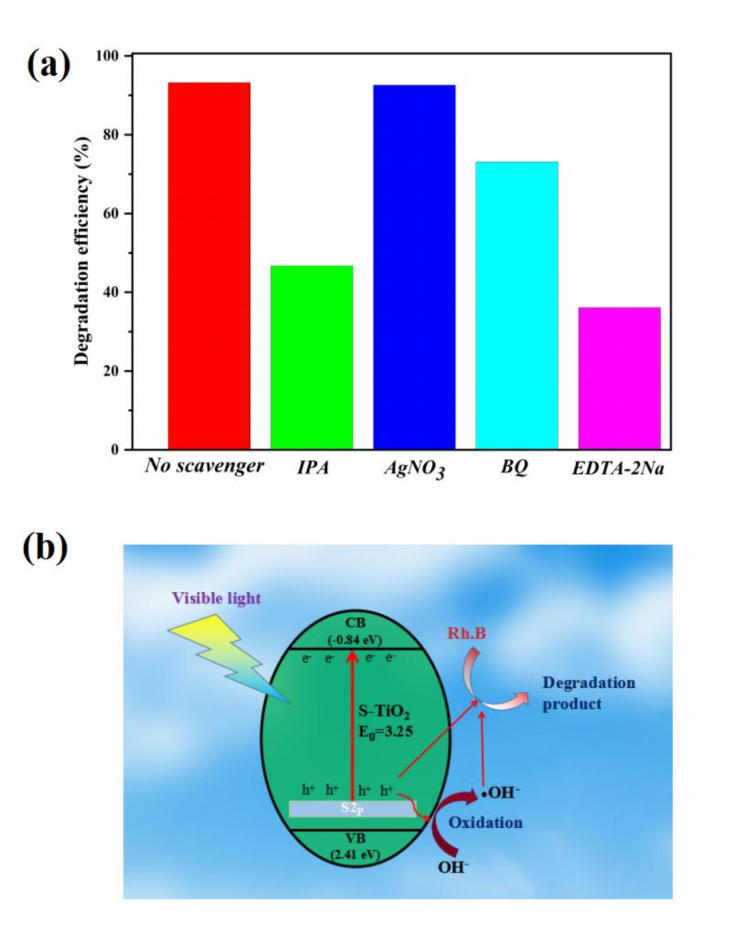
For identify the main reactive species of photocatalytic reaction, radical trapping experiments were conducted on the ST-400 photocatalyst using different scavengers (Fig. 9a). EDTA-2Na (1mM), IPA (1mM), BQ (1mM) and AgNO3 (1mM) were employed as scavengers for holes (h+), hydroxyl radical (·OH), superoxide radical (·O2−), and electrons (e−), respectively51. The degradation efficiency has almost no change after the incorporation of AgNO3, indicating that e− is not the reactive species. When BQ is added, the degradation efficiency decreases by only 20.1% (from 93.2 to 73.1%), suggesting that ·O2− is not the main reactive species. However, the degradation efficiency decreased significantly after the addition of EDTA-2Na and IPA, showing that h+ and ·OH are the main reactive species in the photocatalytic reaction.
Fig. 9.
Photocatalytic degradation of Rh.B over ST-400 without and with addition of different scavengers (a) and photocatalytic mechanism of ST-400 (b).
The possible photocatalytic mechanism of S-TiO2 is displayed in Fig. 9b. With incorporation of S into the TiO2lattice, new S 2p impurity energy level can be formed above the VB. This results in a decrease of bandgap and increased visible light response52,53. Thus, S-TiO2 can be easy stimulated by visible light to generate the electron/hole pairs. Electrons on the conduction band of S-TiO2 are donated to oxygen molecules to generating ·O2−54 and the holes generated in the VB are captured by OH−to form ·OH55. Meanwhile, the h+ on S-TiO2 has strong oxidizing ability and can directly degrade Rh.B. Therefore, Rh.B can be degraded by strong oxidants such as h+,·OH, and ·O2−, which were confirmed radical trapping experiments.
Conclusion
In this study, S-TiO2 was synthesized via a simple and straightforward hydrothermal route using low cost industrial TiOSO4 solution, and the influence of calcination temperature was investigated. The presence of the S element was strongly confirmed by instrument analysis. The calcination temperature had a significant impact on crystallinity, specific surface area, S content, and light absorption. XRD and Raman spectra were confirmed all prepared S-TiO2 exhibited only the anatase phase of TiO2 even after calcination at 700 °C, clearly certifying the excellent thermal stability of S-TiO2. The sample calcined at 400 °C revealed the highest activity, which is attributed to its good crystallinity, large specific surface area, and good light absorption. This study provides a simple method for synthesize of visible-light active S-TiO2 from low-cost raw material.
Electronic supplementary material
Below is the link to the electronic supplementary material.
Acknowledgements
This study was supported by the Applied Basic Research project of Sichuan Province, China (2017CY-G-20), Science and Technology Project of Panzhihua, China (2020ZD-G-9, Guiding Project), Green Catalysis Key Laboratory of Sichuan Province Open Fund project (LYJ2103),Natural Science Foundation of Sichuan Province (2022NSFSC0307).
Author contributions
HongPu wrote the main manuscript text, Congxue Tian guide the experimental analysis and Hui Zhang conduct guidance and review of article writing norms. All authors reviewed the manuscript.
Data availability
If someone wants to request the data from this study, please feel free to contact Hong Pu.
Declarations
Competing interests
The authors declare no competing interests.
Footnotes
Publisher’s note
Springer Nature remains neutral with regard to jurisdictional claims in published maps and institutional affiliations.
Contributor Information
Hong Pu, Email: puhong@pzhu.edu.cn.
Hui Zhang, Email: huizhang@swpu.edu.cn.
References
- 1.Li, Z., Wang, S., Wu, J. & Zhou, W. Recent progress in defective TiO2 photocatalysts for energy and environmental applications. Renew. Sust Energ. Rev.156, 111980 (2022). [Google Scholar]
- 2.Ali, A. M., Emanuelsson, E. A. C. & Patterson, D. A. Photocatalysis with nanostructured zinc oxide thin films: The relationship between morphology and photocatalytic activity under oxygen limited and oxygen rich conditions and evidence for a Mars Van Krevelen mechanism. Appl. Catal. B: Environ.97, 168–181 (2010). [Google Scholar]
- 3.Ali, A. M. & Emanuelsson, E. A. C. Conventional versus lattice photocatalysed reactions: Implications of the lattice oxygen participation in the liquid phase photocatalytic oxidation with nanostructured ZnO thin films on reaction products and mechanism at both 254nm and 340nm. Appl. Catal. B Environ.106, 323–336 (2011). [Google Scholar]
- 4.Zhang, H., Zhang, H., Zhu, P. & Huang, F. Morphological effect in photocatalytic degradation of direct blue over mesoporous TiO2 catalysts. ChemistrySelect2, 3282–3288 (2017). [Google Scholar]
- 5.Tayyab, M. et al. A new breakthrough in photocatalytic hydrogen evolution by amorphous and chalcogenide enriched cocatalysts. Chem. Eng. J.455, 140601 (2023). [Google Scholar]
- 6.Yue, W. H. et al. Schottky junction enhanced H2 evolution for graphitic carbon nitride-NiS composite photocatalysts. J. Colloid Interf Sci.657, 133–141 (2024). [DOI] [PubMed] [Google Scholar]
- 7.Tayyab, M. et al. Visible light-driven photocatalytic H2 evolution and dye degradation by electrostatic self-assembly of CdS nanowires on Nb2C MXene. Int. J. Hydrogen Energ.51, 1400–1413 (2024). [Google Scholar]
- 8.Tayyab, M. et al. One-pot in-situ hydrothermal synthesis of ternary In2S3/Nb2O5/Nb2C Schottky/S-scheme integrated heterojunction for efficient photocatalytic hydrogen production. J. Colloid Interf Sci.628, 500–512 (2022). [DOI] [PubMed] [Google Scholar]
- 9.Wang, X. et al. Solar light-driven photocatalytic destruction of cyanobacteria by F-Ce-TiO2/expanded perlite floating composites. Chem. Eng. J.320, 253–263 (2017). [Google Scholar]
- 10.Zhang, H. et al. Atomically dispersed ir catalysts exhibit support-dependent water oxidation kinetics during photocatalysis. Chem. Sci.14, 6601 (2023). [DOI] [PMC free article] [PubMed] [Google Scholar]
- 11.Fujishima, A., Rao, T. N. & Tryk, D. A. Titanium dioxide photocatalysis. J. Photoch Photobio C. 1, 1–21 (2000). [Google Scholar]
- 12.Nakata, K. & Fujishima, A. TiO2 photocatalysis: Design and applications. J. Photoch Photobio C. 13, 169–189 (2012). [Google Scholar]
- 13.Xing, Z. et al. Recent advances in floating TiO2-based photocatalysts for environmental application. Appl. Catal. B: Environ.225, 452–467 (2018). [Google Scholar]
- 14.Bingham, M. & Mills, A. Photonic efficiency and selectivity study of M (M = pt, pd, au and ag)/TiO2 photocatalysts for methanol reforming in the gas phase. J. Photochem. Photobiol A-Chem. 389, 112257 (2020). [Google Scholar]
- 15.Scarisoreanu, M. et al. Ag, au and pt decorated TiO2 biocompatible nanospheres for UV & vis photocatalytic water treatment. Appl. Surf. Sci.509, 145217 (2020). [Google Scholar]
- 16.Stengl, V., Houskova, V., bakardjieva, S. & Murafa, N. Photocatalytic activity of boron-modified titania under UV and visible-light illumination. ACS Appl. Mater. Inter. 2, 575–580 (2010). [DOI] [PubMed] [Google Scholar]
- 17.Elghniji, K., Ksibi, M. & Elaloui, E. Sol-gel reverse micelle preparation and characterization of N-doped TiO2: Efficient photocatalytic degradation of methylene blue in water under visible light. J. Ind. Eng. Chem.18, 178–182 (2018). [Google Scholar]
- 18.Zhang, X., Zhang, T., Ng, J. & Sun, D. D. High-performance multifunctional TiO2 nanowire ultrafiltration membrane with a hierarchical layer structure for water treatment. Adv. Funct. Mater.19, 3731–3736 (2009). [Google Scholar]
- 19.Fan, J., Zhao, L., Yu, J. & Liu, G. The effect of calcination temperature on the microstructure and photocatalytic activity of TiO2-based composite nanotubes prepared by an in situ template dissolution method. Nanoscale4, 6597–6603 (2012). [DOI] [PubMed] [Google Scholar]
- 20.Han, X., Kuang, Q., Jin, M., Xie, Z. & Zheng, L. Synthesis of Titania nanosheets with a high percentage of exposed (001) facets and related photocatalytic properties. J. Am. Chem. Soc.131, 3152–3153 (2009). [DOI] [PubMed] [Google Scholar]
- 21.Zhu, L. Y. et al. Synthesis of the 0D/3D CuO/ZnO heterojunction with enhanced photocatalytic activity. J. Phys. Chem. C. 122, 9531–9539 (2018). [Google Scholar]
- 22.Lin, Z., Yu, B. & Huang, J. Cellulose-derived hierarchical g-C3N4/TiO2 nanotube heterostructured composites with enhanced visible-light photocatalytic performance. Langmuir36, 5967–5978 (2020). [DOI] [PubMed] [Google Scholar]
- 23.Ramacharyulu, P. V. R. K., Kumar, J. P., Prasad, G. K. & Sreedhar, B. Sulphur doped nano TiO2: Synthesis, characterization and photocatalytic degradation of a toxic chemical in presence of sunlight. Mater. Chem. Phys.148, 692–698 (2014). [Google Scholar]
- 24.Devi, L. G. & Kavitha, R. Enhanced photocatalytic activity of sulfur doped TiO2 for the decomposition of phenol: A new insight into the bulk and surface modification. Mater. Chem. Phys.143, 1300–1308 (2014). [Google Scholar]
- 25.Geetha, S., Thangamani, A., Valliappan, R., Vedanayak, S. & Ganapathi, A. Sulfated titania (TiO2-SO42–) as an efficient and reusable solid acid catalyst for the multi-component synthesis of highly functionalized piperidines. Chem. Data Collect.30, 100565 (2020). [Google Scholar]
- 26.Xu, Y. H. et al. Correlation between photoreactivity and photophysics of sulfated TiO2 photocatalyst. Mater. Chem. Phys.92, 470–474 (2005). [Google Scholar]
- 27.Li, H., Li, G., Zhu, J. & Wan, Y. Preparation of an active SO42–/TiO2 photocatalyst for phenol degradation under supercritical conditions. J. Mol. Catal. A-Chem. 226, 93–100 (2005). [Google Scholar]
- 28.Fu, X., Zeltner, W. A., Yang, Q. & Anderson, M. A. Catalytic hydrolysis of dichlorodifluoromethane (CFC-12) on sol-gel-derived titania unmodified and modified with H2SO4. J. Catal.168, 482–490 (1997). [Google Scholar]
- 29.Yu, J., Xiang, Q. & Zhou, M. Preparation, characterization and visible-light-driven photocatalytic activity of Fe-doped titania nanorods and first-principles study for electronic structures. Appl. Catal. B: Environ.90, 595–602 (2009). [Google Scholar]
- 30.Yang, X., Jentoft, F. C., Jentoft, R. E., Girgsdies, F. & Ressler, T. Sulfated zirconia with ordered mesopores as an active catalyst for n-butane isomerization. Cataly Lett.81, 25–31 (2002). [Google Scholar]
- 31.Zhang, J., Li, M. J., Feng, Z. C., Chen, J. & Li, C. UV Raman spectroscopic study on TiO2. I. Phase transformation at the surface and in the bulk. J. Phys. Chem. B. 110, 927–935 (2006). [DOI] [PubMed] [Google Scholar]
- 32.Shin, E. et al. Preparation of K-doped TiO2 nanostructures by wet corrosion and their sunlight-driven photocatalytic performance. Appl. Surf. Sci.379, 33–38 (2016). [Google Scholar]
- 33.Appavu, B. & Thiripuranthagan, S. Visible active N, S co-doped TiO2/graphene photocatalysts for the degradation of hazardous dyes. J. Photoch Photobio A. 340, 146–156 (2017). [Google Scholar]
- 34.Shen, K. et al. One-step synthesis of band-tunable N, S co-doped commercial TiO2/graphene quantum dots composites with enhanced photocatalytic activity. RSC Adv.7, 23319–23327 (2017). [Google Scholar]
- 35.Delgado-Díaz, D. et al. N-S co-doped TiO2 synthesized by microwave precipitation method: Effective photocatalytic performance for the removal of organoarsenic compounds. J. Environ. Chem. Eng.9, 106683 (2021). [Google Scholar]
- 36.Zhang, H. et al. Infrared spectroscopic observation of oxo- and superoxo-intermediates in the water oxidation cycle of a molecular Ir catalyst. J. Am. Chem. Soc.146, 878–883 (2024). [DOI] [PubMed] [Google Scholar]
- 37.Qu, A. L. et al. High quantum yield graphene quantum dots decorated TiO2 nanotubes for enhancing photocatalytic activity. Appl. Surf. Sci.375, 230–241 (2016). [Google Scholar]
- 38.Guo, X. et al. Porous TiB2-TiC/TiO2 heterostructures: Synthesis and enhanced photocatalytic properties from nanosheets to sweetened rolls. Appl. Catal. B: Environ.217, 12–20 (2017). [Google Scholar]
- 39.Chastain, J. & King, R. C. Jr. Handbook of X-Ray Photoelectron Spectroscopy (Perkin-Elmer Corporation, London, 1992). [Google Scholar]
- 40.Yang, Q., Xie, C., Xu, Z., Gao, Z. & Du, Y. Synthesis of highly active sulfate-promoted rutile titania nanoparticles with a response to visible light. J. Phys. Chem. B. 109, 5554–5560 (2005). [DOI] [PubMed] [Google Scholar]
- 41.Hao, R., Wang, G., Jiang, C., Tang, H. & Xu, Q. In situ hydrothermal synthesis of g-C3N4/TiO2 heterojunction photocatalysts with high specific surface area for rhodamine B degradation. Appl. Surf. Sci.411, 400–410 (2017). [Google Scholar]
- 42.Peng, Y. et al. Preparation of porous TiO2 photocatalyts with different crystal phases and high catalytic activity by simple calcination of titanate nanofibers. RSC Adv.7, 45742–45745 (2017). [Google Scholar]
- 43.Ye, L. et al. Synthesis of anatase TiO2 nanocrystals with {101}, {001} or {010} single facets of 90% level exposure and liquid-phase photocatalytic reduction and oxidation activity orders. J. Mater. Chem. A. 1, 10532–10537 (2013). [Google Scholar]
- 44.Tachikawa, T. et al. Photocatalytic oxidation reactivity of holes in the sulfur- and carbon-doped TiO2 powders studied by time-resolved diffuse reflectance spectroscopy. J. Phys. Chem. B. 108, 19299–19306 (2004). [Google Scholar]
- 45.Liu, T. et al. Temperature-dependent water oxidation kinetics: Implications and insights. ChemRxiv. 10.26434/chemrxiv-2024-j5q6g (2024).
- 46.Ming, H. et al. Photocatalytic activation of peroxymonosulfate by carbon quantum dots functionalized carbon nitride for efficient degradation of bisphenol A under visible-light irradiation,Chem. Eng. J.424, 130296 (2021). [Google Scholar]
- 47.Kadam, A. N., Salunkhe, T. T., Kim, H. & Lee, S. W. Biogenic synthesis of mesoporous N-S-C tri-doped TiO2 photocatalyst via ultrasonic-assisted derivatization of biotemplate from expired egg white protein. Appl. Surf. Sci.518, 146194 (2020). [Google Scholar]
- 48.Nipane, S. V., Lee, S. W., Gokavi, G. S. & Kadam, A. N. In situ one pot synthesis of nanoscale TiO2-anchored reduced graphene oxide (RGO) for improved photodegradation of 5-fluorouracil drug. J. Mater. Sci. : Mater. Electron.29, 16553–16564 (2018). [Google Scholar]
- 49.Yu, X. et al. Efficient visible light photocatalytic antibiotic elimination performance induced by nanostructured Ag/AgCl@Ti3+-TiO2 mesocrystals. Chem. Eng. J. Volume. 403, 126359 (2021). [Google Scholar]
- 50.Tayyab, M. et al. A binary dumbbell visible light driven photocatalyst for simultaneous hydrogen production with the selective oxidation of benzyl alcohol to benzaldehyde. J. Colloid Interf Sci.665, 911–921 (2024). [DOI] [PubMed] [Google Scholar]
- 51.Yang, Y. et al. In-situ grown N, S co-doped graphene on TiO2 fiber for artificial photosynthesis of H2O2 and mechanism study. Appl. Catal. B: Environ.317, 121788 (2022). [Google Scholar]
- 52.Zhu, M. S. et al. New method to synthesize S-doped TiO2 with stable and highly efficient photocatalytic performance under indoor sunlight irradiation. ACS Sustainable Chem. Eng.3, 3123–3129 (2015). [Google Scholar]
- 53.Sara Ramandi, M. H., Entezari, N. & Ghows Sono-synthesis of solar light responsive S-N-C-tri doped TiO2 photo-catalyst under optimized conditions for degradation and mineralization of Diclofenac. Ultrason. Sonochem. 38, 234–245 (2017). [DOI] [PubMed] [Google Scholar]
- 54.Chatterjee, D. & Dasgupta, S. Visible light induced photocatalytic degradation of organic pollutants. J. Photochem. Photobiol. C6, 186–205 (2005). [Google Scholar]
- 55.Wang, D. H., Jia, L., Wu, X. L., Lu, L. Q. & Xu, A. W. One-step hydrothermal synthesis of N-doped TiO2/C nanocomposites with high visible light photocatalytic activity. Nanoscale4, 576–584 (2012). [DOI] [PubMed] [Google Scholar]
Associated Data
This section collects any data citations, data availability statements, or supplementary materials included in this article.
Supplementary Materials
Data Availability Statement
If someone wants to request the data from this study, please feel free to contact Hong Pu.


