Abstract
Affected by weakening effect of water in the goaf, the bearing capacity of coal pillar reduced, and coal pillar rock burst is prone to occur, which is a serious threat to mine safety in production. In order to study the equivalent width and stability of coal pillar in water-rich coal seam, taking the section coal pillar of a working face as the research object, combined with laboratory test, theoretical analysis, simulation and engineering practice, the stress, elastic core area width, damage degree and energy accumulation of 36 m water-immersed coal pillar and 26 m, 28 m, 30 m, 32 m, 36 m unimmersed coal pillars are analyzed. The research results show that: (1) The reasonable width of coal pillar under flooded and unflooded conditions is 36.09 m and 29.58 m, respectively. The width has been reduced by 6.51 m under flooded condition. The peak stress value in the goaf and the side of the working face and the range of stress curve in the elastic core area are similar between 36 m water-immersed coal pillar and 30 m unimmersed coal pillar. The bearing capacity of the two is equivalent, which is consistent with theoretical analysis. (2) The coupling relationship between flooding and damage of coal pillar can be divided into three stages with the increase of iteration times. Firstly, the flooding area in the early stage of the coal pillar is the damage area caused by the excavation working face, and the flooding rate is fast. Secondly, the mechanical parameters of the coal pillar decrease after water immersion, resulting in the increase of the damage area of the coal pillar. In turn, water permeates into the coal pillar, and the rate of immersion is slower. Finally, the flooded area of the coal pillar remains unchanged from the damaged area. (3) After the 36 m coal pillar was immersed in water, the peak stress of the side coal pillar in the goaf decreased by 7.66%. And as the number of iterations increases, the distance of the coal pillar “wedge” high energy area is gradually shortened. The damage rate experienced three stages: rapid, slow, and stopped increasing. The bearing capacity of coal pillar decreases after water immersion softening (4) The widths of the elastic core areas in the upper, middle and lower parts of the 36 m water-immersed coal pillar and 30 m unimmersed coal pillar are 20, 14.5, 12 m and 18, 14, 11 m respectively, which are relatively close and greater than the critical width of the coal pillar. The actual damage degree of both is greater than the critical damage degree. The elastic strain energy densities of coal pillars are 191 and 187 kJ/m3, respectively, showing wedge-shaped distribution. The carrying capacity of 36 m water-immersed coal pillar and 30 m unimmersed coal pillar is equivalent and stable. (5) Under the geological condition, the energy accumulation and distribution form of coal pillar with a width less than 30 m is “cup-shaped”. The risk of rock burst is higher. When the coal pillar is greater than 30 m, coal pillar energy is distributed in two “wedges”. The stability of coal pillar is enhanced, The risk of rock burst is reduced. The research can provide a reference for determining the reasonable width of section coal pillar in the water-rich rock burst coal seam in Binchang mining area.
Keywords: Water-immersed coal pillar, Equivalent width, Rock burst, Stability, Damage degree
Subject terms: Energy science and technology, Engineering
Introduction
With the depletion of coal resources in the eastern and central mining regions, China’s coal industry is increasingly shifting westward. Consequently, coal production in the western mining areas has risen annually, resulting in a significant increase in rock bursts in these regions.
The statistical results indicate that, as of 2023, there are 24 rock burst mines in Shaanxi Province1. The situation regarding rock burst disaster prevention and control is critical, significantly impacting the efficiency and productivity of the mines. Most of these rock burst mines are also affected by gas, water damage, dust, roof collapses, and other hazards, leading to a complex interplay of multiple disasters2. Taking the Binchang mining area as an example, the width of the coal pillar in the working face section typically ranges from 20 to 50 m. The high degree of stress concentration in the coal pillar makes it susceptible to coal pillar-type rock bursts. Accumulated water in the goaf causes internal damage to the coal body through physical, mechanical, and chemical processes, such as lubrication, softening, and mudding. The formation of cracks weakens various physical and mechanical properties of the coal pillar, thereby reducing the overall bearing capacity of the coal body and increasing the likelihood of coal pillar-type rock bursts3–5. Consequently, considering the requirements for water management and rock burst prevention, determining the appropriate width of the coal pillar section has become a critical issue in the mining design of water-rich rock burst mines. Numerous scholars have conducted extensive research on coal pillar rock bursts. Wang Cunwen et al.6 identified the mechanisms inducing coal pillar-type rock bursts by constructing a mechanical model that accounts for the shear of the surrounding rock and the fracturing of the coal body itself. Li et al.7 assessed the overall impact risk on coal pillars by establishing a mechanical model of the overlying strata on both sides of the coal pillars, which loads the coal pillars while incorporating working face parameters. Li Zhenlei et al.8 posited that fault slip and coal pillar failure can trigger rock bursts and proposed control measures to mitigate fault slip and reduce the impact of coal pillar failure. Maleki9 investigated the stress changes in surrounding rock before and after the impact of the coal pillar, concluding that the dynamic load generated by the fracturing of the overlying rock is transmitted to the coal pillar, inducing impact phenomena. Cao et al.10 examined the dynamic behavior of fault coal pillars and the frequent occurrence of strong mine earthquakes, proposing a mechanism for the dislocation impact of fault coal pillars. Zhang Xiufeng et al.11 also studied the dynamic behavior of fault coal pillars and the frequent occurrence of strong mine earthquakes, further elucidating the mechanism of fault coal pillar dislocation impact. Lu Zhiguo et al.12 studied the important factors affecting the post-peak characteristics of coal samples, which can provide valuable reference for the prevention and control of rock burst. While the aforementioned scholars have conducted relevant research on the mechanisms of coal pillar-type rock bursts, they have not adequately considered the influence of water accumulation in the goaf on the coal pillar in anti-impact sections. Previous studies have indicated that the physical and mechanical properties of coal pillars are significantly diminished due to water immersion. Liu Shaowei et al.13 utilized orthogonal testing and numerical simulations to determine the primary and secondary influencing factors on coal pillar stability for roadway protection, identifying water pressure, dip angle, and coal pillar width as critical factors. Yao Qiangling et al.14 proposed a formula for coal pillars under the combined effects of overlying strata pressure and water pressure by analyzing the mechanical limit equilibrium of reservoir coal pillar dams. Poulsen et al.15 developed a strength reduction numerical model for coal pillars based on experimental data. Gu Dazhao et al.16 concluded that water has an erosive effect on the coal pillar dam body, diminishing the strength of its structural components, and that the impact of water accumulation due to roof collapse is particularly destructive to the dam structure. Han et al.17 analyzed the effects of goaf water level height and coal pillar width on the stability of coal pillars, determining the critical goaf water level height corresponding to various coal pillar widths. Through numerical simulations, Li et al.18 proposed a method for determining the width of coal pillars by considering the interplay of seepage zones, elastic compaction water-blocking zones, and plastic zones. Liu Shiqi et al.19 introduced the concept of coal pillar damage degree and utilized it to analyze the failure characteristics of coal pillars after water immersion, finding that the damage degree increased by 15.5% after water immersion. Currently, scholars have conducted substantial theoretical research on the width of coal pillars in anti-impact sections and water-immersed coal pillars. However, few have thoroughly examined the effects of water immersion and softening caused by water accumulation in the goaf on the degree of damage reduction and the stability of coal pillars. Given the specific conditions of the working face, a 36 m coal pillar is particularly prone to inducing rock bursts. In light of this, this paper integrates the mechanical properties of coal samples with varying water saturation levels, establishes a calculation model for the width of the submerged coal pillar, and calculates the width of the 36 m coal pillar after water immersion.
The secondary development of FLAC 3D was conducted using the Fish language, and a seepage-stress coupling model was established. By identifying the failure state of the unit block after excavation, the permeability, porosity, water saturation, and mechanical parameters of the coal body were updated in a systematic manner. The coupling relationship between coal pillar immersion and damage with the increase of iteration times was obtained. Finally, the evolution law of the four aspects of the internal water immersion volume of the 36 m coal pillar, the proportion of the width of the elastic core area, the actual critical damage degree of the coal pillar, the area and size of the elastic strain energy accumulation with the increase of the number of iterations is obtained, and compared with unimmersed coal pillars with different widths. Based on this, the equivalent width and stability of unimmersed coal pillars and 36 m water-immersed coal pillars under different width conditions were studied. Finally, the above results are verified by engineering practice. The research can be used for reasonable setting of coal pillars in anti-impact section after water immersion in water.
Engineering geological conditions
Jianzhuang Mining is classified as a weak rock burst mine, with the 4− 2302 working face situated at the northwest boundary of the mine’s third panel. The strike length of this working face is 2,080 m, and it is buried at a depth ranging from approximately 450 to 740 m. To the south lies the 4− 2304 goaf, with a 36 m section of coal pillars left between the working faces. The coal thickness at the 4− 2302 working face varies from 2.7 to 12.1 m, averaging 7.5 m, while the dip angle ranges from 1 to 6 degrees, with an average of 3 degrees, indicating a nearly horizontal coal seam. The overall geological structure is characterized as a high syncline, with low-lying areas to the east and west, and the structural complexity is relatively low. The direct top and basic top consist of 11.16 m of mudstone and 5.64 m of siltstone, respectively, while the direct bottom and basic bottom comprise 4.41 m of mudstone and 5.73 m of aluminum mudstone, respectively. The mine employs a fully mechanized top coal caving method along with an all-caving approach to manage the roof.
There are 99,253 m2 and 173,213 m2 of water accumulation in the 477–1,150 m and 1,304–2,028 m depth ranges from the open-off cut in the 4− 2304 goaf, respectively. The internal damage caused by water immersion of the coal pillar reduces the bearing capacity of the coal pillar in these ranges. However, the specific extent of the damage has not yet been determined, which hampers the prevention and control of rock bursts in the mine. This research aims to ascertain the actual bearing capacity of the coal pillar after water immersion. Therefore, it is essential to conduct this study.
Water-rock softening experiment
The stress distribution within a coal pillar is influenced by its physical and mechanical properties, as well as the load distribution. As the overlying strata exert pressure, the internal defects within the coal pillar gradually increase, leading to macroscopic damage and alterations in the stress distribution. Consequently, studying the physical and mechanical properties of the coal body is crucial for evaluating the bearing capacity characteristics of coal pillars.
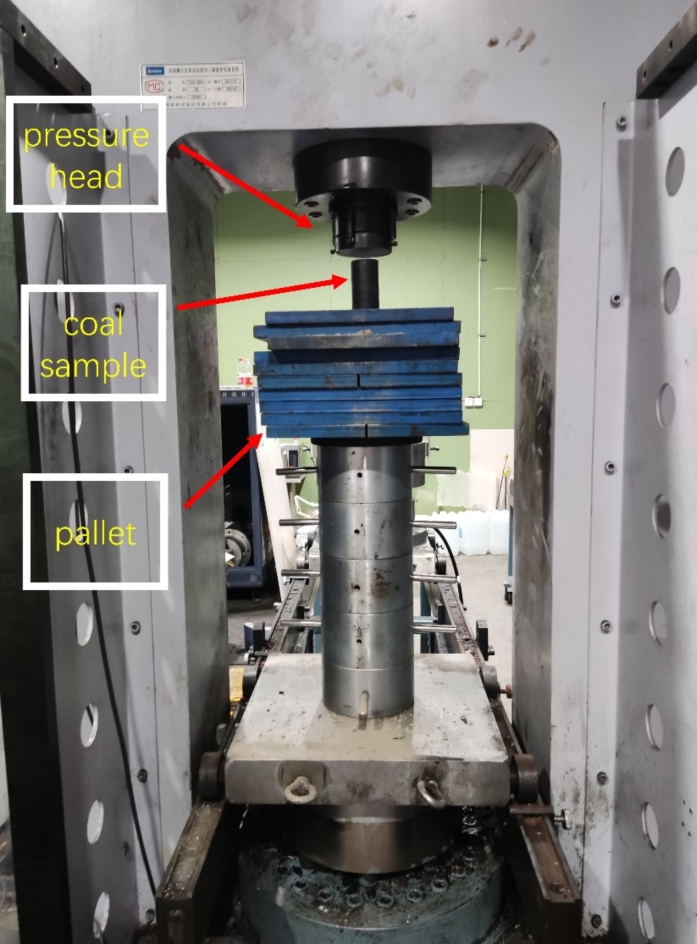
In order to investigate the weakening characteristics of the physical and mechanical properties of coal pillars under the influence of goaf water, raw coal samples from the mine were selected and processed into standard coal samples measuring φ100mm × 50 mm, φ50mm × 50 mm and φ50mm × 25 mm(see Fig. 1). A total of two groups were created, with 20 samples in each group, to fulfill the experimental requirements. The standard coal samples with varying levels of water saturation were obtained through a drying-immersing experiment. Subsequently, uniaxial compression and shear experiments were conducted using the Sinter-SAS-2000 (see Fig. 2) experimental system. This study examined the reduction in elastic modulus, internal friction angle, and cohesion of coal under different water-bearing conditions. The specific experimental steps are as follows:
The prepared coal sample was weighed.
Placed in a constant temperature drying oven for drying, take it out at regular intervals, weigh it, and record data.
Repeat the experimental steps (2). When the mass difference between the two times before and after the coal sample is less than 0.01 g, the coal sample is determined to be dry.
Put the coal sample into the water for soaking. At intervals, the coal sample is taken out, and then the water on the surface of the coal sample is wiped clean, weighed, and the data is recorded.
Repeat the experimental steps (4) until the weight change of each soaked coal sample does not exceed 0.01 g, which is regarded as the coal sample being in a saturated state.
The moisture content of the coal sample is calculated by the ratio of the mass difference before and after drying or soaking to the original mass of the coal sample.
The uniaxial compressive and shear tests were carried out on the specimens with different water contents.
Fig. 1.
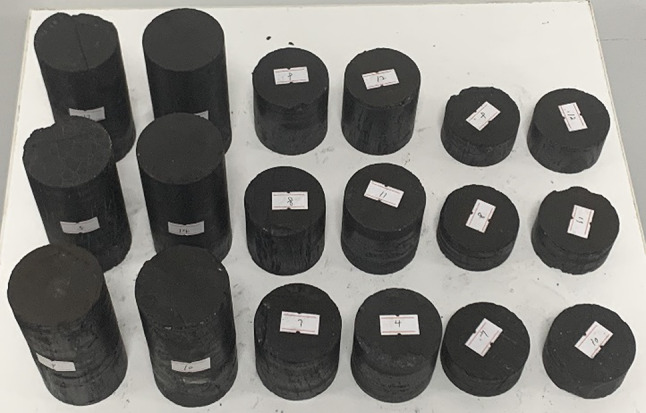
Part of the coal sample pictures.
Fig. 2.
Sinter-SAS-2000 multi-field coupled rock mass dynamic disturbance triaxial rheological experimental system.
Drying-water immersion test results
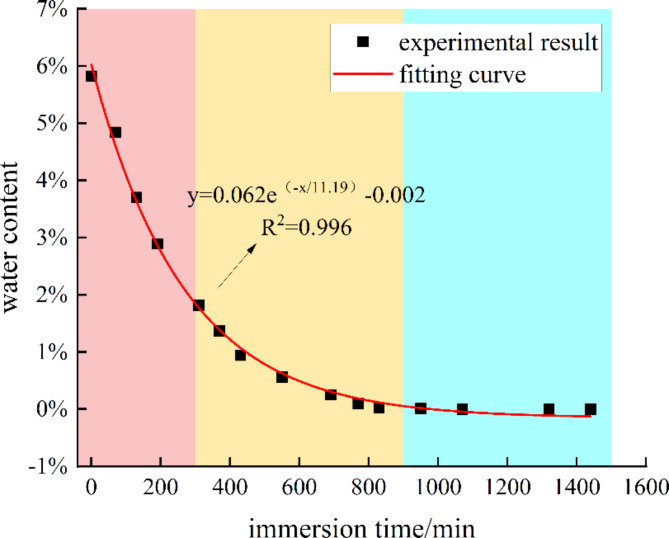
The relationship between water content and drying time of the coal sample is illustrated in Fig. 3. As drying time increases, the water content of the coal sample gradually decreases. The water loss behavior of the coal samples can be summarized as follows: From 0 to 300 min, the water content decreases from 5.82 to 1.82%, a reduction of 4%, indicating a rapid loss of water. From 300 to 900 min, the water content decreases from 1.82 to 1.00%, a decrease of 0.82%, with the rate of water loss gradually slowing down. From 900 to 1500 min, the coal sample completely loses its water content, and no further changes in water content occur. Additionally, by comparing the mass of the dried coal sample with that of the undried natural state coal sample, it is noted that the water content of the coal sample in its natural state is 5.82%.
Fig. 3.
The relationship between moisture content and drying time.
The relationship between the moisture content of coal samples and drying time can be described by an exponential function.
 |
1 |
Where x is the drying time, min; and y is the coal sample’s moisture content, %.
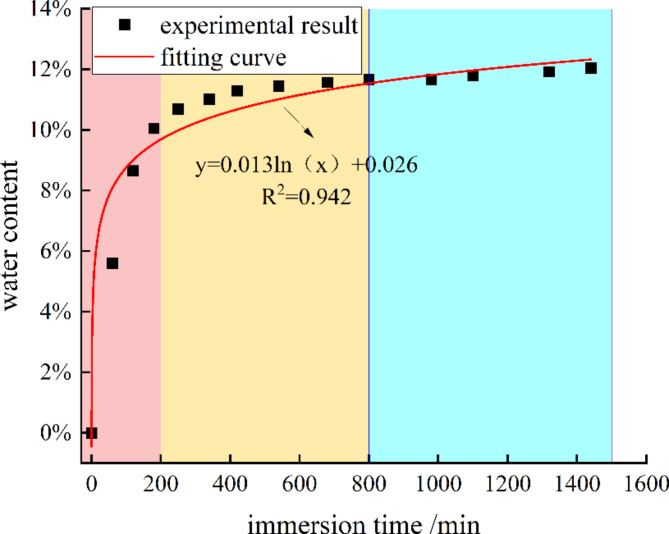
The relationship between water content and water immersion time for the coal sample is shown in Fig. 4. As the water immersion time increases, water content of the coal sample gradually increases, and the coal sample finally reaches a saturated water content of 12.03%. The water absorption law of coal samples can be summarized as follows : in the first 0 ~ 200 min, the water content increases from 0 to 10.05%, an increase of 10.05%, and the water absorption is rapid ; from 200 to 800 min, the water content increased from 10.05 to 11.67%, an increase of 1.62%, and the water absorption rate gradually slowed down. Following a duration of approximately 800 to 1500 min, the coal sample exhibited a sustained absorption of water, resulting in a gradual attainment of saturation in its water content.
Fig. 4.
The relationship between moisture content and drying time.
The relationship between the moisture content of coal samples and the duration of drying is described by an exponential function.
 |
2 |
Where x is the drying time, min; and y is the coal sample’s moisture content, %.
Upon drying the coal sample in a dryer, it reaches a desiccated state, resulting in the loss of moisture contained within its inherent fissures. As the coal sample is progressively submerged in water, free water infiltrates the sample through its natural cracks, leading to a rapid initial rate of water absorption. Subsequently, as the fissures become increasingly saturated, the free water begins to permeate the finer pore structures of the coal sample. At this stage, the rate of water absorption gradually diminishes, approaching a state of near saturation. Ultimately, after an extended period of immersion, the moisture content of the coal sample reaches saturation, with minimal change in the overall mass of the sample.
To investigate the impact of varying water content on the physical and mechanical characteristics of coal, it is essential to establish an appropriate water immersion duration. This study aims to elucidate the condition of coal pillars after water immersion from a microscopic perspective.
Experimental results of strength parameters of coal samples
In order to facilitate subsequent analysis, the water content is converted into water saturation.
 |
3 |
Where SW represents the function of saturation, Wi denotes the present water content, and Wt signifies the saturated water content.
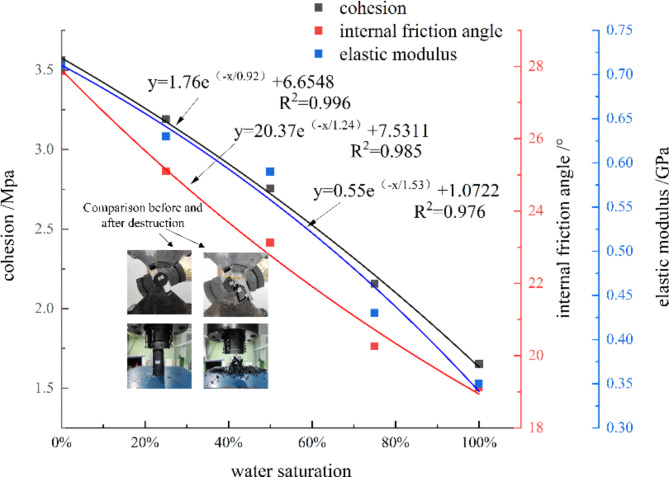
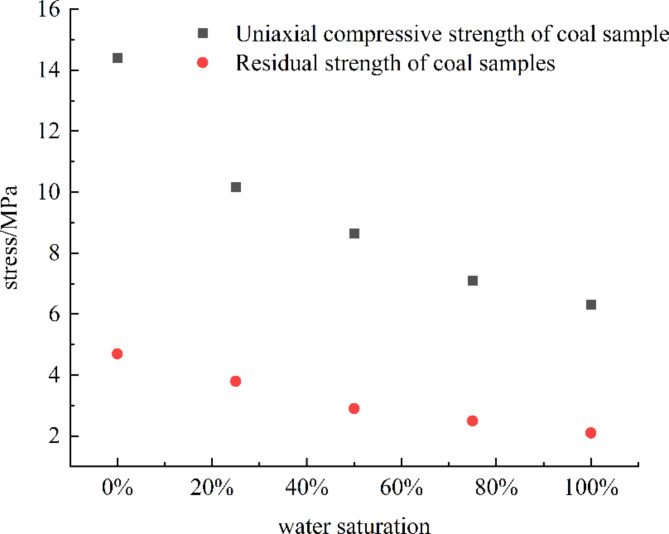
Figures 5 and 6 illustrate a negative correlation between various mechanical properties of coal samples—including elastic modulus, cohesion, internal friction angle, uniaxial compressive strength, and residual strength—and the degree of water saturation. Specifically, the cohesion of saturated specimens decreased from 3.5 MPa to 1.6 MPa, representing a reduction of 53%. The internal friction angle exhibited a decline from 27.87° to 19.11°, amounting to a 31% decrease. Additionally, the elastic modulus diminished from 0.71 MPa to 0.35 MPa, reflecting a 51% reduction. The uniaxial compressive strength also decreased from 14.4 MPa to 8.64 MPa, which corresponds to a 56% decline. Notably, the reduction in the internal friction angle is less pronounced compared to the decreases observed in cohesion and elastic modulus under saturated conditions, suggesting that the internal friction angle of coal samples is relatively less susceptible to the weakening effects of water.
Fig. 5.
Relationship between water saturation and coal strength parameters1.
Fig. 6.
Relationship between water saturation and coal strength parameters2.
Softening coefficient of mechanical parameters of water-immersed coal pillars
The strength softening coefficient of a coal sample is defined as the ratio of its water content to the uniaxial compressive strength of a dry coal sample. This coefficient serves as an indicator of the extent to which water compromises the strength of the coal. It is calculated by multiplying the ratio of the strength of a saturated coal sample to that of a dry coal sample by 100%20. To elucidate the diminishing effect of varying water saturation levels on the mechanical properties of coal samples, this study introduces softening coefficients for elastic modulus, cohesion, and internal friction angle, employing a similar methodology. The specifics are outlined as follows:
Softening coefficients for uniaxial compressive strength, elastic modulus, cohesion, and internal friction angle:
 |
4 |
Where DRC represents the softening coefficient of the elastic modulus of coal samples subjected to varying levels of water saturation. The parameters RCW and RC0 denote the uniaxial compressive strength of coal samples under different water saturation conditions and in a dry state, measured in megapascals (MPa). Additionally, DE signifies the softening coefficient of the elastic modulus of coal samples at different water saturation levels, while EW and E0 correspond to the elastic modulus of coal samples under varying water saturation and in a dry state, respectively, also expressed in MPa. Furthermore, DC indicates the cohesion softening coefficient at different water saturation levels, with CW and C0 representing the cohesion of coal samples under varying water saturation and in a dry state, measured in MPa. Lastly, DΦ refers to the softening coefficient of the internal friction angle at different water saturation levels, with ΦW and Φ0 denoting the internal friction angle of coal samples under varying water saturation and in a dry state, measured in degrees (°).
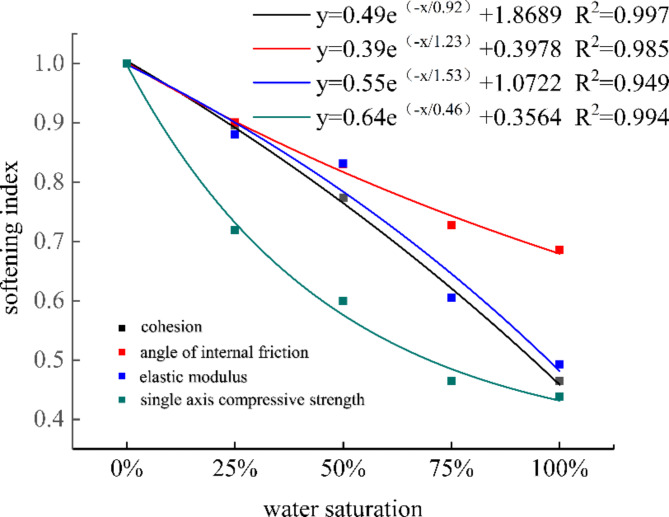
The elastic modulus, cohesion, internal friction angle, and uniaxial compressive strength of coal samples at varying levels of water saturation are incorporated into formula (4). The resulting fitting curve is illustrated in Fig. 7.
Fig. 7.
Relationship between water saturation and weakening coefficient of coal sample strength parameter.
In conclusion, the equation representing the fitting function of the strength softening coefficient for coal samples subjected to varying levels of water saturation is presented in Eq. (5).
 |
5 |
Where x is water saturation, %.
Through the experiments conducted, the softening characteristics of the elastic modulus, internal friction angle, and cohesion of coal samples under varying levels of water saturation were examined. This study provides a relevant basis for determining the width of water-immersed coal pillars and for conducting numerical simulations.
Equivalent width of water-immersed coal pillars
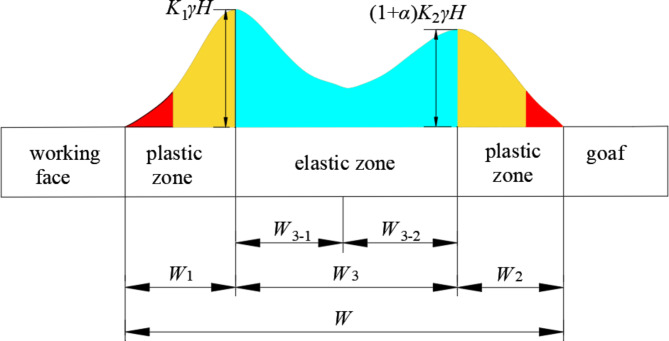
The water reduces the bearing capacity of the coal pillar and induces the coal pillar-type rock burst mainly through the following process: the mechanical parameters such as the internal friction angle, cohesion and elastic modulus of the coal body are reduced by the soaking of the water in the goaf, which reduces the mechanical properties of the coal pillar18. As the bearing capacity decreases, the side coal pillars in the goaf cannot effectively support the pressure of the overlying strata, and the stress is transferred to the deep part of the coal pillars. As a result, the effective bearing width of the coal pillar is greatly reduced. When the stress in the elastic core area of the coal pillar exceeds its critical value, sudden rupture and energy release will occur, and the powerful impact force will be released instantly, resulting in coal pillar-type rock burst. In the design of water-immersed coal pillars, it is essential to consider the long-term weakening effects of water on the mechanical properties of the side coal pillars located in the goaf. Additionally, geological factors such as lateral support pressure, the stress exerted by overlying strata, and the thickness of the coal seam must be taken into account21–23. Based on their structural state, coal pillars can be categorized into three distinct zones: the broken zone, the plastic zone, and the elastic core area24–26. The broken and plastic zones are collectively referred to as the limit equilibrium zone27. This region is characterized by a significant presence of pores and fissures, which facilitate the flow of accumulated water from the goaf into the coal pillar through various water-conducting channels. Consequently, the coal pillar undergoes a process of water immersion and softening, leading to a reduction in its mechanical properties and a subsequent decrease in its load-bearing capacity. However, the precise extent of this damage remains undetermined, complicating efforts to mitigate rock bursts within the mine. Therefore, a thorough analysis of the coal pillar’s width is warranted. At the interface between the plastic zone and the elastic core area, vertical stress reaches its maximum. The peak lateral support stress on the goaf and working face is represented as (1 + α)K1γH, K2γH. The widths of the various zones within the coal pillar are calculated, allowing for the determination of an appropriate size for the coal pillar under both unimmersed and water-immersed geological conditions. The calculation model for the width of water-immersed coal pillars is illustrated in Fig. 8.
Fig. 8.
Calculation model for the immersed coal pillar width.
In the Fig. 8, the total width of W-coal pillar, m ; W1-the width of the limit equilibrium zone on the working face side, m ; W2-the limit equilibrium zone width of the water accumulation side of the goaf, m ; W3-elastic core area width, m ; H-coal seam buried depth, m ;γ-overburden rock bulk density, N/m3 ; K1, K2-stress concentration factor.
According to previous studies14, the formula for calculating the width of the limit equilibrium zone W4 in the goaf side of the unimmersed coal pillar is :
 |
6 |
Where, φ1 is the internal friction angle of the unimmersed coal pillar, ° ; λ is the lateral pressure coefficient ; M is the thickness of coal seam, m ; ρ is the average density of overlying strata, kg/m3 ; g is the acceleration of gravity, N / kg ; σc1 is the uniaxial compressive strength of unimmersed coal, MPa ; σr1 is the residual strength of the unimmersed coal, MPa ; Sm is the softening modulus of coal, MPa ; Sg is the strain gradient of coal in plastic zone.
The calculation formula of the limit equilibrium zone width W2 at the goaf side of the water-immersed coal pillar is as follows:
 |
7 |
 |
8 |
Where, φ2 immersion coal pillar internal friction angle, °; σc2 is the uniaxial compressive strength of water-immersed coal, MPa; σr2 is the residual strength of water-immersed coal, MPa; p is the hydrostatic pressure of the coal pillar on the water accumulation side of the goaf, MPa.
Similarly, the width of the limit equilibrium zone on the side of the coal pillar working face W1 is:
 |
9 |
Where, P1 is the constraint force of coal pillar on the side of working face, MPa.
The width of unimmersed coal pillar is Wd:
 |
10 |
The width of water immersion coal pillar is Wi:
 |
11 |
The basic requirement for the stability of coal pillars is that the width of the elastic core area W3 should be at least twice the height of the coal pillar after the deformation of the plastic zone on both sides of the coal pillar28.
 |
12 |
According to the geological situation of the mine and the mechanical experiment of the coal sample, the relevant parameters of the working face are determined. Where, ρ1 is the density of water, take 1000 kg / m3; H = 640 m, M = 7.5 m, ρ = 2500 kg / m3, λ = 2.5, φ1 = 28 °, φ2 = 19 °, C1 = 3.5MPa, C2 = 1.6MPa, K1 = 3.2, K2 = 3.1, Sm = 800MPa, Sg = 0.08, p = 0.075MPa, σc1 = 14.4MPa, σc2 = 6.3MPa, σr1 = 4.7MPa, σr2 = 2.1 MPa. Substituting into Eqs. (6), (8) and (9), W1 = 7.32 m, W2 = 13.77 m, W4 = 7.25 m. The width of coal pillar is 36.09 m and 29.58 m respectively under the condition of water immersion and non-water immersion in goaf, and the bearing capacity is equivalent. Compared with the immersion condition, the width of the unimmersed coal pillar is reduced by 6.51 m.
Numerical model and research scheme
Strength softening procedure of water-immersed coal pillar
In the simulation process, the three parameters of internal friction angle, cohesion, and elastic modulus are selected for key research, which is the result of comprehensive consideration. The matching of the previous test results with the numerical simulation can improve the simulation accuracy (As shown in Eq. 5.). These three parameters have a significant impact on the mechanical properties of the model and play a key role in the simulation. For example, the internal friction angle and cohesion affect the shear strength, and the elastic modulus is a key parameter to measure the ability of coal pillars to resist deformation. When the coal pillar bears the pressure of the upper rock stratum, the elastic modulus determines the load that the coal pillar can bear in the elastic deformation stage. On the other hand, other parameters have limitations. Some parameters are difficult to accurately measure in practical engineering, and some have little effect on the overall results in specific simulation situations, so they are not considered.
Fluid-solid coupling program of coal pillar.
In practical engineering applications, the simultaneous occurrence of seepage and mechanical processes poses a significant challenge in determining the appropriate number of interval steps for numerical simulations of fluid-solid coupling. This challenge is particularly pronounced at the engineering scale, especially in scenarios involving severe mining damage, where achieving a comprehensive coupling between numerical simulations and real-time calculations is difficult. Within the mining context, the degradation of coal and rock strength due to prolonged water immersion is more closely aligned with engineering practices. Currently, there is a scarcity of experimental research focused on long-term (exceeding one year) water-rock softening experiments, resulting in a lack of quantitative relationships between the duration of water immersion and coal strength. Additionally, factors such as model size and meshing further complicate the alignment of numerical simulation time with real-time conditions29. The relationship between the convergence of numerical simulation and time. When the numerical simulation reaches the convergence state, it usually means that the simulated physical process reaches a relatively stable stage. For example, when simulating the fluid-solid coupling problem in this paper, after a certain number of iterations, the coal pillar water immersion area no longer changes significantly. Then, it can be considered that the seepage field has reached convergence. By analyzing the number of iterations and the corresponding physical process time under different convergence conditions, the relationship between the number of iterations and time can be established. Therefore, although the numerical simulation cannot accurately correspond to the specific time point, it can present the coal pillar characteristics of roughly different time stages in the process of coal pillar soaking (Fig. 9).
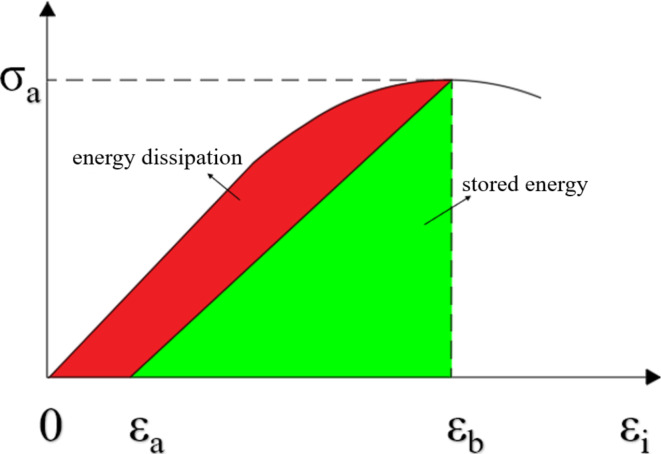
Fig. 9.
Stress-strain curves of coal loading and unloading.
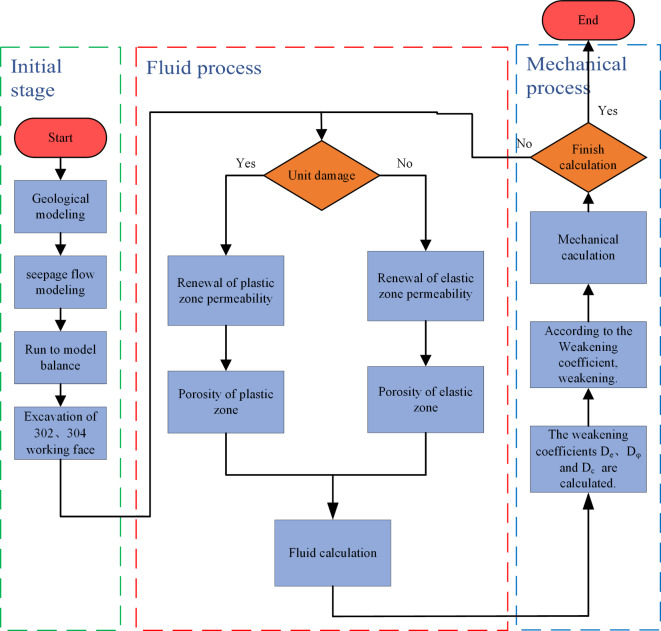
In this study, we examine the relationship between water saturation, the number of iterations, and the strength of coal and rock masses in the context of water immersion-induced weakening. To further investigate the extent of damage and the stability of the bearing capacity of coal pillars following water saturation, we have developed a fluid-solid coupling simulation program for water-immersed coal pillars, as illustrated in Fig. 10. Initially, we delineate the damage zones of the coal pillar post-excavation and assess the permeability characteristics of various regions within the coal pillar. Subsequently, we determine the seepage areas through fluid dynamics, which leads to the attenuation of mechanical parameters in the saturated regions. Finally, we conduct a mechanical analysis of the submerged coal pillar. The permeability of the elastic and yield state regional unit blocks is computed based on the relationships established in reference30.
Fig. 10.
Fluid-structure coupling simulation program of submerged coal pillar.
The equations (13) to (17) are integrated into the FLAC 3D software using the FISH programming language to develop a numerical model for secondary analysis. It has been determined that parameters such as permeability, porosity, and water saturation of the coal pillar are dynamically adjusted based on the yield state and stress distribution characteristics of the coal pillar. Given the conditions of water-saturated coal pillars, Eq. (5) is utilized to modify the mechanical parameters of coal pillars situated in water-saturated regions, considering varying levels of water saturation. These parameters include the elastic modulus, internal friction angle, and cohesion.
 |
13 |
 |
14 |
Where, KE and Ks are the permeability of elastic core area and plastic zone of coal pillar respectively ; the maximum principal stress of coal pillar, MPa.
The porosity of coal pillar can be obtained according to the permeability, as follows:
 |
15 |
Where, Φ0 and Φ are the porosity of the block before and after deformation ; K0 and K are the permeability before and after block deformation, respectively.
The calculation formula of coal water saturation :
 |
16 |
Where, SW is water saturation ; ρS and ρd are the density of coal samples in saturated and dry state, respectively, kg / m3 ; ρf is fluid density, kg / m3.
-
(2)
Coal pillar damage degree.
Utilizing the fluid-solid coupling model, the extent of damage to the coal pillar following immersion is quantified using Eq. (21).
Zhang et al.24 characterize the damage degree of the coal pillar as the ratio of the volume of the failure area to the total volume of the coal pillar. The failure mechanisms are categorized into tensile and shear failures, with the tensile failure criterion and the Mohr-Coulomb criterion serving as the foundational principles for assessing these types of failures, respectively. Both criteria utilize strain as the independent variable31, necessitating the identification and determination of the strain level within the coal body through numerical simulations. A strain threshold of 0.002 is established; if the strain of the coal pillar exceeds this value, the area is classified as damaged; conversely, it is considered undamaged if the strain is below this threshold. The cumulative damage volume for each unit block is calculated to derive the total damage volume of the coal pillar. Simultaneously, the total volume of the coal pillar is determined, and the calculation of the damage degree is expressed in Eq. (17).
 |
17 |
Where, i is the degree of damage ; vi and va are the volume of the damaged unit block and the volume of the unit block in the coal pillar area, respectively. n and m are the number of damaged unit blocks and all unit blocks in the coal pillar area, respectively.
-
(3)
Coal pillar energy.
The total energy stored prior to the excavation of coal is represented in Eq. (18). The excavation process disrupts the original equilibrium state of energy distribution within the coal body. When the failure of coal pillar unit blocks reaches a critical threshold, it leads to the macroscopic failure of the coal pillar. As energy accumulates and is subsequently released, the energy associated with the coal at the working face manifests as coal damage, as illustrated in the red area of Fig. 9. Conversely, this energy is also stored as elastic strain energy within the coal pillar, depicted in the green area of the Fig. 9. The quantification of the energy stored in the coal pillar can be derived from Eq. (19). Variations in the width of the coal pillar result in differing amounts of elastic strain energy and levels of accumulation. If the width is excessively large, it may trigger a rock burst in the coal pillar.
 |
18 |
Where, U is the total input energy of the outside world, εa and εb are the corresponding strain values when the stress is 0 and  respectively.
Combined with the elastic strain energy density formula of rock mass under three-dimensional stress state32, the elastic strain energy accumulated in the coal pillar unit block is calculated :
 |
19 |
Where, σ1, σ2, σ3 respectively, the first, second and third principal stress ; E0 is the elastic modulus of coal ; µ is the Poisson ‘s ratio of coal.
The formula (19) is embedded in FLAC 3D by fish language to obtain the elastic strain energy accumulation characteristics of coal pillars with different widths.
Numerical model
Fluid-solid coupling calculation model
The Mohr-Coulomb model is used in FLAC 3D software, and the Mohr strength theory can fully reflect the strength characteristics of rock and soil (such as the tensile strength of rock and soil is far less than the compressive strength). This theory is applicable to both brittle materials and plastic materials. In the simulation of the interaction between coal rock mass and water, the coal rock mass is regarded as a porous medium, and the flow of water in the porous medium conforms to Darcy’s law. At the same time, the Biot’s fluid-solid coupling equation is satisfied, and the partial differential equation is as follows:
 |
20 |
Where λ, G are the first and second Lame constants; p is pore pressure; εv is the coordinate, displacement and volume force of the body strain, xj, uj and fxj in the j direction, respectively. K is the permeability coefficient;  is Laplace operator; S is the elastic drainage coefficient;
  reflects the influence of seepage field on coal and rock mass. The pore pressure generated by water flow affects the effective stress of coal and rock mass and causes deformation and failure. The term
  reflects the influence of volume deformation of coal and rock mass on seepage field. Biot ‘s fluid-solid coupling equation considers the interaction between solid skeleton and pore fluid in porous media, and can accurately describe the mechanical behavior under seepage and stress.
Mechanical parameters of coal and rock mass
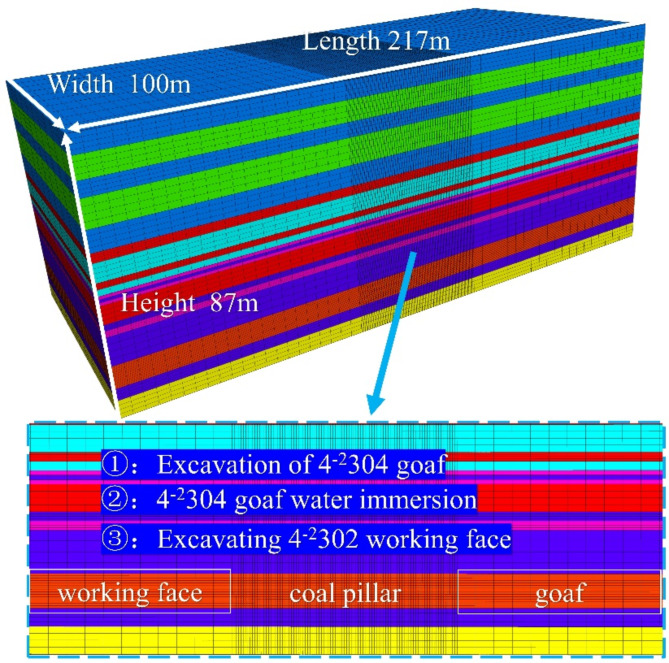
Utilizing relevant geological data from the mine, the dimensions of the model are established as 217 m × 100 m × 87 m. The Mohr-Coulomb failure criterion is employed for this analysis. A vertical stress of 15 MPa is applied at the upper boundary of the model to replicate the pressure exerted by the overlying strata. The lateral pressure coefficient is set at 1.2, resulting in a horizontal stress of 18 MPa. After stabilizing the initial model, the excavation of the 4− 2304 goaf and the 4− 2302 working face is conducted, with the establishment of unimmersed coal pillars measuring 26, 28, 30, 32, and 36 m, alongside immersed coal pillars of 36 m. This study focuses on the distribution of vertical stress, the ratio of elastic core area width, the degree of damage, and energy accumulation. The physical and mechanical parameters of the coal and rock are detailed in Table 1, while the numerical model is illustrated in Figs. 11 and 12.
Table 1.
Physical and mechanical parameters of coal-rock mass.
| Lithology | Density /kg·m-3 | Bulk modulus /GPa | Shear modulus /GPa | Cohesion /MPa | Internal friction angle / (°) |
Tensile strength /MPa |
|---|---|---|---|---|---|---|
|
Sandy mudstone |
2640 | 4.2 | 3.65 | 4.2 | 31.3 | 2.5 |
|
Fine particles sandstone |
2470 | 6.3 | 3.6 | 7.2 | 33 | 4.3 |
|
Medium grain sandstone |
2600 | 3.1 | 6.2 | 8.5 | 38 | 2.8 |
|
Coarse grain sandstone |
2540 | 7.4 | 6.6 | 10.4 | 40 | 2.4 |
| Mudstone | 2620 | 4.4 | 3.7 | 5.2 | 32 | 1.6 |
|
Muddy silt sandstone |
2550 | 4.7 | 3.5 | 5.6 | 35 | 2.4 |
| Silty sandstone | 2570 | 5.6 | 3.7 | 6.0 | 40 | 3.6 |
| Coal | 1800 | 2.1 | 0.5 | 2.7 | 32 | 1.4 |
Fig. 11.
Numerical calculation model and simulated mining sequence.
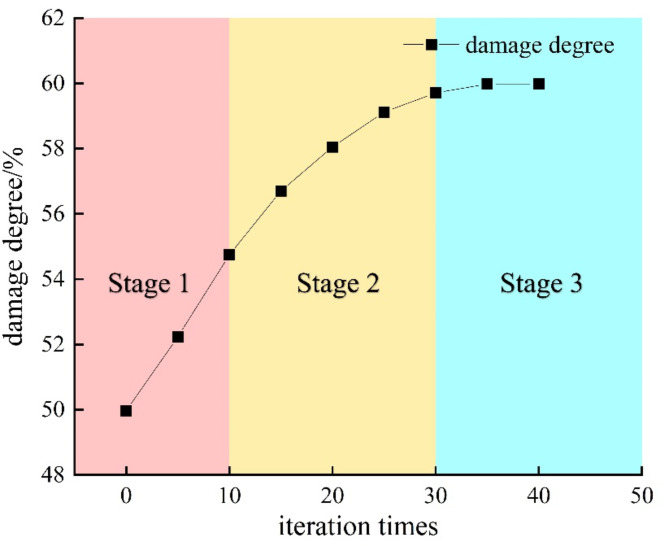
Fig. 12.
Evolution law of coal pillar damage degree.
Water immersion damage of coal pillar
Figure 13 illustrates the correlation between the immersion of coal pillars and the number of iteration cycles. Upon reaching a stable state for the 36 m coal pillar, the immersion depths for the upper, middle, and lower sections are recorded at 14 m, 13 m, and 10.5 m, respectively. Based on the iteration count, the process of water immersion in the coal pillar can be categorized into three distinct stages.
Fig. 13.
Diagram of the water seepage area of the coal pillar.
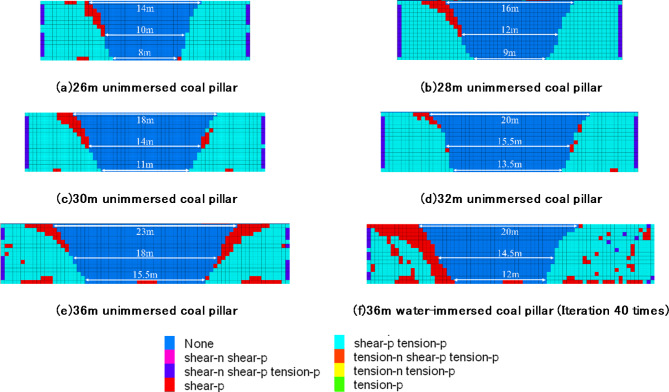
According to Figs. 12, 13 and 14, when the number of iterations in the first stage ranges from 0 to 10, the immersion lengths of the upper, middle, and lower sections of the coal pillar are 7 m, 11 m, and 11.5 m, respectively. This represents increases of 66%, 85%, and 82%, respectively. The early water immersion area of the coal pillar is the failure zone caused by the excavation face, characterized by high permeability and a large volume, which results in a rapid water immersion rate. Following the immersion of goaf water, the cohesion, internal friction angle, and elastic modulus of the coal pillar decrease, as described by Formula (5). Consequently, the overall strength of the coal pillar diminishes, and the width of the elastic core area in the upper, middle, and lower sections decreases from 23 m, 18 m, and 15.5 m to 22 m, 16.5 m, and 14.5 m, respectively. The degree of damage to the coal pillar increased from 49.97 to 54.74%, reflecting an increase of 4.77%.
Fig. 14.
Elastic core distribution of coal pillar.
In the second stage, when the number of iterations ranges from 10 to 30, the water immersion lengths of the upper, middle, and lower sections of the coal pillar increase from 7 m, 11 m, and 11.5 m to 10 m, 13 m, and 14 m, respectively. This represents increases of 28%, 15%, and 18%. During this stage, the rate of water immersion into the coal pillar slows down. As the coal’s strength diminishes due to water immersion, the volume of the weakened coal pillar gradually increases, leading to a redistribution of stress that transfers deeper into the coal pillar. Consequently, the failure area of the coal pillar expands, and the water immersion range increases. However, the prolonged number of iterations results in a slower water immersion rate. Additionally, the width of the elastic core area in the upper, middle, and lower sections of the coal pillar decreases from 22 m, 16.5 m, and 14.5 m to 20.5 m, 15 m, and 12.5 m, respectively. The degree of damage to the coal pillar increases from 54.74 to 59.70%, reflecting an increase of 4.96%.
In the third stage, after 30 to 40 iterations, the immersion length of the upper section of the coal pillar increases by 0.5 m, while the middle and lower sections cease to grow. The width of the elastic core area in the upper, middle, and lower sections of the coal pillar decreased from 20.5 m, 15 m, and 12.5 m to 20 m, 14.5 m, and 12 m, respectively. Concurrently, the damage degree of the coal pillar increased from 59.70 to 59.97%, representing an increase of 0.27%. At 35 iterations, the water pressure gradient of the coal pillar falls below the initial pressure gradient, causing the volume of the water immersion area to stabilize. Consequently, the width and damage degree of the elastic core area remain unchanged.
The immersion zone displays a trapezoidal distribution, with the volume of the coal pillar immersion area increasing as the number of iterations rises. Simultaneously, the degree of damage to the coal pillar intensifies in response to the expanding volume of the immersion area. This damage, in turn, promotes further increases in the water immersion volume, indicating a reciprocal relationship between the two factors. The rate of damage to the coal pillar follows a pattern characterized by three distinct phases: rapid, slow, and stabilization.
Equivalent width of coal pillar
Stress equivalence
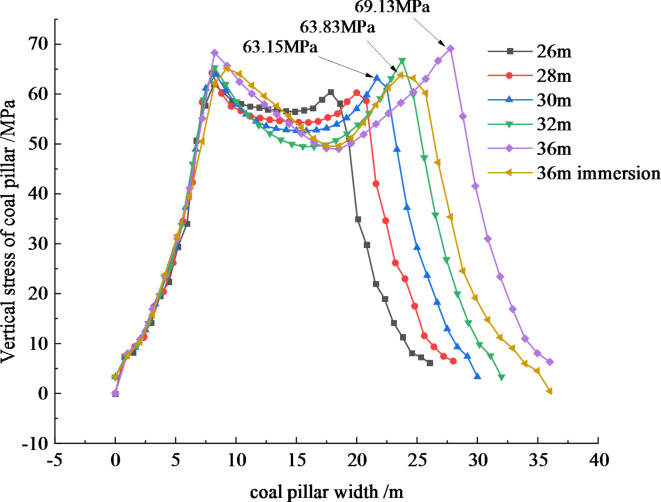
The vertical stress profiles of unimmersed coal pillars of varying widths, as well as 36 m immersed coal pillars, were analyzed at intervals of 4 m along the height of the pillars, resulting in the stress distribution illustrated in Fig. 15. The findings reveal that, under different conditions, the coal pillars exhibit a stress distribution pattern characterized by elevated stress levels on both sides and reduced stress in the central region. As the width of the coal pillars increases, there is a corresponding rise in peak stress, the extent of the elastic core area, and the degree of stress depression. Furthermore, the vertical stress distribution transitions from a saddle shape to a bimodal shape, suggesting that wider coal pillars possess a greater load-bearing capacity. Notably, the vertical stress on the side of the goaf for the water-immersed coal pillar is recorded at 0 MPa, while the vertical stress for the remaining unimmersed coal pillars of varying widths is relatively low. This indicates that the coal wall adjacent to the water-immersed area in the goaf has completely lost its load-bearing capacity.
Fig. 15.
Vertical stress distribution of coal pillar.
The specific analysis can be concluded as follows:
Comparison of 36 m coal pillar before and after water immersion weakening.
After immersion in goaf water, the stress on both sides of the coal pillar decreased. The peak stress of the coal pillar on the goaf side decreased from 69.13 MPa to 63.83 MPa, representing a reduction of 7.66%. Similarly, the peak stress of the coal pillar on the working face decreased from 68.27 MPa to 65.15 MPa, which is a decrease of 4.57%. Following water immersion, the peak stress of the coal pillar on the goaf side and the working face side shifted 4.12 m and 1.03 m, respectively, into the deeper section. Notably, the peak stress on the goaf side decreased more significantly than that on the working face side. The width of the elastic core area of the 36 m unimmersed coal pillar and the water-immersed coal pillar is 19.55 m and 14.40 m, respectively, indicating a reduction of 5.15 m after water immersion. This suggests that the bearing capacity of the coal pillar is significantly diminished due to the softening effect of water immersion.
-
(2)
Comparison of lateral stress peak between 26 ~ 36 m unimmersed coal pillar and 36 m water-immersed coal pillar 4− 2302 working face.
The peak stress on the side of the 36 m water-immersed coal pillar is 65.14 MPa, and the peak vertical stress on the side of the 4− 2302 working face of the 26–36 m unimmersed coal pillar is 61.95, 64.23, 63.91, 65.29, and 68.27 MPa, respectively. It can be seen that the 36 m water-immersed coal pillar and the 30 m unimmersed coal pillar are close to the peak stress on the side of the 4− 2302 working face. The 36 m water-immersed coal pillar and the 30 m unimmersed coal pillar reach the peak stress at 9.25 m and 8.33 m from the side coal wall of the working face. The position and size of the peak stress on the side of the working face of the 36 m water-immersed coal pillar and the 30 m unimmersed coal pillar are relatively consistent, indicating that the bearing capacity of the two is similar on the side of the 4− 2302 working face.
-
(3)
26 ~ 36 m unimmersed coal pillar and 36 m water-immersed coal pillar goaf side stress peak comparison.
The peak stress values on the goaf side of unimmersed coal pillars measuring 26 to 36 m are 60.44 MPa, 60.27 MPa, 63.15 MPa, 66.81 MPa, and 69.13 MPa, respectively. The peak stress on the goaf side of the 36 m water-immersed coal pillar is 63.83 MPa, which is comparable to the peak stress of the 30 m unimmersed coal pillar. The peak stress for the 36 m water-immersed coal pillar occurs at a distance of 23.65 m from the coal wall on the goaf side, while the 30 m unimmersed coal pillar reaches its peak stress at 21.66 m. Notably, the peak stress position of the water-immersed coal pillar shifts 1.99 m to the right. This suggests that the bearing capacities of both pillars on the goaf side of the 4− 2304 area are similar.
-
(4)
Comparison of stress curve distribution in elastic core area.
The width of the elastic core area for the 36 m water-immersed coal pillar and the 30 m unimmersed coal pillar are 14.40 m and 13.33 m, respectively, indicating that they are relatively similar. In summary, the stress distribution characteristics and the extent of the plastic zone and elastic core area for both the 36 m immersed coal pillar and the 30 m unimmersed coal pillar are comparable. It can be inferred that their bearing capacities are equivalent.
Elastic-plastic zone development
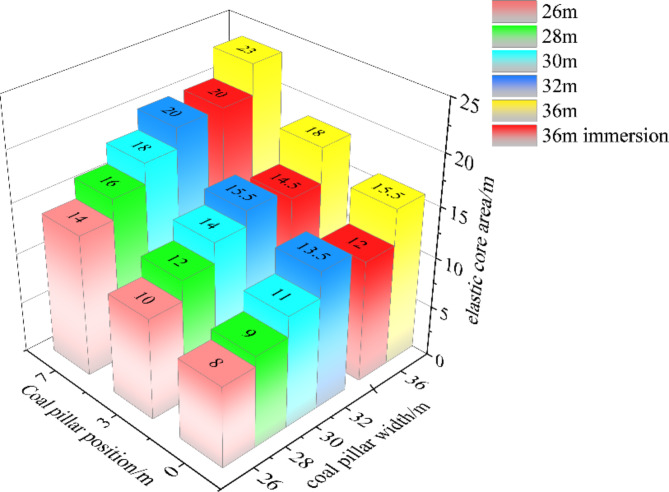
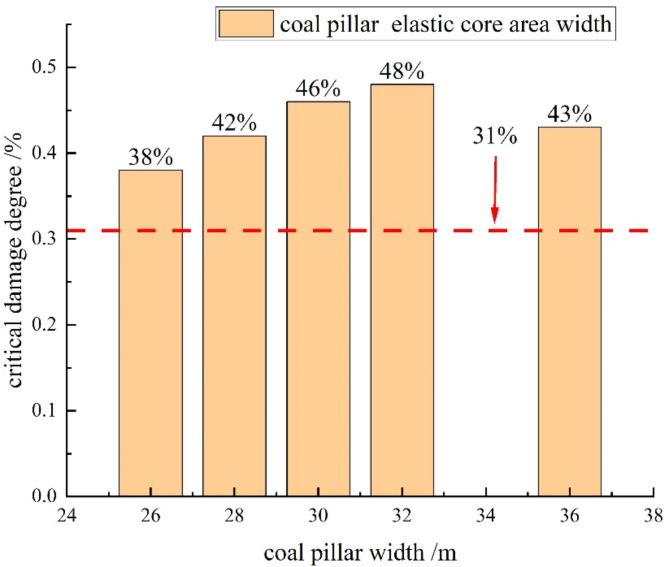
Following the excavation of the goaf and the working face, the elastic core area, which is integral to the load-bearing capacity of the coal pillar, exhibits a distribution resembling an ‘inverted trapezoid’ (see Fig. 16). The elastic core areas—comprising the upper, middle, and lower sections—of coal pillars with varying widths display distinct developmental widths; however, a consistent trend of decreasing dimensions is observed from the top to the bottom of the coal pillar. Notably, the upper section of the elastic core area is larger than both the middle and lower sections. In contrast, the plastic zone is characterized by a ‘positive trapezoidal’ shape, indicating that the lower portion has superior water conductivity compared to the upper section. The combined types (10) and (11) suggest that the permeability at the base of the coal pillar is heightened, resulting in increased water conductivity relative to the upper section. The development of the plastic zone following the immersion of the 36 m coal pillar is illustrated in Fig. 16. The widths of the upper, middle, and lower elastic core areas of the 36 m unimmersed coal pillars are measured at 23 m, 18 m, and 15.5 m, respectively. After the reduction of water immersion effects in the goaf, the cohesion, internal friction angle, and elastic modulus of the coal pillar decrease, as described by formula (4). This decline results in an overall reduction in the strength of the coal pillar, with the widths of the upper, middle, and lower elastic core areas subsequently decreasing to 20 m, 14.5 m, and 12 m, respectively, as depicted in Fig. 17. The reductions in the upper, middle, and lower elastic core areas of the coal pillars are quantified at 13%, 19.4%, and 22.6%, respectively, underscoring the influence of water immersion on the structural integrity of the coal pillar (see Fig. 18).
Fig. 16.
Elastic core distribution of different width coal pillar.
Fig. 17.
Width strip diagram of elastic core area of coal pillar.
Fig. 18.
Proportion of elastic core area of coal pillars with different widths.
Damage degree
In order to ensure the stability of the coal pillar, the width of the elastic core area should be at least twice the height of the coal pillar33, so the critical damage degree of the coal pillar should meet Eq. (21).
Critical damage degree of coal pillar :
 |
21 |
Where, S is the width of coal pillar, m ; M is the thickness of coal seam, m.
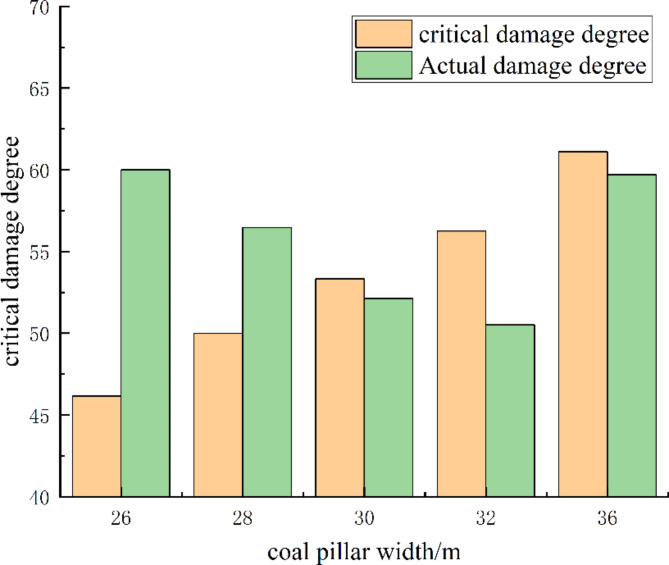
The critical damage threshold for a 36 m coal pillar is 61.11%. The actual damage levels for the coal pillar before and after immersion are 49.97% and 59.97%, respectively, both of which remain below the critical threshold. For the 30 m coal pillar, the damage level is 52.12%, also under the critical limit. The difference in damage levels between the 36 m water-immersed coal pillar and the 30 m unimmersed coal pillar is 1.41 and 1.21, respectively, indicating that they are relatively similar. This suggests that both the 36 m water-immersed coal pillar and the 30 m unimmersed coal pillar can maintain stability (see Fig. 19).
Fig. 19.
Critical-actual damage degree of coal pillars with different widths.
Energy evolution
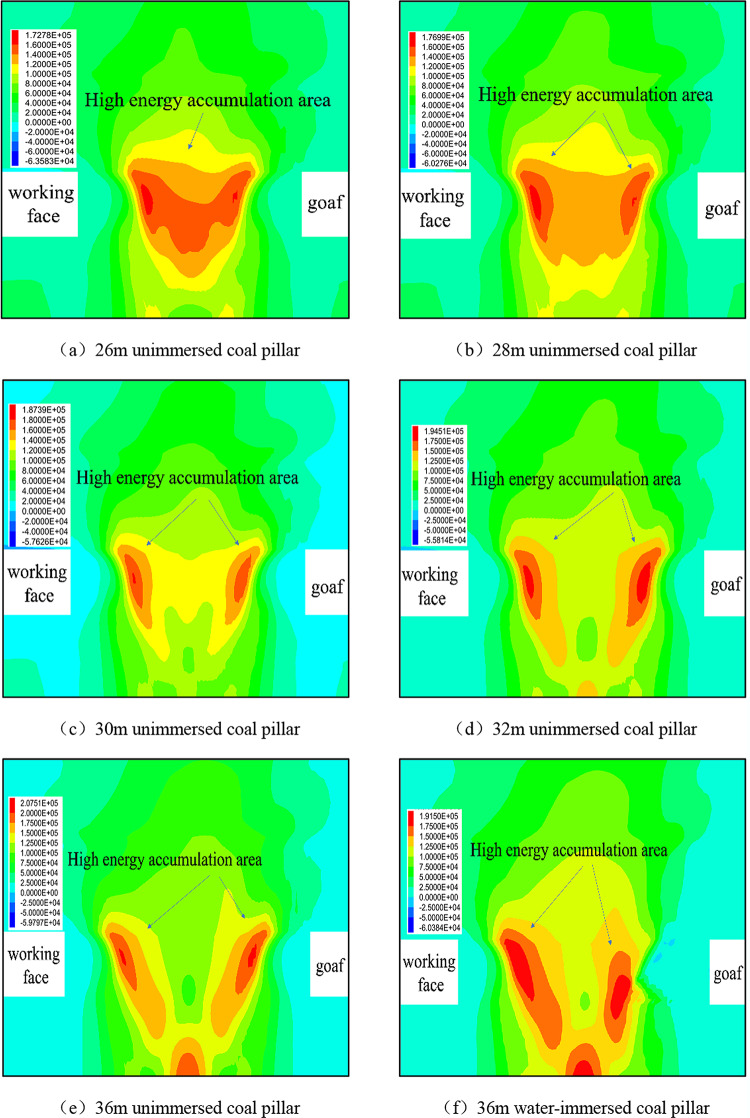
The formula (24) is embedded in FLAC 3D by fish language to obtain the cloud map of elastic strain energy accumulation characteristics of coal pillars with different widths (see Fig. 20 ).
Fig. 20.
Characteristic cloud image of different widths coal pillar energy accumulation.
It can be seen from the Fig. that the corresponding maximum releasable elastic strain energy densities in coal pillars of 26,28,30,32 and 36 m are 172,176,187,194 and 207 kJ / m3, respectively. It shows that with the increase of coal pillar width, the peak value of elastic strain energy density stored inside increases gradually, but the area of high energy accumulation area decreases, and the impact risk decreases. Combined with Eq. (17), it can be seen that with the increase of coal pillar width, the energy loss of coal unit decreases gradually, and the strength damage decreases. The elastic strain energy accumulation area of 26 and 28 m coal pillars is large, and the distribution is similar to the shape of a water cup(orange and red areas in the energy cloud map ). The elastic strain energy density is above 140 kJ / m3, and the impact risk is large. Both sides of the coal pillar are the limit equilibrium zone, and the elastic strain energy is small. The area of the elastic strain energy concentration area of the 30 m coal pillar is relatively small, and the distribution is approximately two wedge-shaped areas(orange and red areas in the energy cloud map ), and the energy is relatively dispersed. When the width of coal pillar is greater than 30 m, it shows similar energy accumulation characteristics, and the increase of width has little effect on the impact risk of coal pillar.
The maximum releasable elastic strain energy densities of 36 m coal pillars, both before and after immersion, were measured at 207 kJ/m2 and 191 kJ/m2, respectively, indicating a reduction of 16 kJ/m2. The elastic strain energy density of the 36 m water-immersed coal pillar is comparable to that of the 30 m unimmersed coal pillar, suggesting that the observed energy loss within the coal matrix is due to the softening effects induced by water immersion. As the number of iterations increases, the high-energy region of the coal pillar adjacent to the goaf is observed to migrate deeper into the coal body. Concurrently, the distance between the two wedge-shaped high-energy zones on either side of the coal pillar decreases, resulting in a reduction in overall stability.
Engineering practice
To investigate how water accumulation in goaf affects the load-bearing capacity of coal pillars, the internal stress of coal pillars in both water immersion and unimmersed areas of a mine was monitored separately. The stress on-line method directly measures the stress through the sensors installed at the key parts of the coal pillar, which is less affected by the water accumulation in the goaf. It can accurately obtain the stress data of the coal pillar and accurately reflect the change of the internal stress of the coal pillar. Secondly, the stress online method can monitor the specific parts of the coal pillar in a targeted manner. The stress change of key parts of the coal pillar is very important to the overall stability, and the stress online method can focus on these parts. Therefore, the engineering practice part adopts the stress on-line method.
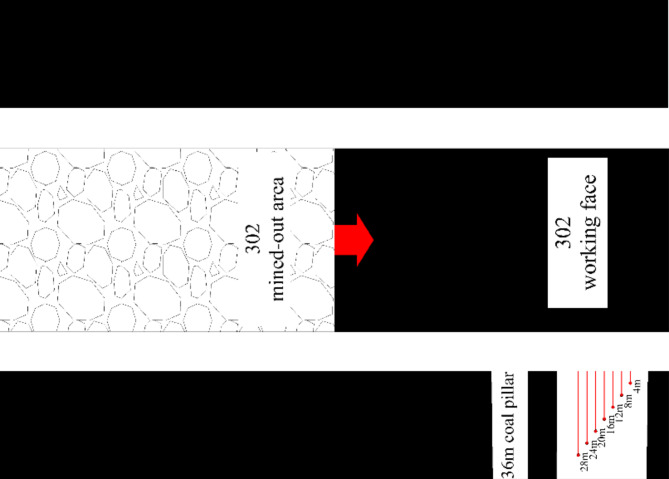
Layout of stations
The accumulation of water in the 4− 2304 goaf diminishes the load-bearing capacity of the 36 m coal pillar. To investigate the internal stress of the coal pillar, three stress stations (No. 1, No. 2, and No. 3) have been established at distances of 782 m, 1182 m, and 1442 m from the open-off cut, respectively. Stations No. 1 and No. 3 are located in areas with water-saturated coal pillars, while Station No. 2 is situated in an area with dry coal pillars (refer to Fig. 21). Each station comprises seven measurement points, and a ZYJ-30 stress meter is utilized to monitor stress at distances of 4 m, 8 m, 12 m, 16 m, 20 m, 24 m, and 28 m from the coal wall. The analysis emphasizes the effects of coal strength and the actual pressure range on the coal pillar (see Fig. 22).
Fig. 21.
Planar Layout of working face.
Fig. 22.
Schematic diagram of drilling layout.
Station stress value analysis
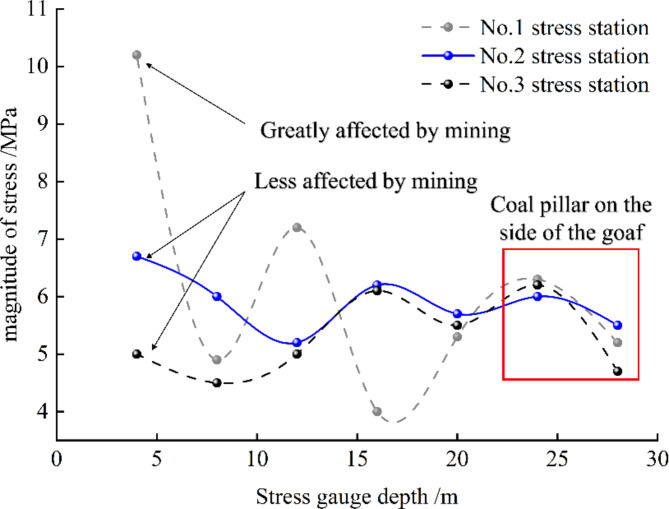
The stress monitoring values of the coal pillar section in the 4− 2302 working face are illustrated in Fig. 23. Due to the varying locations of the measuring points, the No. 2 and No. 3 stations experience less impact from mining activities, while the No. 1 station is more significantly affected. The stress curve of the coal pillar in the water-immersed area of the goaf exhibits a saddle shape. In the anticline area where the No. 2 station is situated, which is not submerged, the stress decreases gradually, indicating a relatively high bearing capacity. Conversely, the coal pillars at the No. 1 and No. 3 stations, located in the syncline area, are influenced by the weakening effects of water immersion. The stress on the coal pillar adjacent to the goaf decreases rapidly at a depth of 28 m, suggesting that the bearing capacity of the 36 m coal pillar is comparable to that of the 28 m coal pillar. Additionally, the side bearing capacity of the coal pillar adjacent to the 36 m unimmersed goaf is superior to that of the water-immersed coal pillar, thereby reducing the risk of impact. These findings are consistent with the results of theoretical analyses and numerical simulations.
Fig. 23.
Stress monitoring values of the measuring station.
Conclusion
Based on the softening coefficient fitting function derived from the water-rock softening experiment and the coal pillar width calculation model, a formula has been established for calculating coal pillar width at various saturation levels. The findings indicate that the load-bearing capacity of a 36.09 m coal pillar submerged in water is comparable to that of a 29.58 m coal pillar that is not submerged, assuming the same geological conditions. Furthermore, by integrating the mechanical properties of coal samples with varying water saturation and the permeability characteristics of the coal, a softening strategy for the water-immersed coal pillar has been developed. This strategy involves reducing the mechanical parameters of the water-immersed section of the coal pillar to evaluate the stability changes before and after water immersion.
The water immersion region of a coal pillar exhibits a trapezoidal pattern, characterized by higher permeability at the base compared to the top. As the number of iterations increases, both the volume of the water immersion area and the damaged area of a 36 m coal pillar expand until they eventually stabilize, with the water immersion volume and damage influencing each other throughout this process. The water immersion of the coal pillar can be categorized into three stages based on the number of iterations. In the first stage, the area experiences rapid water immersion as the damage from the excavation face expands. The second stage is marked by a decline in the mechanical properties of the coal pillar due to water immersion, which increases the damaged area and subsequently slows the rate of water infiltration. In the third stage, both the water immersion area and the damaged area of the coal pillar remain constant.
The volume of the immersion zone within the 36 m coal pillar increases as the number of iterations rises, eventually reaching a plateau. The peak stress on the goaf side of the coal pillar decreases from 69.13 MPa to 63.83 MPa, representing a reduction of 7.66%. The elastic core areas of the coal pillar—upper, middle, and lower—shrink by 13%, 19.4%, and 22.6%, respectively. As the number of iterations increases, the distance to the ‘wedge’ high-energy area of the coal pillar decreases, and the extent of damage progresses through three phases: rapid, slow, and then halting growth. This indicates that the load-bearing capacity of the coal pillar is significantly diminished due to the weakening effects of water immersion in the goaf.
The maximum lateral stress, the width of the elastic core area, the difference between the actual and critical damage levels, and the peak elastic strain energy density for the 36 m water-immersed coal pillar and the 30 m unimmersed coal pillar are comparable. The widths of the elastic core areas are 46% and 43%, respectively, both of which exceed the critical width of the elastic nuclear zone. The actual damage levels are 59.97% and 52.12%, both of which are below the critical damage threshold. The area and size of high energy accumulation are relatively small, indicating that the load-bearing capacities of both the 36 m immersed and 30 m unimmersed coal pillars are similar and stable.
The on-site monitoring data of coal pillar stress indicates that at the 4− 2302 working face, the No. 1 and No. 3 stations demonstrate a more rapid decline in stress at the 28 m coal pillar compared to the No. 2 station, which exhibits a relatively higher bearing capacity. This observation suggests that the 36 m coal pillar, when subjected to lateral water immersion in the goaf, has a bearing capacity comparable to that of the 30 m coal pillar under natural water conditions.
Electronic Supplementary Material
Below is the link to the electronic supplementary material.
Author contributions
SHI zhixian: Data analysis and Writing.ZHU guangan: Formal analysis.ZI zekai: Validation.
Funding
Project supported and financed by the Shaanxi Provincial Natural Science Foundation (Grant No. 2024JC-YBMS-261);
Data availability
The datasets used and/or analysed during the current study available from the corresponding author on reasonable request.
Declarations
Competing interests
The authors declare no competing interests.
Footnotes
Publisher’s note
Springer Nature remains neutral with regard to jurisdictional claims in published maps and institutional affiliations.
Supplementary Information
The online version contains supplementary material available at 10.1038/s41598-024-83322-6.
References
- 1.Pan, J. et al. Occurrence law and classification prevention of rock burst in coal mines of Shaanxi Province. Coal Sci. Technol.52(01), 95–105 (2024). [Google Scholar]
- 2.Feng, L. et al. Mechanism of rockburst in dense roadway area near the goaf of fully-mechanized large pillars. J. Min. Saf. Eng.38(06), 1100–1110 (2021). [Google Scholar]
- 3.Zhu, C. et al. Experimental study on the influence of moisture content and porosity on soft coal strength characteristics. J. Min. Saf. Eng.34(03), 601–607 (2017). [Google Scholar]
- 4.Li, B. et al. Mechanical properties and damage constitutive model of coal under the coupled hydro-mechanical effect. Rock Soil Mech.42(02), 315–323 (2021). [Google Scholar]
- 5.Han, P. et al. Progressive damage characteristics and damage constitutive model of coal samples under long-term immersion. Chin. J. Rock Mech. Eng.43(04), 918–933 (2024). [Google Scholar]
- 6.Wang, C. et al. Microseisnic events distribution characteristics and mechanical mechanisms of rock bursting induced by a coal pillar. J. China Coal Soc.34(09), 1169–1173 (2009). [Google Scholar]
- 7.Li, D. et al. Mechanism of rock burst during stope mining with interval coal pillar in one-sided mining space. J. Min. Saf. Eng.37(06), 1213–1221 (2020). [Google Scholar]
- 8.Li, Z. et al. Fault-pillar induced rock burst mechanism of thick coal seam in deep mining. Chin. J. Rock Mech. Eng.32(02), 333–342 (2013). [Google Scholar]
- 9.Maleki, H. Coal pillar mechanics of violent failure in U S mines. Int. J. Min. Sci. Technol.27(3), 387–392 (2017). [Google Scholar]
- 10.Cao, A. Y., Dou, L. M., Li, F. C., et al. Study on characteristic of overburden movement in unsymmetrical isolated longwall mining using microseismic technique. In First International Symposium on Mine Safety Science and Engineering 1394–1403 (2011).
- 11.Zhang, X. & Chen, Y. Research on the type and occurrence mechanism and prevention of coal pillar rockbursts. Coal Sci. Technol.51(10), 1–11 (2023). [Google Scholar]
- 12.Lu, Z. et al. Numerical analysis on the factors affecting post-peak characteristics of coal under uniaxial compression. Int. J. Coal Sci. Technol.11, 2 (2024). [Google Scholar]
- 13.Liu, S. et al. Study on stability of coal pillars of roadway excavated along gob with water in gently inclined coal seam. Coal Sci. Technol.48(06), 78–87 (2020). [Google Scholar]
- 14.Yao, Q. et al. Design on the width of coal pillar dam in coal mine groundwater reservoir. J. China Coal Soc.44(03), 891–899 (2019). [Google Scholar]
- 15.Poulsen, B. A., Shen, B. & Williams, D. J. Strength reduction on saturation of coal and coal measures rocks with implications for coal pillar strength. Int. J. Rock Mech. Min. Sci.71, 41–52 (2014). [Google Scholar]
- 16.Gu, D. et al. Experimental study and numerical simulation for dynamic response of coal pillars in coal mine underground reservoir. J. China Coal Soc.41(7), 1589–1597 (2016). [Google Scholar]
- 17.Han, P., Zhang, C. & Wang, W. Failure analysis of coal pillars and gateroads in longwall faces under the mining-water invasion coupling effect. Eng. Fail. Anal.131, 23 (2022). [Google Scholar]
- 18.Li, Z. et al. Failure characteristics and reasonable width of water-resisting pillar under the coupling effect of mining and seepage. J. China Coal Soc.48(11), 4011–4023 (2023). [Google Scholar]
- 19.Liu, S. et al. Weakening mechanism and instability characteristics of coal pillar under mining disturbance and water immersion in water storage goaf. J. Min. Saf. Eng.39(06), 1084–1094 (2022). [Google Scholar]
- 20.Shi, W. et al. Structural division and determination of rational width for waterproof partition coal pillar. Chin. J. Rock Mech. Eng.36(05), 1227–1237 (2017). [Google Scholar]
- 21.Cai, M. Rock Mechanics and Engineering (Science Press, 2002). [Google Scholar]
- 22.Wang, F. et al. Failure evolution mechanism of coal pillar dams in complex stress environment. J. Min. Saf. Eng.36(06), 1145–1152 (2019). [Google Scholar]
- 23.Xie, H. et al. Mining-induced mechanical behavior in coal seams under different mining layouts. J. China Coal Soc.36(07), 1067–1074 (2011). [Google Scholar]
- 24.Zhang, C. et al. The stability of residual coal pillar in underground reservoir with the effect of mining and water immersion. J. China Univ. Min. Technol.50(02), 220–227 (2021). [Google Scholar]
- 25.Wang, B. et al. Mining response and dynamic reinforcement for narrow coal pillar next to goaf in working face 1402 of Xin’an coal mine. Coal Geol. Explor.48(01), 145–153 (2020). [Google Scholar]
- 26.Chai, J. et al. BOTDR-based horizontal deformation monitoring of section coal pillars. Coal Geol. Explor.52(05), 46–55 (2024). [Google Scholar]
- 27.Yu, Y. et al. Discussion on determination method of the limit equilibrium zone width based on the deformation analysis of coal wall. J. China Coal Soc.44(11), 3340–3348 (2019). [Google Scholar]
- 28.Zhang, C., Huang, X., Wang, Y. et al. Simulation method and engineering application of fluid solid coupling for water immersion weakening in coal mining. Coal Sci. Technol. 1–11[2024–08–18].
- 29.Zhang, C., Tu, S. & Zhang, L. Study of stress sensitivity of coal samples with different mining damage in overlying strata. J. China Univ. Min. Technol.47(03), 502–511 (2018). [Google Scholar]
- 30.Tang, C. & Tang, S. Humidity diffusion and rheological behavior of rock under humidity condition. J. Min. Saf. Eng.27(03), 292–298 (2010). [Google Scholar]
- 31.Feng, L. et al. Study on influence law of mining speed on stope energy releasing. Coal Sci. Technol.48(11), 77–84 (2020). [Google Scholar]
- 32.Zhu, W. et al. Mechanism of disaster induced by dynamic instability of coal pillar group in room-and-pillar mining of shallow and close coal seams. J. China Coal Soc.44(02), 358–366 (2019). [Google Scholar]
- 33.Da Gu, Z. Theory framework and technological system of coal mine underground reservoir. J. China Coal Soc.40(02), 239–246 (2015). [Google Scholar]
Associated Data
This section collects any data citations, data availability statements, or supplementary materials included in this article.
Supplementary Materials
Data Availability Statement
The datasets used and/or analysed during the current study available from the corresponding author on reasonable request.


