Abstract
Accurate characterisation of seismic source mechanisms in mining environments is crucial for effective hazard mitigation, but it is complicated by the presence of anisotropic geological conditions. Neglecting anisotropic effects during moment tensor (MT) inversion introduces significant distortions in the retrieved source characteristics. In this study, we investigated the impact of ignoring anisotropy during MT inversion on the reliability of hazard assessment. We investigated a high-energy (2.18 106 J) induced by mining activities in the Nantun coal mine in China. The subsurface was modelled as a vertically transversely isotropic medium, incorporating four different levels of anisotropy derived from site-specific geological and tomographic data. The results demonstrate that neglecting anisotropy led to significant distortions in the retrieved source parameters, including polarity flips and the introduction of spurious non-double-couple components. These artefacts compromised the accuracy of hazard analysis and undermined the effectiveness of risk management strategies. In contrast, the sequential inversion method yields a MT solution with a 0.14 misfit, accurately retrieving the focal mechanism, which is interpreted as a normal right-lateral oblique shear failure along the F3 fault. This study highlights the importance of properly incorporating anisotropy effects when analysing induced seismicity in heterogeneous mining environments. The use of a homogeneous Green’s function for MT inversion may be inadequate for reliable hazard assessment, underscoring the need for advanced techniques that can effectively model the influence of subsurface anisotropy on seismic wave propagation and source retrieval.
Keywords: Mining-induced seismicity, Moment tensor inversion, Anisotropy, Sequential inversion, Hazard assessment
Subject terms: Energy science and technology, Engineering
Introduction
The growing demand for resources has gradually driven underground engineering projects to shift towards densely populated regions1. This shift has brought with it the challenge of induced seismicity - the earthquakes caused by human activities, which have gone on to damage subsurface structures and buildings, heightening public concern about underground operations. In recent years, this phenomenon of induced seismicity has emerged as a significant scientific and social issue2. An analysis of 730 anthropogenic projects3 revealed that mining-induced seismicity is the predominant form in the current induced seismicity dataset (www.inducedearthquakes.org), presenting a substantial challenge for contemporary mining safety.
The harsh mining environment restricts personnel from accessing the epicentral sites, hampering the use of conventional techniques like geological fracture mapping to understand the geometric behaviour behind each seismic event4. Microseismic (MS) monitoring, however, provides valuable information about coal and rock media, reveals fracture geometries, and assesses mining hazards5–7. This technology has gained widespread acceptance in global mining operations, allowing the capture of centroid location, magnitude, spectral characteristics, and spatiotemporal sequences of induced seismicity8–10. With extensive research on wavefield information, the focus of MS analysis has shifted from inferred to waveform techniques11.
The moment tensor (MT) is a crucial tool in waveform analysis techniques, as it allows us to make important inferences about earthquake sources. By neglecting nonlinear effects in the near-source region and associating the equivalent force model with linear wave equations, the MT describes the characteristics of the seismic source12. Fundamentally, the MT can be decomposed into three key components: the isotropic (ISO) component representing volume change, the double-couple (DC) component representing pure shear faulting, and the compensated linear vector dipole (CLVD) component representing elastic deformation without net volume change13. This MT description not only applies to earthquake sources with favourable shear slip, but also encompasses non-shear processes observed in mining-induced seismicities, such as blasting, goaf collapse, coal pillar burst, roof separation, and composite ruptures14,15. Additionally, the three eigenvectors of the MT provide crucial orientation information about the source geometry, including the strike, dip, and rake of the seismogenic fault.
Despite the importance of the MT in seismic analysis, concerns about the accuracy of MT solutions have been raised over the past decade, particularly in complex mining environments16–19. This issue poses substantial limitations to modelling and inversion, as knowledge of the velocity structure plays a crucial role in determining the resolution and stability of MT solutions20–23. Even with detailed geological surveys, including acoustic logging, established velocity models tend to lose their effectiveness over time due to the dynamic nature of mining operations, such as blasting, excavation, and ongoing activities. Consequently, exploring the mechanisms underlying the induced seismicity in heterogeneous mining environments remains a challenge.
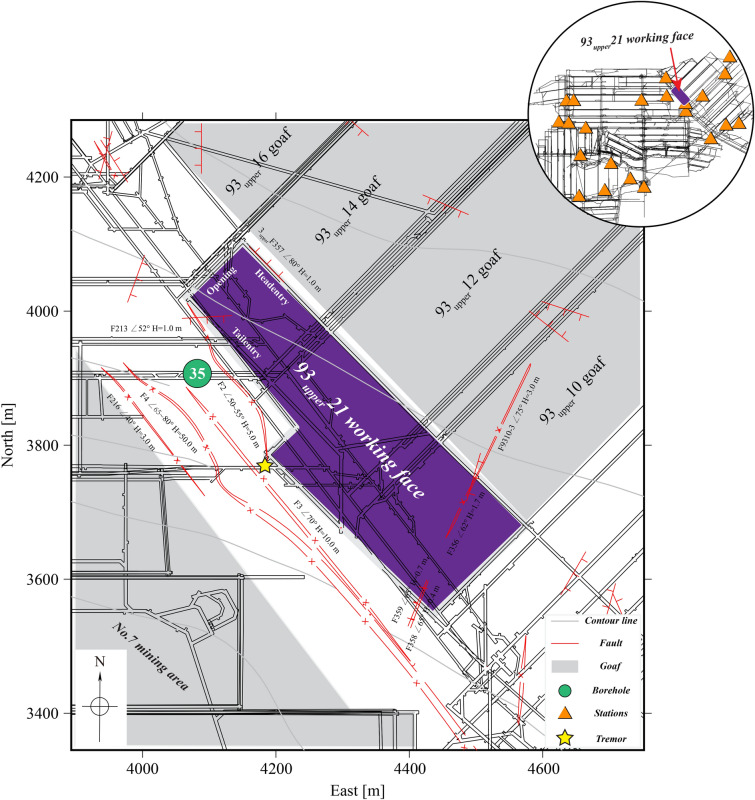
Interestingly, most seismic events in mining operations are harmless responses of the coal and rock masses adjusting to the mining activities24,25. In fact, these events can be used to reveal the three-dimensional (3-D) velocity structure using travel-time tomography technology26,27, which can be beneficial for the overall understanding of the mining environment. In this study, we focus on the  21 working face of the Nantun coal mine, China (Fig. 1), employing a sequential inversion strategy that combines travel-time tomography with full-waveform MT inversion. Our main goal is to investigate how ignoring anisotropy affects distortion characteristics and to find ways to reduce errors in determining the earthquake source details. The ultimate aim is to establish a more reliable and efficient approach to studying the causes of mining-induced earthquakes and developing targeted measures to mitigate them based on robust findings.
Fig. 1.
Plane view of the Nantun coal mine with general geological characteristics (faults and underground contours correspond to red and cyan lines, respectively) and roadways (black lines). The purple- and grey-filled areas are the  21 working face and goafs, respectively. The 22 single-component geophones (orange-filled triangles) were deployed in the coal mine (top-right corner). The yellow-filled pentagram represents a tremor event on 13 December 2020 with an energy of
  J.
J.
Engineering conditions and metadata
Project overview
The No. 9 mining area of the Nantun coal mine in Shandong Province, China, is situated on the northeast side of the coalfield and adjacent to the No. 7 mining area in the southwest (Fig. 1). This area has experienced several tremors, with the largest recorded magnitude reaching  2.828, posing significant threats to mining safety and production.
The  21 working face lies between two adjacent goaf areas. To the southwest, it borders the goaf of the No. 7 mining area. The northeastern side of the working face includes the
  10 (end of stope on 18 March 2013),
  12 (end of stope on 8 November 2009),
  14 (end of stope on 30 May 2003), and
  16 (end of stope on 27 November 2005) goafs. A coal pillar approximately 4 m wide separates the goaf and the
  21 working face.
This working face featured a complex network of interconnected legacy roadways. The fully-mechanised full seam top coal caving mining technology was employed to mine the 3# coal seam, which has an average thickness of 7.5 m, from the northwest to the southeast. During the mining stage from November 2020 to December 2020, the working face was widened from an initial width of 116.9 m to 189.8 m after mining approximately 270 m. The elevation of the coal seam increased from the southeast to the northwest, ranging from -472.3 m to -542.1 m, with an average elevation of -507.2 m. The east-north and west-south roadways served as the headentry and tailentry, respectively. The dip of the coal seam varied from  to
to  , with an average dip of
  . Geological drilling data from borehole 35# (Fig. 2) revealed that both the roof and floor of the coal seam consisted of hard-rock layers. The immediate roof comprised 5.0 m of siltstone, while the primary roof was a combination of mudstone and siltstone with a thickness of 5.0 m. The immediate floor consisted of 0.7 m of siltstone. Additionally, a hard rock stratum approximately 400 m thick was located 40 m above the coal seam roof, primarily composed of siltstone, fine sandstone, mudstone, and sandstone. A 3-D geological survey identified three faults near the tailentry: F213 (H = 1.0 m), F2 (H = 5.0 m), and F3 (H = 10.0 m).
Fig. 2.
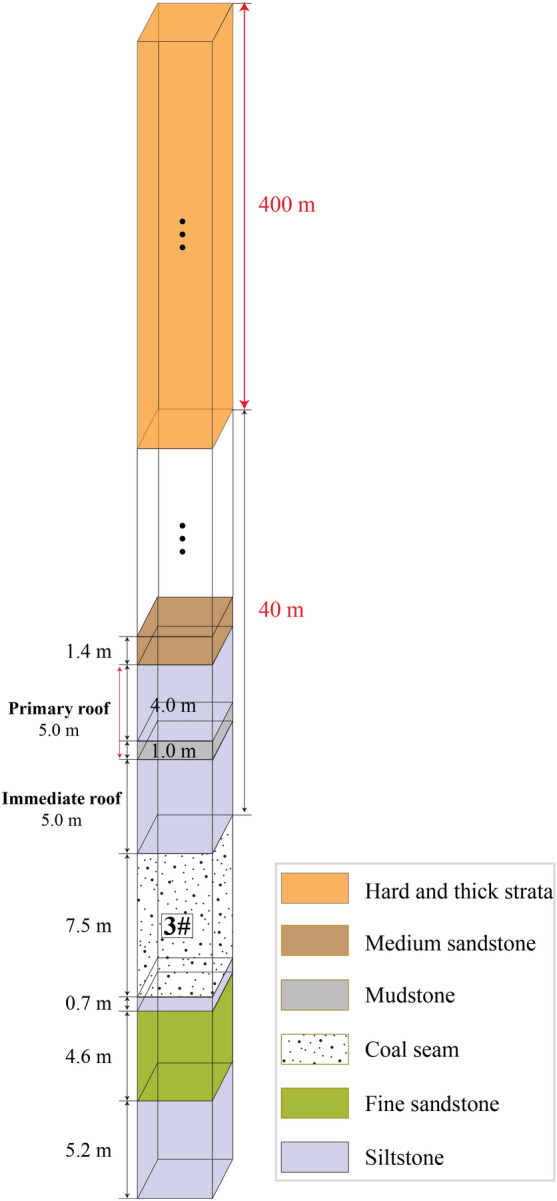
Column of the 35# borehole. Lithological details are highlighted with colour in the legend. The borehole location is indicated in Fig. 1.
Monitoring seismic network array and catalogue
The MS activity of the  21 working face was monitored in real-time using the Seismological Observation System (SOS) that was developed by the Department of Geology and Geophysics at Główny Instytut Górnictwa, Poland. The network array included 22 single-component short-period DLM-2001 velocity geophones (shown in Fig. 1), installed at depths ranging from 0 m to 643 m in the stable coal and rock mass, to capture high-quality seismic waveforms at a sampling rate of 500 samples/s. However, the monitoring system could only provide limited information on mining-induced seismic events, such as origin time, energy, and 3-D coordinates, with a hypocentral location error of ~50 m, which is due to the inherent limitations of the SOS29,30. It initially lacked the capability to accurately derive the velocity structure model, analyze source failure mechanisms, and determine source geometric characteristics without further processing.
On 13 December 2020 at 16:55:54 local time, a strong tremor (energy release exceeding  J)31 event with an energy of
  J occurred (Table 1, Fig. 1), disrupting mining operations and causing significant physical and psychological impacts on personnel. Due to the limited research technology available at the time, the precise cause of this event remains unclear. A new accident investigation using the established sequential inversion method is necessary. The tomographic inversion utilized a dataset from 1 November 2020 to 12 December 2020, including 1,186 MS events with 8,023 P-wave arrival times at the
  21 working face. The monitoring catalogue selection process excluded the influence of geophone location changes due to mining activities.
Table 1.
Relocated high-energy tremor event selected for moment tensor.
| Event | Date and time | Location | Energy [J] | ||
|---|---|---|---|---|---|
| [yyyy-mm-dd hh:mm:ss] | East [m] | North [m] | Depth [m] | ||
| #1 | 2020-12-13 16:55:54 | 4182 | 3767 | 549 | 2.18 106 106
|
Among the monitored events, the energy distribution was predominantly in the range of  J, with 752 events, while the remaining 434 events were in the range of
  J. Maintaining a high signal-to-noise ratio (SNR) is crucial for waveform inversion. The low-energy (
 J), high-frequency MS events within the monitored catalogue were susceptible to interference from noise, including coal-winning machine operations, mechanical collisions, and power line disturbances. Therefore, the 434 events with clear P-wave onset information were selected for investigating the 3-D underground velocity structure.
Methodologies and integration
Moment tensor inversion
MT Inversion is a key methodology in seismic analysis, used to describe seismic sources through internal force systems known as equivalent body forces. These force couples operate within a defined model medium, generating identical displacement fields outside the source region. Each physical source corresponds to a unique equivalent force system in a given coal and rock medium32. When the point source assumption holds, the equivalent force system can be represented by a MT. A point-source MT is a symmetric second-order tensor M, comprising nine force couples33. This tensor includes six independent components, which are considered the integral of the ‘stress glut’ over the source volume34. The resulting elastic wave field from the influence of these equivalent forces on a medium, leading to complex displacements, is mathematically expressed as35:
 |
1 |
where  is the displacement segment of the observed wavefield with the instrument response removed at point
  ;
;  represents the vector component of the MT, with the subscripts p and q indicating the directions of the force couple and force arm, respectively;
  is the spatial derivative of the Green’s function, expressed as the seismic response of a particular medium, and the symbol ‘
 ’ denotes the time convolution.
Travel-time tomography
Accurate velocity models are crucial for precisely modelling the propagation of seismic waves. The Green’s function serves as a powerful tool in this regard, as it captures the distinct wave phenomena, such as refraction, reflection, and scattering, that occur in diverse velocity structures. To gain a deeper understanding of the seismic sources within the study area, we employed the travel-time tomography method developed by Zhao et al.26. This approach allowed us to determine a high-resolution 3-D velocity model of the region. The observation equation for travel-time tomography in the cartesian coordinate system is given by26,36:
 |
2 |
where  and
and  are the observed and calculated travel times for the i-th event at the j-th station, respectively;
  ,
,  ,
,  , and
, and  are the perturbation terms of the hypocentre parameters;
  is the velocity perturbation of the n-th node in the 3-D grid mesh, and
  represents the error term of the datum. The terms
  and
and  are partial derivatives of travel time with respect to the hypocentral coordinates
  and velocity parameter V at the n-th grid node, respectively, expressed as36:
 |
3 |
where  are the components of the unit vector tangent to the ray path at the hypocentre and pointing toward the ray propagation, and
  is the velocity at the hypocentre.
  and
and  are the velocity and shape functions at
  , respectively, calculated using Eq. 4.
 |
4 |
where  represent the coordinates of the eight nodes surrounding a point
  .
.
Integration approaches
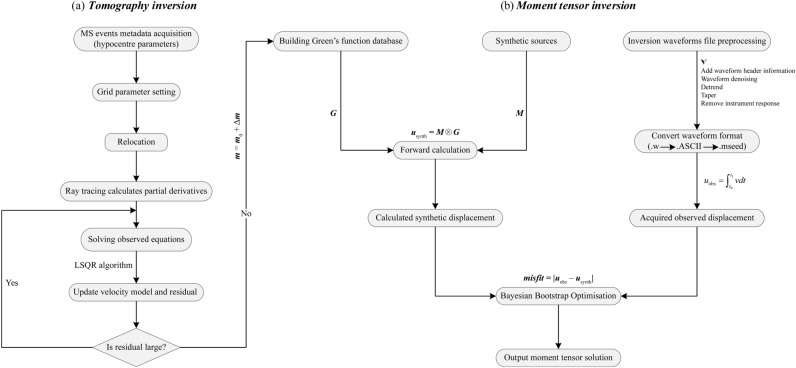
The sequential inversion workflow (Fig. 3) integrates various methodologies to accurately simulate seismic wave propagation and analyze seismic data. This approach involves using the velocity model derived from tomographic results as a prior constraint into Green’s function. The goal is to minimize the misfit value by comparing predicted and observed data, which is mathematically expressed using the  norm:
norm:
 |
5 |
where  is the global weight factor for the i-th station, following the methodology of Heimann37, which includes balancing, manual, and bootstrap weights.
  and
and  represent the observed and synthetic displacements at the i-th station, respectively.
Figure 3.
Study workflow of the sequential inversion: (a) For P-wave travel-time tomography. (b) For moment tensor inversion.
Precision and efficiency are essential principles guiding engineering. After establishing a theoretical framework, efficient inversion strategies and algorithms must be implemented to effectively address unforeseen field conditions while operating within the constraints of finite computational resources and time. The obtained 3-D velocity model was streamlined into a layered velocity model to simplify the inversion process. Here, we seek clarification on the preference for layered velocity models over 3-D velocity models. In the study of Krieger38, it was demonstrated that lateral heterogeneity in the geometric structure exerts negligible influence on the stability of inversion results in non-volcanic seismic contexts. Hence, a VTI velocity model adequately meets inversion needs. Moreover, layered models confer benefits, including expedited computational efficiency and enhanced flexibility across various applications. A stochastic quantitative approach was used to mitigate anisotropy effects and eliminate uncertainties associated with full MT resolution.
The investigation of the 3-D velocity structure involves linearizing observation equations using the parameter separation technique and the damped least-squares method39. This process (Fig. 3a) includes sequentially determining four hypocentral parameters and velocity partial derivatives, specifically addressing hypocenter relocation and velocity perturbation calculations. The damped least-squares method optimizes the solution by introducing a damping factor into extensive sparse matrices, mitigating singularity issues. As mining-induced seismicity records increase, partial derivatives and travel-time residual matrices become extremely large, posing storage challenges for personal computers. To overcome this, we employ the LSQR iterative algorithm40. Additionally, a multiprocess handling module was integrated to support both local and remote concurrency, ensuring computational efficiency.
For MT inversion (Fig. 3b), probabilistic approaches are often considered efficient due to their mixed linear and nonlinear nature41. In this study, the Bayesian Bootstrap Optimization (BABO) algorithm was used to calculate the displacement misfit between predicted and observed waveforms based on an open-source Pyrocko package42. The probabilistic full-waveform optimization process can be divided into three phases: uniform sampling, high-score list, and directed sampling43. By integrating these methodologies, the sequential inversion workflow effectively addresses the complexities of seismic data analysis, ensuring precise and efficient results.
Results
Parameters setting and tomographic inversion
Equation 2 involves Taylor expansion of the travel-time function based on the initial velocity model26. Accurately defining this model is crucial for linearising the expansion and minimising higher-order terms during inversion. We estimated the initial velocity model of the Nantun coal mine through linear regression analysis (Fig. 4), correlating travel time with 3-D epicentral distance for each ray path. The average P-wave velocity derived from the regression results was assigned to grid nodes corresponding to the average depth of the MS catalogue. Additionally, we accounted for the topographical effects on the velocity, assuming a constant velocity gradient of 56 m/s per 100 m of depth44, as validated by Wang et al27. These velocity values were integrated into the grid nodes to establish a linear observation system.
Fig. 4.
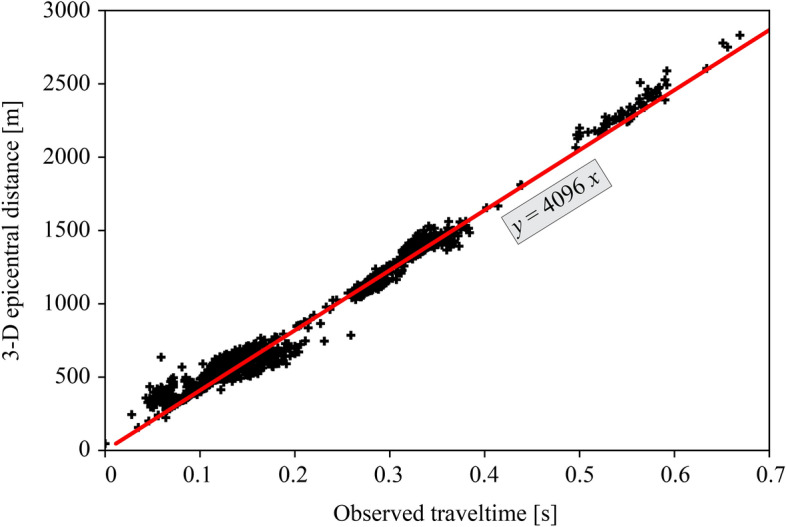
Linear regression of observed travel times versus 3-D epicentral distances. The black cross markers represent MS events. The slope of the red line is the average P-wave velocity of the coal-rock medium.
For subsequent hypocentre relocation and tomographic inversion, we adopted a mixed-grid strategy with inner and edge nodes to discretise the 3-D velocity field across the coal mine area. This strategy aimed to provide sufficient prior information for accurate Green’s function construction. Inner nodes were spaced at 50 m intervals horizontally and vertically to capture detailed volume characteristics, while edge nodes facilitated velocity interpolations. The modelling ranges for the coal mine spanned  m in the E-W direction,
  m in the N-S direction, and
  m in depth (D). Corresponding ranges for the inner area were
  m,
m,  m, and
  m, respectively.
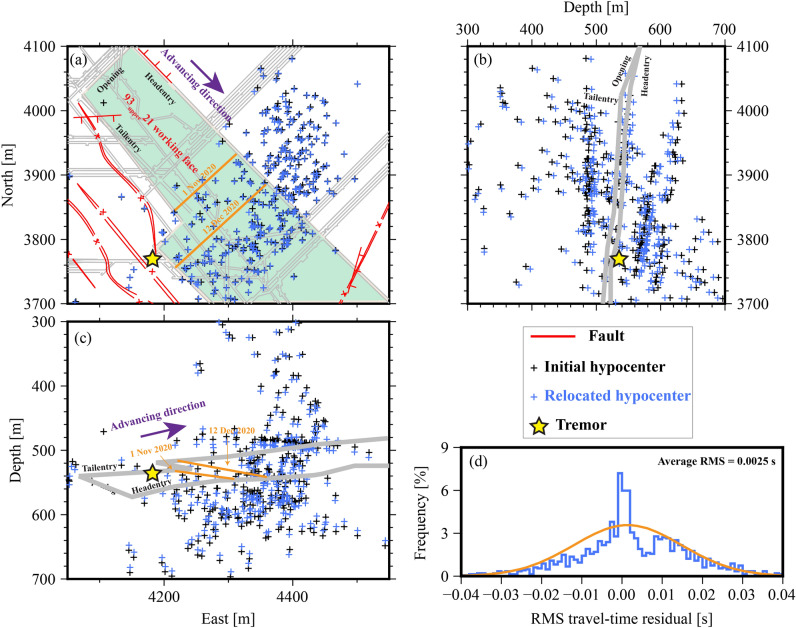
We successfully relocated 352 out of 434 MS events triggered at seven geophones (Fig. 5), achieving a root-mean-square (RMS) travel-time residual of 0.0025 s, indicating significant convergence. With a uniform P-wave velocity (Vp) of 5000 m/s, the average relocation error was approximately 13 m, a substantial improvement from previous estimates of about 50 m29.
Fig. 5.
MS event relocation results from 1 November 2020 to 12 December 2020: (a) plane view; (b) lateral view; (c) front view; (d) Histogram of root-mean-square (RMS) travel-time residuals of seismic rays. The yellow star represents a tremor event on 13 December 2020 with an energy of  J. Some labels are displayed below (b).
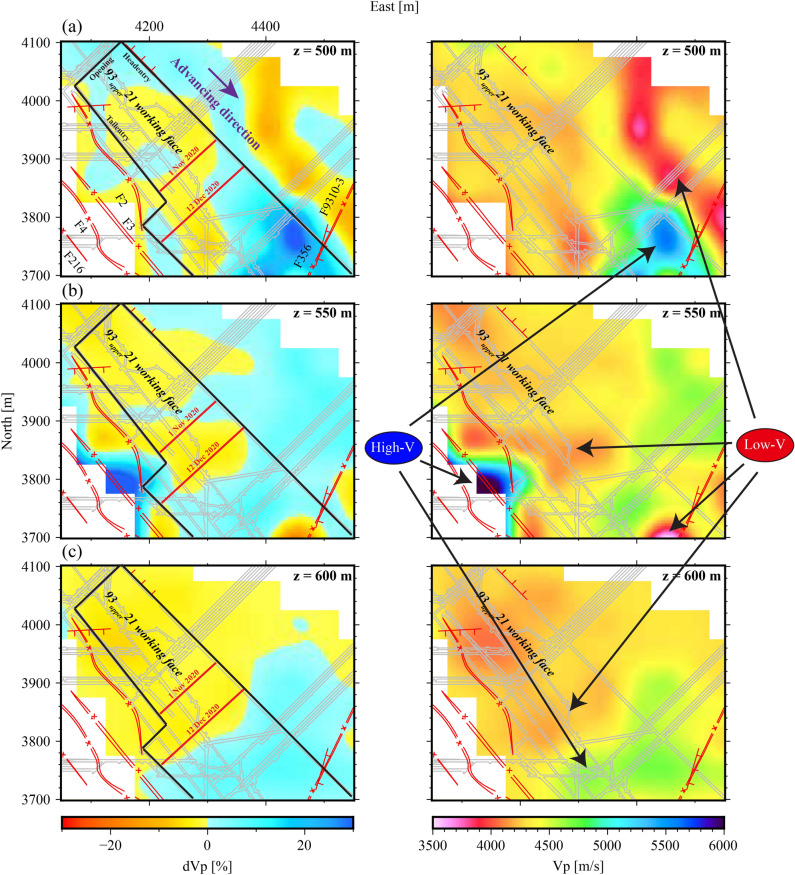
While the relocation calculation validated the accuracy of the tomographic inversion, solving observation equations encountered challenges due to the non-uniform distribution of geophones and MS events across the study area. This led to a heterogeneous distribution of ray paths, where diagonal elements corresponded to sparsely sampled nodes significantly smaller in magnitude compared to well-sampled nodes. Damping regularisation was crucial to achieving a reliable inversion result. Numerous previous studies26,45–47 in multiscale tomography have demonstrated the effectiveness of using a trade-off curve (Fig. 6) based on RMS travel-time residual and the 3-D velocity model norm to determine the optimal damping parameter. Our tomographic results, employing an optimal damping factor of  , are illustrated in Fig. 7.
Fig. 6.
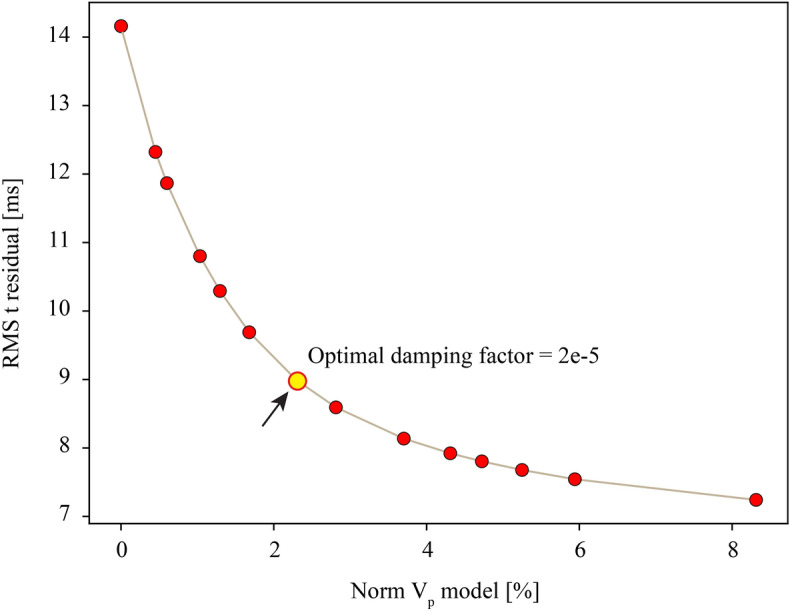
Trade-off curve: the red-filled circles denote discarded damping parameters, and the yellow-filled circle represents the optimal damping factor with a value of  used in this study.
Fig. 7.
Map views of P-wave velocity (Vp) perturbation (dVp, left panels) and absolute Vp (right panels) tomography at three depths: (a) 500 m; (b) 550 m; (c) 600 m. The corresponding colour bars are shown below the map views. The other labelling is the same as that in Fig. 1.
Resolution tests
We performed a series of synthetic tests, following the methodology outlined by Zhao45, to evaluate the reliability and resolution of the tomographic results. This process involved several key steps. First, we constructed a synthetic input velocity model with pre-assigned velocity anomalies. We then calculated a synthetic travel-time dataset using ray information from the actual dataset, while introducing random noise to simulate uncertainties in manual arrival-time picking. Next, we inverted the synthetic travel-time dataset to obtain an output model, which we compared to the corresponding synthetic input model to evaluate the resolution and robustness of the tomographic results.
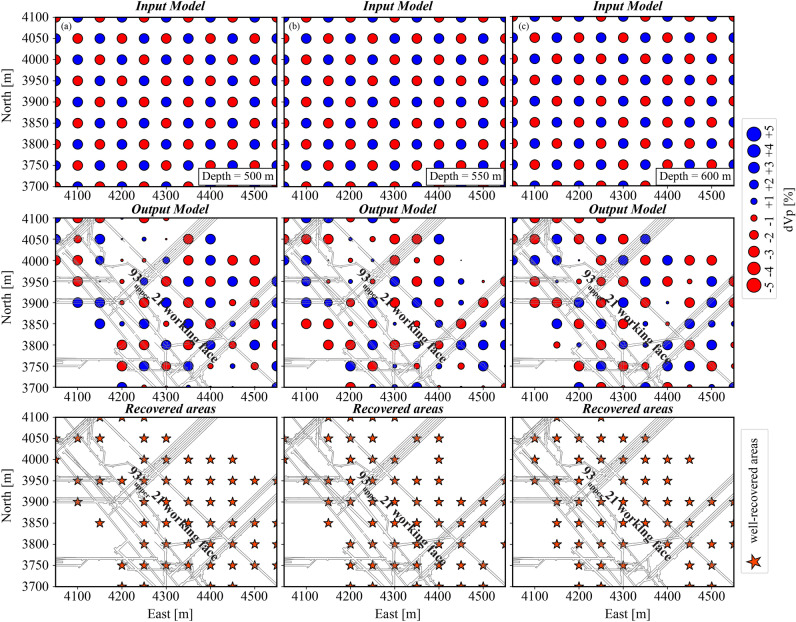
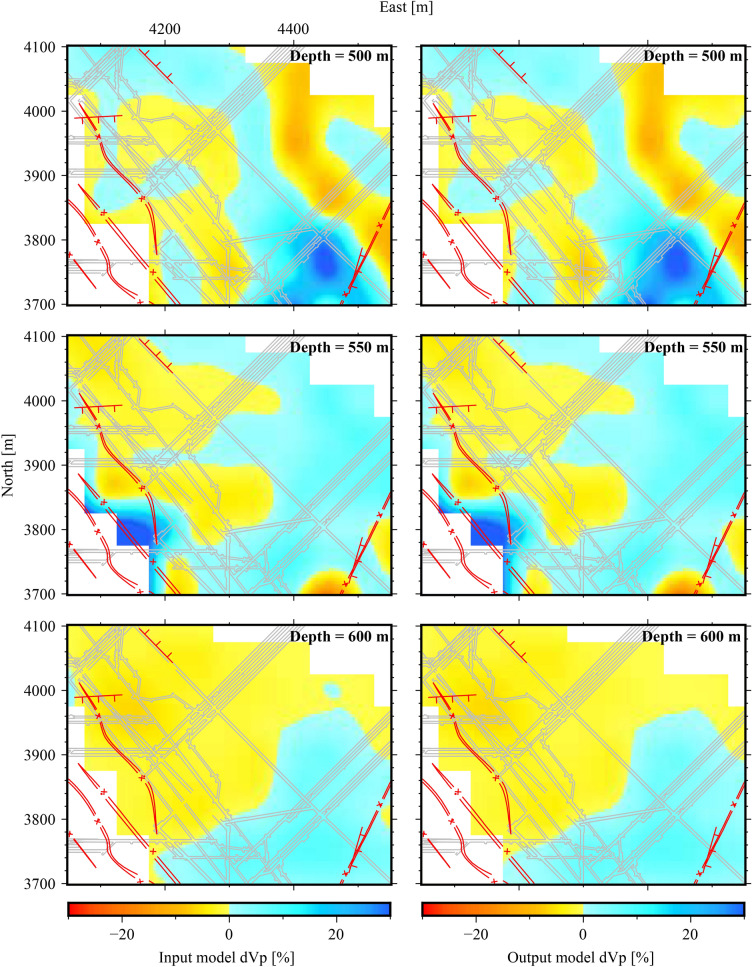
Beginning with a checkerboard resolution test (CRT), we used a synthetic input model with positive and negative Vp perturbations and Gaussian noise with a 0.001 s standard deviation. The CRT assessment focused on the extent of well-recovered areas, where the Vp perturbations in the input and output models matched. As shown in the bottom panels of Fig. 8, the well-recovered areas encompassed the roof (500 m depth), coal seam (550 m depth), and floor (600 m depth), indicating that a substantial portion of the features in the tomographic results (Fig. 7) were situated within these well-resolved areas. To further validate the robustness of the tomographic features, we conducted a restoring resolution test (RRT) using a synthetic input model derived from the real-data inversion (Fig. 7). The parameter configuration of the RRT remained consistent with that of the CRT, except for the synthetic input velocity model. The output model, as illustrated in Fig. 9, showed slight discrepancies from the input model, effectively capturing the essential features of the roof, coal seam, and floor, with only a few insignificant details lost. The collective results of these resolution tests demonstrated the reliability and resolution of the tomographic imaging approach used in this study, providing confidence in the interpretation of the obtained results.
Fig. 8.
Results of a checkerboard resolution test with a horizontal grid interval of 50 m at different depths: (a) 500 m; (b) 550 m; (c) 600 m. The top, middle, and bottom panels are the input and output models and well-recovered areas (orange stars), respectively. The Vp perturbation scale (in per cent) is shown in the legend, with red and blue dots indicating negative and positive Vp perturbations, respectively.
Fig. 9.
Results of a restoring resolution test (RRT) at different depths. The left panels show the input model derived from the tomographic result (Fig. 7); the right panels show the corresponding output model of the RRT. The elevation of each level is shown at the right-upper corner of each panel. The Vp perturbation scale (in per cent) is shown at the bottom. The other labelling is the same as that in Fig. 1.
MT results comparison: velocity model influence
Two sets of MT inversions were conducted to explore the distortion characteristics resulting from neglecting medium anisotropy in high-energy tremors. These experiments focused on two distinct velocity models illustrated in Fig. 10: a homogeneous model represented by dashed lines and a VTI anisotropy model depicted by solid lines. The first velocity model was homogeneous, with P-wave and S-wave inversions using mean values matching those of the tomographic velocity model, with Vp set to 4.096 km/s and Vp/Vs set to 1.7348. The second model incorporated four levels of VTI anisotropy, reflecting prior tomographic information. These layers corresponded to the overburden, hard and thick strata, working face, and coal seam floor, with Vp values of 4.00, 4.49, 3.68, and 4.21 km/s, respectively, and Vp/Vs maintained at 1.7348.
Fig. 10.
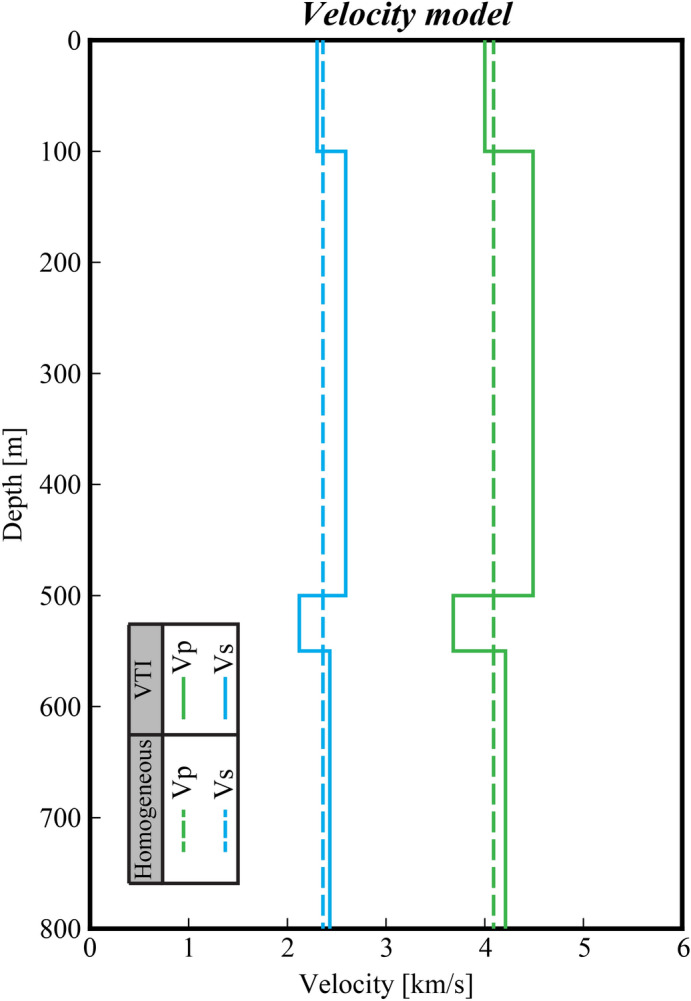
Homogeneous and vertically transversely isotropic (VTI) anisotropic velocity models: the green and blue solid lines show Vp and Vs for the VTI anisotropic model; the green and blue dashed lines represent Vp and Vs for the homogeneous model.
The Green’s function calculations were performed using the QSEIS program by Wang49 and integrated into the FOMOSTO software50, developed using the orthonormal propagator method. Before the MT inversion, a series of monitoring trace processing workflows were conducted, with comprehensive details provided by Song et al.51.
Based on the Grond structural framework43, the  norm quantified the misfit between observed and synthetic data. BABO involved 100 bootstrap chains across all sampling phases. The uniform sampling phase utilized 1,000 iterations, with 20,000 iterations performed in the directed sampling phase. Eccentric compensation, based on the high-score model, involved reducing the search radius from 2 to 0.5. To ensure comprehensive exploration, the best model converged within the standard deviation across all bootstrap chains.
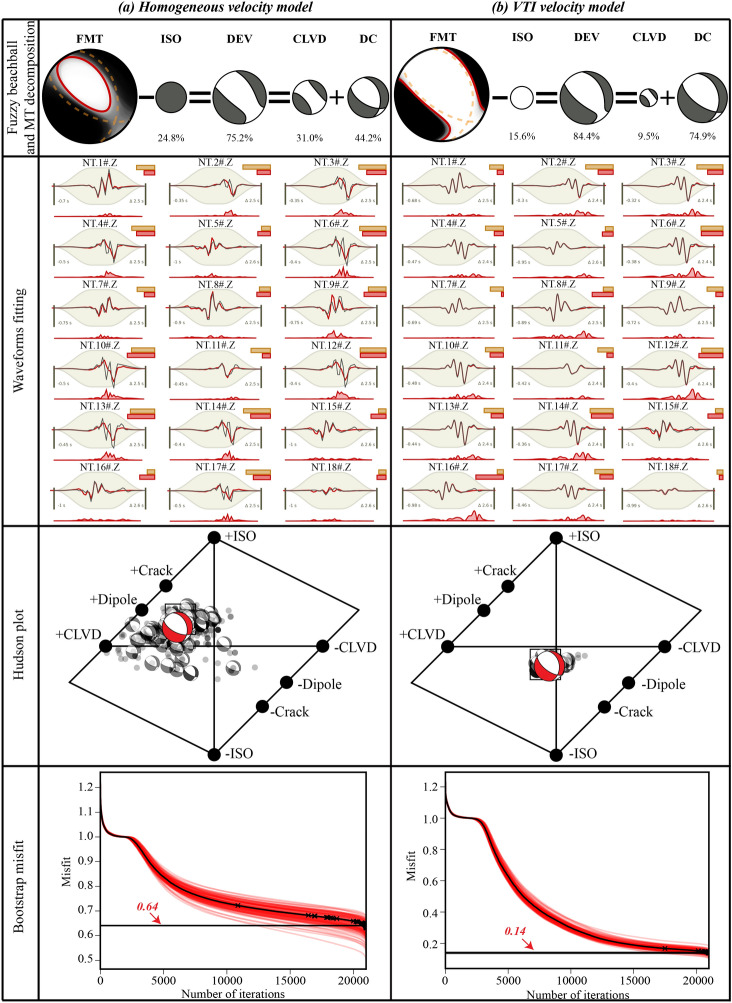
The results from MT inversion, considering both velocity models, are detailed in Table 2. Figure 11 shows selected plots derived from MT inversions, illustrating how the velocity model influences solution robustness. The fuzzy beachball and MT decomposition panel in Fig. 11 highlight how an accurate VTI velocity model enhances MT solution stability, distinctly separating black and white fields. In contrast, neglecting anisotropy results in partially flipped P-wave polarity (from −ISO to  ISO) and introduces spurious source components. This misjudgment of P-wave polarity is evident in waveform fitting plots in Fig. 11a, particularly affecting geophones 5#, 8#, 11#, 15#, 16#, and 18#, due to seismic wave reflection or refraction in anisotropic media. Spurious source components include an increase in non-DC components, up to 24.8% ISO and 31.0% CLVD components. The Hudson plots in Fig. 11, depicting bootstrap chain results, show broader variability in the
  search range, indicating poor resolution of non-DC components. This observation is further highlighted in the bootstrap misfit plots (Fig. 11), where multiple poorly converging bootstrap chain curves (red lines) and a higher global misfit value are evident. Evaluation of DC component stability (Table 2) through Kagan angles52 showed a relatively minor impact from imprecise velocity modelling, with a Kagan angle of
  .
.
Table 2.
Full moment tensor (FMT) solutions, focal mechanism solutions, rupture types, and global misfits for the high-energy tremor event in homogeneous and vertically transversely isotropic (VTI) anisotropy velocity models.
| Velocity model | FMT solution [ ] ] |
Nodal plane 1 [ ] ] |
Nodal plane 2 [ ] ] |
Type of rupture | Misfit | |||||||||
|---|---|---|---|---|---|---|---|---|---|---|---|---|---|---|
| M11 | M22 | M33 | M12 | M13 | M23 | Strike | Dip | Rake | Strike | Dip | Rake | |||
| Homogeneous |

|

|

|

|

|

|
119.8 | 59.0 | −118.9 | 346.8 | 41.4 | −51.2 | Mixed | 0.64 |
| VTI |

|

|

|

|

|

|
125.0 | 63.7 | −113.1 | 348.9 | 34.5 | −51.6 | Shear | 0.14 |
Note: Focal mechanism solutions derived from both velocity models indicate a normal right-lateral oblique faulting mechanism
Fig. 11.
Results of Moment tensor (MT) inversion for (a) homogeneous and (b) vertically transversely isotropic (VTI) anisotropic velocity models. The fuzzy beachball and MT decomposition, waveforms fitting of 18 triggering stations, Hudson plot, and bootstrap misfit results are shown from top to bottom. Fuzzy beachball and MT decomposition panel: the fuzzy beachball illustrates the uncertainty of the MT solution; the separated resolution of black and white fields in the fuzzy plot indicates the stability of the MT solution. A clearer separation corresponds to a more stable solution, and vice versa. The best MT solution is decomposed into the isotropic, double-couple, and compensated linear vector dipole (CLVD) components; corresponding beachballs are drawn according to the proportion of each component. Waveforms fitting panel: the upper text shows the network, station name, and station component; the brown- and red-filled boxes represent the station weights and misfits, respectively; the middle beige background is the time window determined by the taper function; the central red and grey solid lines represent synthetic and observed traces, respectively; the bottom red line shows the trace-amplitude residual for the time domain. Hudson plot panel: the Hudson plot shows the source failure type with the ensemble of bootstrap solutions; the red beachball and square marker show the global best focal mechanism and fitting solution. Bootstrap misfit plane: all models are sorted according to bootstrap-chain misfit values (red lines) and their global misfit value (black line).
Discussion
Variability in underground velocity structures and implications
The tomographic analysis revealed distinct patterns in high-velocity (high-V) and low-velocity (low-V) zones across different levels, highlighting significant complexity and variability. At the thick and rigid roof level (Fig. 7a), a noticeable low-V zone was prominently found near the  12 goaf and its surroundings, while a high-V zone was concentrated near the
  21 mining face, particularly around faults F356 and F9310-3. This suggests that mining activities near the
  12 goaf may have compromised roof stability, potentially reopening sealed fractures during stable subsidence53. Additional fracturing driven by gravity contributed to the formation of these low-V zones. Generally, the formation of a low-V zone results in the redistribution of loads that low-V zones must bear in adjacent areas. Geological complexities, including faults, folds, and erosion zones, acted as conduits for stress transfer, resulting in localized stress concentrations and the emergence of high-V zones54, as illustrated in Fig. 7a. At the
  21 mining face level (Fig. 7b), significant variations in velocity were observed within the F356 and F9310-3 fault zones, accompanied by a prominent low-V zone. These variations likely result from stress concentrations in the roof induced by the activation of faults F356 and F9310-3. Additionally, a low-V zone was identified within the interior of the
  21 mining face, primarily due to expanded goaf areas resulting from ongoing mining operations and the exposure of legacy roadways. This obstruction to wave propagation contributed to relatively low-V values in the working face and its immediate surroundings55. Conversely, stress concentrations at the working face level, influenced by complex geological structures and mining layout, contributed to the formation of significant high-V zones near faults F2 and F3, as well as the tail entry tip. The distribution of high-V and low-V zones at the floor level (Fig. 7c) showed relatively straightforward patterns, delineated by the stopping position as of December 12 2020.
Mechanism behind strong tremor and hazard control
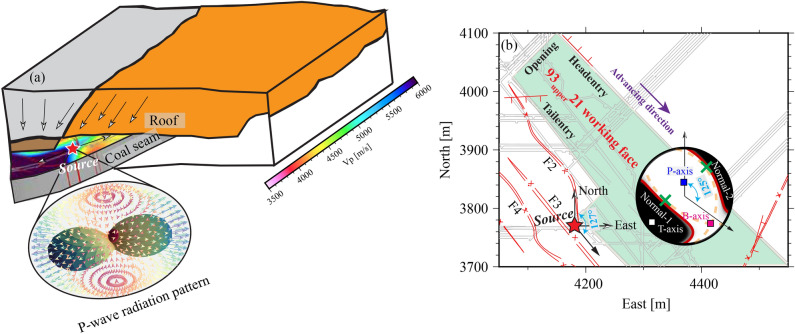
The stable MT analysis provides a foundational understanding of the mechanism behind a high-energy tremor observed in the study area. According to established MT formulations and rupture type criteria56, the event is identified as a shear rupture, likely caused by fault stick-slip dynamics. This process involves quasi-stationary ’sticky’ intervals preceding sudden, rapid movements, during which shear stress accumulates and subsequently drops upon abrupt movement, releasing stored strain energy over time. Insights from the radiation pattern analysis of the tremor and tomographic results (Fig. 12) provide valuable perspectives on likely initiation scenarios and stress distribution characteristics. Prior to the tremor, significant stress concentrations were observed at faults F2 and F3, as well as at the tail entry tip. As mining operations progressed into the up-dip stage, stress distribution along fault planes became increasingly uneven, particularly impacting areas proximal to mining activities where reduced normal stress heightened susceptibility to sliding. Conversely, regions farther from active mining areas exhibited concentrated stress in the normal direction57. The presence of voids induced by mining operations reduces horizontal constraints, ultimately causing fault instability and expansion.
Fig. 12.
Schematic diagram showing the most probable scenarios for tremor patterns. (a) Mechanical model of coal and rock mass failure. Black arrows represent the stress variation direction. The tomographic results of the source region and P-wave radiation pattern are highlighted. (b) Map view of the comparison between the measured and moment tensor inversion results.
The tremor event localized at the junction of faults F2 and F3, although the analysis does not definitively determine fault slip specifics, posing uncertainties for subsequent hazard mitigation. Comparison of the focal mechanism solution (Table 2) with the site’s tectonic map (Fig. 12) revealed a minor  deviation between the
  strike of the solved fault plane and the
  strike of the F3 fault, suggesting a dominant right-lateral normal faulting along F3. Plausible fault plane parameters include a strike of
  , dip angle of
  , and slip angle of
  . Based on the fault slip mechanism58, it is advisable to consider both roof and F3 fault management in subsequent prevention and control measures. Effective hazard control strategies demand comprehensive management of both roof stability and fault dynamics. Recommendations include targeted roof destress blasting and anchor bolt support aligned with the principal compressive stress axis (P-axis) and tensile stress axis (T-axis) orientations (Fig. 12b).
Despite a minor  deviation introduced by neglecting anisotropy in geometric analysis, the presence of spurious non-DC components significantly influenced the interpretation of rupture type. Focusing on a homogeneous velocity model emphasizing tensile-shear rupture might have inadvertently redirected attention to the F3 fault, potentially overlooking critical measures needed for roof stabilization and compromising hazard mitigation efforts.
The issue of seismic location errors and inversion uncertainties caused by the strong heterogeneity of the underground velocity structure has never ceased59,60. While our study has involved using sequential inversion to reveal the complexity of source mechanisms in an anisotropic coal mine, the inherent limitations need to be acknowledged to guide future work. The deployment of single-component geophones close to the source results in the S-wave onset being buried in the P-wave conda, preventing them from being decoupled61. This limitation makes it difficult for us to conduct S-wave tomography in this work.
In future research, with improvements in geophone performance and layout, we will integrate S-wave data to obtain more effective complex source information. Additionally, waveform-based inversion methods, which account for multipathing effects, will replace traveltime-based methods and become key technologies for improving the source location and MT inversion accuracy62–65. By combining S-wave data and waveform inversion techniques, we can better handle complex subsurface structures and nonlinear source mechanisms, further improving the accuracy of source parameters, particularly in near-source areas. This will improve our understanding of mining-induced seismicity characteristics and provide more reliable technical support for future mining safety and risk assessments.
Conclusions
This study has underscored the pivotal importance of properly accounting for anisotropic effects when characterising seismic source mechanisms in mining-induced seismicity. By employing a sequential inversion strategy that incorporated a VTI velocity model, we were able to uncover several critical insights.
First, the results revealed that neglecting anisotropy can lead to significant distortions, including flipped P-wave polarity and the introduction of spurious non-double-couple components. These artefacts could result in the misinterpretation of the initiation mechanism of the seismic event, suggesting that the non-double-couple components observed in some cases of mining-induced seismicity may be linked to the failure to account for anisotropic effects. In contrast, the sequential inversion strategy utilising the more accurate VTI velocity model was able to significantly reduce errors in retrieving the true source characteristics. The analysis showed that the high-energy (2.18 106 J) mining-induced tremor was most likely caused by a normal right-lateral oblique movement along the F3 fault, with a strike of
  , a dip angle of
  , and a slip angle of
  .
.
Ultimately, this study has demonstrated the critical role of anisotropy in the reliable characterisation of seismic source mechanisms in mining-induced seismicity. The proposed sequential inversion strategy provides a robust framework for incorporating anisotropic effects and enhancing the accuracy of hazard assessment and risk management in these complex geological settings. By accounting for anisotropic effects, researchers can gain a more precise understanding of the underlying mechanisms driving mining-induced seismicity, enabling the development of more effective mitigation strategies and improved safety in mining operations.
Acknowledgements
The Reviews provided by editors and two anonymous referees significantly improved this manuscript. The authors would like to express their gratitude to T. C. Sunilkumar and Hannes Vasyura-Bathke for their detailed explanation and guidance regarding the moment tensor inversion. This study was funded by the Graduate Innovation Program of the China University of Mining and Technology (2023WLKXJ024) for Chun-Hui Song, the National Natural Science Foundation of China (51574225), Shandong Energy Group (SNKJ2022BJ03-R28) for Cai-Ping Lu, and Japan Society for the Promotion of Science (19H01996) for Dapeng Zhao. Figures were prepared using the free software package Generic Mapping Tools (GMT) version 666 and the Python library Matplotlib67.
Author contributions
C.-H.S. planned and executed the research project and drafted the original manuscript. C.-P.L. organised and analysed the data and contributed to the review and editing of the manuscript. X.-F.Z. and C.W. managed project administration and data curation. J.-F.S. and Y.L. assisted with the manuscript review, editing, and investigation. S.-D.L. was involved in interpreting the results. D.Z. participated in the manuscript review and editing, methodology, and software development.
Data availability
All data analyzed during this work are included in this published paper and are available from the corresponding author on reasonable request.
Declarations
Competing interests
The authors declare no competing interests.
Footnotes
Publisher’s note
Springer Nature remains neutral with regard to jurisdictional claims in published maps and institutional affiliations.
References
- 1.Grigoli, F. et al. Current challenges in monitoring, discrimination, and management of induced seismicity related to underground industrial activities: A European perspective. Reviews of Geophysics55, 310–340 (2017). [Google Scholar]
- 2.Doglioni, C. A classification of induced seismicity. Geoscience Frontiers9, 1903–1909 (2018). [Google Scholar]
- 3.Wilson, M., Foulger, G., Gluyas, J., Davies, R. & Julian, B. HiQuake: The human-induced earthquake database. Seismological Research Letters88, 1560–1565 (2017). [Google Scholar]
- 4.Andersen, L. A relative moment tensor inversion technique applied to seismicity induced by mining. Ph.D. thesis, University of the Witwatersrand, Johannesburg (2001).
- 5.Kühn, D. & Vavryčuk, V. Determination of full moment tensors of microseismic events in a very heterogeneous mining environment. Tectonophysics589, 33–43 (2013). [Google Scholar]
- 6.Song, C.-H. et al. Moment tensor inversion and stress evolution of coal pillar failure mechanism. Rock Mechanics and Rock Engineering55, 2371–2383 (2022). [Google Scholar]
- 7.Li, X.-B., Wang, Z.-W. & Dong, L.-J. Locating single-point sources from arrival times containing large picking errors (LPEs): the virtual field optimization method (VFOM). Scientific Reports6, 19205 (2016). [DOI] [PMC free article] [PubMed] [Google Scholar]
- 8.Young, R. & Collins, D. Seismic studies of rock fracture at the Underground Research Laboratory, Canada. International Journal of Rock Mechanics and Mining Sciences38, 787–799 (2001). [Google Scholar]
- 9.Cai, M., Kaiser, P. & Martin, C. Quantification of rock mass damage in underground excavations from microseismic event monitoring. International Journal of Rock Mechanics and Mining Sciences38, 1135–1145 (2001). [Google Scholar]
- 10.Leake, M. R., Conrad, W. J., Westman, E. C., Afrouz, S. G. & Molka, R. J. Microseismic monitoring and analysis of induced seismicity source mechanisms in a retreating room and pillar coal mine in the Eastern United States. Underground Space2, 115–124 (2017). [Google Scholar]
- 11.Ma, J., Dong, L., Zhao, G. & Li, X. Focal mechanism of mining-induced seismicity in fault zones: a case study of yongshaba mine in China. Rock Mechanics and Rock Engineering52, 3341–3352 (2019). [Google Scholar]
- 12.Jost, M. L. & Herrmann, R. B. A student’s guide to and review of moment tensors. Seismological Research Letters60, 37–57 (1989). [Google Scholar]
- 13.Cesca, S. & Grigoli, F. Full waveform seismological advances for microseismic monitoring. Advances in Geophysics56, 169–228 (2015). [Google Scholar]
- 14.Dahm, T. & Krüger, F. Moment tensor inversion and moment tensor interpretation. In New manual of seismological observatory practice 2 (NMSOP-2), 1–37 (Deutsches GeoForschungsZentrum GFZ, 2014).
- 15.Song, C.-H. et al. Moment tensor inversion and coseismic stress characteristics of mining-induced seismicity in coal pillar area. Rock Mechanics and Rock Engineering56, 6285–6298 (2023). [Google Scholar]
- 16.Alvizuri, C., Silwal, V., Krischer, L. & Tape, C. Estimation of full moment tensors, including uncertainties, for nuclear explosions, volcanic events, and earthquakes. Journal of Geophysical Research: Solid Earth123, 5099–5119 (2018). [Google Scholar]
- 17.Křížová, D., Zahradník, J. & Kiratzi, A. Resolvability of isotropic component in regional seismic moment tensor inversion. Bulletin of the Seismological Society of America103, 2460–2473 (2013). [Google Scholar]
- 18.Mustać, M. & Tkalčić, H. Point source moment tensor inversion through a Bayesian hierarchical model. Geophysical Journal International204, 311–323 (2016). [Google Scholar]
- 19.Sen, A. T., Cesca, S., Bischoff, M., Meier, T. & Dahm, T. Automated full moment tensor inversion of coal mining-induced seismicity. Geophysical Journal International195, 1267–1281 (2013). [Google Scholar]
- 20.Šılenỳ, J. Regional moment tensor uncertainty due to mismodeling of the crust. Tectonophysics383, 133–147 (2004). [Google Scholar]
- 21.Cesca, S., Buforn, E. & Dahm, T. Amplitude spectra moment tensor inversion of shallow earthquakes in Spain. Geophysical Journal International166, 839–854 (2006). [Google Scholar]
- 22.Šılenỳ, J. & Vavryčuk, V. Can unbiased source be retrieved from anisotropic waveforms by using an isotropic model of the medium?. Tectonophysics356, 125–138 (2002). [Google Scholar]
- 23.Ma, J., Wu, S., Zhao, Y. & Zhao, G. Cooperative P-wave velocity measurement with full waveform moment tensor inversion in transversely anisotropic media. Sensors22, 1935 (2022). [DOI] [PMC free article] [PubMed] [Google Scholar]
- 24.Whyatt, J., Blake, W., Williams, T. & White, B. 60 years of rockbursting in the coeur d’Alene District of Northern Idaho, USA: lessons learned and remaining issues. In Proceedings of the 2002 SME Annual Meeting and Exhibit (Society for Mining, Metallurgy, and Exploration, Inc., Phoenix, 2002).
- 25.McGarr, A., Simpson, D. & Seeber, L. 40 - Case histories of induced and triggered seismicity. In Lee, W. H., Kanamori, H., Jennings, P. C. & Kisslinger, C. (eds.) International Handbook of Earthquake and Engineering Seismology, Part A, vol. 81 of International Geophysics, 647–661 (Academic Press, 2002).
- 26.Zhao, D., Hasegawa, A. & Horiuchi, S. Tomographic imaging of P and S wave velocity structure beneath northeastern Japan. Journal of Geophysical Research: Solid Earth97, 19909–19928 (1992). [Google Scholar]
- 27.Wang, Z., Li, X., Zhao, D., Shang, X. & Dong, L. Time-lapse seismic tomography of an underground mining zone. International Journal of Rock Mechanics and Mining Sciences107, 136–149 (2018). [Google Scholar]
- 28.Zhang, S., Wu, S. & Wang, L. Hazard Prediction and Prevention of Impact Ground Pressure of Tunneling Faces under Complicated Conditions. Coal Technology37, 212–213 (2018) ([in Chinese]). [Google Scholar]
- 29.Wang, C., Si, G., Zhang, C., Cao, A. & Canbulat, I. Location error based seismic cluster analysis and its application to burst damage assessment in underground coal mines. International Journal of Rock Mechanics and Mining Sciences143, 104784 (2021). [Google Scholar]
- 30.Stec, K. Characteristics of seismic activity of the Upper Silesian Coal Basin in Poland. Geophysical Journal International168, 757–768 (2007). [Google Scholar]
- 31.Mendecki, M. J., Wojtecki, Ł & Zuberek, W. M. Case studies of seismic energy release ahead of underground coal mining before strong tremors. Pure and Applied Geophysics176, 3487–3508 (2019). [Google Scholar]
- 32.Foulger, G. & Julian, B. R. Non-double-couple earthquakes. Encyclopedia of Earthquake Engineering 1–31 (2015).
- 33.Gilbert, F. Excitation of the normal modes of the earth by earthquake sources. Geophysical Journal International22, 223–226 (1971). [Google Scholar]
- 34.Dahlen, F. & Tromp, J. Theoretical global seismology. In Theoretical Global Seismology (Princeton University Press, 2020).
- 35.Aki, K. & Richards, P. G. Quantitative Seismology (University Science Books, Sausalito, California, 2002), 2 edn.
- 36.Thurber, C. H. Earthquake locations and three-dimensional crustal structure in the Coyote Lake area, central California. Journal of Geophysical Research: Solid Earth88, 8226–8236 (1983). [Google Scholar]
- 37.Heimann, S. A robust method to estimate kinematic earthquake source parameters. Ph.D. thesis, Staats-und Universitätsbibliothek Hamburg Carl von Ossietzky (2011).
- 38.Krieger, L. U. Automated inversion of long period signals from shallow volcanic and induced seismic events. Ph.D. thesis, Staats-und Universitätsbibliothek Hamburg Carl von Ossietzky (2011).
- 39.Pavlis, G. L. & Booker, J. R. The mixed discrete-continuous inverse problem: Application to the simultaneous determination of earthquake hypocenters and velocity structure. Journal of Geophysical Research: Solid Earth85, 4801–4810 (1980). [Google Scholar]
- 40.Paige, C. C. & Saunders, M. A. LSQR: An algorithm for sparse linear equations and sparse least squares. ACM Transactions on Mathematical Software (TOMS)8, 43–71 (1982). [Google Scholar]
- 41.Kühn, D., Heimann, S., Isken, M. P., Ruigrok, E. & Dost, B. Probabilistic moment tensor inversion for hydrocarbon-induced seismicity in the Groningen gas field, The Netherlands, Part 1: Testing. Bulletin of the Seismological Society of America110, 2095–2111 (2020). [Google Scholar]
- 42.Heimann, S. et al. Pyrocko-An open-source seismology toolbox and library (2017).
- 43.Heimann, S. et al. Grond: A probabilistic earthquake source inversion framework (2018).
- 44.Simmons, G. Velocity of compressional waves in various minerals at pressures to 10 kilobars. Journal of Geophysical Research69, 1117–1121 (1964). [Google Scholar]
- 45.Zhao, D. Multiscale Seismic Tomography (Springer Tokyo Press, New York, 2015). [Google Scholar]
- 46.Barthwal, H. & van der Baan, M. Passive seismic tomography using recorded microseismicity: Application to mining-induced seismicity. Geophysics84, B41–B57 (2019). [Google Scholar]
- 47.Wang, Z., Zhao, D., Chen, X. & Gao, R. Subducting slabs, Hainan plume and intraplate volcanism in SE Asia: Insight from P-wave mantle tomography. Tectonophysics831, 229329 (2022). [Google Scholar]
- 48.Brantut, N. & David, E. C. Influence of fluids on VP/VS ratio: increase or decrease?. Geophysical Journal International216, 2037–2043 (2019). [Google Scholar]
- 49.Wang, R. A simple orthonormalization method for stable and efficient computation of Green’s functions. Bulletin of the Seismological Society of America89, 733–741 (1999). [Google Scholar]
- 50.Heimann, S. et al. A Python framework for efficient use of pre-computed Green’s functions in seismological and other physical forward and inverse source problems. Solid Earth10, 1921–1935 (2019). [Google Scholar]
- 51.Song, C.-H. et al. Moment tensor and stress field inversions of mining-induced seismicity in a thick-hard roof zone. Rock Mechanics and Rock Engineering57, 2267–2287 (2024). [Google Scholar]
- 52.Kagan, Y. 3-D rotation of double-couple earthquake sources. Geophysical Journal International106, 709–716 (1991). [Google Scholar]
- 53.Mohd-Nordin, M. M., Song, K.-I., Cho, G.-C. & Mohamed, Z. Long-wavelength elastic wave propagation across naturally fractured rock masses. Rock Mechanics and Rock Engineering47, 561–573 (2014). [Google Scholar]
- 54.Waldhauser, F., Ellsworth, W., Schaff, D. P. & Cole, A. Streaks, multiplets, and holes: High-resolution spatio-temporal behavior of Parkfield seismicity. Geophysical Research Letters31 (2004).
- 55.Hua, Y., Zhao, D. & Xu, Y. P wave anisotropic tomography of the Alps. Journal of Geophysical Research: Solid Earth122, 4509–4528 (2017). [Google Scholar]
- 56.Vavryčuk, V. Moment tensor decompositions revisited. Journal of Seismology19, 231–252 (2015). [Google Scholar]
- 57.Yang, J. et al. Energy budget and fast rupture on a near-excavation fault: Implications for mitigating induced seismicity. Journal of Geophysical Research: Solid Earth125, e2020JB019360 (2020).
- 58.Pavlis, G. L. An Introduction to Seismology, Earthquakes, and Earth Structure by Seth Stein and Michael Wysession. Seismological Research Letters74, 824–825 (2003). [Google Scholar]
- 59.Collins, D., Toya, Y., Pinnock, I., Shumila, V. & Hosseini, Z. 3D velocity model with complex geology and voids for microseismic location and mechanism. In Deep Mining 2014: Proceedings of the Seventh International Conference on Deep and High Stress Mining, 681–688 (Australian Centre for Geomechanics, 2014).
- 60.Shang, X., Miao, R. & Wang, Y. Microseismic source location using a 3d velocity model: From the ray tracing method to waveform inversion. IOP Conference Series: Earth and Environmental Science861, 042025 (2021). [Google Scholar]
- 61.Song, C. et al. Multiscale monitoring and analysis of complex rupture and source mechanisms of mining-related seismicity on fault networks. Journal of Rock Mechanics and Geotechnical Engineering (2024).
- 62.Willacy, C. et al. Full-waveform event location and moment tensor inversion for induced seismicity. Geophysics84, KS39–KS57 (2019). [Google Scholar]
- 63.Jarillo, Michel O. & Tsvankin, I. Waveform inversion for microseismic velocity analysis and event location in VTI media. Geophysics82, WA95–WA103 (2017). [Google Scholar]
- 64.Shekar, B. & Sethi, H. S. Full-waveform inversion for microseismic events using sparsity constraints. Geophysics84, KS1–KS12 (2019).
- 65.Eyre, T. S. & van der Baan, M. Overview of moment-tensor inversion of microseismic events. The Leading Edge34, 882–888 (2015). [Google Scholar]
- 66.Wessel, P. et al. The generic mapping tools version 6. Geochemistry, Geophysics, Geosystems20, 5556–5564 (2019). [Google Scholar]
- 67.Hunter, J. D. Matplotlib: A 2D graphics environment. Computing in Science & Engineering9, 90–95 (2007). [Google Scholar]
Associated Data
This section collects any data citations, data availability statements, or supplementary materials included in this article.
Data Availability Statement
All data analyzed during this work are included in this published paper and are available from the corresponding author on reasonable request.


