

Abstract
Purpose
To measure the benefit of single-phase CT, inspiratory-expiratory CT, and clinical data for convolutional neural network (CNN)–based chronic obstructive pulmonary disease (COPD) staging.
Materials and Methods
This retrospective study included inspiratory and expiratory lung CT images and spirometry measurements acquired between November 2007 and April 2011 from 8893 participants (mean age, 59.6 years ± 9.0 [SD]; 53.3% [4738 of 8893] male) in the COPDGene phase I cohort (ClinicalTrials.gov: NCT00608764). CNNs were trained to predict spirometry measurements (forced expiratory volume in 1 second [FEV1], FEV1 percent predicted, and ratio of FEV1 to forced vital capacity [FEV1/FVC]) using clinical data and either single-phase or multiphase CT. Spirometry predictions were then used to predict Global Initiative for Chronic Obstructive Lung Disease (GOLD) stage. Agreement between CNN-predicted and reference standard spirometry measurements and GOLD stage was assessed using intraclass correlation coefficient (ICC) and compared using bootstrapping. Accuracy for predicting GOLD stage, within-one GOLD stage, and GOLD 0 versus 1–4 was calculated.
Results
CNN-predicted and reference standard spirometry measurements showed moderate to good agreement (ICC, 0.66–0.79), which improved by inclusion of clinical data (ICC, 0.70–0.85; P ≤ .04), except for FEV1/FVC in the inspiratory-phase CNN model with clinical data (P = .35) and FEV1 in the expiratory-phase CNN model with clinical data (P = .33). Single-phase CNN accuracies for GOLD stage, within-one stage, and diagnosis ranged from 59.8% to 84.1% (682–959 of 1140), with moderate to good agreement (ICC, 0.68–0.70). Accuracies of CNN models using inspiratory and expiratory images ranged from 60.0% to 86.3% (684–984 of 1140), with moderate to good agreement (ICC, 0.72). Inclusion of clinical data improved agreement and accuracy for both the single-phase CNNs (ICC, 0.72; P ≤ .001; accuracy, 65.2%–85.8% [743–978 of 1140]) and inspiratory-expiratory CNNs (ICC, 0.77–0.78; P ≤ .001; accuracy, 67.6%–88.0% [771–1003 of 1140]), except expiratory CNN with clinical data (no change in GOLD stage ICC; P = .08).
Conclusion
CNN-based COPD diagnosis and staging using single-phase CT provides comparable accuracy with inspiratory-expiratory CT when provided clinical data relevant to staging.
Keywords: Convolutional Neural Network, Chronic Obstructive Pulmonary Disease, CT, Severity Staging, Attention Map
Supplemental material is available for this article.
© RSNA, 2024
Keywords: Convolutional Neural Network, Chronic Obstructive Pulmonary Disease, CT, Severity Staging, Attention Map

Summary
The study demonstrates that convolutional neural networks can accurately diagnose and stage chronic obstructive pulmonary disease with inspiratory-only chest CT combined with clinical data.
Key Points
■ Diagnosis and staging of chronic obstructive pulmonary disease (COPD) by a convolutional neural network (CNN) were feasible using single-phase inspiratory or single-phase expiratory CT, and within-one stage accuracies (83.5% [952 of 1140] and 84.1% [959 of 1140], respectively) were comparable to that of inspiratory-expiratory CT (86.3% [984 of 1140]).
■ Inclusion of clinical data into the CNN algorithm significantly improved COPD Global Initiative for Chronic Obstructive Lung Disease stage accuracy for single-phase inspiratory CT (60.0% [684 of 1140] to 65.2% [743 of 1140]; P < .001), single-phase expiratory CT (59.8% [682 of 1140] to 65.7% [749 of 1140]; P < .001), and inspiratory-expiratory CT (63.9% [729 of 1140] to 67.9% [774 of 1140]; P < .001).
Introduction
Chronic obstructive pulmonary disease (COPD) is a progressive lung disease characterized by inflammation of the airways, hyperinflation of the lungs, destruction of downstream alveoli and vasculature (ie, emphysema), and trapping of air behind obstructed airways (ie, air trapping). The resulting symptoms, which include shortness of breath and fatigue, worsen over time, making COPD the third leading cause of death worldwide (1). Because there is currently no cure, research often focuses on diagnosis, staging, and treatment (2). COPD is traditionally diagnosed using history of risk factors (eg, tobacco use), severity of symptoms, and pulmonary function testing. However, studies have recently shown that lung structure, quantitatively measured using lung CT, can supplement COPD severity staging, diagnosis, and prognosis (3–5).
CT measurements of emphysema and air trapping typically require two acquisitions, one at full inhalation (ie, inspiratory) and one at normal exhalation (ie, expiratory), the latter of which can be used to measure small airway obstruction (6–9). Although caliber changes of small airways may be below the spatial resolution of CT, air trapping has been used as a strong prognostic marker of multiple diseases and may be the only sign of early-stage small airways disease (10,11). Multiple methods have been proposed to measure severity of air trapping, leveraging deep learning to identify low attenuation areas on inspiratory (≤ –950 HU) and expiratory (≤ –856 HU) images (9,12,13). Advanced methods, such as parametric response maps and attenuation difference maps (6–8), coregister inspiratory and expiratory images to compute regional changes in lung attenuation. Additionally, convolutional neural networks (CNNs), a subset of artificial intelligence algorithms, have been used to predict COPD stage and clinical outcomes using inspiratory-expiratory CT as input but require imaging of both respiratory phases to measure emphysema and air trapping (6,7).
Despite the development of these methods and evidence of their prognostic value, clinical implementation and adoption of inspiratory-expiratory CT remains limited, partly due to challenges related to expiratory image acquisition (11). When expiratory CT is unavailable, early-stage COPD can go undetected, especially if inspiratory CT shows no abnormal findings (10). Furthermore, multiphasic examinations require additional exposure to ionizing radiation, which can be a limitation, particularly for patients who require multiple examinations over the course of their clinical care (10). If the current inspiratory-expiratory imaging protocol could be reduced to a single acquisition with minimal loss in diagnostic and staging performance, this could improve accessibility to CT-based screening for COPD and reduce patients’ exposure to ionizing radiation.
The objective of this study was to rigorously quantify the benefit of inspiratory CT, expiratory CT, and clinical data for staging COPD by leveraging CNNs to directly infer COPD disease severity. We therefore developed several CNNs to predict spirometric measurements and disease stage using different configurations of CT and clinical data as input. We subsequently leveraged attention maps to assess the principal sources of image information used by the CNNs to infer disease stage.
Materials and Methods
This retrospective study is Health Insurance Portability and Accountability Act compliant and University of California San Diego institutional review board approved with waived requirement for written informed consent.
Dataset
The dataset included noncontrast lung CT images, spirometry measurements, CT-based lung measurements, and demographic information from 9543 research participants of the COPDGene phase 1 cohort (ClinicalTrials.gov: NCT00608764) (14). The COPDGene project has resulted in more than 400 publications from other research groups. The analysis presented has not been previously performed on the COPDGene dataset. All data were acquired consecutively between November 2007 and April 2011 from participants with a smoking history of more than 10 pack-years. CT images captured the entire thorax at full inspiration and normal expiration. Spirometry included forced expiratory volume in 1 second (FEV1), FEV1 to forced vital capacity (FVC) ratio, and FEV1 percent predicted (FEV1pp) following administration of 180 μg of albuterol (14,15). Participants were classified into spirometry-based severity stages according to Global Initiative for Chronic Obstructive Lung Disease (GOLD) guidelines. Participants with reduced FEV1pp of less than 80% but FEV1/FVC of 0.7 or more (preserved ratio impaired spirometry [PRISm]; n = 1070) were also included in this study (16). Details on imaging, spirometry, and clinical data collection can be found in Appendix S1. CT-based lung measurements were calculated using LungReg, a CNN-based deformable registration algorithm, and included percentage of emphysema, percentage of air trapping, total lung capacity, and functional residual capacity for inspiratory and expiratory images (8). A full list of the lung measurements included is reported in Appendix S2. Demographics included age, height, weight, body mass index, sex, smoking status, and number of pack-years. Exclusion criteria were missing CT images (n = 534) or spirometry measurements (n = 116), resulting in 8893 participants included in this study.
Study Design
An overview of participant selection and study design is shown in Figure 1. Expiratory images were deformably registered to inspiratory images using LungReg (8). We then trained four residual attention CNNs to predict FEV1, FEV1/FVC, and FEV1pp using the following combinations of CT images as input: inspiratory only (I-CNN); expiratory only (E-CNN); inspiratory and expiratory (I-E-CNN); and inspiratory, expiratory, and deformed expiratory (I-E-DE-CNN). Four additional CNNs were trained with clinical data (voxel dimensions, lung measurements, and demographics) as additional input to evaluate their added benefit. For the eight models, CNN-predicted spirometry measurements were used to stage COPD severity according to GOLD guidelines and evaluated using spirometry-based GOLD stages as the reference standard. Deformable registrations and image preprocessing were performed in Python, version 3.6.2 (Python Software Foundation), using Keras-TensorFlow, version 2.2.0 (17).
Figure 1:

Flowchart of participant selection and study design. CNN = convolutional neural network, COPD = chronic obstructive pulmonary disease, DE = deformably registered expiratory CT image, E = expiratory CT image, FEV1 = forced expiratory volume in 1 second, FEV1pp = forced expiratory volume in 1 second percent predicted, FVC = forced vital capacity, GOLD = Global Initiative for Chronic Obstructive Lung Disease, I = inspiratory CT image.
CNN Architecture
The CNNs are a three-dimensional extension of the two-dimensional residual attention network proposed by Wang et al (18). The residual attention network is a class of CNN that incorporates attention modules throughout its architecture. Attention modules produce masks that enhance imaging features important for prediction while suppressing unimportant features, resulting in improved performance. These masks can be used to visualize areas of the input image contributing to the network’s predictions. Voxel dimensions, lung measurements, and demographics were incorporated into the architecture by appending a multilayer perceptron network to the final fully connected layer. Details regarding the residual attention network architecture and the inclusion of clinical data are available in Appendix S3.
Deep Learning Model Training
Images were resized to 192 × 192 × 192 resolution, standardized to headfirst orientation, and scaled by 1/3000 for training. Spirometry measurements were normalized to 0–1. Participants were randomly partitioned into training (n = 6820), validation (n = 933), and testing (n = 1140) sets. Partitions were kept consistent across all models for paired comparison. I-, E-, and I-E-CNNs were trained using the Adam optimizer, a learning rate of 1e-6, and a batch size of 4; the I-E-DE-CNN used a batch size of 2 to overcome graphics processing unit memory limitations. CNNs were first trained on participants from GOLD stages 0–4 and subsequently trained on all participants (including PRISm). Training was halted when validation performance stopped improving. Details on training and hyperparameter optimization are included in Appendix S3.
Interpretation of Model Decisions
To verify the CNNs’ focus on the lungs, we extracted attention maps from the first and last attention modules of each CNN for a randomly selected participant from each GOLD stage. These attention maps were used to visualize the low-level (eg, texture) and high-level (eg, shape) imaging features important for prediction (18).
Statistical Analysis
Statistical analysis was performed in R (version 2023.09.0+463; RStudio) (19) and verified by a statistician with 12 years’ experience (K.A.H.). Clinical data and spirometry measurements were summarized using means ± SDs for continuous variables and frequencies and percentages for categorical variables. Agreement between CNN-predicted and reference standard spirometry measurements was assessed using intraclass correlation coefficient (ICC) and Bland-Altman analysis. Agreement between CNN-predicted and reference standard GOLD stages was assessed using ICC (20). ICCs were interpreted using guidelines—less than 0.5, poor; greater than or equal to 0.5 and less than 0.75, moderate; greater than or equal to 0.75 and less than 0.9, good; greater than or equal to 0.9, excellent (21)—and compared using bootstrapping. Accuracies and sensitivities for predicting GOLD stage, within-one GOLD stage, and diagnosis (GOLD 0 vs 1–4) were analytically calculated and compared using the McNemar test. CIs were computed using bootstrapping. Statistical significance was evaluated using a type I error rate of 5%.
Results
Overview of Dataset
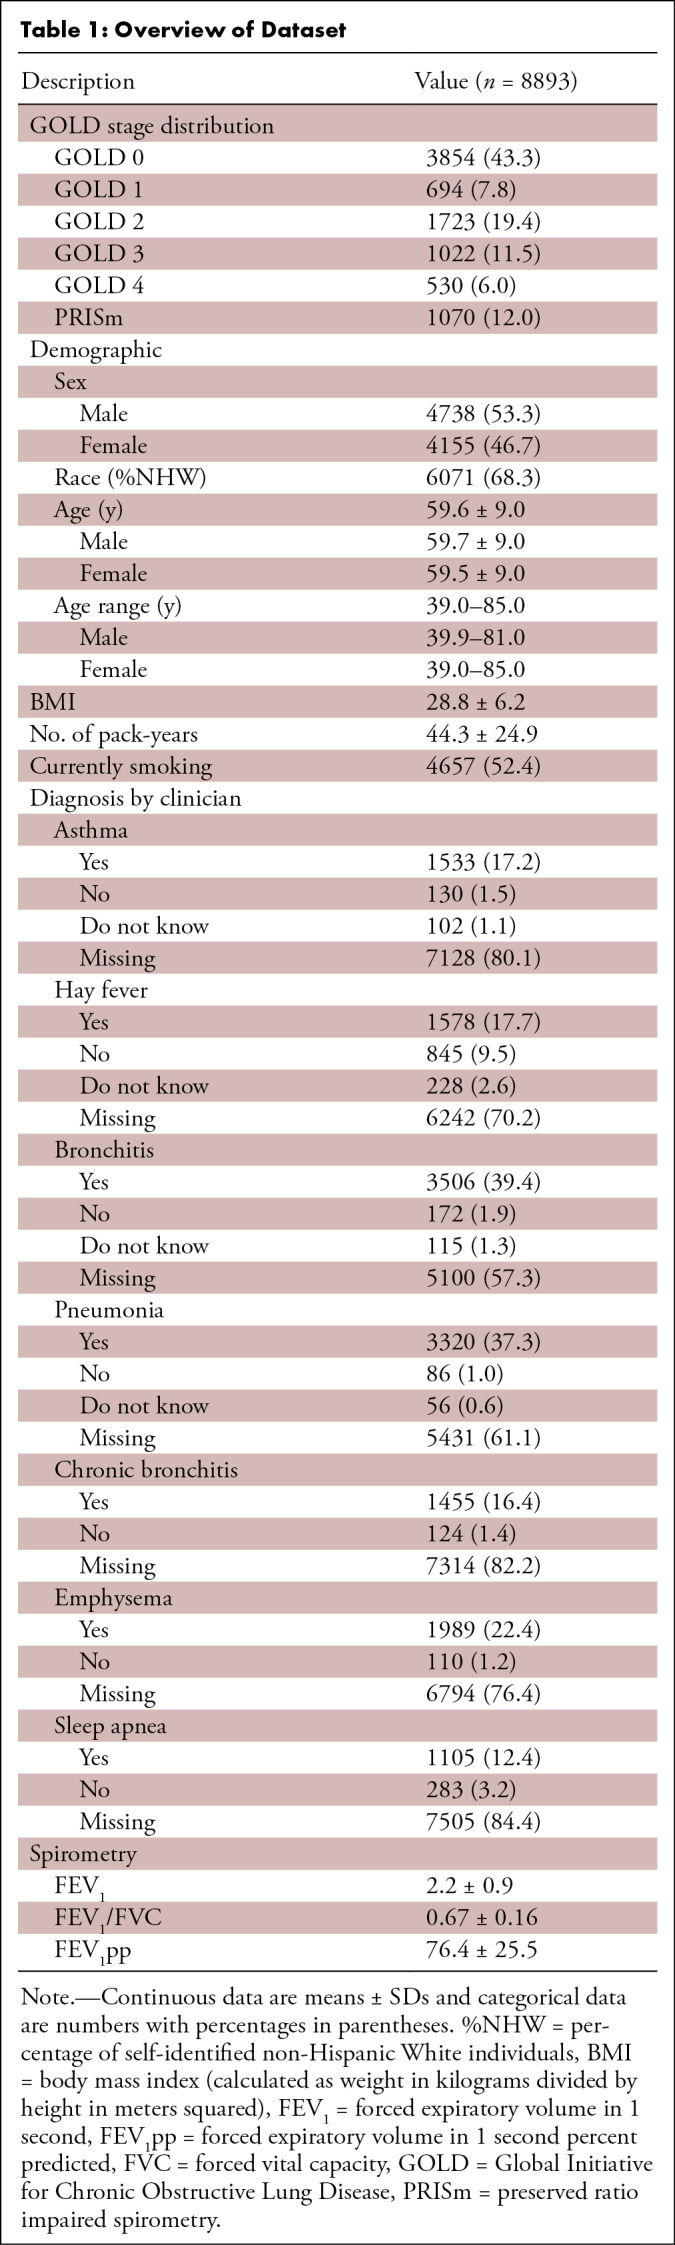
Distribution of GOLD stages, demographics, and spirometry measurements for the 8893 participants (mean age, 59.6 years ± 9.0 [SD]; 53.3% [4738 of 8893] male, 46.7% [4155 of 8893] female) included in this study are shown in Table 1. Two participants missing number of pack-years were omitted from the pack-years calculation. Based on spirometry, 43.3% (3854 of 8893) of patients were classified as GOLD 0. GOLD 1 and 4 individuals each represented less than 10% of the data used in the study (7.8% [694 of 8893] and 6.0% [530 of 8893], respectively). A total of 12% (1070 of 8893) of participants were classified as PRISm. For the results presented in this work, PRISm is included in the GOLD 0 classification, except where otherwise stated.
Table 1:
Overview of Dataset
Agreement between CNN-predicted and Reference Standard Spirometry Measurements
CNN-predicted and reference standard spirometry measurements (Table 2) achieved moderate to good agreement for single-phase CNNs (ICC, 0.66–0.79) and inspiratory-expiratory CNNs (ICC, 0.72–0.80), mostly improved by inclusion of clinical data (ICC, 0.70–0.80; P ≤ .04 and ICC, 0.76–0.85; P ≤ .001, respectively). Inclusion of clinical data provided no change for FEV1/FVC in the I-CNN and FEV1 in the E-CNN (P = .35 and P = .33, respectively). Bland-Altman statistics and plots (Table 2) showed significant biases across several spirometry measurements. However, biases were small in magnitude, and limits of agreement were relatively narrow when compared with the ranges of the reference standard spirometry measurements. CNNs tended to overpredict smaller spirometry measurements and underpredict larger measurements, but this bias was mitigated by the inclusion of clinical data. ICC and Bland-Altman plots visualizing agreement between CNN-predicted and reference standard spirometry measurements are available in Figures S1 and S2.
Table 2:
Statistical Analysis of CNN-predicted Spirometric Values

CNN Performance for GOLD Staging
ICCs and accuracies for CNN-predicted GOLD stages, as compared with reference standard GOLD stages, are shown in Table 3. Agreement across GOLD stages was moderate to good for single-phase CNNs (ICC, 0.68–0.70), with accuracies for single stage, within-one stage, and diagnosis ranging from 59.8% to 84.1% (682–959 of 1140). ICCs for inspiratory-expiratory CNNs also indicated moderate to good agreement across GOLD stages (ICC, both 0.72), with accuracies ranging from 60.0% to 86.3% (684–984 of 1140). These values improved by inclusion of clinical data for both the single-phase CNNs (ICC, 0.72; P ≤ .001; accuracy, 65.2%–85.8% [743–978 of 1140]) and inspiratory-expiratory CNNs (ICC, 0.77–0.78; P ≤ .001; accuracy, 67.6%–88.0% [771–1003 of 1140]). The E-CNN with clinical data showed no change in GOLD stage ICC after inclusion of clinical data (P = .08).
Table 3:
Accuracy and Intraclass Correlation Coefficients of Model Predictions for Calculating COPD Severity Stage

Overall, CNNs showed modest improvement with the inclusion of additional CT images, with the exception of the I-E-DE-CNN, which showed a decrease in accuracy (P < .001) and no change in ICC (P = .38) compared with the I-E-CNN. The inclusion of clinical data improved performance across both single- and multiphase CNNs (P ≤ .001), with the I-E-DE-CNN with clinical data achieving the highest observed accuracy (88.0% [1003 of 1140], within-one stage). Interestingly, the single-phase CNNs, I-CNN with clinical data, and E-CNN with clinical data achieved comparable within-one stage accuracy to the multiphase CNNs without clinical data (P = .43 and P = .19, respectively).
Sensitivities (Table 4) for detecting spirometric COPD (GOLD 1–4) ranged from 69.8% (358 of 513) for I-CNN with clinical data to 86.4% (443 of 513) for E-CNN. Sensitivities for severe stages (GOLD 3–4 and GOLD 4) were less than 60% (46.5%–56.6% [92–112 of 198] and 6.9%–22% [4–13 of 58], respectively) for models without clinical data due to underprediction of spirometry measurements. Including clinical data largely improved sensitivity of the severe stages for both single- and multiphase CNNs (55.6%–71.7% [110–142 of 198]; P ≤ .01 for GOLD 3–4 and 40%–66% [23–38 of 58]; P ≤ .001 for GOLD 4). This result was further observed in confusion matrices (Fig 2) and GOLD stage diagnostic plots (Fig 3). Note that the CNNs preserved the ordinal behavior of the GOLD staging system, with most CNN-predicted classifications within one stage of the reference standard.
Table 4:
Model Sensitivities for Detecting Presence or Absence of COPD

Figure 2:

Confusion matrices show accuracy of Global Initiative for Chronic Obstructive Lung Disease (GOLD) stage predictions by the different convolutional neural network (CNN) models. Box values indicate the number of predicted samples according to their respective predicted and true GOLD stages. Therefore, box values along the main diagonal indicate the number of times the predicted GOLD stage matched the true GOLD stage. A perfect model would have only high-valued (ie, dark-blue) boxes across the main diagonal and zero-valued (ie, dark-orange) boxes in all other spaces. Model names are abbreviated based on model input. Clinic = clinical data, DE = deformably registered expiratory CT image, E = expiratory CT image, I = inspiratory CT image, PRISm = preserved ratio impaired spirometry.
Figure 3:

Graphs show relationship between spirometry-based Global Initiative for Chronic Obstructive Lung Disease (GOLD) stages from true and convolutional neural network (CNN)–predicted spirometric values. Spirometric values are stratified to show true GOLD stage, while points are colored by CNN-predicted GOLD stage. Model names are abbreviated based on model input. Clinic = clinical data, DE = deformably registered expiratory CT image, E = expiratory CT image, FEV1 = forced expiratory volume in 1 second, FEV1pp = forced expiratory volume in 1 second percent predicted, FVC = forced vital capacity, I = inspiratory CT image, PRISm = preserved ratio impaired spirometry.
Subanalysis of PRISm Group
GOLD stage accuracies when participants with PRISm were considered separately from GOLD 0 ranged from 48.9% to 57.8% (557–659 of 1140). PRISm sensitivities ranged from 19.3% to 37.1% (27–52 of 140) due to overprediction of spirometry measurements, causing GOLD 0 to be the most frequent prediction for true PRISm across all models. Accuracies and sensitivities increased when non-COPD classifications were considered together, with GOLD stage accuracies ranging from 59.8% to 67.9% (682–774 of 1140) and sensitivities ranging from 69.9% to 89.6% (438–562 of 627) (Tables 3–4).
Attention Maps for CNN Explainability
Figure 4 shows the low-level and high-level attention maps for individuals in each GOLD stage for the I- and E-CNNs. Both low- and high-level maps indicated each CNN focused on areas within the lungs to make its spirometric predictions. Attention maps for the I-E- and I-E-DE-CNNs are available in Figures S3–S4 and indicate similar areas of attention within the lungs despite multiple CT images as input.
Figure 4:

Visualization of attention maps from the residual attention networks for the inspiratory convolutional neural network (I-CNN) and expiratory convolutional neural network (E-CNN) models. Attention maps highlight regions of the input image contributing to the network’s predictions. Low-level features (minor details, such as texture) and high-level features (major details, such as shape) are displayed overlaying a single coronal section of the original input noncontrast CT images. Overlay color indicates strength of attention (ie, strength of contribution) ranging from low attention (blue) to high attention (dark red). One example for each Global Initiative for Chronic Obstructive Lung Disease (GOLD) stage is shown.
Discussion
In this study, we developed CNNs using different configurations of inspiratory-expiratory CT and clinical data to study their benefit for COPD staging. Our results showed that COPD diagnosis and staging by a CNN was feasible using single-phase CT, with within-one stage accuracies (83.5%–84.1% [952–959 of 1140]) comparable to that of multiphase CT (86.1%–86.3% [982–984 of 1140]). If provided clinical data relevant to disease staging, GOLD stage prediction accuracy significantly improved for single-phase inspiratory CT (60.0%–65.2% [684–743 of 1140]; P < .001), single-phase expiratory CT (59.8%–65.7% [682–749 of 1140]; P < .001), and inspiratory-expiratory CT (63.9%–67.9% [729–774 of 1140]; P < .001).
Our findings have several implications for research and clinical care. Although inspiratory CT is commonly performed for routine diagnostic imaging, few institutions routinely perform expiratory CT. Although recent studies have recommended inspiratory-expiratory CT to support diagnosis and staging of COPD (22–24), implementation of this protocol may not be feasible at many institutions due to the need for additional technologist training. Our results suggest COPD diagnosis and staging using a single standard inspiratory image is feasible when using a CNN, which may increase accessibility to patients seeking treatment at institutions where an inspiratory-expiratory imaging protocol is unavailable. Moreover, this system can be applied to databases of inspiratory images (acquired for other clinical indications) for screening purposes, where at-risk patients flagged for COPD can be recommended for further evaluation and a formal definitive diagnosis.
One major benefit of our findings is the potential to accurately stage COPD without the need for a separate expiratory acquisition, thereby reducing radiation dose. The potential carcinogenic effects of ionizing radiation in diagnostic imaging remain controversial (25–27). CT is widely used because its diagnostic value far exceeds these potential risks; nonetheless, it is broadly agreed that radiation exposure from CT cannot be ignored in the long-term evaluation of incurable diseases (27,28). Thus, it is a notable result that CNN-based staging using a single CT image is comparable to staging with both inspiratory and expiratory images.
Interestingly, inspiratory-only and expiratory-only CNNs performed comparably, suggesting the phenotypes useful for COPD diagnosis are heavily overlapping across these images. Prior studies have also indicated that expiratory-only methods perform similarly, possibly because they contain information on both emphysema and airway obstruction (23,29,30). Theoretically, airway obstructions contributing to air trapping should be measurable on inspiratory images using phenotypes such as Pi10 (31). However, direct measurements can be challenging, especially for smaller airways, which may span only a few voxels at native resolution. We speculate that the inspiratory-only models captured these features due to the complex and mathematically demanding architecture of the CNN, showcasing their potential for inspiratory-only screening for COPD and early-stage small airways disease. Finally, the amount of air trapping on expiratory images is often used as a proxy measure for airway obstruction. Advanced methods incorporating granular detail on airway obstruction on inspiratory images should be further studied to narrow the performance gap between the single- and multiphase CNNs.
A subanalysis of the PRISm group revealed that our models mispredicted most participants with PRISm, predominantly classifying them as GOLD 0. Although considered non-COPD, PRISm is an unstable classification associated with higher rates of mortality and lung function decline compared with those with normal spirometry (16,32). Future research is needed to investigate the morphologic differences between the PRISm and GOLD 0 groups.
Similar methods for CT-based COPD staging have been proposed. Ho et al (7) used a CNN to diagnose COPD using multiphase CT and parametric response maps. They achieved 89.3% diagnostic accuracy but did not assess the benefit of each phase. Du et al (33) input multiview snapshots of lung airway trees into a CNN, achieving 88.6% diagnostic accuracy. However, their sample size was small (n = 280) relative to our study. Xue et al (34) extracted features from inspiratory images to use as input to a two-stage attention network, producing diagnostic accuracies of 92.0% (test cohort; n = 80) and 81.2% (external cohort; n = 260). These methods were not used to evaluate staging performance; meanwhile, our multiphase CNNs achieved comparable within-one stage accuracies ranging from 86.1% to 88.0%. Using an inspiratory-only CNN, González et al (35) achieved GOLD stage, within-one stage, and diagnostic accuracies of 51.1%, 75.0%, and 77.3%, respectively. Our models surpassed these results, except for E-CNN, which performed similarly for diagnosis.
There were several limitations to this study. This retrospective study included imaging and spirometry that were acquired by COPDGene using a standardized research protocol (14,15); thus, our dataset may not represent the variation in data obtained using clinical protocols. Future studies are necessary to evaluate the generalizability of these methods to standard acquisition protocols, other pathologies, contrast-enhanced CT, and low-dose inspiratory acquisition. In addition, we acknowledge that more than two-thirds (68.3%) of study participants self-identified as non-Hispanic White. Due to this bias, more studies are needed to determine whether these results will extend to other racial and ethnic groups. Furthermore, spirometry measurements are subject to fluctuation, variability, and error, which may affect patients’ placement into the spirometrically defined GOLD stages. The predictive ability of CNNs may depend on the quality and standardization of CT imaging and spirometric technique. We reserve experiments using CNNs to predict other clinical outcomes, such as exacerbations, mortality, and disease progression from images for a future study. Finally, our objective was to study the utility of various data modalities for COPD diagnosis and staging, and therefore, we did not evaluate the use of our methods for therapeutic decision-making.
In conclusion, we showed that CNNs developed using only single respiratory phase CT images can accurately stage COPD severity within one GOLD stage. Although inspiratory CT remains the clinical standard, our findings suggest expiratory CT may be a strong candidate for imaging-based COPD staging. Diagnosis and staging of COPD using a single CT image can reduce patients’ exposure to ionizing radiation and improve accessibility to CT-based severity assessment while preserving performance. Although this work has evaluated methods for staging COPD based on cross-sectional CT images, future studies will build on these methods to assess progression in longitudinally acquired images.
Supported by the National Heart, Lung, and Blood Institute (award no. U01 HL089897 and award no. U01 HL089856). The content is solely the responsibility of the authors and does not necessarily represent the official views of the National Heart, Lung, and Blood Institute or the National Institutes of Health. COPD Foundation Funding: COPDGene is also supported by the COPD Foundation through contributions made to an industry advisory board that has included AstraZeneca, Bayer Pharmaceuticals, Boehringer-Ingelheim, Genentech, GlaxoSmithKline, Novartis, Pfizer, and Sunovion.
Disclosures of conflicts of interest: A.N.L. No relevant relationships. A.H. Participation on a Data Safety Monitoring Board or Advisory Board for Regents of the University of California (provisional application no. 63/301,975). K.A.H. No relevant relationships.
Abbreviations:
- CNN
- convolutional neural network
- COPD
- chronic obstructive pulmonary disease
- FEV1
- forced expiratory volume in 1 second
- FEV1pp
- forced expiratory volume in 1 second percent predicted
- FVC
- forced vital capacity
- GOLD
- Global Initiative for Chronic Obstructive Lung Disease
- ICC
- intraclass correlation coefficient
- PRISm
- preserved ratio impaired spirometry
References
- 1. World Health Organization . Chronic Obstructive Pulmonary Disease (COPD) . https://www.who.int/news-room/fact-sheets/detail/chronic-obstructive-pulmonary-disease-(copd). Published 2023. Accessed October 18, 2023 .
- 2. Lin CH , Cheng SL , Chen CZ , Chen CH , Lin SH , Wang HC . Current Progress of COPD Early Detection: Key Points and Novel Strategies . Int J Chron Obstruct Pulmon Dis 2023. ; 18 : 1511 – 1524 . [DOI] [PMC free article] [PubMed] [Google Scholar]
- 3. Kim WD . Phenotype of Chronic Obstructive Pulmonary Disease Based on Computed Tomography-Defined Underlying Pathology . Tuberc Respir Dis (Seoul) 2022. ; 85 ( 4 ): 302 – 312 . [DOI] [PMC free article] [PubMed] [Google Scholar]
- 4. Wilgus ML , Abtin F , Markovic D , et al . Panlobular emphysema is associated with COPD disease severity: A study of emphysema subtype by computed tomography . Respir Med 2022. ; 192 : 106717 . [DOI] [PubMed] [Google Scholar]
- 5. Li Z , Liu L , Zhang Z , et al . A Novel CT-Based Radiomics Features Analysis for Identification and Severity Staging of COPD . Acad Radiol 2022. ; 29 ( 5 ): 663 – 673 . [DOI] [PubMed] [Google Scholar]
- 6. Hasenstab KA , Yuan N , Retson T , et al. ; COPDGene Investigators . Automated CT Staging of Chronic Obstructive Pulmonary Disease Severity for Predicting Disease Progression and Mortality with a Deep Learning Convolutional Neural Network . Radiol Cardiothorac Imaging 2021. ; 3 ( 2 ): e200477 . [DOI] [PMC free article] [PubMed] [Google Scholar]
- 7. Ho TT , Kim T , Kim WJ , et al . A 3D-CNN model with CT-based parametric response mapping for classifying COPD subjects . Sci Rep 2021. ; 11 ( 1 ): 34 . [DOI] [PMC free article] [PubMed] [Google Scholar]
- 8. Hasenstab KA , Tabalon J , Yuan N , Retson T , Hsiao A . CNN-based Deformable Registration Facilitates Fast and Accurate Air Trapping Measurements at Inspiratory and Expiratory CT . Radiol Artif Intell 2021. ; 4 ( 1 ): e210211 . [DOI] [PMC free article] [PubMed] [Google Scholar]
- 9. Hersh CP , Washko GR , Estépar RS , et al. ; COPDGene Investigators . Paired inspiratory-expiratory chest CT scans to assess for small airways disease in COPD . Respir Res 2013. ; 14 ( 1 ): 42 . [DOI] [PMC free article] [PubMed] [Google Scholar]
- 10. Gaeta M , Minutoli F , Girbino G , et al . Expiratory CT scan in patients with normal inspiratory CT scan: a finding of obliterative bronchiolitis and other causes of bronchiolar obstruction . Multidiscip Respir Med 2013. ; 8 ( 1 ): 44 . [DOI] [PMC free article] [PubMed] [Google Scholar]
- 11. Salvatore M , Azour L , O’Connor M , Capaccione K , Mendelson D , Expiratory CT . What is Good Enough? Int J Radiol Imaging Technol 2020. ; 6 ( 2 ): 6 . [Google Scholar]
- 12. Lynch DA , Al-Qaisi MA . Quantitative computed tomography in chronic obstructive pulmonary disease . J Thorac Imaging 2013. ; 28 ( 5 ): 284 – 290 . [DOI] [PMC free article] [PubMed] [Google Scholar]
- 13. Schroeder JD , McKenzie AS , Zach JA , et al . Relationships between airflow obstruction and quantitative CT measurements of emphysema, air trapping, and airways in subjects with and without chronic obstructive pulmonary disease . AJR Am J Roentgenol 2013. ; 201 ( 3 ): W460 – W470 . [DOI] [PMC free article] [PubMed] [Google Scholar]
- 14. Regan EA , Hokanson JE , Murphy JR , et al . Genetic epidemiology of COPD (COPDGene) study design . COPD 2010. ; 7 ( 1 ): 32 – 43 . [DOI] [PMC free article] [PubMed] [Google Scholar]
- 15. COPDGene . Study Protocol: Genetic Epidemiology of Chronic Obstructive Pulmonary Disease . https://www.copdgene.org/P1/COPDGeneProtocol-5-0_06-19-2009.pdf. Published 2009. Accessed October 18, 2023 .
- 16. Adibi A , Sadatsafavi M . Looking at the COPD spectrum through “PRISm” . Eur Respir J 2020. ; 55 ( 1 ): 1902217 . [DOI] [PubMed] [Google Scholar]
- 17. Chollet FC , et al . Keras . https://keras.io . 2015. .
- 18. Wang F , Jiang M , Qian C , et al . Residual attention network for image classification . Proceedings of the IEEE conference on computer vision and pattern recognition 2017. ; 3156 – 3164 . [Google Scholar]
- 19. R Development Core Team . R: A Language and Environment for Statistical Computing . Vienna, Austria: : R Foundation for Statistical Computing, 2021. . [Google Scholar]
- 20. Hallgren KA . Computing Inter-Rater Reliability for Observational Data: An Overview and Tutorial . Tutor Quant Methods Psychol 2012. ; 8 ( 1 ): 23 – 34 . [DOI] [PMC free article] [PubMed] [Google Scholar]
- 21. Koo TK , Li MY . A Guideline of Selecting and Reporting Intraclass Correlation Coefficients for Reliability Research . J Chiropr Med 2016. ; 15 ( 2 ): 155 – 163 . [Published correction appears in J Chiropr Med 2017;16(4):346.] [DOI] [PMC free article] [PubMed] [Google Scholar]
- 22. Song L , Leppig JA , Hubner RH , et al . Quantitative CT Analysis in Patients with Pulmonary Emphysema: Do Calculated Differences Between Full Inspiration and Expiration Correlate with Lung Function? Int J Chron Obstruct Pulmon Dis 2020. ; 15 : 1877 – 1886 . [DOI] [PMC free article] [PubMed] [Google Scholar]
- 23. Matsuoka S , Kurihara Y , Yagihashi K , Hoshino M , Nakajima Y . Airway dimensions at inspiratory and expiratory multisection CT in chronic obstructive pulmonary disease: correlation with airflow limitation . Radiology 2008. ; 248 ( 3 ): 1042 – 1049 . [DOI] [PubMed] [Google Scholar]
- 24. Gawlitza J , Henzler T , Trinkmann F , Nekolla E , Haubenreisser H , Brix G . COPD Imaging on a 3rd Generation Dual-Source CT: Acquisition of Paired Inspiratory-Expiratory Chest Scans at an Overall Reduced Radiation Risk . Diagnostics (Basel) 2020. ; 10 ( 12 ): 1106 . [DOI] [PMC free article] [PubMed] [Google Scholar]
- 25. Hong JY , Han K , Jung JH , Kim JS . Association of Exposure to Diagnostic Low-Dose Ionizing Radiation With Risk of Cancer Among Youths in South Korea . JAMA Netw Open 2019. ; 2 ( 9 ): e1910584 . [DOI] [PMC free article] [PubMed] [Google Scholar]
- 26. Lee KH , Lee S , Park JH , et al . Risk of Hematologic Malignant Neoplasms From Abdominopelvic Computed Tomographic Radiation in Patients Who Underwent Appendectomy . JAMA Surg 2021. ; 156 ( 4 ): 343 – 351 . [DOI] [PMC free article] [PubMed] [Google Scholar]
- 27. Bos D , Guberina N , Zensen S , Opitz M , Forsting M , Wetter A . Radiation Exposure in Computed Tomography . Dtsch Arztebl Int 2023. ; 120 ( 9 ): 135 – 141 . [DOI] [PMC free article] [PubMed] [Google Scholar]
- 28. Joyce S , O’Connor OJ , Maher MM , McEntee MF . Strategies for dose reduction with specific clinical indications during computed tomography . Radiography 2020. ; 26 ( Suppl 2 ): S62 – S68 . [DOI] [PubMed] [Google Scholar]
- 29. Cao X , Gao X , Yu N , et al . Potential Value of Expiratory CT in Quantitative Assessment of Pulmonary Vessels in COPD . Front Med (Lausanne) 2021. ; 8 : 761804 . [DOI] [PMC free article] [PubMed] [Google Scholar]
- 30. Gawlitza J , Trinkmann F , Scheffel H , et al . Time to Exhale: Additional Value of Expiratory Chest CT in Chronic Obstructive Pulmonary Disease . Can Respir J 2018. ; 2018 : 9493504 . [DOI] [PMC free article] [PubMed] [Google Scholar]
- 31. Charbonnier J-P , Pompe E , Moore C , et al ; COPDGene investigators . Airway wall thickening on CT: Relation to smoking status and severity of COPD . Respir Med 2019. ; 146 : 36 – 41 . [DOI] [PMC free article] [PubMed] [Google Scholar]
- 32. Wijnant SRA , De Roos E , Kavousi M , et al . Trajectory and mortality of preserved ratio impaired spirometry: the Rotterdam Study . Eur Respir J 2020. ; 55 ( 1 ): 1901217 . [DOI] [PubMed] [Google Scholar]
- 33. Du R , Qi S , Feng J , et al . Identification of COPD From Multi-View Snapshots of 3D Lung Airway Tree via Deep CNN . IEEE Access 2020. ; 8 : 38907 – 38919 . [Google Scholar]
- 34. Xue M , Jia S , Chen L , Huang H , Yu L , Zhu W . CT-based COPD identification using multiple instance learning with two-stage attention . Comput Methods Programs Biomed 2023. ; 230 : 107356 . [DOI] [PubMed] [Google Scholar]
- 35. González G , Ash SY , Vegas-Sánchez-Ferrero G , et al. ; COPDGene and ECLIPSE Investigators . Disease Staging and Prognosis in Smokers Using Deep Learning in Chest Computed Tomography . Am J Respir Crit Care Med 2018. ; 197 ( 2 ): 193 – 203 . [DOI] [PMC free article] [PubMed] [Google Scholar]