

Abstract

The continuous use of fossil fuels has a huge impact on climate change because they release CO2, which is a major greenhouse gas that causes 70–75% of global warming. Shale reserves could be used to store CO2 to lower greenhouse gas emissions. This could happen mostly through adsorbed gas, which can make up about 85% of all shale gas. It is important to fully understand the CO2 adsorption processes in shale, especially when using isothermal models, to get accurate estimates of storage capacity and predictions of how shale will behave. This work examines the application of several isothermal models, including Langmuir, Freundlich, Brunauer–Emmett–Teller, Dubinin–Radushkevich, Dubinin–Astakhov, Sips, Toth, and Ono-Kondo lattice models, to explore the adsorption of CO2 on shale formations. The aim of this research work is to assess the efficiency of these models in forecasting CO2 adsorption in different shale samples with specific mineral compositions, total organic content (TOC), surface areas, and pore geometry at 298 K and up to 2 MPa. This review provides a state-of-the-art knowledge on the constraints of existing models and proposes adaptations, such as integrating density-dependent correction factors and hybrid modeling techniques, to enhance precision during numerical simulation work. Furthermore, the possible incorporation of molecular dynamic (MD) simulations with experimental data is suggested to improve the understanding of the CO2 adsorption in the geological rock at the molecular scale. The results emphasize the need for future studies to concentrate on the improvement of models and empirical validation to more accurately forecast the storage behavior of CO2 in shale formations at resevoir conditions.
1. Introduction
Fossil fuels remain a significant source of energy generation, fulfilling 84% of the energy needed until 2030 and the remaining will be fulfilled by renewable resources as illustrated in Figure 1.1 Climate change is greatly impacted by the continued use of fossil fuels that emit CO2. It is a key greenhouse gas (GHG) and accounts for 70–75% of emissions causing global warming; in that regard immediate environmental action is required to slow down it.2 CO2 emissions from burning of fossil fuels make up around two-thirds of the present GHG emissions. Numerous data sets indicate that the primary cause of the total increase in GHG emissions in 2023 was the growth in fossil CO2 emissions, which increased by 0.8–1.5%.3−6
Figure 1.

Global trends of primary energy consumption. Reproduced from ref (17). Copyright 2024 Energy Institute. Licensed under CC BY 4.0.
Shale reservoirs have become a viable means of storing CO2 to reduce GHG emissions.7−11 The vast surface area, low porosity, and substantial organic content of these reservoirs increase their capacity to store CO2.12−16 Gas stored in shale can be found in three different forms, (a) dissolved, (b) free, and (c) adsorbed gas, shown in Figure 2.18 Pores and natural or induced fractures usually store free gas, while adsorbed gas is stored by organic as well as inorganic material like clay, kerogen and dissolved gas in oil and water.19 Gas in adsorbed phase accounts for about 85% of the total volume of gas in shale.20 For this reason, knowing how CO2 adsorbs in shale is essential to accurately estimating storage capacity and forecasting shale behavior. Shale formations typically lie at 1000 to 3000 m depth having pressure up to 27 MPa. So, high pressure and temperature adsorption experiments are essential for understanding adsorption behavior in these formations. However, challenges, such as the lack of high-pressure equipment and insufficient high-pressure data for CO2 adsorption in shale hinder comprehensive exploration and characterization.21
Figure 2.

Schematic representation of gas distribution in shale formations showing the natural fractures and matrix structure. Reproduced with permission from ref (22). Copyright 2013 Elsevier.
For understanding and calculating CO2 adsorption on shale, isothermal models play a critical role. These models give the relation between the amount of gas adsorbed and the pressure while keeping temperature constant. Studies to characterize CO2 adsorption on shale have used a variety of isotherms, notably Langmuir, Dubinin–Radushkevich (D-R), Freundlich, Dubinin-Astakhov (D-A), and Brunauer–Emmett–Teller (BET), each with certain assumptions and applicability.23−26 These models have varying degrees of success based on the characteristics of shale samples chosen and the methods of experiments adopted.
Recent research has greatly enhanced our comprehension of the process by which shale formations adsorb CO2. Scientists analyzed the characteristics of CO2 on shale at subcritical conditions by employing Langmuir, Ono-Kondo lattice (OK), D-A, and D-R models. Research findings of these studies revealed that the OK model had the highest level of accuracy, as evidenced by coefficient of determination (R2) values ranging from 0.95 to 0.99.27 A separate study highlighted the significance of selecting the appropriate adsorption models for the analysis of experimental findings. The two models Langmuir and OK were determined to be suitable for representing CO2 adsorption on Dadas formation samples at temperatures of 25, 50, and 75 °C.28 Another researcher utilized multiple isotherm models at a temperature of 24.85 °C and pressure range of 0.1 to 2 MPa to examine the CO2 adsorption capacity on shale samples CM03, CM07, SM05, and US03. Their investigation demonstrated a strong correlation between the desorption data and the adsorption results. The Langmuir, Freundlich, Sips, and Toth models provided a good fit for the data, with all models having R2 values exceeding 0.95.29
However, there are still notable deficiencies despite this progress. The majority of experiments have been carried out under subcritical conditions, indicating that the isothermal models developed are mainly derived from data obtained at low pressure and temperature. As a result, these models frequently fall short in precisely forecasting results in supercritical conditions. The behavior of CO2 in supercritical states, which occur at elevated pressures and temperatures commonly found in deep shale formations, is not well understood and necessitates thorough investigation. The unavailability of high-pressure equipment and insufficient high-pressure data exacerbate this gap, impeding the thorough investigation and understanding of the CO2 adsorption mechanisms under such settings.
Recent technological breakthroughs have started to tackle some of these deficiencies. Recent advancements in high-pressure adsorption apparatuses and sophisticated characterization techniques, such as micro-CT scanning and advanced spectroscopic approaches, have significantly improved the CO2 adsorption investigation methods in shale at high pressures and temperatures. These technologies provide more precise measurements and provide enhanced understanding of the adsorption processes at the molecular level.30,31
The objective of this research study is to fill the research gap mentioned by reporting a comprehensive review of the prevalent isothermal models used for calculating the adsorption of CO2 on shale. The aim of this work is to improve the understanding of the CO2 adsorption mechanisms in shale formations by examining their theoretical foundations and evaluating their effectiveness in different geological settings. The primary objective is to offer valuable insights and recommendations for future research to enhance the precision of storage capacity estimations and deepen our understanding of shale behavior during CO2 adsorption.
2. Shale Gas Storage Mechanisms
Shale reservoirs store gas in different forms like free gas stored in pores and fractures, adsorbed gas stored in organic and inorganic minerals, and dissolved gas stored in oil and water.32,33 This diversity in gas storage forms is crucial to understanding the adsorption capacity of shales, particularly for CO2 sequestration applications. Accurately evaluating shale gas resources requires knowledge of the quantities and behaviors of gases stored in different forms, which can directly influence adsorption measurements and model accuracy. Several studies have emphasized the importance of understanding these gas storage mechanisms to improve the precision of adsorption capacity evaluations in shale formations.34−36
Adsorption in shale is influenced by the composition of percentage of organic matter, minerals, moisture content, amount of pore volume, and pressure and temperature conditions.20,37,38 The ability of shale to adsorb is particularly altered by the percentage of organic matter and the amount of specific surface area. For instance, clays like illite and montmorillonite exhibit higher gas sorption capacities compared to kaolinite, which is particularly relevant for CO2 adsorption studies in shale formations.36,39 However, the presence of moisture can significantly reduce the adsorption of clay minerals due to water occupying adsorption sites, emphasizing the need for moisture-controlled experimental conditions.39,40
The porosity of shale rock considerably significantly influence the gas adsorption process. It is divided into micropores (less than 2 nm), mesopores (between 2 and 50 nm), and macropores (greater than 50 nm). Among all pores, micropores having organic matter and clay minerals are intensely important for CO2 adsorption due to their high surface area and affinity for gas molecules.40−43 While fractures can contribute to the overall surface area, their impact on gas adsorption is less understood but could potentially provide substantial adsorption sites especially under supercritical conditions relevant to CO2 storage.
Furthermore, the shale adsorption capacity has a positive correlation with the total organic carbon (TOC) content. This relationship is influenced by variations in organic matter type, mineral composition, thermal maturity, and pore distribution. In formations with high maturity levels, such as the Upper Devonian Muskwa and Middle Devonian Besa River Formations high gas adsorption is attributed to significant kerogen aromatization and the presence of micropores.36,39
3. Adsorption
The adherence of gases on the adsorbent surface is defined as adsorption.30 The adsorption process has two primary components, (i ) the adsorbate that adsorbs onto the surface and (ii ) the adsorbent where adsorption occurs.31,44,45 Adsorption occurs when the absorbent has a bond defect that facilitates the adsorbent capacity to thermodynamically adsorb the adsorbate.46 Desorption happens when the adsorbate has sufficient energy to separate off the adsorbent surface and displace the force keeping it there. Equation 1 is the general mechanism of adsorption.23,47
| 1 |
3.1. Types of Adsorption
Adsorption can be categorized into two primary categories: physisorption and chemisorption. In order to assess the adsorption capacity of various adsorbents and adsorbates, there are several adsorption isotherms available. The main adsorption types and adsorption isotherms are shown in Figure 5. A detailed explanation of the two types is provided below.
Figure 5.

Types of adsorption and isotherms with descriptions.
3.1.1. Physisorption
Physical adsorption also known as physisorption involves attachment of CO2 molecules on the shale surface through weak van der Waals forces without the formation of chemical bonds.48,49 This type of adsorption typically occurs at low adsorption enthalpies (20 to 40 kJ/mol), making it a reversible process.50 Physisorption is characterized by formation of multiple layers of CO2 on the shale surface; it is temperature-sensitive and tends to decrease as temperature rises.47,51 This mechanism is particularly relevant in the context of CO2 adsorption in shale, as it is commonly assumed by models such as BET and Freundlich, which predict adsorption based on multilayer formation on heterogeneous surfaces.52Figure 3 illustrates the primary features of physisorption during CO2 interaction with shale.
Figure 3.

Illustration of CO2 adsorption (physisorption) mechanisms in shale. Reproduced from ref (23). Copyright 2020 Springer Nature.
3.1.2. Chemisorption
Chemisorption involves a stronger interaction where chemical bonds are formed between the CO2 molecules and the shale surface. This process occurs at higher adsorption enthalpies (30 to 400 kJ/mol) and typically involves the formation of a single molecular layer on the adsorbent surface.47,53 Chemisorption is considered irreversible due to the requirement for high activation energy to break these bonds. In the context of CO2 storage in shale reservoirs, chemisorption may play a secondary role to physisorption but understanding its mechanisms can help in accurately predicting the total adsorption capacity in shale formations. Models that take into account the surface chemistry and specific interactions of CO2 with shale minerals, such as the modified Langmuir or hybrid models could better predict adsorption behavior when chemisorption is significant.54−56Figure 4 outlines the primary features of chemisorption.
Figure 4.

Illustration of CO2 adsorption (chemisorption) mechanisms in shale. Reproduced from ref (23). Copyright 2020 Springer Nature.
3.2. Molecular Simulation
MDs can significantly enhance the understanding of adsorption in shales at the molecular level, as they provide detailed insights for adsorption mechanisms. Recent studies employing simulations like MDs and Grand Canonical Monte Carlo (GCMC) have elucidated the interactions between gas molecules and the heterogeneous surfaces of shale formations. These simulations offer valuable data on the adsorption capacity, selectivity, and influence of pore size distribution and surface chemistry on adsorption behavior. For instance, Zeng et al. demonstrated through MD simulations that CO2 and CH4 exhibit different adsorption behaviors in organic nanopores highlighting the impact of pore structure on gas storage capacity.31 Similarly, Thomas reviewed the perspectives of gas adsorption and storage in kerogens and shales using advanced simulation techniques, providing a comprehensive understanding of the molecular-level interactions and their implications for CO2 sequestration strategies.45 Incorporating these simulation insights can bridge the gap between experimental observations and theoretical predictions, thereby optimizing the CO2 storage and enhanced gas recovery processes in shale formations.
3.3. Isotherms of Adsorption
Adsorption isotherms are sorted into six types by the International Union of Pure and Applied Chemistry (IUPAC) based on the isotherm form due to relation between adsorbate and adsorbent, can be seen in Figure 5.57 Many IUPAC categorized isotherms feature hysteresis loops, which suggest the presence of mesoporous material where capillary condensation adsorption takes place.58 It is believed that the independent domain hypothesis, which states that the relative vapor pressure should be higher when the pores are filled than when they empty, is the primary factor in hysteresis.59 The pore-blocking effect has the potential to enhance hysteresis as per the network theory.60
3.4. Governing Equations for Adsorption
Adsorption can be broadly defined as adsorption of absorbent onto adsorbate as a result of a deficiency in bonds between the adsorbent and the adsorbate.58Equation 2 displays the general equation for adsorption.
| 2 |
where Vads is CO2 adsorbed volume, Vgas is bulk phase volume, Vsolid is shale volume in sample cell, and Vtotal is system volume as a whole.56
There will be spaces between the shale grains when it is loaded in the sample cell, preventing the grains from filling the entire cell. Measuring these vacuum areas is essential, since failing to do so will result in an inaccurate adsorbent and adsorbate total volume. Equation 3 is used to calculate the void space volume.
| 3 |
where Vvoid is the void space volume.
Prior to the adsorption experiment, the empty space is often determined using helium (He) with very low adsorption potential. The temperature, pressure, volume, and compressibility of the gas in both the cell and pump are used to compute the void space volume. Equation 4 can be used to calculate the volume of void spaces.
 |
4 |
where P1 and P2 represent pressure, and z with subscripts 1 and 2 represent compressibility of He before and after expansion, respectively. T is the cell temperature, and Ph is He pressure in pump.
Once the empty space has been determined, Equation 5 may be used to compute the number of moles of CO2 absorbed.
| 5 |
where ninj is CO2 injected volume, nunads is unadsorbed CO2 volume, and nads is the adsorbed CO2 volume.
Equation 6 is used to determine the number of CO2 moles injected, which is the same for both the Gibbs and absolute calculation approaches.
| 6 |
where R is the universal gas constant and equals 8.314 J/(mol K).
3.4.1. Absolute Adsorption
When the unadsorbed volume is determined, absolute adsorption takes the adsorbed phase volume into account. As a result the value is higher than it would be with Gibbs adsorption. Equation 7 depicts that relation.16
| 7 |
where, Vgs is the cell total gas volume.
3.4.2. Gibbs Adsorption
This method is used to calculate the amount of CO2 that has not been adsorbed. When calculating unabsorbed volume the Gibbs adsorption method does not calculate the adsorbed phase volume. Otherwise, the adsorption value will be lower than the absolute value because Gibbs calculation underestimates the amount of CO2 that has been adsorbed. Equation 8 is used for calculating the Gibbs volume.61
| 8 |
In Equation eq 8, Vvoid takes the place of the Vgas. Due to its exclusive focus on the vacuum area within cells, this approach underestimates the anticipated adsorption value and fails to take into consideration the unadsorbed phase.
Equation 9 can be used to determine the unadsorbed volume of CO2 in the context of Gibbs adsorption.56
| 9 |
where Paf represents the pressure while zaf represents the compressibility.
Equation 5 can be used to compute the Gibbs adsorption, if the Gibbs unadsorbed CO2 volume is known. The Gibbs adsorption value can be utilized to calculate the absolute adsorption by connecting the two values using Equation eq 10.56
| 10 |
where ρ represents the variable for density. The determination of the adsorbed gas density (ρads) is a challenging task, but it can be obtained by calculating the volume using the liquid density at its boiling point.60
3.5. Impact of Supercritical CO2
The transition of CO2 to a supercritical state significantly impacts the pore structure, geomechanical properties, and wettability of the shale. Supercritical CO2 (scCO2) exhibits unique properties, such as higher diffusivity and lower viscosity compared to those of its liquid and gaseous states, which enhance its ability to penetrate and interact with shale formations. Studies have shown that scCO2 can alter the pore structure by swelling organic matter and dissolving certain minerals leading to changes in porosity and permeability.26,62 Geomechanically the injection of scCO2 can induce stress changes in the reservoir, potentially affecting its stability and mechanical properties.28,63 Additionally, scCO2 can alter the wettability of shale surfaces which influences the adsorption capacity and fluid flow behavior.64,65 These changes are crucial for optimizing CO2 sequestration strategies and ensuring the long-term stability of the storage sites. It is crucial to include these factors in our understanding of CO2 adsorption in shale in order to create precise models and forecasts of storage capacity.
3.6. Methods of Quantification
The amount of gas adsorbed in shale is often measured in the laboratory using volumetric or gravimetric adsorption experiments.66,67 Because of its strong representativeness, the ability to achieve the necessary testing conditions of pressure and temperature, and other characteristics the volumetric method is widely used in industry.68 The experimental arrangement for measuring the volumetric adsorption is depicted in Figure 6. This approach estimates gas adsorption by measuring the pressure between sample and reference volumes before and after gas expansion.
Figure 6.

Schematic diagram of the volumetric method. Reproduced from ref (70). Copyright 2023 Frontiers Media. Licensed under CC BY 4.0.
The volumetric adsorption equipment consists of a reference cell in which the CO2 is heated to the predefined conditions, and then the desired pressure is applied. The reference and sample cells are linked by a high-pressure valve and the sample cell contains shale. To see enough gas expansion, the reference cell volume should be lower than that of the sample cell. This will make it easier to observe equilibrium pressure. The valve is opened to permit gas expansion after both cells are ready and the reference cell CO2 has been heated and compressed. The adsorption value can be computed once the equilibrium pressure has been attained. Although the volumetric approach is extensively employed because of its many benefits, there are certain significant drawbacks that should be considered to prevent errors in the adsorption value.
Because of its precise estimating features, ease of operation, and shorter equilibrium time, the gravimetric method is also widely utilized in industry. This technique quantifies gas adsorption by measuring the quantity of gas adsorbed in relation to the applied pressure.27 Magnetic suspension balance apparatus is frequently used to carry out gravimetric method of weighing measurements. The gravimetric technique measures adsorption using mass rather than pressure. By employing a microbalance to measure the mass differential, it is possible to calculate amount of gas that the shale has adsorbed.69 The microbalance is used in place of the pressure transducers, which is the only setup variation from the volumetric setup. A schematic of the gravimetric adsorption measurement setup is shown in Figure 7.
Figure 7.

Schematic diagram of the gravimetric method. Reproduced from ref (65). Copyright 2021 American Chemical Society.
Both measurement techniques have a number of important benefits and drawbacks, and these should be understood before starting the experiment to prevent mistakes. Table 1 lists the advantages and disadvantages.23,71,72
Table 1. Advantages and Disadvantages of Gravimetric and Volumetric Methods.
| Volumetric Method | Gravimetric Method |
|---|---|
| Simpler setup, no complex tools needed | Extremely accurate microbalances |
| Larger volume of adsorbent required | More complex usage |
| Streamlined measurement with calibrated transducers | Only milligrams of adsorbent needed |
| Challenging equilibrium tracking | No wall adsorption issues in single-component measurements |
| Cell wall adsorption can be adjusted in calculations | Requires monitoring of multiple parameters and calibrations |
| Low frequency recording | High-frequency kinetics recording |
4. Modeling Approaches
4.1. Isothermal Models
Isothermal adsorption models provide a mathematical framework to describe the interaction between adsorbates and adsorbents. These models are essential for calculating the amount of CO2 stored in shale strata. The common models used for CO2 adsorption on shale include Langmuir, Freundlich, D-A, D-R, Sip, Toth, BET, and OK models.73,74 The Langmuir model is a popular model used to determine the amount of CO2 adsorbed on the shale surface. The BET model represents multimolecular layer adsorption and is mostly applied to low-temperature nitrogen adsorption. Many researchers have applied Langmuir, D-R, and D-A models to investigate CO2 adsorption on shale at pressures less than 12 MPa.27Table 2 shows the summary of isothermal models with their linear and nonlinear equations, applicability, and limitations.
Table 2. Isothermal Models Used for Modeling of CO2 Adsorption on Shale57,60,75,76,80,92,93.
| isotherm model | description | linear | nonlinear | limitations | ||
|---|---|---|---|---|---|---|
| Langmuir | Describes adsorption of gas molecules on solid surfaces. It assumes that adsorption takes place at homogeneous sites. | Presupposes monolayer adsorption with no interactions between adsorbed molecules on a homogeneous surface. It is not applicable to heterogeneous surfaces or multilayer adsorption. At high pressures, where multilayer adsorption becomes substantial, the model breaks down. | ||||
| Freundlich | Describes solutes interacting with a solid surface, particularly the adsorption process. It is one of the oldest and simplest models to explain the adsorption characteristics. The model assumes that the surface is heterogeneous and heat of adsorption is distributed unevenly. | A theoretically unfounded empirical model that suggests it is unable to forecast the adsorption mechanism. It is less useful at larger concentrations since it does not explain saturation, just suggesting adsorption on heterogeneous surfaces. | ||||
| D-R | Utilized in the investigation of vapor and gas adsorption on uneven surfaces. In contrast to more basic models such as Freundlich or Langmuir isotherms, the D-R model takes into consideration both the porosity and heterogeneity of the adsorbent material. | Assumes a heterogeneous surface with a Gaussian energy distribution, which is more appropriate for subcritical vapor adsorption. Particularly at higher pressures, it might not be able to forecast the adsorption process with complete accuracy for all types of adsorbates. | ||||
| D-A | Describes an adsorption process where a substance adheres to the surface of a solid. The D-A model is especially relevant for microporous materials, where it can accurately predict the adsorption behavior within the pores. | Expansion of the D-R isotherm that adds a new parameter in an effort to overcome some of its shortcomings. Still, it makes an assumption about a certain kind of energy distribution, thus it might not apply to other adsorbent–adsorbate systems, especially those with intricate interactions. | ||||
| Sip | Hybrid of Freundlich and Langmuir models that is intended to accurately represent adsorption processes across a broad concentration range. It assumes that the surface is energetically heterogeneous and the adsorption process is localized (i.e., there is no adsorbate transmigration in the plane of the surface). | Hybrid of the Freundlich and Langmuir isotherms that is intended to forecast heterogeneous adsorption at both high and low concentrations. For some systems, its complexity and requirement for several parameters may make it less useful. | ||||
| Toth | An extension of the Langmuir that assumes a surface with identical sites, and each can hold only one adsorbate molecule. The Toth model, however, modifies this by incorporating a distribution function for the energy of adsorption sites, which accounts for the heterogeneity of real surfaces. | Specially designed to provide a more flexible fit than the Langmuir model for adsorption on heterogeneous surfaces. Its presumption that the adsorption energy will drop smoothly and continuously might not apply to all heterogeneous surfaces, though. | ||||
| BET | Extends the Langmuir theory to multilayer adsorption with the assumption that the adsorbate molecules form a multilayer on the adsorbent surface. In this first layer of adsorbate it behaves similarly to the Langmuir model, adhering directly to the solid surface. Additional adsorbate layers can then form on top of the first. This model is applied where the adsorption process is physisorption, involving relatively weak van der Waals forces. |
|
Presumes multilayer adsorption, mostly useful in a narrow range of relative pressures. At very low or high relative pressures, where monolayer or capillary condensation events predominate, respectively, it is unable to anticipate adsorption with any degree of accuracy. | |||
| OK | Based on a well-developed lattice theory, the Ono-Kondo model describes adsorption behavior in both monolayer and multilayer formats. It describes adsorption behavior based on the physical properties and accessible characterization of the adsorbent and makes predictions under a variety of circumstances |
|
Less useful for heterogeneous surfaces and complicated interaction situations due to its assumptions about homogeneous adsorption sites and simpler interactions. Its practicality in real-world scenarios is further impacted by the difficulty of parameter estimation. |


4.1.1. Langmuir Isotherm
The purpose of the Langmuir model is to determine the adsorption behavior between gaseous and solid phases. It is also used to compare and quantify the adsorptive capabilities of various adsorbents.75 By maintaining balance between adsorption and desorption rates (dynamic equilibrium), the Langmuir isotherm explains the surface coverage. Adsorption is directly proportional to the fraction of adsorbent surface that is exposed while desorption is inversely proportional.76Equation 11 presents the Langmuir linear form:
| 11 |
where Ce is the equilibrium concentration in (mg/g), KL is the Langmuir constant in (mg/g), qm is maximum adsopriton and qe is adsoprtion capacity.
Zhou et al. used the Langmuir model to examine CO2 adsorption on shale which shows strong correlation in the fitting curves reflecting the effectiveness of the model at subcritical pressures.27 In contrast another study indicated varying degrees of fit for PAK and SLP shales with R2 value 0.994, highlighting the model representational effectiveness.77 Chi et al. found that the Langmuir + k model aligns well with CO2 experimental adsorption data with Average Absolute Deviation (AADs) ranging from 2.12% to 3.10%.78 However, the Langmuir model effectiveness decreased at high temperatures and pressures, particularly in the supercritical/liquid region failing to capture the unique adsorption characteristics of CO2.28,65 This limitation is attributed to the surface heterogeneity of shale at 150 °C, where the Langmuir application is not applicable.79
High R2 values in the Langmuir model, which matches CO2 adsorption on shale quite well indicate strong model alignment especially at higher temperatures of 80 °C as shown in Figure 8. The results show that while overall adsorption volume and adsorption stability decrease with increasing temperature, the Langmuir model fits better at higher temperatures more in line with theories of monolayer adsorption.65
Figure 8.

Fitting results of the Langmuir model for CO2 adsorption on shale. Data extracted from ref (29). Copyright 2020 Elsevier.
4.1.2. Freundlich Isotherm
Based on experimental findings, Herber Freundlich proposed the Freundlich isotherm model. Studies of adsorption for heterogeneous and rough surfaces can benefit from the application of this model.75Equation 12, which is not limited to the creation of monolayers, is the oldest known description of nonideal and reversible adsorption.80 The following is the Freundlich isotherm.81
| 12 |
where 1/n and KF represent the adsorption intensity and adsorption capacity, respectively.
The Freundlich model superior fit to experimental data on shale samples is attributed to its ability to better account for surface heterogeneity, characterized by diverse minerals and organic matter. This adaptability makes the Freundlich model more aligned with the complex nature of shale as opposed to other models that may oversimplify these characteristics.79
In order to emphasize various TOC levels and maturities, the study investigated the adsorption of CO2 on shale samples at varying temperatures (50, 100, and 150 °C). It demonstrated that CO2 has a high capacity for adsorption, which makes storage in shale appropriate for CO2. Temperature has a major effect on adsorption because different gases absorb different amounts of heat. Clay in shale may prevent CO2 from adhering because of its swelling properties. The adsorption of shale is more accurately represented by the Freundlich and BET isotherms, as shown in Figure 9; rather than the Langmuir isotherm.79
Figure 9.

Fitting results of the Freundlich model of CO2 adsorption on shale. Data extracted from ref (79). Copyright 2020 Elsevier.
4.1.3. Dubinin–Radushkevich Isotherm
D-R is an empirical model that uses Gaussian energy distribution for representing the adsorption mechanism on heterogeneous surfaces.75 This isotherm, models adsorption as a pore filling mechanism in a semiempirical equation and is only suitable for an intermediate range of adsorbate concentrations since it exhibits implausible asymptotic behavior and cannot predict Henry’s laws at low pressure.80 This basic equation applies to physical adsorption processes, assumes a multilayer character involving van der Waal’s forces, and qualitatively characterizes the adsorption of gases and vapors on microporous sorbents.76Equation 13 is the mathematical representation of the D-R isotherm.82
| 13 |
where B is activity coefficient or adsorption energy constant and n is hetrogenity parameter. The study fitted the CO2 adsorption data on shale using Langmuir, Freundlich, BET, D-A, D-R, and OK models. Freundlich and D-A models proved to be the most successful at a pressure range of 1–4 MPa as shown in Figure 10. While the performance of BET was less than desirable within the range of 0–5 MPa, the Langmuir, D-R, and OK models accurately predicted adsorption. This comparison research helps to clarify the adsorption behavior of shale especially under near-critical conditions.83
Figure 10.

Fitting results of the D-R model of CO2 adsorption on shale. Data extracted from ref (83). Copyright 2022 Elsevier.
4.1.4. Dubinin–Astakhov Isotherm
When examining the adsorption of gases onto microporous material, the D-A model Equation eq 14 is frequently used. The D-A equation is represented by the following expression:75
| 14 |
where nDA is a heterogeneity parameter, qm represents the maximal adsorption capacity, measured in milligrams per gram (mg/g), εDA is the adsorption potential (kJ/mol), and EDA is the system’s characteristic energy (kJ/mol). The adsorption potential where Cs,DA is measured, given by Equation eq 15, is the highest degree of adsorbate solubility.
| 15 |
The D-A model demonstrated better overall fitting performance for CO2 adsorption on shales compared to the D-R model, particularly at high pressures. The D-A model parameter n varied for CO2 (0.698–1.452), reflecting the structural heterogeneity of different shales. This adaptability contributed to the model accuracy. In contrast the D-R model fixed n value of 2 lead to less accurate fits especially for CO2 adsorption data. The D-A model flexibility in accounting for shale variability resulted in more accurate adsorption isotherms.27 D-A had moderate to good fit, with R2 values of 0.953 for PAK shale and 0.993 for SLP shale from Damodar Valley basin, India. indicating a slightly less consistent performance compared to other models.77 The study by Xie et al. employed experimental setups and theoretical models to understand gas adsorption behaviors. The methodology included high-pressure isothermal adsorption experiments using shale samples from the Longmaxi Formation, assessing adsorption under various pressures (0–25 MPa) and temperatures (30–100 °C). Models such as Langmuir, BET and D-A were fitted to the experimental data evaluating their applicability through R2 values. Key results revealed distinct adsorption behaviors for CO2, with CO2 showing higher adsorption affinity influenced by pressure and temperature. The D-A model has significant flexibility under a variety of settings, according to the study which evaluated the fitting effectiveness of several models. Figure 11 illustrates how well the D-A model fits the data for CO2 adsorption in shales after being skillfully modified for high-temperature CO2 adsorption. Its R2 values for CO2 were from 0.9864 to 0.9964 illustrating the model reliability and broad applicability. Notably, the model efficacy remains unaffected by temperature variations, reinforcing its suitability across a range of conditions and aligning well with the micropore filling theory in shale adsorption studies.65
Figure 11.

Fitting results of the D-A model of CO2 adsorption on shale. Data extracted from ref (27). Copyright 2019 Elsevier.
4.1.5. Sips Isotherm
The Freundlich and Langmuir isotherms are combined to generate the hybrid Sips isotherm model.75,80 It is a suitable isotherm to forecast how heterogeneous structures would adsorb substances without encountering the rising adsorbate concentration limitation that the Freundlich isotherm does. The Sips isotherm can be a reliable predictor of a monolayer adsorption system since at low and high concentrations, it changes into the Freundlich and Langmuir isotherms, respectively.75 The generic Equation eq 16 below represents the mathematical form of the Sips model.84
| 16 |
where as is the Sips constant. Equation 17 is the linearized form of Sips model.82
| 17 |
As can be shown by a good fit across a pressure range of 0 to 2 MPa, the Sips model in Figure 12 closely matches the experimental data, suggesting it accurately describes the material adsorption behavior with CO2. It appears that the material has a significant capacity for CO2 or may need higher pressures to attain saturation, because it shows a growing adsorption capacity with rising pressure and does not approach saturation within the measured range. This behavior points to possible useful application in fields where effective gas adsorption is crucial. It also shows a significant initial affinity for CO2 that progressively levels off.
Figure 12.

Fitting results of the Sips model of CO2 adsorption on shale. Data extracted from ref (29). Copyright 2020 Elsevier.
4.1.6. Toth Isotherm
József Tóth presented the Toth isotherm model based on a quasi-Gaussian energy distribution theory in 1995.80 The Toth model is an additional empirical equation that was created to enhance the fitting of the Langmuir model based on experimental data. It is helpful in characterizing heterogeneous adsorption systems that meet both high and low concentration boundaries.85 The expression for the Toth isotherm model is as follows shown in Equation 18:
| 18 |
where the Toth constants, KL and n, are expressed in terms of mg/g.
It is clear that this equation reduces to the Langmuir model when n = 1. Thus, the heterogeneity of the adsorption system is characterized by the parameter n, and the system is considered heterogeneous if it deviates farther from 1. The Toth isotherm can be rearranged in the following Equation 19 to produce a linear form.71
| 19 |
The graph shown in Figure 13, with a persistent strong connection between the Toth model fit and the experimental data for CO2 adsorption on a material from 0 to 2 MPa indicates that the Toth model is a reliable description of the adsorption properties of the material. The increasing adsorption capacity with pressure is suggestive of a fast uptake at first because of the high-energy sites. However, this uptake eventually tapers off suggesting that maximum capacity may be approached without reaching a clear saturation point within the pressure settings examined.
Figure 13.

Fitting results of the Toth model of CO2 adsorption on shale. Data extracted from ref (29). Copyright 2020 Elsevier.
4.1.7. BET Isotherm
The BET isotherm, which is used to describe the adsorption of gaseous substances was developed based on the multimolecular adsorption hypothesis in 1938 by Brunauer, Emmet, and Teller.86 Brunauer et al. established a classification of five isotherms to describe physical adsorption systems. They took into account two pressure zones for adsorbing gas components into the adsorbents. At temperatures around the point of condensation, the isotherms exhibited a concave shape at low pressures and a convex shape at high pressures. On a molecular size scale the convex shape of the isotherms at high pressures can be linked to the liquid state of components that are condensed in adsorbent capillaries.75 Systems made up of ionic adsorbent and a nonpolar molecule adsorbate experience a multimolecular adsorption layer due to the capillary condensation action. The first layer of adsorption is polarized by the surface layer of the adsorbent leading to the polarization of subsequent layers of adsorption. The BET model in its most general version can be seen in Equation 20.87
 |
20 |
The values qm, Ce, and C0 represent the maximal adsorption capacity, monolayer concentration, and BET adsorption constant, respectively. The BET model encompasses relative pressures (P/P0) ranging from 0.05 to 0.3.
One of the primary applications of the BET isotherm is to determine specific surface area, pore size, and shape of porous adsorbent. In a low temperature device the measurement of partial pressures is conducted by manipulating the pressure of a gas (often nitrogen gas at 77 K) by an adsorption/desorption process. The morphology and characteristics of pores can be elucidated by comparing the resulting adsorption/desorption isotherm with the five standard BET isotherm curves.75
The BET model performance in fitting CO2 adsorption data exhibits noteworthy effectiveness, especially in scenarios involving multilayer adsorption. For CO2 adsorption on PAK and SLP shales this model achieved exceptional R2 values of 0.995 and 0.997.77 This adaptability suggests a propensity for multilayer adsorption at lower temperatures, underlined by the model’s consistent high performance in CO2 adsorption fitting, where R2 values varied from 0.9840 to 0.9967.65 This analysis underscores the versatility and precision of the BET model in capturing diverse adsorption behaviors.
In order to emphasize various TOC levels and maturities, the study investigated CO2 adsorption on shale samples at varying temperatures of 50, 100, and 150 °C. It was found that CO2 has a high affinity for adsorption which makes shale suitable for CO2 sequestration and increased gas recovery. Temperature has a major effect on adsorption, because different gases absorb different amounts of heat. Shale clays may prevent CO2 from adhering, because of their swelling properties. Shale adsorption is found to be better described by the BET isotherm shown in Figure 14; than by the Langmuir isotherm.79
Figure 14.

Fitting results of the BET model of CO2 adsorption on shale. Data extracted from ref (88). Copyright 2016 American Chemical Society.
4.1.8. Ono-Kondo model
Density changes in a gas–liquid interface were first described by the OK lattice theory. Aranovich et al. used the OK model to investigate gas adsorption on microporous materials.89 Derived from a comprehensive lattice theory, the OK model describes adsorption behavior in both monolayer and multilayer formats. It describes adsorption behavior based on the physical properties and accessible characterization of the adsorbent and makes predictions under a variety of circumstances. Equation 21 displays the OK model.27
 |
21 |
The variables T, k, nabs, n0, ρf, and ρa represent the absolute temperature in Kelvin, molar density of free gas, maximum monolayer saturation adsorption, and molar density of fluid adsorption in mol/L, respectively.
Gas adsorption may be simulated using the OK model; however, model parameters need to be carefully considered. The high-precision state equation can be utilized to calculate ρf. The OK hypothesis states that ρa is analogous to the density of the adsorption phase in the critical state of a gas. Nevertheless, under a specific crucial situation the CO2 adsorption phase density cannot be ascertained through the use of gas state equations. The van der Waals equation shown in Equationeq 22 can be used to get ρa for the CO2 gas.90
| 22 |
where Pc and Tc denote the critical pressure and temperature, respectively. In the critical state, the computed phase density of CO2 is 23.34 mol/L. The least squares approach can be used to determine the two unknown parameters, n0 and εs, as the parameters were acquired accurately.91
CO2 adsorption on shales was examined using the OK model, which has two important parameters, n0, the saturated adsorption density of a monolayer, which indicates maximal monolayer adsorption capacity, and an interaction energy parameter connected to the adsorbed gas and shale micropores. Models that fit the experimental data demonstrated a strong correlation. The R2 values ranged from 0.9516 to 0.9992, suggesting that this model provides an effective fit.27 The model’s somewhat higher AADs for CO2 (2.70–3.79%) suggested that there was a greater affinity and interaction energy between CO2 and shale, which affected the behavior and rate of adsorption shown in Figure 15.78 The CO2 adsorption data on Dadas formation samples at various temperatures were well-fitted by this model. They offered a more realistic depiction of the behavior of CO2 in various circumstances, particularly at greater pressures.28
Figure 15.
Fitting results of the OK model of CO2 adsorption on shale. Data extracted from ref (27). Copyright 2019 Elsevier
4.2. Evaluation of the Isothermal Adsorption Models
The CO2 adsorption capabilities of shale samples from the Marcellus and Le-Roy formations in the United States were examined in our study. The TOC content, mineral composition, surface area, pore volume, and average pore size of these samples and adsorption capacity graph against pressure were drawn at a constant temperature of 298 K. The samples showed a wide range of mineral concentrations and TOC variations, ranging from 3.28% to 16.2%; Table 3, highlighting the variety of geological settings from which they were taken.
Table 3. Origin, TOC Content, and Physical Characteristics of the Shale Samples.
| sample | TOC (wt %) | pick up location | origin | feldspar | calcite | illite | kaolinite | smectite | surface area (m2/g) | pore volume (cm3/g) | average pore size (nm) |
|---|---|---|---|---|---|---|---|---|---|---|---|
| CM03 | 3.6 | Le-Roy Formation | USA | 12 | 43 | 5 | 25 | 17.5637 | 0.020818 | 4.74114 | |
| CM07 | 3.28 | 26 | 5 | 48 | 11 | 14.4316 | 0.016796 | 4.69346 | |||
| SM05 | 13.8 | Union springs Formation | 40 | 24 | 9 | 12 | 21.076 | 0.017206 | 3.26549 | ||
| US03 | 16.2 | 4 | 10 | 50 | 2 | 41.5686 | 0.029139 | 2.80398 |
Data adapted from ref (29). Copyright 2020 Elsevier.
In order to assess these samples ability to absorb CO2 their physical properties are essential. As an illustration, sample CM03 has a TOC of 3.6%, a large surface area of 17.5637 m2/g and a considerable amount of illite. On the other hand sample US03 had the lowest average pore size of 2.80398 nm among the samples examined and the largest surface area of 41.5686 m2/g with the highest TOC of 16.2%.
All samples had an increase in adsorption capacity with pressure, according to the empirical data shown in Figure 16, with capacities ranging from 13 to 20 cm3/g. The straight relationship between pressure and the increase in CO2 adsorption shows how highly suitable these shales are for sequestering CO2 under the investigated circumstances. Because of its large surface area and high illite concentration, CM03 demonstrated a noteworthy ability for CO2 adsorption. Because of its high feldspar and illite contents, CM07 showed enhanced adsorption capabilities at higher pressures. With a high TOC and a mineralogy that included both feldspar and calcite, SM05 showed a clear adsorption tendency. The highest surface area and pore volume were found in US03, which most likely had a major impact on its adsorption behavior. The tendency of adsorption to increase with pressure indicates that the storage capability of hydrocarbons is not only determined by TOC. As an alternative our results demonstrate how important a range of properties are for CO2 adsorption such as surface area, pore structure, and mineral composition.
Figure 16.

Adsorption of CO2 on CM03, CM07, SM05, and US03 Marcellus samples at 25 °C and up to 2 MPa pressure. Data extracted from ref (29). Copyright 2020 Elsevier.
4.3. Nonlinear Isotherm Fitting and Analysis
A suite of eight isotherm models including Langmuir, Freundlich, Sips, Toth, D-A, D-R, BET, and OK was utilized in order to successfully carry out the examination of the CO2 adsorption behavior for a variety of shale samples. This was accomplished through the use of nonlinear fittings. The purpose of this fitting was to determine whether or not each model was compatible with the actual data that was gathered from the Marcellus shale deposits, which were maintained at a constant temperature of 298 K.
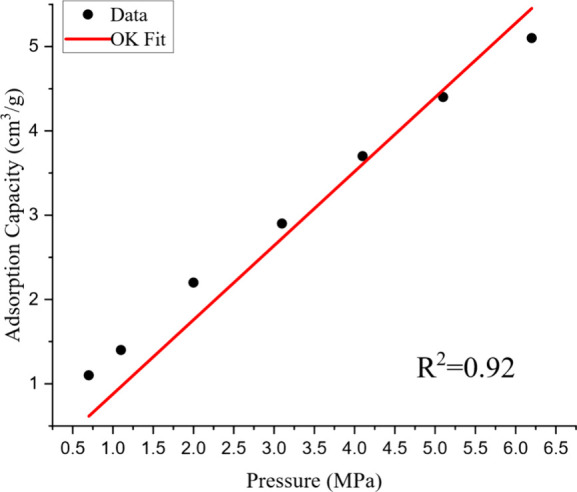
The adsorption data of shale sample CM03 was analyzed using several isotherm models shown in Figure 17. The results indicate that the BET and Sips models had the greatest R2 values suggesting a good match with the experimental data. Given the sample intricate pore structure and varied adsorption site affinities, it appears that models that take into consideration heterogeneous adsorption processes and maybe multilayer adsorption adequately capture CM03 adsorption behavior. Although the R2 values of the Langmuir and Toth models are marginally lower, they nevertheless demonstrate a high association. Nonetheless, the adsorption features of CM03 may not be entirely captured by their simple assumptions. Furthermore, the D-A, D-R, and OK models also match well suggesting that their hypotheses regarding the distribution of adsorption energy and the properties of the pore structure agree with the CM03 behavior to some extent.
Figure 17.

Isotherm modeling of CO2 adsorption on CM03. Data extracted from ref (29). Copyright 2020 Elsevier.
The CM07 shale sample adsorption data was analyzed using a variety of isotherm models. The results in Figure 18 showed that the Freundlich and Sips models had the highest R2 values 0.99 and 0.9971, respectively, suggesting a very good match to the data. This implies that models that consider heterogeneous surfaces and pressure-dependent adsorption properties properly predict the adsorption behavior of CM07. With R2 values of 0.98, the D-R and BET models also show strong fits, indicating a large microporous percentage and possible multilayer adsorption, respectively. In contrast, the Langmuir, Toth, and OK models show somewhat lower but still good fit with R2 values of 0.90. But the D-A model has the lowest R2 value of 0.85, suggesting a poor fit that could be brought about by inconsistencies between the model presumptions and the physical characteristics of the CM07 sample. The heterogeneity of adsorption sites and possible multilayer adsorption are highlighted by the best-fit models for CM07 overall, reflecting the sample porous structure and surface characteristics. Conversely, less accurate models might miss some subtleties, like the presence of meso- and macropores or nonuniform energy distributions. Comprehending these differences is essential for enhancing CO2 sequestration tactics and accurately forecasting the adsorption behavior.
Figure 18.

Isotherm modeling of CO2 adsorption on CM07. Data extracted from ref (29). Copyright 2020 Elsevier.
The adsorption data of shale sample SM05 was analyzed using isotherm models and the results are shown in Figure 19; the Freundlich and D-R models had the greatest R2 values 0.99 and 0.98, respectively, suggesting a good match. These models, which are optimized for microporous materials and heterogeneous surfaces successfully represent the variety of adsorption sites and possible microporous nature of SM05. Furthermore, the R2 values of 0.90 for the BET, Langmuir, Toth, and OK models show decent fits indicating that these models can describe the adsorption behavior but not as well as the D-R and Freundlich models. In contrast the R2 values of the Sips and D-A models are lower at 0.85 and 0.88, respectively. This suggests that the models match the data less well and that the assumptions made may not adequately account for the unique features of SM05 adsorption behavior. Overall, the analysis indicates that models that consider heterogeneous surface energies and possibly varying pore sizes best describe SM05 adsorption capacity. These models reflect complex interactions between CO2 molecules and the sample surface, providing information that can be used to optimize CO2 sequestration techniques for shale formations that are similar to those of SM05.
Figure 19.

Isotherm modeling of CO2 adsorption on SM05. Data extracted from ref (29). Copyright 2020 Elsevier.
The US03 shale sample CO2 adsorption data was analyzed using isotherm models. The results showed that the Freundlich, Sips, and D-R models had the best R2 values of 0.99, 0.9971, and 0.98, respectively, indicating excellent fits as shown in Figure 20. These models accurately represent the intricate adsorption behavior of US03 taking into consideration surface heterogeneity and microporous structures. With R2 values of 0.90, the Langmuir and Toth models likewise offer decent fits; nevertheless, they are marginally less accurate than the previously discussed models, maybe because of their simplifying assumptions. Likewise, the R2 value of 0.90 indicates that the BET and OK models fit well pointing to multilayer adsorption mechanisms on US03. On the other hand, D-A model has a lower R2 value of 0.88, which highlights discrepancies between its assumptions and the adsorption properties of the sample and indicates a less effective fit. All things considered, the models that suit US03 best highlight the significance of taking into account surface heterogeneity and the possibility of both monolayer and multilayer adsorption, offering valuable information that is essential for maximizing CO2 collection and storage tactics in shale formations such as US03.
Figure 20.

Isotherm modeling of CO2 adsorption on US03. Data extracted from ref (29). Copyright 2020 Elsevier.
These findings provide insight into the complex nature of adsorption processes in shale formations and demonstrate that there is no one model that can fully represent the adsorption process across all samples. Different adsorption capacities and behaviors are caused by the distinct mineralogy and TOC of each formation. Because of this, it is necessary to employ a variety of analytical methods to obtain a comprehensive understanding of the gas adsorption potential.
4.4. Comparative Analysis of Model Fitting
Shale samples have unique attributes in terms of the TOC, mineral composition, surface area, pore volume, and average pore radius. These variations impact the adsorption characteristics and the accuracy of model fitting.23,36,54
The Sips and Freundlich models are the most suitable for CM03, as they accurately represent both high and low concentration adsorption situations and appropriately consider surface heterogeneity as shown by their high R2 values in Figure 17.26 This heterogeneous surface is likely influenced by the presence of smectite, which enhances the applicability of the Freundlich model.19 The Sips model excels in its capacity to smoothly switch between Langmuir and Freundlich behavior, thereby accurately representing the subtle dynamics of adsorption at various pressures.
As for CM03, Freundlich and Sips models offer the most suitable match for CM07, as they accurately represent the diverse surface characteristics of the sample caused by the substantial presence of illite. The D-R model good fit is most likely attributed to the microporous structure impacted by illite and kaolinite, which impact the pore-filling mechanism.78 The reduced surface area and pore volume in comparison to those of CM03 may somewhat decrease the adsorption capacity, factors that are accurately accounted for by the Freundlich and Sips models.
Due to its capacity to support both monolayer and multilayer adsorption the Sips model is well-suited for SM05, particularly for organic-rich shales with large surface areas and intricate pore architectures.36 The BET model is particularly suitable for accurately representing multilayer adsorption on uniform surfaces, which corresponds to the occurrence of non-clay minerals such as feldspar and calcite.23 The moderate fits of the Toth model, which accounts for surface heterogeneity are probably attributed to the relatively smaller fraction of clays.
The excellent performance of the Sips and D-R models for US03 can be credited to its high surface area and microporous structure which promote heterogeneous adsorption. The small pore size and TOC indicate significant microporosity making the D-R model, which assumes a Gaussian energy distribution in microporous material very suitable.36 Due to its flexibility in simulating both monolayer and multilayer adsorption, the Sips model also demonstrates a strong fit. Nevertheless, the OK model, which was specifically developed for microporous materials, has a suboptimal performance, sometimes attributed to certain interactions that are not completely accounted for in the model.
The comparison analysis shows that the selection of the isothermal model should be closely consistent with the particular attributes of the shale sample, including TOC, mineral composition, surface area, and pore size distribution.81 The Sips and Freundlich models consistently yield the most accurate predictions for most samples, demonstrating their adaptability to represent both high and low concentration adsorption situations and accommodate variations in surface properties.35 The D-R model is more efficient for samples with greater microporosity and TOC, where adsorption occurs mostly in microporous geometries. Accurate predictions of the CO2 adsorption behavior in shale formations can be achieved by selecting a suitable model according to the characteristics of the sample.
4.5. Sensitivity Analysis
To gain a deeper understanding of how particular features of shale samples impact the accuracy of the isothermal model fitting, a sensitivity analysis was performed. The present study investigates the impact of several parameters, including TOC, mineral content, surface area, pore volume, and average pore size, on the precision and appropriateness of several isothermal models in forecasting CO2 adsorption.
4.5.1. Total Organic Carbon
The high TOC observed in samples SM05 (13.8 wt %) and US03 (16.2 wt %) increases the ability to adsorb substances because of the greater abundance of organic material which offers a greater number of adsorption binding sites.23,36 Increased TOC results in improved fitting accuracy for the Freundlich and D-R models.19 These models are capable of handling the intricacies related to heterogeneous adsorption sites and changing the energy distributions. The Sips approach maintains its effectiveness by virtue of its adaptability in managing concentrations ranging from low to high. Conversely, the Langmuir model that assumes uniform adsorption exhibits slightly decreased precision with increasing TOC values. This is because this model fails to consider the increasing surface heterogeneity that is observed at higher TOC levels.
4.5.2. Mineral Content
The adsorption behavior is extensively influenced by the presence of particular minerals, such as illite and smectite.36 Samples CM03 and CM07, which contain significant amounts of illite and smectite, demonstrate strong compatibility with the Freundlich and Sips models, which are robust in addressing surface heterogeneity. Conversely SM05, which contains a significant amount of feldspar and calcite is more compatible with the BET model, which is more appropriate for multilayer adsorption on surfaces that are more uniform. Shale samples containing significantly high clay mineral content, such as illite and smectite exhibit improved compatibility with models that consider the presence of diverse surfaces and the distribution of adsorption energy, such as Freundlich, Sips, and D-R.19,78
4.5.3. Surface Area
The surface area is measured in the number of adsorption sites. Higher surface areas, as seen in sample US03 (41.57 m2/g), support models that may explain significant adsorption including multilayer adsorption, which is effectively represented by the BET model.81 As a result of its capacity to simulate both monolayer and multilayer adsorption, the Sips model also benefits from large surface areas. Typically, an increase in surface area enhances the performance of models that take into account several adsorption layers or diverse adsorption sites such as BET and Sips. By contrast, models such as Langmuir that posit a solitary layer of adsorption exhibit less sensitivity or accuracy as the surface area increases owing to their restricted scope.
4.5.4. Pore Volume and Pore Size
Pore volume and pore size distribution have a substantial impact on adsorption capacity and accuracy of isothermal model implementation.19 Samples exhibiting lower pore sizes, such as US03 (2.80 nm) demonstrate compatibility with the D-R model which is well tailored for materials with microporous structures. The suitability of the Freundlich model is attributed to its capacity to encompass a broad spectrum of adsorption energies linked to different grain sizes. Shales characterized by larger pore volumes and smaller pore sizes have greater sensitivity to models that consider microporosity and adsorption energy distributions, such as the D-R and Freundlich models. In contrast, the efficacy of these models is diminished by larger pores and smaller pore volumes as documented in samples with a higher mineral content and larger pore shapes, such as SM05.
Sensitivity analysis shows that the accuracy of fitting isothermal models to adsorption data is greatly influenced by shale properties, such as TOC, mineral content, surface area, pore volume, and pore size. Models such as Freundlich, Sips, and D-R, which consider surface heterogeneity adjustable adsorption energies, and microporosity, exhibit greater responsiveness to variations in TOC and mineral content, resulting in improved accuracy in fitting heterogeneous samples.19 By contrast, models like Langmuir and BET, which make the assumption of more homogeneous adsorption conditions, exhibit reduced sensitivity to these factors and demonstrate superior performance in samples with more consistent properties.36,81 In order to obtain precise predictions of the CO2 adsorption behavior, it is necessary to customize the selection of the isothermal model according to the particular characteristics of the shale.
5. Conclusion
This review presents a thorough examination of the process of CO2 adsorption on shale formations by employing several isothermal models such as the Langmuir, Freundlich, BET, D-R, D-A, Sips, Toth, and OK models. The results indicate that although certain models such as Sips, Freundlich, and D-R achieve good performance in specific circumstances, they have constraints in forecasting CO2 adsorption in all shale samples because of differences in mineral composition, TOC, surface area, and pore properties. The work emphasizes the necessity of modifying models by introducing density-dependent correction factors and the integration of micropore filling and multilayer adsorption mechanisms in hybrid modeling methodologies. Furthermore, the work highlights the value of combining MD simulations with experimental data to improve our comprehension of CO2 adsorption processes at the molecular scale.
5.1. Novel Perspectives
Analyzing isothermal model fittings at 298 K and pressures ranging from 0 to 2 MPa on four different shale samples can provide fresh insights that enhance the knowledge and prediction of CO2 adsorption in shale formations.
-
(1)
While models like Sips, Freundlich, and D-R achieve effectiveness in certain situations, they face challenges in precisely forecasting CO2 adsorption in all shale samples because of differences in mineral composition, TOC, surface area, and pore characteristics. Implementing density-dependent correction factors in models like Langmuir, Freundlich, and BET can enhance the accuracy of simulating CO2 behavior at different pressures by considering compressibility and fluid-like characteristics. A hybrid model that integrates the micropore-filling notion of D-R with the multilayer adsorption framework of BET has the potential to provide a more precise depiction of shales containing both micropores and mesopores, such as CM03 and US03. Furthermore, the utilization of dynamic models that adapt parameters in real-time according to experimental variables, such as pressure, temperature, and shale composition, could enhance the accuracy of adsorption predictions.
-
(2)
Integration of MD simulations with experimental data has the potential to greatly improve the comprehension of CO2 adsorption processes at the molecular scale in shale formations. These simulations offer valuable understanding of the atomic-level interactions between CO2 molecules and a range of minerals and organic compounds, including illite, smectite, calcite and kerogen. Incorporating these interactions into current isothermal models should enhance their precision, thereby enabling more precise predictions of adsorption behavior. Molecular dynamics simulations can also provide guidance for the creation of novel models that consider intricate interactions, such as the competing adsorption between carbon dioxide and methane or alterations in pore structure caused by pressure.
-
(3)
Measurements of sensitivity show that the adsorption of CO2 in shale is greatly affected by the distribution of pore sizes and the chemistry of the surface. Samples containing smaller holes, such as US03, exhibit increased adsorption because of confinement effects. This phenomenon is well described by models like D-R, which assume that micropores are filled with a Gaussian energy distribution. Conversely, the BET model provides a more precise description of multilayer adsorption in samples containing bigger holes, such as mesopores and macropores, such as SM05. Implementing a pore-size-dependent parameter could enhance the precision of the model by considering the unique contributions of each pore size to overall adsorption capacity. The inclusion of factors for specific chemical interactions and chemisorption effects, especially for minerals such as illite, smectite, and calcite can improve the accuracy of forecasts for samples containing high levels of TOC or reactive minerals.
5.2. Research Prospects
Important study directions are identified to further our knowledge of CO2 adsorption in shale formations based on comparison and sensitivity studies performed.
-
(1)
Existing models can be optimized for better representation of surface heterogeneity, microporosity, and the characteristics of supercritical CO2. Further investigation should be prioritized for the development of sophisticated isothermal models specifically designed for shale deposits. These models should incorporate both monolayer and multilayer adsorption properties and be capable of dynamically adapting to supercritical conditions.
-
(2)
Analyzing shales that have not been extensively studied but include distinct mineral and organic compositions can aid in the identification of novel prospective locations for CO2 storage. Cross-sectional investigations of different shale formations can reveal geological characteristics that either promote or hinder the adsorption of CO2.
-
(3)
Future research is recommended for the long-term geochemical interactions between CO2 and shale minerals under different settings to examine the impact on CO2 retention, mineral dissolution, and alterations in shale characteristics, to maintain the integrity of storage throughout time.
-
(4)
Research can be aimed to investigate possible routes for CO2 leakage and conduct life cycle assessments to determine the environmental consequences of CO2 sequestration in shale, considering variables such as energy consumption, emissions, and impacts on ecosystems and groundwater.
Acknowledgments
The authors express gratitude to the Center of Reservoir Dynamics (CORED), Institute of Sustainable Energy Resources at Universiti Teknologi PETRONAS, for providing an encouraging and supportive working environment. The authors acknowledge the support from YUTP-FRG under Cost Centre: 015LC0-462. We also thank our colleagues at Curtin University for their invaluable feedback and assistance throughout this study.
The authors declare no competing financial interest.
References
- Trout K.; Muttitt G.; Lafleur D.; Van De Graaf T.; Mendelevitch R.; Mei L.; Meinshausen M. Existing Fossil Fuel Extraction Would Warm the World beyond 1.5 °C. Environmental Research Letters 2022, 17 (6), 064010. 10.1088/1748-9326/ac6228. [DOI] [Google Scholar]
- Abbasi T.; Abbasi S. A. Decarbonization of Fossil Fuels as a Strategy to Control Global Warming. Renewable and Sustainable Energy Reviews 2011, 15, 1828–1834. 10.1016/j.rser.2010.11.049. [DOI] [Google Scholar]
- Ahmed M.; Shuai C.; Ahmed M. Analysis of Energy Consumption and Greenhouse Gas Emissions Trend in China, India, the USA, and Russia. International Journal of Environmental Science and Technology 2023, 20 (3), 2683–2698. 10.1007/s13762-022-04159-y. [DOI] [Google Scholar]
- Fyson C.; Grant N.; Das N.; Maxwell V.; Reynolds C.; Rogelj J.; Schleußner C.-F.; Waterton O.. When Will Global Greenhouse Gas Emissions Peak? Climate Analytics, 2023. [Google Scholar]
- Liu Z.; Deng Z.; Davis S.; Ciais P. Monitoring Global Carbon Emissions in 2022. Nature Reviews Earth and Environment 2023, 4, 205–206. 10.1038/s43017-023-00406-z. [DOI] [PMC free article] [PubMed] [Google Scholar]
- Khan M. J.; Mahmood S. M.; Alakbari F. S.; Siddiqui N. A.; Ridha S.; Shafiq M. U. Rock Wettability and Its Implication for Caprock Integrity in CO 2 – Brine Systems: A Comprehensive Review. Energy Fuels 2024, 38 (21), 19966–19991. 10.1021/acs.energyfuels.4c02736. [DOI] [Google Scholar]
- Fawzy S.; Osman A. I.; Doran J.; Rooney D. W. Strategies for Mitigation of Climate Change: A Review. Environmental Chemistry Letters 2020, 18, 2069–2094. 10.1007/s10311-020-01059-w. [DOI] [Google Scholar]
- Kazemi M.; Takbiri-Borujeni A. Molecular Dynamics Study of Carbon Dioxide Storage in Carbon-Based Organic Nanopores. SPE Annual Technical Conference and Exhibition 2016, SPE-181705-MS. 10.2118/181705-MS. [DOI] [Google Scholar]
- Zhang H.; Khayatnezhad M.; Davarpanah A. Experimental Investigation on the Application of Carbon Dioxide Adsorption for a Shale Reservoir. Energy Sci. Eng. 2021, 9 (11), 2165–2176. 10.1002/ese3.938. [DOI] [Google Scholar]
- Fatah A.; Bennour Z.; Ben Mahmud H.; Gholami R.; Hossain M. M. A Review on the Influence of CO2/Shale Interaction on Shale Properties: Implications of CCS in Shales. Energies (Basel) 2020, 13 (12), 3200. 10.3390/en13123200. [DOI] [Google Scholar]
- Bui M.; Adjiman C. S.; Bardow A.; Anthony E. J.; Boston A.; Brown S.; Fennell P. S.; Fuss S.; Galindo A.; Hackett L. A.; Hallett J. P.; Herzog H. J.; Jackson G.; Kemper J.; Krevor S.; Maitland G. C.; Matuszewski M.; Metcalfe I. S.; Petit C.; Puxty G.; Reimer J.; Reiner D. M.; Rubin E. S.; Scott S. A.; Shah N.; Smit B.; Trusler J. P. M.; Webley P.; Wilcox J.; Mac Dowell N. Carbon Capture and Storage (CCS): The Way Forward. Energy and Environmental Science 2018, 11, 1062–1176. 10.1039/C7EE02342A. [DOI] [Google Scholar]
- Ma L.; Fauchille A. L.; Ansari H.; Chandler M.; Ashby P.; Taylor K.; Pini R.; Lee P. D. Linking Multi-Scale 3D Microstructure to Potential Enhanced Natural Gas Recovery and Subsurface CO2storage for Bowland Shale, UK. Energy Environ. Sci. 2021, 14 (8), 4481–4498. 10.1039/D0EE03651J. [DOI] [Google Scholar]
- Song X.; Guo Y.; Zhang J.; Sun N.; Shen G.; Chang X.; Yu W.; Tang Z.; Chen W.; Wei W.; Wang L.; Zhou J.; Li X.; Li X.; Zhou J.; Xue Z. Fracturing with Carbon Dioxide: From Microscopic Mechanism to Reservoir Application. Joule 2019, 3 (8), 1913–1926. 10.1016/j.joule.2019.05.004. [DOI] [Google Scholar]
- Guiltinan E. J.; Cardenas M. B.; Bennett P. C.; Zhang T.; Espinoza D. N. Effect of Organic Matter and Thermal Maturity on the Wettability of Supercritical CO2 on Organic Shales. International Journal of Greenhouse Gas Control 2017, 65, 15. 10.1016/j.ijggc.2017.08.006. [DOI] [Google Scholar]
- Merey S.; Sinayuc C. Analysis of Carbon Dioxide Sequestration in Shale Gas Reservoirs by Using Experimental Adsorption Data and Adsorption Models. J. Nat. Gas Sci. Eng. 2016, 36, 1087–1105. 10.1016/j.jngse.2016.02.052. [DOI] [Google Scholar]
- Jia B.; Chen Z.; Xian C. Investigations of CO2 Storage Capacity and Flow Behavior in Shale Formation. J. Pet Sci. Eng. 2022, 208, 109659. 10.1016/j.petrol.2021.109659. [DOI] [Google Scholar]
- Statistical Review of World Energy 2024; Energy Institute: London, 2024. [Google Scholar]
- He Q.; Reid T.; Zheng G. Reservoir Simulation of CO2 Sequestration in Shale Reservoir. SPE Eastern Regional Meeting 2021, SPE-201801-MS. 10.2118/201801-MS. [DOI] [Google Scholar]
- Memon A.; Li A.; Memon B. S.; Muther T.; Han W.; Kashif M.; Tahir M. U.; Akbar I. Gas Adsorption and Controlling Factors of Shale: Review, Application, Comparison and Challenges. Natural Resources Research 2021, 30, 827–848. 10.1007/s11053-020-09738-9. [DOI] [Google Scholar]
- Mohd Aji A. Q.; Mohshim D. F.; Maulianda B.; Elraeis K. A. Supercritical Methane Adsorption Measurement on Shale Using the Isotherm Modelling Aspect. RSC Adv. 2022, 12 (32), 20530–20543. 10.1039/D2RA03367D. [DOI] [PMC free article] [PubMed] [Google Scholar]
- Xie W.; Chen S.; Wang M.; Yu Z.; Wang H. Progress and Prospects of Supercritical CO2 Application in the Exploitation of Shale Gas Reservoirs. Energy and Fuels 2021, 35, 18370–18384. 10.1021/acs.energyfuels.1c02944. [DOI] [Google Scholar]
- Zhao Y.-l.; Zhang L.-h.; Zhao J.-z.; Luo J.-x.; Zhang B.-n. “Triple Porosity” Modeling of Transient Well Test and Rate Decline Analysis for Multi-Fractured Horizontal Well in Shale Gas Reservoirs. J. Pet Sci. Eng. 2013, 110, 253–262. 10.1016/j.petrol.2013.09.006. [DOI] [Google Scholar]
- Fakher S.; Imqam A. A Review of Carbon Dioxide Adsorption to Unconventional Shale Rocks Methodology, Measurement, and Calculation. SN Applied Sciences 2020, 5. 10.1007/s42452-019-1810-8. [DOI] [Google Scholar]
- Le T. D.; Murad M. A.; Pereira P. A. A New Matrix/Fracture Multiscale Coupled Model for Flow in Shale-Gas Reservoirs. SPE Journal 2017, 22 (1), 265–288. 10.2118/181750-PA. [DOI] [Google Scholar]
- Yu W.; Sepehrnoori K.; Patzek T. W. Modeling Gas Adsorption in Marcellus Shale with Langmuir and Bet Isotherms. SPE Journal 2016, 21, 589–600. 10.2118/170801-PA. [DOI] [Google Scholar]
- Jin Z.; Firoozabadi A. Thermodynamic Modeling of Phase Behavior in Shale Media. SPE Journal 2016, 21 (1), 190–207. 10.2118/176015-PA. [DOI] [Google Scholar]
- Zhou J.; Liu M.; Xian X.; Jiang Y.; Liu Q.; Wang X. Measurements and Modelling of CH4 and CO2 Adsorption Behaviors on Shales: Implication for CO2 Enhanced Shale Gas Recovery. Fuel 2019, 251, 293–306. 10.1016/j.fuel.2019.04.041. [DOI] [Google Scholar]
- Merey S.; Sinayuc C. Analysis of Carbon Dioxide Sequestration in Shale Gas Reservoirs by Using Experimental Adsorption Data and Adsorption Models. J. Nat. Gas Sci. Eng. 2016, 36, 1087–1105. 10.1016/j.jngse.2016.02.052. [DOI] [Google Scholar]
- Abdulkareem F. A.; Radman A.; Faugere G.; Sathiavelu S.; Irfan S. A.; Padmanabhan E. Petro-Physical Properties of Marcellus Shale Samples and Their Impact on CO2 Adsorption: Equilibrium, Kinetics, and Empirical Modeling Study. J. Nat. Gas Sci. Eng. 2020, 81, 103423 10.1016/j.jngse.2020.103423. [DOI] [Google Scholar]
- Bouzgarrou S.; Jedli H.; Stiti N.; Hamdi N.; Slimi K.; Bagana M. Experimental Adsorption and Modelisation of CO2 on Adsorbents Collected from Elborma Field in South Tunisia. J. Surf. Eng. Mater. Adv. Technol. 2015, 05 (01), 52–63. 10.4236/jsemat.2015.51006. [DOI] [Google Scholar]
- Zeng K.; Jiang P.; Lun Z.; Xu R. Molecular Simulation of Carbon Dioxide and Methane Adsorption in Shale Organic Nanopores. Energy Fuels 2019, 33 (3), 1785–1796. 10.1021/acs.energyfuels.8b02851. [DOI] [Google Scholar]
- Curtis J. B. Fractured Shale-Gas Systems. Am. Assoc Pet Geol Bull. 2002, 86, 1921. 10.1306/61EEDDBE-173E-11D7-8645000102C1865D. [DOI] [Google Scholar]
- Chandra D.; Vishal V.; Bahadur J.; Agrawal A. K.; Das A.; Hazra B.; Sen D. Nano-Scale Physicochemical Attributes and Their Impact on Pore Heterogeneity in Shale. Fuel 2022, 314, 123070 10.1016/j.fuel.2021.123070. [DOI] [Google Scholar]
- Chalmers G. R. L.; Bustin R. M. Lower Cretaceous Gas Shales in Northeastern British Columbia, Part II: Evaluation of Regional Potential Gas Resources. Bulletin of Canadian Petroleum Geology 2008, 56 (1), 22–61. 10.2113/gscpgbull.56.1.22. [DOI] [Google Scholar]
- Ross D. J. K.; Bustin R. M. Characterizing the Shale Gas Resource Potential of Devonian–Mississippian Strata in the Western Canada Sedimentary Basin: Application of an Integrated Formation Evaluation. Am. Assoc Pet Geol Bull. 2008, 92 (1), 87–125. 10.1306/09040707048. [DOI] [Google Scholar]
- Zhang T.; Ellis G. S.; Ruppel S. C.; Milliken K.; Yang R. Effect of Organic-Matter Type and Thermal Maturity on Methane Adsorption in Shale-Gas Systems. Org. Geochem. 2012, 47, 120–131. 10.1016/j.orggeochem.2012.03.012. [DOI] [Google Scholar]
- Hussain Z; Farhah D.. Carbon Dioxide Adsorption on Shale: A Comparative Study of Isotherm Models across Diverse Samples and Temperatures. Presented at the 1st International Conference on Advanced Materials & Sustainable Energy Technologies (AMSET2023); E3S Web of Conferences: Sunway, Malasyia, 2024.
- Memon A.; Memon B. S.; Muther T.; Qureshi A. S.; Uqaili U. A.; Jeswani S. S.; Zardari Z. H. Quantitative Models and Controlling Factors of Langmuir Volume and Pressure for the Measurement of Shale Gas Adsorption: An Analytical Study Based Review. Arabian Journal of Geosciences 2022, 15 (8), 754. 10.1007/s12517-022-09796-8. [DOI] [Google Scholar]
- Ross D. J. K.; Bustin R. M. Shale Gas Potential of the Lower Jurassic Gordondale Member, Northeastern British Columbia, Canada. Bulletin of Canadian Petroleum Geology 2007, 55 (1), 51–75. 10.2113/gscpgbull.55.1.51. [DOI] [Google Scholar]
- Klewiah I.; Berawala D. S.; Alexander Walker H. C.; Andersen P. Ø.; Nadeau P. H. Review of Experimental Sorption Studies of CO2 and CH4 in Shales. J. Nat. Gas Sci. Eng. 2020, 73, 103045 10.1016/j.jngse.2019.103045. [DOI] [Google Scholar]
- Gale J. F. W.; Reed R. M.; Holder J. Natural Fractures in the Barnett Shale and Their Importance for Hydraulic Fracture Treatments. Am. Assoc Pet Geol Bull. 2007, 91 (4), 603–622. 10.1306/11010606061. [DOI] [Google Scholar]
- Engelder T.; Lash G. G.; Uzcátegui R. S. Joint Sets That Enhance Production from Middle and Upper Devonian Gas Shales of the Appalachian Basin. Am. Assoc Pet Geol Bull. 2009, 93 (7), 857–889. 10.1306/03230908032. [DOI] [Google Scholar]
- Slatt R. M.; Abousleiman Y. Merging Sequence Stratigraphy and Geomechanics for Unconventional Gas Shales. Leading Edge 2011, 30 (3), 274–282. 10.1190/1.3567258. [DOI] [Google Scholar]
- Al-Mutarreb A. M.; Jufar S. R.; Abdulelah H.; Padmanabhan E.; Mostafa G.; Ahmed M.. The Influence of Shales Characteristics on CO2 Adsorption Behaviour under Sub-Critical Conditions. In IOP Conference Series: Earth and Environmental Science; Institute of Physics Publishing, 2018; Vol. 164. [Google Scholar]
- Thomas K. M. Perspectives of Gas Adsorption and Storage in Kerogens and Shales. Energy and Fuels 2023, 37, 2569–2585. 10.1021/acs.energyfuels.2c03667. [DOI] [Google Scholar]
- Heller R.; Zoback M. Adsorption of Methane and Carbon Dioxide on Gas Shale and Pure Mineral Samples. Journal of Unconventional Oil and Gas Resources 2014, 8, 14. 10.1016/j.juogr.2014.06.001. [DOI] [Google Scholar]
- Zhang P.Adsorption and Desorption Isotherms; KE Group, 2016. [Google Scholar]
- Eliebid M.; Mahmoud M.; Al-Shehri D.; Elkatatny S.; Abouelresh M. Temperature Impact on Adsorption Contribution to Sequestration of CO2 in Immature Shale Formations in Saudi Arabia. SPE Kingdom of Saudi Arabia Annual Technical Symposium and Exhibition 2018, SPE-192357-MS. 10.2118/192357-MS. [DOI] [Google Scholar]
- Lutyński M.; Waszczuk P.; Słomski P.; Szczepański J.. CO2 Sorption of Pomeranian Gas Bearing Shales-the Effect of Clay Minerals. In Energy Procedia; Elsevier Ltd, 2017; Vol.125, pp 457–466. 10.1016/j.egypro.2017.08.153 [DOI] [Google Scholar]
- Sotomayor F. J.; Cychosz K. A.; Thommes M. Characterization of Micro/Mesoporous Materials by Physisorption: Concepts and Case Studies. Acc. Mater. Surf. Res. 2018, 3, 34. [Google Scholar]
- Pini R.; Ansari H.; Hwang J. Measurement and Interpretation of Unary Supercritical Gas Adsorption Isotherms in Micro-Mesoporous Solids. Adsorption 2021, 27 (4), 659–671. 10.1007/s10450-021-00313-z. [DOI] [Google Scholar]
- Ilkaeva M.; Vieira R.; Pereira J. M. P.; Sardo M.; Marin-Montesinos I.; Mafra L. Assessing CO2 Capture in Porous Sorbents via Solid-State NMR-Assisted Adsorption Techniques. J. Am. Chem. Soc. 2023, 145 (16), 8764–8769. 10.1021/jacs.3c00281. [DOI] [PMC free article] [PubMed] [Google Scholar]
- Jedli H.; Jbara A.; Hedfi H.; Bouzgarrou S.; Slimi K. Carbon Dioxide Adsorption Isotherm Study on Various Cap Rocks in a Batch Reactor for CO2 Sequestration Processes. Appl. Clay Sci. 2017, 136, 199–207. 10.1016/j.clay.2016.11.022. [DOI] [Google Scholar]
- Jia B.; Chen Z.; Xian C. Investigations of CO2 Storage Capacity and Flow Behavior in Shale Formation. J. Pet Sci. Eng. 2022, 208, 109659. 10.1016/j.petrol.2021.109659. [DOI] [Google Scholar]
- Chen G.; Lu S.; Zhang J.; Xue Q.; Han T.; Xue H.; Tian S.; Li J.; Xu C.; Pervukhina M.; Clennell B. Research of CO2 and N2 Adsorption Behavior in K-Illite Slit Pores by GCMC Method. Sci. Rep 2016, 6, 37579. 10.1038/srep37579. [DOI] [PMC free article] [PubMed] [Google Scholar]
- Fakher S.; Imqam A. High Pressure-High Temperature Carbon Dioxide Adsorption to Shale Rocks Using a Volumetric Method. International Journal of Greenhouse Gas Control 2020, 95, 102998. 10.1016/j.ijggc.2020.102998. [DOI] [Google Scholar]
- Al-Ghouti M. A.; Da’ana D. A. Guidelines for the Use and Interpretation of Adsorption Isotherm Models: A Review. Journal of Hazardous Materials 2020, 393, 122383. 10.1016/j.jhazmat.2020.122383. [DOI] [PubMed] [Google Scholar]
- Ehiomogue P.; Ahuchaogu I. I.; Ahaneku I. E. Review of adsorption isotherms models. Acta Technica Corviniensis - Bulletin of Engineering 2021, 14 (4), 87. [Google Scholar]
- Toncón-Leal C. F.; Villarroel-Rocha J.; Silva M. T. P.; Braga T. P.; Sapag K. Characterization of Mesoporous Region by the Scanning of the Hysteresis Loop in Adsorption–Desorption Isotherms. Adsorption 2021, 27 (7), 1109–1122. 10.1007/s10450-021-00342-8. [DOI] [Google Scholar]
- Wang J.; Guo X. Adsorption Isotherm Models: Classification, Physical Meaning, Application and Solving Method. Chemosphere 2020, 258, 127279. 10.1016/j.chemosphere.2020.127279. [DOI] [PubMed] [Google Scholar]
- Wu D.; Miao F.; Liu X.; Xiao X.; Zhai W. Prediction of High-Pressure Adsorption of CH4 and CO2 in Shale. International Journal of Greenhouse Gas Control 2021, 110, 103440. 10.1016/j.ijggc.2021.103440. [DOI] [Google Scholar]
- Lutyński M.; Waszczuk P.; Słomski P.; Szczepański J. CO 2 Sorption of Pomeranian Gas Bearing Shales – the Effect of Clay Minerals. Energy Procedia 2017, 125, 457–466. 10.1016/j.egypro.2017.08.153. [DOI] [Google Scholar]
- Hazra B.; Vishal V.; Sethi C.; Chandra D. Impact of Supercritical CO 2 on Shale Reservoirs and Its Implication for CO 2 Sequestration. Energy Fuels 2022, 36 (17), 9882–9903. 10.1021/acs.energyfuels.2c01894. [DOI] [Google Scholar]
- Mahmoud M.; Hamza A.; Hussein I. A.; Eliebid M.; Kamal M. S.; Abouelresh M.; Shawabkeh R.; Al-Marri M. J. Carbon Dioxide EGR and Sequestration in Mature and Immature Shale: Adsorption Study. J. Pet Sci. Eng. 2020, 188, 106923 10.1016/j.petrol.2020.106923. [DOI] [Google Scholar]
- Xie W.; Wang M.; Wang H. Adsorption Characteristics of CH4and CO2in Shale at High Pressure and Temperature. ACS Omega 2021, 6 (28), 18527–18536. 10.1021/acsomega.1c02921. [DOI] [PMC free article] [PubMed] [Google Scholar]
- Shi J.; Gong L.; Sun S.; Huang Z.; Ding B.; Yao J. Competitive Adsorption Phenomenon in Shale Gas Displacement Processes. RSC Adv. 2019, 9 (44), 25326–25335. 10.1039/C9RA04963K. [DOI] [PMC free article] [PubMed] [Google Scholar]
- Zhao H.; Lai Z.; Firoozabadi A. Sorption Hysteresis of Light Hydrocarbons and Carbon Dioxide in Shale and Kerogen. Sci. Rep 2017, 7 (1), 16209. 10.1038/s41598-017-13123-7. [DOI] [PMC free article] [PubMed] [Google Scholar]
- Santos J. M.; Akkutlu I. Y. Laboratory Measurement of Sorption Isotherm Under Confining Stress With Pore-Volume Effects. SPE J. 2013, 18, 924. 10.2118/162595-PA. [DOI] [Google Scholar]
- Hurst K. E.; Gennett T.; Adams J.; Allendorf M. D.; Balderas-Xicohténcatl R.; Bielewski M.; Edwards B.; Espinal L.; Fultz B.; Hirscher M.; Hudson M. S. L.; Hulvey Z.; Latroche M.; Liu D. J.; Kapelewski M.; Napolitano E.; Perry Z. T.; Purewal J.; Stavila V.; Veenstra M.; White J. L.; Yuan Y.; Zhou H. C.; Zlotea C.; Parilla P. An International Laboratory Comparison Study of Volumetric and Gravimetric Hydrogen Adsorption Measurements. ChemPhysChem 2019, 20 (15), 1997–2009. 10.1002/cphc.201900166. [DOI] [PubMed] [Google Scholar]
- Zheng S.; Sang S.; Wang M.; Liu S.; Huang K.; Feng G.; Song Y. Experimental Investigations of CO2 Adsorption Behavior in Shales: Implication for CO2 Geological Storage. Front Earth Sci. (Lausanne) 2023, 10, 1098035. 10.3389/feart.2022.1098035. [DOI] [Google Scholar]
- Liao Q.; Zhou J.; Xian X.; Yang K.; Zhang C.; Dong Z.; Yin H. Competition Adsorption of CO2/CH4 in Shale: Implications for CO2 Sequestration with Enhanced Gas Recovery. Fuel 2023, 339, 127400. 10.1016/j.fuel.2023.127400. [DOI] [Google Scholar]
- Mudoi M. P.; Sharma P.; Khichi A. S. A Review of Gas Adsorption on Shale and the Influencing Factors of CH4 and CO2 Adsorption. Journal of Petroleum Science and Engineering 2022, 217, 110897. 10.1016/j.petrol.2022.110897. [DOI] [Google Scholar]
- Wu D.; Liu X.; Liang B.; Sun K.; Xiao X. Experiments on Displacing Methane in Coal by Injecting Supercritical Carbon Dioxide. Energy Fuels 2018, 32 (12), 12766–12771. 10.1021/acs.energyfuels.8b03172. [DOI] [Google Scholar]
- Chen M.; Kang Y.; Zhang T.; Li X.; Wu K.; Chen Z. Methane Adsorption Behavior on Shale Matrix at In-Situ Pressure and Temperature Conditions: Measurement and Modeling. Fuel 2018, 228, 39–49. 10.1016/j.fuel.2018.04.145. [DOI] [Google Scholar]
- Mozaffari Majd M.; Kordzadeh-Kermani V.; Ghalandari V.; Askari A.; Sillanpää M. Adsorption Isotherm Models: A Comprehensive and Systematic Review (2010–2020). Sci. Total Environ. 2022, 812, 151334. 10.1016/j.scitotenv.2021.151334. [DOI] [PubMed] [Google Scholar]
- Ayawei N.; Ebelegi A. N.; Wankasi D. Modelling and Interpretation of Adsorption Isotherms. Journal of Chemistry 2017, 2017, 3039817. 10.1155/2017/3039817. [DOI] [Google Scholar]
- Rani S.; Padmanabhan E.; Bakshi T.; Prusty B. K.; Pal S. K. CO2 Sorption and Rate Characteristics in Micropores of Shales. J. Nat. Gas Sci. Eng. 2019, 68, 102903. 10.1016/j.jngse.2019.102903. [DOI] [Google Scholar]
- Chi Y.; Zhao C.; Lv J.; Zhao J.; Zhang Y. Thermodynamics and Kinetics of CO2/CH4 Adsorption on Shale from China: Measurements and Modeling. Energies (Basel) 2019, 12 (6), 978. 10.3390/en12060978. [DOI] [Google Scholar]
- Mahmoud M.; Hamza A.; Hussein I. A.; Eliebid M.; Kamal M. S.; Abouelresh M.; Shawabkeh R.; Al-Marri M. J. Carbon Dioxide EGR and Sequestration in Mature and Immature Shale: Adsorption Study. J. Pet Sci. Eng. 2020, 188, 106923. 10.1016/j.petrol.2020.106923. [DOI] [Google Scholar]
- Foo K. Y.; Hameed B. H. Insights into the Modeling of Adsorption Isotherm Systems. Chemical Engineering Journal 2010, 156, 2–10. 10.1016/j.cej.2009.09.013. [DOI] [Google Scholar]
- Boparai H. K.; Joseph M.; O’Carroll D. M. Kinetics and Thermodynamics of Cadmium Ion Removal by Adsorption onto Nano Zerovalent Iron Particles. J. Hazard Mater. 2011, 186 (1), 458–465. 10.1016/j.jhazmat.2010.11.029. [DOI] [PubMed] [Google Scholar]
- Günay A.; Arslankaya E.; Tosun I. Lead Removal from Aqueous Solution by Natural and Pretreated Clinoptilolite: Adsorption Equilibrium and Kinetics. J. Hazard Mater. 2007, 146 (1–2), 362–371. 10.1016/j.jhazmat.2006.12.034. [DOI] [PubMed] [Google Scholar]
- Li Z.; Zhang J.; Mo X.; Xu X.; Zhang Y.; Wang D.; Tong Z.; Tang X. Adsorption Behaviors of Near-Critical Carbon Dioxide on Organic-Rich Shales: Modeling, Multifractality, and Kinetics. Chemical Engineering Journal 2022, 428, 132526. 10.1016/j.cej.2021.132526. [DOI] [Google Scholar]
- Jeppu G. P.; Clement T. P. A Modified Langmuir-Freundlich Isotherm Model for Simulating pH-Dependent Adsorption Effects. J. Contam Hydrol 2012, 129–130, 46–53. 10.1016/j.jconhyd.2011.12.001. [DOI] [PubMed] [Google Scholar]
- Vijayaraghavan K.; Padmesh T. V. N.; Palanivelu K.; Velan M. Biosorption of Nickel(II) Ions onto Sargassum Wightii: Application of Two-Parameter and Three-Parameter Isotherm Models. J. Hazard Mater. 2006, 133 (1–3), 304–308. 10.1016/j.jhazmat.2005.10.016. [DOI] [PubMed] [Google Scholar]
- Sinha P.; Datar A.; Jeong C.; Deng X.; Chung Y. G.; Lin L. C. Surface Area Determination of Porous Materials Using the Brunauer-Emmett-Teller (BET) Method: Limitations and Improvements. J. Phys. Chem. C 2019, 123 (33), 20195–20209. 10.1021/acs.jpcc.9b02116. [DOI] [Google Scholar]
- Wjihi S.; Peres E. C.; Dotto G. L.; Lamine A. B. Physicochemical Assessment of Crystal Violet Adsorption on Nanosilica through the Infinity Multilayer Model and Sites Energy Distribution. J. Mol. Liq. 2019, 280, 58–63. 10.1016/j.molliq.2018.12.064. [DOI] [Google Scholar]
- Duan S.; Gu M.; Du X.; Xian X. Adsorption Equilibrium of CO2 and CH4 and Their Mixture on Sichuan Basin Shale. Energy Fuels 2016, 30 (3), 2248. 10.1021/acs.energyfuels.5b02088. [DOI] [Google Scholar]
- Aranovich G. L.; Donohue M. D. Predictions of Multilayer Adsorption Using Lattice Theory. J. Colloid Interface Sci. 1997, 189, 101. 10.1006/jcis.1997.4796. [DOI] [Google Scholar]
- Bi H.; Jiang Z.; Li J.; Xiong F.; Li P.; Chen L. Ono-Kondo Model for Supercritical Shale Gas Storage: A Case Study of Silurian Longmaxi Shale in Southeast Chongqing, China. Energy Fuels 2017, 31 (3), 2755–2764. 10.1021/acs.energyfuels.6b03425. [DOI] [Google Scholar]
- Sudibandriyo M.; Mohammad S. A.; Robinson R. L. Jr.; Gasem K. A. M. Ono-Kondo Lattice Model for High-Pressure Adsorption: Pure Gases. Fluid Phase Equilib. 2010, 299 (2), 238–251. 10.1016/j.fluid.2010.09.032. [DOI] [Google Scholar]
- Girish C. R. Various Isotherm Models for Multicomponent Adsorption: A Review. International Journal of Civil Engineering and Technology 2017, 8 (10), 80–86. [Google Scholar]
- Musah M.; Azeh Y.; Mathew J.; Umar M.; Abdulhamid Z.; Muhammad A. Adsorption Kinetics and Isotherm Models: A Review. Caliphate Journal of Science and Technology 2022, 4 (1), 20–26. 10.4314/cajost.v4i1.3. [DOI] [Google Scholar]