

Abstract

Surfactant chemical-enhanced oil recovery plays a crucial role in achieving ultralow interfacial tension between remaining crude oil and injected water, thereby enhancing oil recovery rates. This study aims to investigate the impact of pressure and gas/oil ratios (GORs) on surfactant flooding for enhanced oil recovery, focusing on high-pressure and high-temperature (HPHT) conditions. High-temperature salinity screening was employed to identify optimal surfactant formulations for Type III microemulsions. HPHT phase behavior tests were conducted to examine water and oil solubilization under pressure, with a particular focus on how GOR affects these parameters. The research utilized a unique approach to analyzing GOR variations at different pressure levels in a crude oil sample through salinity screening experiments and HPHT phase behavior tests using methane-containing live oil. With increasing pressure, while maintaining a lower GOR, the water solubilization ratio in the microemulsion increased dramatically, whereas the solubilization ratio of oil decreased. Furthermore, both oil and water solubilization ratios decreased at higher GOR and pressure compared to dead oil results. The optimum salinity was found to be equal to 17,283 ppm at a GOR of 180 scf/stb and decreased to 14,403 ppm at a GOR of 280 scf/stb, validating that the optimum salinity decreases with increasing GOR value. The tendency of microemulsion generation also decreased with increasing GOR from 180 to 280 and 380 scf/stb. Additionally, the minimum bubble point pressure required to solubilize the total amount of gas in the oil increased from 2500 psi at a GOR of 280 scf/stb to 3000 psi at a GOR of 380 scf/stb. The microemulsion was not observed at any pressure level and at any salinity at a higher GOR (380 scf/stb). This study provides valuable insights into the petroleum industry, offering potential improvements in reservoir management, forecasting accuracy, and recovery efficiency. The research’s innovative approach to analyzing GOR variations and its impact on surfactant flooding under HPHT conditions contributes to the field’s knowledge and could lead to more effective and efficient oil recovery strategies.
1. Introduction
Crude oil reservoirs’ development usually undergoes three recovery phases for oil recovery from subsurface formations: primary recovery, secondary recovery, and tertiary recovery. In primary recovery, oil is pushed to the surface by the reservoir’s natural pressure. However, this method often results in a low recovery factor, particularly in volumetric reservoirs.1,2 Secondary recovery techniques consist of the injection of water or immiscible gas. Such immiscible gas or water injection aims to displace any remaining oil after primary recovery. Despite their effectiveness, these methods can leave significant amounts of oil behind due to complex formation and fluid properties. The remaining oil in the reservoir may not be of the heavy type but it remains in a residual state due to not only viscous forces but also capillary forces. Tertiary recovery, also known as enhanced oil recovery (EOR), involves injecting chemicals, gases, or high-temperature energy into the reservoir to extract the remaining heavy oil. The choice of EOR technique depends on factors such as rock and fluid properties, as well as economic considerations.3
EOR techniques are classified into three categories: thermal recovery, chemical flooding, and miscible displacement. The most common chemical EOR method for achieving ultralow interfacial tension (IFT) is surfactant flooding, which is highly effective in recovering residual oil after waterflooding.4 Surfactants, possessing both hydrophilic and hydrophobic groups (amphiphilic molecules), accumulate at the oil–water interface, altering the IFT.5
Figure 1 shows the schematic for the different types of brine and crude oil microemulsion (ME). ME is a dispersion of water and oil stabilized by a surfactant, containing specific quantities of both components. Winsor categorized potential ME systems into three types in 1954: Type I (oil-in-water ME), Type II (water-in-oil ME), and Type III (bicontinuous ME), with surfactant distribution differing among the types.6 In Type I ME, known as direct ME, an oil component is solubilized in surfactant-rich water, causing the surfactant to disperse as monomers. Type II ME forms a reversed emulsion when part of the surfactant-poor aqueous phase dissolves in the surfactant-rich oil. Type III ME forms a bicontinuous middle-phase ME rich in surfactants between the water and oil phases.7 The water and oil in all three types are stable and do not separate from the ME.8,9 Type III MEs are considered optimal for EOR, as shown by Hirasaki et al.10
Figure 1.

Different types of brine and crude oil ME [After 11] Copyright 2023 ELSEVIER.
Phase behavior (PB) or salinity screening experiments are usually performed to obtain the optimum chemical formulations for surfactant–polymer or surfactant–alkaline–polymer (SP/ASP) methods.12−14 In the ordinary PB experiment, the surfactant will be mixed with the brine and dead oil, which will be prior diluted with toluene to imitate properties of reservoir oil, such as viscosity. This mixture will then be stored in glass pipettes to observe the creation of MEs at atmospheric pressure and reservoir temperature (>90 °C). Viscosity plays a pivotal role in controlling fluid mobility, making it a crucial parameter to match.
It is crucial to recognize that diluting crude oil can significantly alter its ME characteristics. Achieving ultralow IFT between the oil and reservoir conditions is the primary objective of designing aqueous-surfactant formulations. The behavior of the surfactant, brine, and oil phases can be greatly influenced by the amount of dissolved gas in crude oil, a factor that should not be underestimated.15 Changes in the gas/oil ratio (GOR) can significantly affect the behavior of the brine, surfactant, and oil phases. Therefore, it is essential to consider the presence of live crude oil with varying GOR values across different reservoir regions due to pressure fluctuations when determining the optimal salinity of a surfactant formulation (S*) under elevated temperature conditions for a specific surfactant formulation.
Table 1 summarizes the collective findings from various studies investigating the impact of live oil and pressure on PB in surfactant flooding.11 Overall, the consensus suggests that the presence of live oil tends to reduce S* in these systems. However, there is a notable exception observed in the study by Austad and Strand,16 where an increase in S* was reported alongside a shift of the PB to Type I. This discrepancy highlights the complexity of the interaction between live oil and surfactant flooding. Regarding the effect of pressure, the results across different studies exhibit less consistency. Several studies found that pressure had a negligible effect on PB.15,17−19 In contrast, the remaining studies indicated that increasing pressure resulted in a shift of PB toward Type I and an increase in the water solubilization ratio (SR) in ME. Simultaneously, some studies reported a decrease in the oil SR and lower IFT values, as evidenced by Southwick et al.20 These varying outcomes underscore the need for comprehensive investigations to understand the complex interplay among live oil, pressure, and surfactant flooding.
Table 1. Summary of the Effect of Live Oil and Pressure on PBa.
| references | effect of live oil | effect of pressure |
|---|---|---|
| Puerto and Reed21 | Reduction in S* | A shift of PB to Type I |
| Roshanfekr et al.22 | Reduction in S* | Increase in S* |
| A shift of PB to Type II | A shift of PB to Type I | |
| Austad et al.16 | Increase in S* | Water SR in ME increased |
| A shift of PB to Type I | A shift of PB to Type I | |
| Sassen et al.23 | Water SR in ME increased | |
| A shift of PB to Type I | ||
| Sandersen et al.24 | Water SR in ME increased | |
| A shift of PB to Type I | ||
| Southwick et al.20 | Lower IFT values | |
| Optimum SR increase | ||
| Skauge and Fotland25 | Increase in S* | |
| O/ME SR decrease | ||
| Nelson19 | Reduction in S* | Negligible effect on PB |
| Negligible effect on PB | ||
| Jang et al.17 | Optimum SR increase | Negligible effect on PB |
| Marliere and Creton15 | S* decreased with increasing GOR | Negligible effect on PB |
| Monette and Nguyen26 | Decrease of S* | Decrease of OS |
| Optimum SR increase | ||
| Sui et al.18 | Decrease of S* | Negligible effect on PB |
O, oil; W, water; ME, microemulsion; PB, phase behavior; SR, solubilization ratio; OS, optimal salinity.
This study offers a novel approach by examining the combined effects of pressure and GOR on surfactant flooding performance, a crucial factor in EOR. Phase transitions between different ME types can shift under reservoir conditions, directly influencing EOR performance. While previous research has identified the role of pressure and dissolved gas in ME stability and efficiency, this study extends the understanding by conducting salinity screening at atmospheric pressure and high-pressure, high-temperature (HPHT) PB analysis using a specialized surfactant and recombined live crude oil. Since oil reservoirs vary greatly in pressure and gas composition, understanding these effects is vital for designing EOR formulations tailored to specific reservoir conditions. This ensures that the surfactant achieves the desired PB, optimizing oil displacement and maximizing recovery. The findings have significant practical applications, offering a pathway to more effective EOR strategies across varying reservoir types.
2. Methodology
2.1. Chemical and Material Description
Dead crude oil used in this research was labeled as a light Saudi crude (LS) with the properties of 29.4 API gravity value at 15 °C and TAN of 0.12 mg KOH/g oil. The composition of LS comprised 21.2% saturates, 60.48% aromatics, 9.69% resins, and 4.1% asphaltenes. The crude oil was diluted with 10% toluene for PB experiments to imitate the reservoir oil viscosity. The density and viscosity values for both dead and surrogated LS at 25, 50, and 90 °C are given in Figures 2 and 3, respectively. Live oil was prepared by diluting the dead crude oil (for which SARA analysis is presented in Figure 4) with a certain amount of methane at reservoir conditions to reach a particular GOR value. The composition of the injection water that was used in this research is given in Table 2, which represents the high-salinity injection water composition.
Figure 2.

Density of LS and surrogated LS (10% Toluene) measured as a function of temperature.
Figure 3.

Viscosity of dead LS and surrogated LS (10% Toluene) measured as a function of temperature.
Figure 4.

Chromatogram of the crude oil sample showing different SARA groups, done using Iatroscan MK-7 utilizing the thin-layer chromatography and flame ionization detection method.
Table 2. Injection Water Composition.
| ionic species | Na+ | Ca2+ | Mg2+ | Cl– | SO2–4 | TDS (ppm) |
|---|---|---|---|---|---|---|
| Concentration (ppm) | 18,300 | 650 | 2110 | 32,289 | 4290 | 57,639 |
2.2. Experimental Procedures
2.2.1. IFT Screening
The IFT between the crude oil sample and different aqueous solutions was measured using a spinning drop tensiometer at different temperatures as a reference for the performance of surfactant formulations. IFT values of the crude oil samples with deionized water, high-salinity injection water, and formation brine are listed in Table 3. The IFTs between the crude oil and the 1% blended surfactant formulation at different salinities were measured to guide the salinity screening experiments at a high temperature (90 °C) and ambient pressure. An example of IFT measurements as a function of salinity is shown in Figure 5. The stabilized IFT values between the crude oil and the surfactant formulations at 90 °C and ambient pressure using the spinning drop tensiometer were found to be 0.304, 0.321, and 0.335 mN/m at salinity values of 4.60, 5.76, and 6.91 g/L, respectively.
Table 3. IFT Measurement between Crude Oil Samples and Different Aqueous Solutions as a Function of Temperature Using a Spinning Drop Tensiometer.
| aqueous solution | temperature (°C) | IFT (mN/m) |
|---|---|---|
| DI water | 25 | 31.03 |
| 50 | 33.33 | |
| 90 | 34.24 | |
| Injection Water | 25 | 33.65 |
| 50 | 34.38 | |
| 90 | 35.74 |
Figure 5.

IFT between LS and 1.0% surfactant-1 surfactant formulation in diluted injection water at 90 °C and ambient pressure using a spinning drop tensiometer.
2.2.2. HT Salinity Screening
During the high-temperature PB experiment, a mixture of surfactant, brine, and oil was prepared. The oil was prediluted with toluene to mimic the properties of reservoir oil, including viscosity. Subsequently, this prepared mixture was placed in glass pipettes (as shown in Figure 6) to monitor the formation of MEs under atmospheric pressure and reservoir-level temperatures exceeding 90 °C. A decent amount of time was spent on the observation of the solutions in the oven at reservoir temperature (90 °C) to determine the system at the equilibration state. PB in the equilibrium state is substantial to mimic the procedure in the reservoir. The optimal formulation, determined based on desired parameters such as salinity, IFT, low ME viscosity, and SR, was selected. This formulation was then employed in experiments to investigate PB under HPHT conditions using live oil.
Figure 6.

PB experiments with salinity increasing from left to right.
2.2.3. Live-Crude-Oil Recombination
After the determination of the optimum surfactant formulation indicating Type III ME as indicated in HT salinity screening, the same surfactant formulation range was tested with the live oil that was prepared using the PVT 300/700 HPHT Cell at different GORs to evaluate the impact on the ME PB. The total formulation volume was equal to 10 mL, 3 mL of which was filled with live oil and the remaining 7 mL of which was occupied by the surfactant. 60 mL of methane was introduced to the PVT cell from the cylinder at a pressure of 2000 psi. After finishing the transfer of the whole volume, the pressure in the cell was increased to 2500 psi in order to reduce the volume of methane to 40 mL. Afterward, the dead oil sample that contributed to the generation of Type III ME at atmospheric pressure was prepared for injection into the PVT cell. Before starting the experiment, the accumulator used for dead oil was tested with water using the ISCO syringe pump at a maximum of 5000 psi to ensure that no leaks were observed. As the leak test was shown to be successful, 150 mL of dead crude oil was introduced into the accumulator. Then, the accumulator was connected to the pump from the bottom and to the PVT cell from the top in order to maintain an injection at high pressure. The water from the pump was injected at a pressure that was continuous at 2550 psi from the bottom to push the internal piston up to displace and inject 121.6 mL of dead oil into the PVT cell that contains methane inside at 2500 psi. To maintain a pressure drop during the transferring procedure, a 50 psi difference in pressures in two cells was retained. Using the initial volume of gas (Vgi), pressure (psi), temperature (°R), required GOR, and eqs 1–3, the required volume of oil to be injected into the PVT cell to achieve a certain GOR was calculated. After reaching a total volume of 161.6 mL in the cell at 2500 psi, 50 °C, the live oil was stirred continuously until no bubbles of free gas were present in the cell. The mixing procedure was visualized with the camera of the PVT cell. Upon continuous observation and confirmation of the successful experiment, the sample of live oil was transferred to the accumulator and kept at a constant high pressure (2500 psi). Three different live oil samples with GOR values of 180, 280, and 380 scf/stb were prepared in the cell. The minimum high pressure above the bubble point that was used in order to dissolve the required amount of methane in the dead oil was equal to 2500 psi.
| 1 |
| 2 |
| 3 |
where Bg is the formation volume factor (ft3/scf), Tgis the temperature in °R,Pgis the reservoir pressure in psia,Vg. st. is the volume of gas at standard conditions, and Vo is the required oil volume to achieve a certain GOR.
2.2.4. HPHT PB
After the optimum surfactant formulation range was identified from HT salinity screening experiments at atmospheric pressure, they were utilized in the HPHT PB experiments using 5 M9715 HPHT PVT visualization sapphire cells. While the surrogate crude oil was used in the experiments at atmospheric pressure, the live-crude-oil samples with different GORs that were prepared in the PVT cell were used in HPHT experiments. The maximum operating conditions of HPHT sapphire cells are 350 bar and 150 °C. The experimental procedure to determine the separate effect of GOR and HPHT consisted of nine experiments at different conditions as shown in Table 4.
Table 4. HPHT PB Experimental Workflow.
| 2500 psi | 3000 psi | 3500 psi | 4000 psi | |
|---|---|---|---|---|
| GOR 180 | + | + | + | |
| GOR 280 | + | + | + | |
| GOR 380 | + | + | + |
3. Results and Discussions
PB experiments at reservoir temperature and atmospheric pressure were executed in the salinity range of 4321–17,283 ppm using 0.25 wt % of a surfactant blend for the surrogate LS oil. The optimum surfactant formulation range was identified after numerous trials in five surfactant formulations. Type III ME in the salinity range of 11,522–17,283 ppm at 0.25% surfactant concentration is shown in Figure 7. To quantify the optimum salinity range, the SRs for each of the ME Type III surfactant formulations were calculated, and the general plot as a function of salinity has been plotted in Figure 8.
Figure 7.
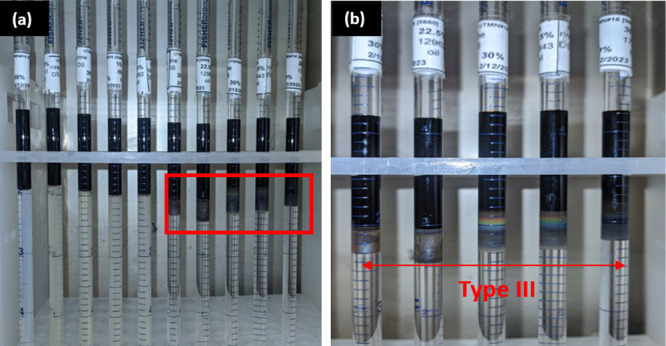
(a) Salinity scans using 0.25 wt % surfactant-2 with the surrogated LS sample at 90 °C and a lower salinity range (4321–17,283 ppm) and 30/70 oil to water volume; (b) Type III range at 20–30% salinity or 11,522–17,283 ppm.
Figure 8.

SRs as a function of optimal salinity for 0.25% surfactant concentration at 90 °C.
3.1. Effect of Pressure
The effect of pressure was discussed in HPHT PB experiments by comparing the changes in the optimum parameters of the ME PB system containing the surfactant formulations in the salinity range of 11,522–17,283 ppm. Initially, the optimum surfactant formulation out of five was identified in the experiment at constant live crude GOR 180 scf/stb and GOR 280 scf/stb at 2500 psi. After the determination of the optimum formulation, the pressure on the system was increased to 3000 and 3500 psi and the changes in this optimum surfactant formulation at each pressure level were observed. The optimum surfactant formulation during the experiment with constant GOR 180 scf/stb was obtained at the highest salinity level of 17,283 ppm at 2500 psi after equilibration. The picture was taken, and then, the system was increased to 3000 and 3500 psi, and again, the data were obtained and compared as shown in Figure 9. The SR of water in the ME increases drastically, while the opposite happens for the SR of oil. It can be explained by the fact that the presence of the gas inside crude oil contributes to the tendency of ME to solubilize more water than oil at high pressures. It can be quantified visually in Figure 10, where the SR changes as a function of pressure are demonstrated.
Figure 9.
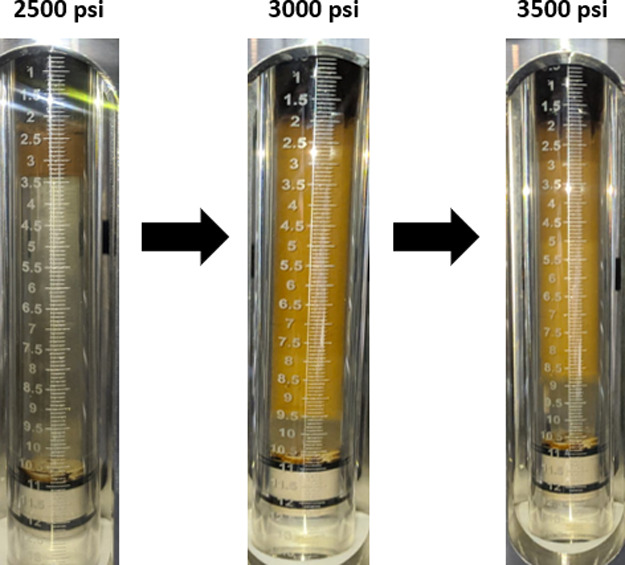
Effect of pressure on the ME PB-GOR 180 scf/stb, at 90 °C and 17,283 ppm salinity.
Figure 10.

Water and oil SR-GOR 180 scf/stb, at 90 °C and 17,283 ppm salinity.
At GOR 280 scf/stb, the optimum surfactant formulation during the experiment was obtained at the salinity level of 14,403 ppm at 2500 psi after equilibration. As with the previous experiment, in this case as well, initially, the data were obtained at 2500 psi and then the system pressure was increased to 3000 and 3500 psi; the observation was made as shown in Figure 11.
Figure 11.

Effect of pressure on the ME PB-GOR 280 scf/stb, at 90 °C and 14,403 ppm salinity.
Similar to the previous result with GOR 180 scf/stb, in the case of constant GOR 280 scf/stb, the pressure enhancement on the system from 2500 to 3000 and 3500 psi contributed to the dramatic increase of water solubilization and the decrease of oil solubilization in the ME. This behavior can be exhibited quantitatively in Figure 12. Finally, at GOR 380 scf/stb, the effect of pressure was not determined on the system containing live-crude with GOR 380 scf/stb as no ME was generated at any pressure level.
Figure 12.

Water and oil SR-GOR 280 scf/stb, at 90 °C and 14,403 ppm salinity.
3.2. Effect of GOR
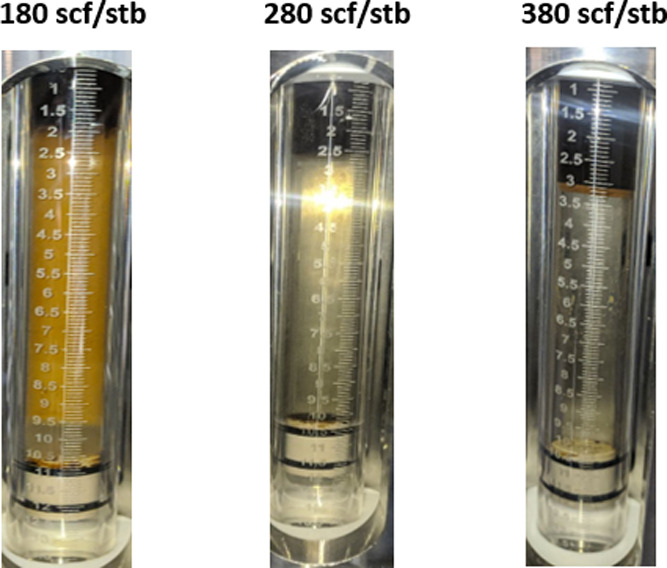
Figure 13 shows the effect of GOR on ME PB at 3000 psi, 90 °C, and 14,403 ppm. It is clear that on increasing the GOR from 180 to 380 scf/stb, the ME changes from Type I to Type III with more solubilization of water and then to Type II correspondingly. However, it turns from type III to only type II when GOR is increased at the same conditions with a salinity of 17,283 ppm as shown in Figure 14. The SRs of both oil and water decrease as the GOR increases at a fixed salinity, pressure, and temperature (Figure 15).
Figure 13.

Effect of GOR on the ME PB at 3000 psi, 90 °C, and 14,403 ppm salinity.
Figure 14.
Effect of GOR on the ME PB at 3000 psi, 90 °C, and 17,283 ppm salinity.
Figure 15.

SRs for oil and water as a function of GOR at 3000 psi, 90 °C, and 17,283 ppm salinity.
In the case of GOR 180 scf/stb, the optimum salinity was determined at the salinity of 17,283 ppm, whereas in the case of GOR 280 scf/stb, it was 14,403 ppm. This indicates that with increasing GOR value, the optimum salinity decreases (Figure 16). This also explains the absence of type III ME at a GOR of 380 scf/stb shown earlier in Figure 13.
Figure 16.

Optimum salinity (S*) as a function of GOR at 2500 psi.
Finally, it has been observed that as the GOR increases from 180 to 280 and 380 scf/stb, while maintaining constant pressures of 3000 and 3500 psi, the ME diminishes across a wide range of salinity levels. For instance, at salinity levels of 12,962, 15,843, and 17,283 ppm under pressures of 3000 and 3500 psi, ME formation was observed at the lower GOR value of 180 scf/stb. However, upon increasing the GOR to 280 and 380 scf/stb, the ME ceased to form at all salinity levels. This observation underscores the significant impact of a high gas content on the suppression of ME formation.
4. Conclusions
The study explores how pressure and GOR jointly affect surfactant flooding parameters, employing a unique approach to investigate GOR variations at different pressure levels in a crude oil sample through salinity screening experiments and HPHT PB tests using methane-containing live oil. The following are the main conclusions.
With increasing pressure, while keeping a lower GOR, the water SR in the ME increases dramatically, whereas the SR of oil decreases.
Both oil and water SRs decrease at higher GOR and pressure compared to dead oil results.
The optimum salinity was equal to 17,283 ppm at a GOR of 180 scf/stb and decreased to 14,403 ppm at a GOR of 280 scf/stb. This validates that the optimum salinity decreases with increasing GOR value.
The tendency of ME generation decreases with increasing GOR from 180 to 280 and 380 scf/stb. Furthermore, the minimum bubble point pressure that is required to solubilize the total amount of gas in the oil increased from 2500 psi at GOR 280 scf/stb to 3000 psi at GOR 380 scf/stb.
The ME was not observed at any pressure level and at any salinity at a higher GOR (380 scf/stb).
Conducting HPHT PB tests allows for the simulation of reservoir conditions, making the study more relevant to practical applications in the oil and gas industry.
In practical terms, understanding the effect of pressure and dissolved gas on the PB of EOR surfactants enables the development of tailored surfactant formulations optimized for specific reservoir conditions, ensuring maximum oil recovery efficiency. This knowledge allows operators to predict and control the formation of MEs and interfacial properties at reservoir pressure, improving the mobilization of trapped oil. Additionally, the insights gained from these studies provide a foundation for future advancements in EOR strategies, such as the incorporation of new surfactant chemistries that perform efficiently under varying pressure and gas environments, potentially expanding the applicability of EOR in unconventional and challenging reservoirs.
Acknowledgments
The authors would like to acknowledge the College of Petroleum Engineering & Geosciences in King Fahd Univeristy of Petroleum & Minerals, all of the staff in the Laboratory Technical Support & Services Department, the Petroleum Engineering Department and the Center for Integrative Petroleum Research for their support of this research. The authors would also like to express their gratitude to Saudi Aramco for funding this research.
Glossary
Nomenclature
- ppm
parts per million
- IFT
interfacial tension, mN/m
- ME
microemulsion
- PB
phase behavior
- scf/stb
standard cubic feet/stock-tank barrel
- °C
temperature, °C
- Bg
formation volume factor
- Vg. st.
volume of gas at standard conditions
- Vgi
initial volume of gas in the PVT cell
- Vo
required oil volume to achieve a certain GOR
- GOR
gas oil ratio, scf/stb
- S*
optimum salinity of surfactant formulation
- SARA
saturates, aromatics, resins, and asphaltenes
The authors declare no competing financial interest.
References
- Green D. W.; Willhite G. P.. Enhanced oil recovery; Society of Petroleum Engineers: Richardson, TX, 2018. [Google Scholar]
- Lake L. W.; Johns R.; Rossen W.; Pope G. A.. Fundamentals of Enhanced Oil Recovery; Society of Petroleum Engineers: Richardson, Texas, USA, 2014. [Google Scholar]
- Aoudia M.; Al-Shibli M. N.; Al-Kasimi L. H.; Al-Maamari R.; Al-Bemani A. Novel surfactants for ultralow interfacial tension in a wide range of surfactant concentration and temperature. J. Surfactants Deterg. 2006, 9, 287–293. 10.1007/s11743-006-5009-9. [DOI] [Google Scholar]
- Thomas S.; Ali S. M. Micellar flooding and ASP-chemical methods for enhanced oil recovery. J. Can. Pet. Technol. 2001, 40, 40. 10.2118/01-02-04. [DOI] [Google Scholar]
- Liu Z. Y.; Wang C.; Zhou H.; Wang Y.; Zhang Lei; Zhang Lu; Zhao S. Characterizing the impact of surfactant structure on interfacial tension: a molecular dynamics study. J. Mol. Model. 2017, 23, 112. 10.1007/s00894-017-3285-0. [DOI] [PubMed] [Google Scholar]
- Winsor P. A.Solvent Properties of Amphiphilic Compounds; Butterworths Scientific Publ. Ltd.: London, 1954. [Google Scholar]
- Sheng J. J.Modern chemical enhanced oil recovery: theory and practice; Gulf Professional Publishing: Boston, Massachusetts, USA, 2010. [Google Scholar]
- Schechter R. S.; Wade W. H.. Research on tertiary oil recovery: annual report; Univ. Texas: Austin, TX, 1976. [Google Scholar]
- Becher P. Microemulsions and Related Systems: Formulation, Solvency, and Physical Properties. J. of Dispersion Science and Technology 1990, 11, 431–432. 10.1080/01932699008943264. [DOI] [Google Scholar]
- Hirasaki G. J.; Van Domselaar H. R.; Nelson R. C. Evaluation of the salinity gradient concept in surfactant flooding. SPE J. 1983, 23, 486–500. 10.2118/8825-PA. [DOI] [Google Scholar]
- Hajiyev M.; Ibrahim A. F.; Abdelgawad K. Z.; Alkhateeb A.; Patil S. Revisiting the effect of oil type and pressure on optimum salinity of EOR surfactant formulation using phase behavior evaluation. Geoenergy Sci. Eng. 2023, 230, 212259 10.1016/j.geoen.2023.212259. [DOI] [Google Scholar]
- Furia T. E.Identification and Evaluation of Flavors. Fenaroli’s Handb. Flavor Ingredients, 2021, 45–46. [Google Scholar]
- Suniga P. T.; Fortenberry R.; Delshad M.. Observations of Microemulsion Viscosity for Surfactant. EOR Processes. Proc - SPE Symp Improv Oil Recover, Janua:11–3; OnePetro, 2016. [Google Scholar]
- Hirasaki G. J.; Miller C. A.; Puerto M. Recent advances in surfactant EOR. SPE J. 2011, 16, 889–907. 10.2118/115386-PA. [DOI] [Google Scholar]
- Marliere C.; Creton B. Effect of Live-Crude-Oil Composition on Optimal Salinity of a Surfactant Formulation: Experiments and Modeling. SPE Reserv. Eval. & Eng. 2020, 23, 388–401. 10.2118/179792-PA. [DOI] [Google Scholar]
- Austad T.; Hodne H.; Strand S.; Veggeland K. Chemical flooding of oil reservoirs 5. The multiphase behavior of oil/brine/surfactant systems in relation to changes in pressure, temperature, and oil composition. Colloids Surfaces A Physicochem. Colloids Surf., A 1996, 108, 253–262. 10.1016/0927-7757(95)03405-6. [DOI] [Google Scholar]
- Jang S.; Liyanage J.; Lu J.; Kim D.; Arachchilage G.; Britton C.; Weerasooriya U.; Pope G.. Microemulsion Phase Behavior Measurements Using Live Oils at High Temperature and Pressure. In: SPE Improved Oil Recovery Symposium held in Tulsa, Oklahoma, USA, April 12–16; OnePetro, 2014.
- Sui X.; Chen Z.; Kurnia I.; Han X.; Yu J.; Zhang G. Alkaline-surfactant-polymer flooding of active oil under reservoir conditions. Fuel 2020, 262, 116647 10.1016/j.fuel.2019.116647. [DOI] [Google Scholar]
- Nelson R. C. The Effect of Live Crude on Phase Behavior and Oil-Recovery Efficiency of Surfactant Flooding Systems. SPE J. 1983, 23, 501–510. 10.2118/10677-PA. [DOI] [Google Scholar]
- Southwick J. G.; Svec Y.; Chilek G.; Shahin G. T. Effect of Live Crude on Alkaline/Surfactant Polymer Formulations: Implications for Final Formulation Design. SPE J. 2012, 17, 352–361. 10.2118/135357-PA. [DOI] [Google Scholar]
- Puerto M. C.; Reed R. L. A Three-Parameter Representation of Surfactant/Oil/Brine Interaction. SPE J. 1983, 23, 669–682. 10.2118/10678-PA. [DOI] [Google Scholar]
- Roshanfekr M.; Johns R. T.; Pope G. A.; Britton L. N.; Linnemeyer H.; Britton C.; Vyssotski A.. Effect of Pressure, Temperature, and Solution Gas on Oil Recovery from Surfactant Polymer Floods, in: SPE Annual Technical Conference and Exhibition, New Orleans, Louisiana, October 4–7; OnePetro, 2009.
- Sassen C. L.; De Loos T. W.; De Swaan Arons J. Influence of pressure on the phase behavior of the system H2O + C10 + C4E1 using a new experimental setup. J. Phys. Chem. 1991, 95, 10760–10763. 10.1021/j100179a044. [DOI] [Google Scholar]
- Sandersen S. B.; Stenby E. H.; von Solms N. The effect of pressure on the phase behavior of surfactant systems: An experimental study. Colloids Surfaces A Physicochem. Eng. Asp. 2012, 415, 159–166. 10.1016/j.colsurfa.2012.09.006. [DOI] [Google Scholar]
- Skauge A.; Fotland P. Effect of Pressure and Temperature on the Phase Behavior of Microemulsions. SPE Reserv. Eng. 1990, 5, 601–608. 10.2118/14932-PA. [DOI] [Google Scholar]
- Monette M.; Nguyen Q. P. Investigation of the effect of gas compositions on low-tension-gas flooding. J. Pet. Sci. Eng. 2021, 207, 109140 10.1016/j.petrol.2021.109140. [DOI] [Google Scholar]