Abstract
An improved understanding of the molecular actions underpinning bone marrow mesenchymal stem cell (BMSC) differentiation could highlight new therapeutics for osteoporosis (OP). Current evidence indicates that microRNAs (miRNAs) exert critical roles in many biological systems, including osteoblast differentiation. In this study, we examined miR-468-3p effects on osteogenic differentiation (OD). Distinct miR-468-3p reductions were identified during OD. MiR-468-3p also suppressed BMSC OD in gain- and loss-of-function assays, while it negatively regulated Runx2 as shown by molecular, protein, and bioinformatics approaches. When Runx2 was inhibited by small-interfering RNA (siRNA), the inhibitory effects of miR-468-3p toward BMSC osteogenesis were considerably reversed. Also, silenced miR-468-3p in ovariectomized (OVX) and sham mice augmented bone mass (BM) and bone formation (BF) and improved trabecular (Tb) microarchitecture. Therefore, miR-468-3p is a novel Runx2 regulator with key physiological action in BF and OD.
Keywords: miR-468-3p, Osteogenic differentiation, Runx2, Bone formation
Introduction
Bone marrow mesenchymal stem cells (BMSCs) can differentiate into different cell types (chondrocytes, osteoblasts, and adipocytes) [1]. Osteoporosis (OP) is a serious public health problem in individuals with low bone mass (BM), which is manifested by imbalanced bone resorption and bone formation (BF) [2]. Reduced BMSCs that differentiate into osteoblasts is an important mechanism in OP [3]. Osteoblastic differentiation is regulated by different signaling proteins and transcription factors, including bone morphogenetic proteins (BMPs) [4, 5], core-binding factor a1 (also called Runx2), and Osterix [6]. Of these, Runx2 is a vital regulatory factor required for mesenchymal cell differentiation into preosteoblasts [7]. A better understanding of the regulatory mechanisms related to Runx2 expression would provide insight into bone metabolism and osteoporosis.
MicroRNAs (miRNAs) are a group of endogenous small non-coding RNAs, with lengths between 18–25 nucleotides. Generally, miRNAs promote mRNA degradation or eliminate translation by binding to 3’ untranslated regions (3’UTRs) in target mRNAs, which in turn suppresses target gene function [8]. In biology, miRNAs have key roles in cell proliferation, differentiation, apoptosis, and tumorigenesis [9–13]. The role of non-coding RNAs in musculoskeletal system has been widely studied. Small interfering RNA (siRNAs) has been associated with rheumatoid arthritis and OP and may be useful to study reparative processes of tendons [14–16]. MicroRNAs play an important role in osteoarthritis and tendon injuries [17, 18].
In addition, a lot of research has shown that miRNAs are very important in osteoblast differentiation. For example, MiRNA-19a-3p inhibits HDAC4 expression in human mesenchymal stem cells (hMSCs), which promotes osteogenic differentiation (OD) in cells and slows bone loss processes [19]. MiR-1224-5p promotes osteoblast differentiation by targeting ADCY2 through the Rap1 signaling pathway [20]. MiR-215-5p stimulates hBMSC OD by targeting XIAP [21]. MiRNA let-7a-5p also promotes osteoblast differentiation and improves OP development by targeting RNA KCNQ1OT1 [22].
In the present study, we characterized miR-468-3p, a novel down-regulated miRNA from miRNA array profiling in Medicarpin (a pterocarpan with proven bone-forming effects) induced mice calvarial osteoblast cells [23], and investigated the effects on osteoblast differentiation and bone formation. We show that miR-468-3p was downregulated during BMSC osteoblastic differentiation and osteoblastic BF. TargetScan and MicroRNA.org (miRNA gene target databases) both showed that Runx2 was targeted by miR-468-3p. Our findings further demonstrate that miR-468-3p is a novel Runx2 regulator that functions as a central factor in the physiological process of bone formation and osteoblast differentiation. These data shed new light on the roles of miRNAs in osteoblast differentiation and bone formation.
Materials and methods
Reagents
BMP-2 was supplied by PeproTech (USA). ALP, Cbfa1/Runx2 and anti-GAPDH antibodies were purchased from Abcam (Cambridge, USA). Agomir-468-3p, antagomir-468-3p and negative controls were obtained from RiboBio (Guangzhou, China), and siRNA and negative controls were purchased from RiboBio. Transfection and interference were done using lipofectamine 2000 (Invitrogen, CA, USA).
BMSC isolation and culture
Cells from C57BL/6J mice (6 weeks old) were used for BMSC culture [24]. To harvest cells from bone marrow, femur bones from female mice were flushed. Flow cytometry (FC) was then used to characterize cells in terms of stem cell-related surface marker expression. For FC, 106 cells/100 µl were incubated for 0.5 h on ice with monoclonal phycoerythrin-conjugated antibodies against CD29, CD44, Sca-1, CD34, CD45, and CD11b (Biolegend, USA). As negative controls, isotype-matched antibodies were used (BD, San Jose, CA, USA). We gathered data from 10,000 viable events and list mode files were processed in FC Express Software (BD).
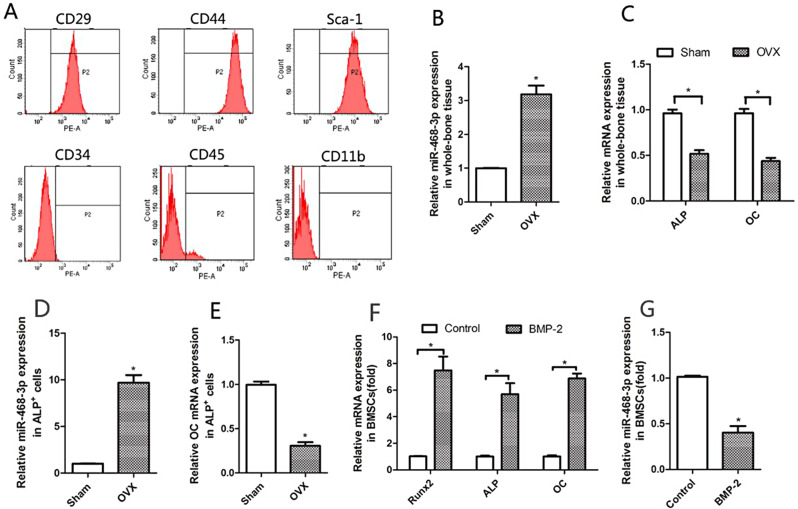
Sorted CD29+CD44+Sca-1+CD34−CD45−CD11b− BMSCs (Fig. 1A) were grown in α-MEM medium (Invitrogen, Carlsbad, CA, USA) plus 10% fetal bovine serum (FBS), penicillin/ streptomycin (1%), and 2-mercaptoethanol, and then grown at 37 °C in 5% CO2. Nonadherent cells were eliminated by several media changes over 3 days. Remaining adherent cells were grown for 2 weeks until confluency, after which they passaged after treatment with 0.25% trypsin for 3 min. Cells were harvested at passage 2 - bone chips were also discarded. More experiments were done on cells from passages 3–8.
Fig. 1.
miR-468-3p is reduced during osteogenic differentiation. (A) BMSC characterization (flow cytometry). (B) MiR-468-3p levels in left femurs from ovariectomy (OVX) or sham mice at 6 weeks and 6 months old after surgery (OVX-6w and Sham-6w; 6 months old) (RT-PCR). (C) ALP and OC mRNA levels in left femurs after operations (RT-PCR). (D) MiR-214 levels (RT-PCR) in Alp+ cells by fluorescence-activated cell sorting (FACS) from BMSCs in bilateral femurs from OVX- and sham-operated animals. (E) OC mRNA levels (RT-PCR) in Alp+ cells (FACS) from BMSCs in bilateral femurs from OVX- and sham-operated animals. Six mice/group. (F) BMSCs were treated with BMP-2 (200 ng/ml) or not for 4 days. Runx2, OC, and ALP levels by qRT-PCR. GAPDH = internal control. (G) BMSCs were treated using BMP-2 and miR-468-3p levels were assayed by qRT-PCR. U6 = internal control. Data are mean values ± SD. Studies were performed three times. *P < 0.05 compared with controls
Fluorescence-activated cell sorting (FACS) on osteoblasts
The femurs of mice were used to collect stem cells from bone marrow, which were used in FACS analyses with PerCP-labeled antibodies to rat, mouse, and human ALP (R&D Systems, AF2910, 1:50). PBS and 1% BSA were used to wash cells, and ALP antibodies used to stain them right aways. Then, stained cell populations were washed three times for FACS analysis. ALP+ cells were RNA extracted and examined using real-time PCR (RT-PCR) assays.
OD and transfection
In osteoblastic differentiation, BMSCs were grown in osteogenic induction medium (OM) plus 10% FBS, β-glycerophosphate (5 mM), and ascorbic acid (50 µg/ml) with/without BMP-2 (200 ng/ml). OM was supplemented with agomir-468-3p or antagomir-468-3p (200 nM of both) and changed every 2 d. Lipofectamine 2000 was used as a transfection reagent for siRNA oligos. SiRunx2 was transfected at 50 nM.
RT-PCR
We used TRIzol (Invitrogen) for cell/tissue total RNA extractions. A Nanodrop Spectrophotometer (ND-100) was used to determine RNA quality and concentrations (260/280 nm ratios). A primeScript RT reagent kit with gDNA eraser was used for reverse transcription (Takara Bio). We did quantitative RT-PCR with an ABI7500 system (Invitrogen) using SYBR Premix Ex Taq II (Takara Bio). Parameters were 95°C for 30 s, and then 40 cycles of 95°C for 5 s and 60°C for 30 s. Endogenous controls (GAPDH and U6) were used to assay and normalize relative gene and miRNA levels, and 2-ΔΔCt used to determine fold-change expression. Experiments were repeated in triplicate. The primer sequences are as follows: Runx2 forward, 5’- GCGCATTCCTCATCCCAGTA-3’ and reverse, 5’-AGTTCTGAAGCACCTGCCTG-3’; alkaline phosphatase (ALP) forward, 5’-TGACCTTCTCTCCTCCATCC-3’.
and reverse, 5’-CTTCCTGGGAGTCTCATCCT-3’; osteocalcin (OC) forward, 5’-TGCTTGTGACGAGCTATCAG-3’ and reverse, 5’-GAGGACAGGGAGGATCAAGT-3’; tartrate-resistant acid phosphatase (TRAP) forward, 5’-GGCCGGCCACTACCCCATCT-3’ and reverse, 5’-CACCGTAGCGACAAGCAGGACTCT-3’; GAPDH forward, 5’-GTGAAGCAGGCATCTGAGGG, and reverse, 5’-GCCGTATTCATTGTCATACCAGG-3’. We used a hairpin-it ™ miRNA qPCR quantitation kit (GenePharma, China) to assay miRNA levels by RT-PCR. Stem-loop miR-468-3p and U6 primers came from ABI.
Western blotting (WB)
Total proteins (from cell lines and bone tissues) were extracted in lysis buffer (Thermo Fisher Scientific, USA) and protein concentrations quantified by Bradford assay. We separated protein (50 µg) using 12% sodium dodecyl sulfate–polyacrylamide gel electrophoresis, transferred gels to polyvinylidene fluoride membranes (Millipore, USA), and blocked membranes in 5% nonfat dry milk in Tris Buffered Saline Tween-20 (Tris-HCl 20 mM/L, NaCl 150 mM/L, pH 7.5, and 0.1% Tween 20) at room temperature for 1 h. Membranes were incubated at 4 °C overnight with monoclonal antibodies against ALP (1:1000), Runx2 (1:1000), and GAPDH (1:1000), and then incubated for 2 h with peroxidase-conjugated anti-rabbit IgG serum (1:1000). Enhanced chemiluminescence (ECL) (Santa Cruz Biotechnology, USA) was used to visualize protein bands, which were detected using an ECL detection system (Thermo Scientific, USA). Relative protein levels were determined using GAPDH loading controls.
ALP and alizarin red (AR) staining
In 6-well plates, 1 × 10⁵ BMSCs/well were plated and cultured for 24 h, after which agomir-468-3p or antagomir-468-3p (200 µM each) were added. After 2 days, BMP-2 (5 ng/ml) was added and medium replaced every 3 days. After 1 week, cells were washed 3 × in PBS and fixed in paraformaldehyde (10%) at 25˚C for 10 min. BCIP/NBT buffer (300 µg/ml, Thermo, USA) was then added to stain cells (purple/blue = ALP-positive cultures) at room temperature for 20 min. To stain cells with AR, BMP-2 (5 ng/ml) was added to cells for 2 weeks, after which the stain (2% at pH 7.2) was added for 15 min (red/orange bodies = calcium nodules).
Bioinformatics
TargetScan and MicroRNA.org were used to predict binding miRNA sites targeting Runx2.
Luciferase assays
PCR sequences covering wild-type (WT) Runx2 3′ noncoding regions were inserted into pmiR-RB-REPORT™ plasmids (RiboBio) using XhoI and NotI sites. Mutant vectors were generated using the Site-directed Gene Mutagenesis kit (Beyotime Institute of Biotechnology) according to the manufacturer’s instructions. The CAGUCAU sequence, which complemented the miR-468-3p seed sequence (GUCAGUA), was changed to CAUUGCU.
For luciferase assays, BMSCs were co-transfected with WT or mutant plasmids (0.5 µg) and 20 pM (final concentration) agomir-468-3p or negative control(NC). After 2 days, dual luciferase reporter assays (Promega) were used to calculate luciferase levels. A Renilla luciferase plasmid served as an internal control. Experiments were performed in triplicate.
Mice
C57BL/6J mice (6 weeks old) were purchased from Beijing Vital River Laboratory Animal Technology Co., Ltd. Mice were housed in germ-free conditions at 22 °C, and maintained in a 12 h light/dark cycle in 50–55% humidity. The mice could get food scraps and running water whenever they wanted. All animal experiments were approved by the Committee of Experimental Animals of the School of Medicine and Pharmacy, Ocean University of China (OUCSMP-20240102).
Mice were randomly separated into 6 groups and received either bilateral OVX or a sham operation under general anesthesia by the dorsal approach. We injected antagomir-468-3p or antagomir-NC (80 mg/kg body weight) or an equivalent volume of PBS (0.2 ml) into the mice via tail vein in the first 3 days of the 1st and 4th weeks. Four days, 3 weeks, and 6 weeks after the last injection, miR-468-3p levels in bone were rechecked. Mice were humanely euthanized after 6 weeks and bloods collected via dorsal aortic puncture. Serum form blood was stored at -70 °C. Samples of bone were also taken. RiboBio Co. made Antigomir-468-3p and Antigomir-NC.
Histomorphometric analysis
To keep femurs in place, they were taken out and fixed in phosphate-buffered paraformaldehyde (4%) for 2 days. Specimens were then placed in 10% EDTA and left for 4 weeks. After decalcification, samples were dehydrated in ascending ethanol concentrations, xylol-cleared, and paraffin-embedded. Using a microtome, we collected serial 5 mm sections in diaphyses at distal and middle femur sections. After that, they were stained with H&E.
Micro-computed tomography (CT) analyses
For analyses, we used a Sky Scan 1076 CT scanner (Aartselaar, Antwerp, Belgium). Soft tissue was taken off and femora and tibiae dissected, fixed, and stored in alcohol. To examine trabecular (Tb) bone samples, X-rays (70 kV and 100 mA) were used, along with 18 mm pixels. 180° views were used to get a hundred projections. Next, modified Feldkamp algorithms and scanner software were used to reconstruct image slices. In 3-dimensional histomorphometric Tb bone analyses, cross-sectional distal femur images were used. Selected regions of interest included 5% of the femur length, from 0.1 mm below the growth plate. Tb bone volume/tissue volume (Tb.BV/TV), Tb number (Tb.N), Tb spacing (Tb.Sp), and Tb thickness (Tb.Th) data were collected.
Bone mineral density (BMD)
To determine BMD, left femurs were attached to a scanning table along a longitudinal axis, and dual-energy X-ray absorptiometry was used for whole femur scanning using a PIXImus densitometer (GE Lunar) [25].
Statistical analyses
GraphPad Prism 5.0 (GraphPad Software, Inc., USA) was used for all analyses. Data were presented as the mean ± standard error, and processed using two‑tailed Student t tests and ANOVA. P < 0.05 indicated statistical significance.
Results
miR-468-3p is negatively regulated during OD
From qRT-PCR, we first examined miR-468-3p expression in the left femur of mice following ovariectomy (OVX) or sham operations at 6 weeks of age and collected 6 months (OVX-6w and Sham-6w; 6 months of age) after surgery. Elevated miR-468-3p levels were identified in whole-bone tissues or osteoblasts (ALP+ cells) with low ALP and OC levels in OVX mice (Fig. 1B–E). We next examined miR-468-3p levels during OD in BMSCs. To differentiate BMSCs, the medium was replaced with α-MEM plus supplements and BMP-2 (200 ng/ml). We then examined several osteogenic factors (Runx2, ALP, and OC) as phenotypic OD markers. As shown (Fig. 1F), there was a remarkable increase in Runx2(1.02 ± 0.0037 Control vs. 7.47 ± 1.47 BMP-2, P < 0.05), ALP (1.00 ± 0.096 Control vs. 5.69 ± 1.18 BMP-2, P < 0.05) and OC (1.01 ± 0.11 Control vs. 6.86 ± 0.53 BMP-2, P < 0.05) mRNA in BMSCs following BMP-2 treatment, suggesting that OD was successfully induced. Also, during OD, miR-468-3p levels were remarkably reduced when compared with non-induced cells (1.01 ± 0.017 Control vs. 0.40 ± 0.010 BMP-2, P < 0.05) (Fig. 1G). Thus, miR-468-3p may have roles during OD.
miR-468-3p suppresses OD
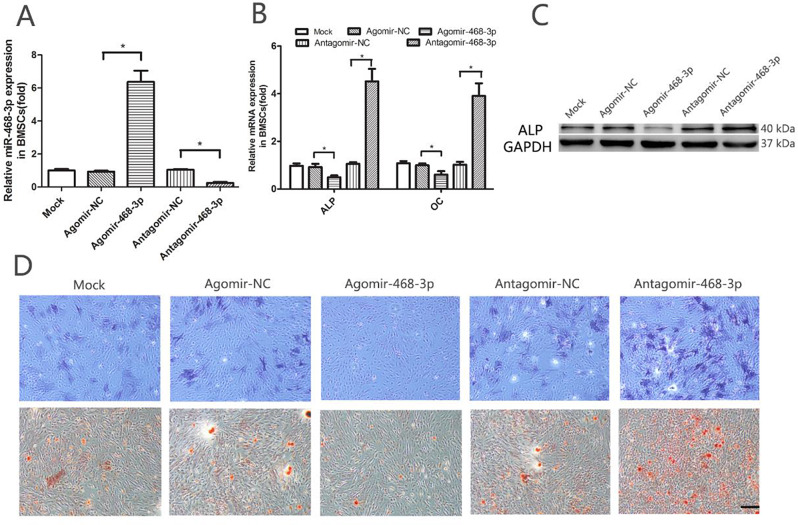
Using agomiR-468-3p and antagomiR-468-3p reagents, we assessed the impact of miR-468-3p on OD. BMSCs were treated with either agomiR-468-3p (miR-468-3p agonist) or antagomiR-468-3p (miR-468-3p inhibitor) (200 nM for both). Intracellular miR-468-3p levels were substantially upregulated by agomiR-468-3p treatment (0.93 ± 0.084 NC vs. 6.37 ± 0.97 AgomiR-468-3p, P < 0.05) and markedly downregulated by antagomiR-468-3p treatment (1.04 ± 0.070 NC vs. 0.24 ± 0.093 antagomiR-468-3p, P < 0.05) (Fig. 2A). We then detected ALP and OC expression (qRT-PCR) after agomiR-468-3p, antagomiR-468-3p, or corresponding control treatments for 2 days. mRNA expression of these OD markers were markedly decreased after treatment with agomiR-468-3p (ALP: 0.92 ± 0.19 NC vs. 0.49 ± 0.11 AgomiR-468-3p, P < 0.05; OC: 0.99 ± 0.11 NC vs. 0.57 ± 0.17 AgomiR-468-3p, P < 0.05). In contrast, BMSCs treated with antagomiR-468-3p showed increased OD mRNA marker levels when compared with controls (ALP: 1.05 ± 0.10 NC vs. 4.52 ± 0.74 AntagomiR-468-3p, P < 0.05; OC: 1.02 ± 0.17 NC vs. 3.90 ± 0.75 AntagomiR-468-3p, P < 0.05) (Fig. 2B). Also, ALP protein levels were considerably reduced following agomiR-468-3p treatment. BMSC treatment with antagomiR-468-3p showed increased ALP protein levels when compared with controls (Fig. 2C). At 7 d after induced differentiation, we observed significantly decreased ALP staining in agomiR-468-3p groups when compared with corresponding controls. In contrast, ALP staining was significantly increased in antagomiR-468-3p groups compared with corresponding controls (Fig. 2D upper). At the matrix mineralization level. we saw the same tendency in AR spots (ARS) (Fig. 2D lower) at 14 days. Based on these results, miR-468-3p may suppress OD.
Fig. 2.
miR-468-3p reduces osteogenic differentiation. (A) BMSCs were treated with agomiR-468-3p, antagomiR-468-3p or negative controls (200 nM) for 48 h, after which miR-468-3p mRNA levels were determined (RT-PCR). U6 = internal control. Agomir-NC, negative control agomir; antagomir-NC, negative control antagomir. (B) ALP and OC mRNA levels by RT-PCR. GAPDH = internal control. (C) ALP protein levels by western blotting (GAPDH = internal control). (D) ALP staining (upper panel) at 7 days and alizarin red staining (lower panel) at 14 days show ALP activity and calcification during osteogenic differentiation after agomiR-468-3p or antagomiR-468-3p treatments when compared with negative controls. Scale bar = 200 μm. Data are mean values ± SD. Studies were performed three times. *P < 0.05 compared with controls
miR-468-3p target Runx2
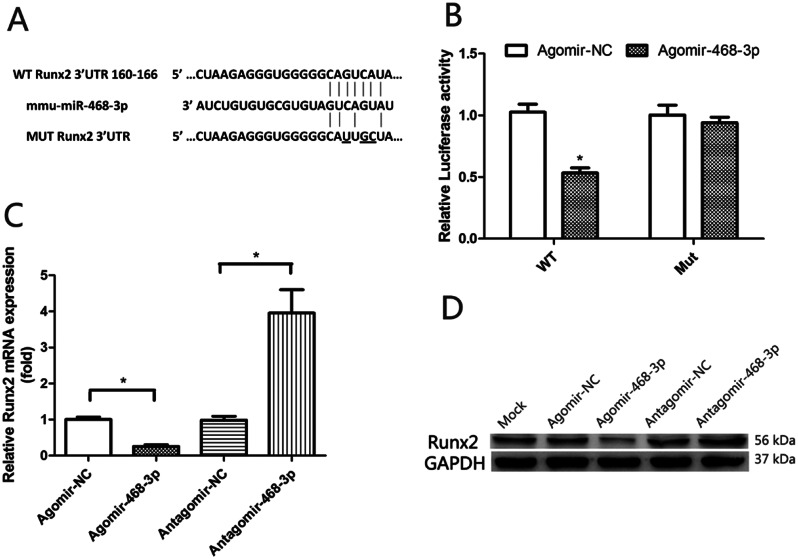
Bioinformatics packages (TargetScan 6.2 and microRNA.org) were used to evaluate possible miR-468-3p targets, from which Runx2 was identified (Fig. 3A) and luciferase activity assays performed to test for binding. BMSCs were treated with agomiR-468-3p or agomir-NC while transfecting WT Runx2 3’UTR luciferase or mutant plasmids (Mut). Transfection of WT in BMSCs treated with agomiR-468-3p showed significantly inhibited luciferase activity when compared with controls, while mut activity was unaltered (Fig. 3B). To test our hypothesis that miR-468-3p negatively controlled osteoblast differentiation via Runx2, we supplemented agomiR-468-3p, antagomiR-468-3p, and NCs into BMSCs. miR-468-3p overexpression significantly suppressed Runx2 mRNA (1.01 ± 0.090 NC vs. 0.26 ± 0.065 AgomiR-468-3p, P < 0.05) and protein levels, while miR-468-3p inhibition increased levels (0.99 ± 0.15 NC vs. 3.96 ± 0.91 AntagomiR-468-3p, P < 0.05) (Fig. 3C and D). Thus, miR-468-3p appeared to negatively regulate Runx2.
Fig. 3.
Runx2 is a direct miR-468-3p target. (A) Putative miR-468-3p binding sequences in the Runx2 3’UTR. Mutations (underlined) in regions correspond to seed sequences. (B) BMSCs co-transfected with Renilla luciferase reporter plasmids (wild-type (WT) and mutant (MUT) Runx2 3’UTR) and agomiR-468-3p were assayed for luciferase activity at 48 h after transfection. Empty Renilla luciferase plasmid = internal control. Data are mean values ± SD. Studies were performed in triplicate. *P < 0.05 compared to controls. (C) BMSCs were treated with agomiR-468-3p and antagomiR-468-3p. After 2 days, Runx2 mRNA levels were examined (qPCR). (D) Runx2 protein levels by western blotting
miR-468-3p suppresses OD via Runx2
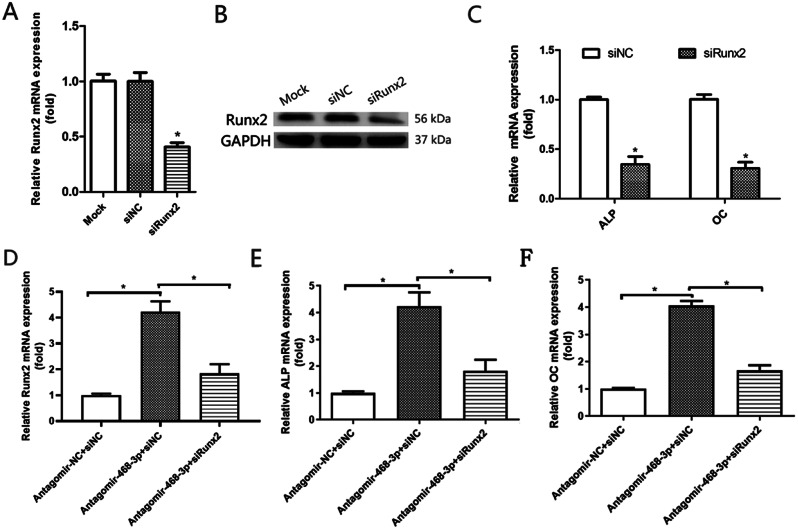
As miR-468-3p appeared to suppress OD and inhibit Runx2, we examined if miR-468-3p suppressed OD by targeting Runx2. Runx2 was inhibited by siRNA as shown by qRT-PCR (Fig. 4A) and WB (Fig. 4B). Also, there was a remarkable decrease in ALP (1.00 ± 0.036 NC vs. 0.35 ± 0.11 siRunx2, P < 0.05) and OC (1.00 + 0.069 NC vs. 0.31 ± 0.087 siRunx2, P < 0.05) mRNA in BMSCs following siRNA transfection (Fig. 4C). We next transfected siRunx2 into miR-468-3p-depleted BMSCs and observed that miR-468-3p inhibitory effects towards osteogenesis were significantly reversed by Runx2 RNA interference (RNAi) (Fig. 4D-F). Therefore, miR-468-3p appeared to inhibit Runx2, which suppressed OD in BMSCs.
Fig. 4.
miR-468-3p targets Runx2 and inhibits osteogenic differentiation. (A) BMSCs were supplemented with siRunx2 and a negative control and incubated for 2 days. Runx2 mRNA levels by qRT-PCR. (B) Runx2 protein levels by western blotting. (C) ALP and OC mRNA levels by qRT-PCR. (D-F) BMSCs were simultaneously supplemented with antagomiR-468-3p and transfected with siRunx2. At 2 days, Runx2, ALP and OC mRNA levels were assessed (qRT-PCR). GAPDH = internal control. Data are mean values ± SD. Studies were performed three times. *P < 0.05 compared with controls
miR-468-3p regulates in vivo BF
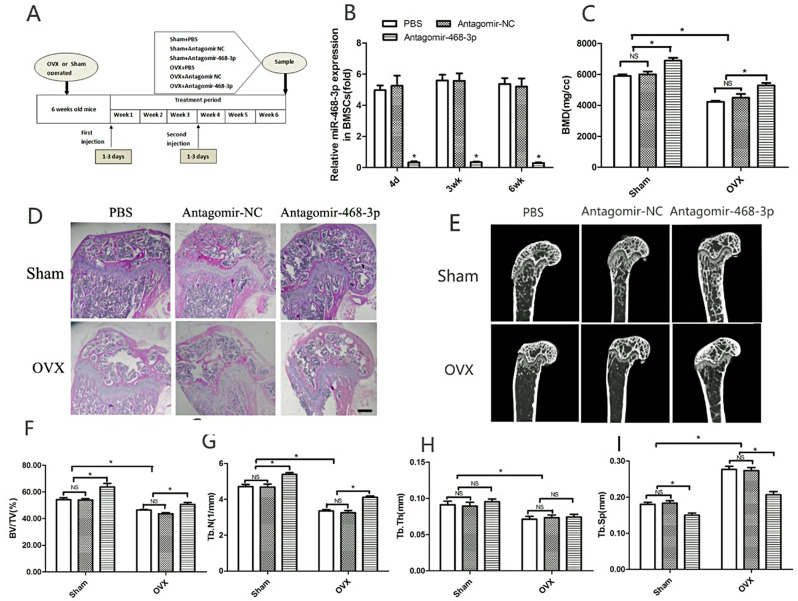
To find out what role miR-468-3p plays in vivo, mice were injected with an antisense oligonucleotide [26] that had been chemically modified to target miR-468-3p (antagomiR-468-3p) (80 mg/kg). Mice then underwent sham or OVX surgeries. Antagomir-NC (80 mg/kg) and PBS (0.2 ml) served as controls. The study plan is shown (Fig. 5A). When treated with antagomiR-468-3p for 3 days, mouse samples were taken, processed (qRT-PCR), and showed that bone miR-468-3p levels were suppressed for 3 weeks (Fig. 5B). In contrast, antagomir-NC or PBS had no effects on miR-468-3p levels (Fig. 5B). These data indicate that antagomiR-468-3p efficiently downregulates miR-468-3p expression in bone. Mice were injected with antagomiR-468-3p every day for 3 days in the 4th week after the first injection. This was done to keep the effects of miR-468-3p going. By the end of the 6th week after the first injections, animals were humanely euthanized.
Fig. 5.
miR-468-3p helps regulate in vivo bone formation. (A) Schematic showing the study outline. Mice received intravenous injections of PBS, antagomir-NC, and antagomiR-468-3p (80 mg/kg/d; three times in the 1st week, with another injection on days 1–3 of the 4th week), with bones harvested at day 4 and 3 and 6 weeks after initial injections. (B) miR-468-3p levels by RT-PCR. (C) miR-468-3p silencing decreased BMD levels. Representative H&E images (D) and micro-CT sections (E) showing distal and midfemoral diaphyses. (F–I) Structural parameters in femurs by micro-CT. Data are mean values ± SD, *P < 0.05. N = 6 mice/group. Scale bar = 500 μm
In sham groups, antagomiR-468-3p-treated mice showed elevated BMD when compared with controls (6003.22 ± 263.35 NC vs. 6894 ± 244.12 AntagomiR-468-3p, P < 0.05) (Fig. 5C). Also, femur BMD levels were downregulated in the control OVX group. OVX mice treated with antagomiR-468-3p had higher BMD levels than controls (4479.04 ± 321.06 NC vs. 5288.10 ± 227.71 AntagomiR-468-3p, P < 0.05) (Fig. 5C).
H&E staining indicated that OVX and sham mice injected with antagomiR-468-3p displayed increased BF (Fig. 5D). Micro-CT was used to determine different Tb ratios in Tb regions - distal and mid-femoral diaphyses images are shown (Fig. 5E). BV/TV and Tb.N levels were considerably upregulated in femurs from sham mice treated with antagomiR-468-3p, while Tb.Sp levels were distinctly downregulated (Fig. 5F, G, I). Also, OVX mice injected with antagomiR-468-3p had increased BV/TV and Tb.N levels and evident Tb.Sp decreases (Fig. 5F, G, I). Tb.Th was only decreased in OVX mice when compared with sham animals, with no differences between antagomiR-468-3p and antagomir-NC or PBS groups (Fig. 5H). Thus, miR-468-3p may regulate BM.
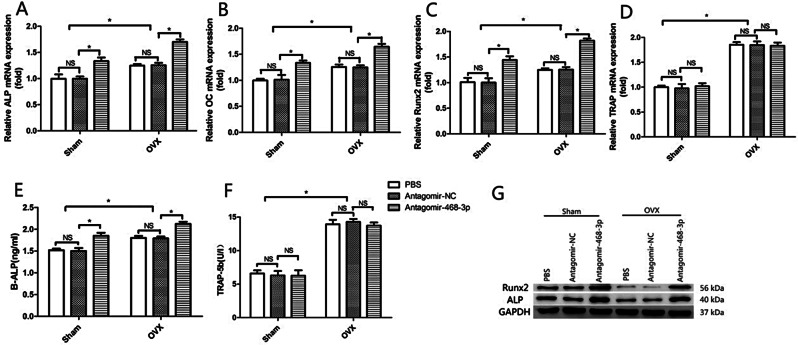
In bone tissue, antagomiR-468-3p treatment promoted osteoblast marker levels (ALP, OC, and Runx2). However, levels of tartrate-resistant acid phosphatase (TRAP), a protein with osteoclast activity, were unaffected (Fig. 6A–D). In antagomiR-468-3p-treated mice, serum ALP levels were elevated (Sham: 1.50 ± 0.090 NC vs. 1.85 ± 0.098 AntagomiR-468-3p, P < 0.05; OVX: 1.79 ± 0.059 NC vs. 2.12 ± 0.068 AntagomiR-468-3p, P < 0.05), but serum TRAP-5b levels were unchanged (Sham: 6.30 ± 0.93 NC vs. 6.27 ± 1.13 AntagomiR-468-3p, P > 0.05; OVX: 14.27 ± 0.63 NC vs. 13.73 ± 0.65 AntagomiR-468-3p, P > 0.05) (Fig. 6E and F). WB showed that mice treated with antagomiR-468-3p had more Runx2 and ALP proteins in their bone extracts (Fig. 6G). These results collectively suggest that getting rid of miR-468-3p could increase BM by promoting BF.
Fig. 6.
Murine osteoblast markers are modulated by miR-468-3p silencing. (A–D) Osteoblast and osteoclast marker levels in murine bone extracts (RT-PCR). (E, F) Serum ALP and TRAP5b levels. (G) Runx2 and ALP protein levels by western blotting (normalized to total protein levels). GAPDH = internal control. Data are mean values ± SD. *P < 0.05. N = 6 mice/group
Discussion
OP is a serious condition that weakens bones concomitant with ageing, and is a widely recognized major public health issue [27]. Typically, bone dynamics are balanced between osteoblastic BF and osteoclastic bone resorption [28]. While BMSC OD has key roles in bone development and homeostasis, OP occurs when this process is disrupted. So, investigating BMSC OD might help us understand OP and bone metabolism.
MiRNAs can post-transcriptionally regulate gene expression and are implicated in normal human biological and disease pathological processes [29]. miR-468-3p was released in the circulation in response to fatty meals, proposing it as potential novel therapeutic target of lipid metabolism [30]. Qiu found that Xiaoai Jiedu Recipe(XJP)could fight against hepatoma possibly by regulating expressions of multiple miRNAs including miR-468-3p. miR-468-3p may participate in the anti-tumor process [31]. Different miRNAs have been implicated in osteogenesis [32]. We determined that miR-468-3p was a negative regulator of BMSC OD and BF; miR-468-3p was downregulated during these processes. Also, miR-468-3p overexpression inhibited OD, whereas its inhibition enhanced osteogenic potential.
To mechanistically characterize how miR-468-3p regulated BMSC OD, we used bioinformatics (Targetscan and Microrna.org) to show that miR-468-3p partially complemented a site in the Runx2 3’ UTR. The transcription factor Runx2 is a member of the Runt-domain gene family and has key OD roles [33]. The protein induces osteoblast differentiation during bone development and elevates immature osteoblast levels, which form immature bone [34]. Homozygous Runx2 mutations in mice lead to a complete lack of membranous and endochondral ossification [35].
In this study, using luciferase assays, Runx2 was shown to be a direct miR-468-3p target. Also, miR-468-3p overexpression inhibited Runx2 protein levels, and suggested that Runx2 was a miR-468-3p target. In Runx2 siRNA experiments, the effects of inhibiting miR-468-3p in BMSC osteogenesis were significantly reversed by Runx2 RNAi. Thus, miR-468-3p negatively regulated OD by inhibiting Runx2.
Due to its inhibitory effects on in vitro osteoblastic differentiation, miR-468-3p may also have key roles in in vivo BF. In molecular biology, antagomirs can knock down endogenous miRNA levels [26]. We generated miR-468-3p-deficient mice via intravenous antagomiR-468-3p administration. We used OVX mice because they recapitulated the human estrogen-depleted skeleton and could be used to examine therapeutic agents [36]. Silenced miR-468-3p in OVX mice elevated bone mass in sham animals and showed an increase in bone mass gain. Silenced miR-468-3p in OVX animals also markedly improved Tb microarchitecture. Indeed, silenced miR-468-3p even enhanced Tb architecture effects in sham animals. ALP and OC proteins exert osteoblast activity and were elevated upon antagomiR-468-3p treatment. However, osteoclast markers failed to show any distinct alterations. In line with elevated BF in antagomiR-468-3p-treated mice, bone Runx2 levels were also elevated. Thus, miR-468-3p influenced BM by regulating BF, predominantly via Runx2.
Notably, this study has several limitations. Firstly, although we found that miR-468-3p inhibit BF in vivo, it is difficult to effectively provide targeted miR-468-3p overexpression in animals’ bone. Secondly, we did not validate the outcomes of this study clinically due to lack of clinical samples.
The miR-468-3p expression in clinical bone tissue need to be further validated. Thirdly, more target mRNAs of miR-468-3p remain unexplored. the bone formation-related genes regulated by miR-468-3p may not be limited to Runx2. The role of miR-468-3p in osteoporosis need to be further investigated.
In summary, we showed that miR-468-3p may inhibit BMSC OD by targeting Runx2 and inhibiting BF in vivo. These data highlight miRNA effects in osteoblast differentiation and BF, and may provide insights on new potential OP therapeutics.
Acknowledgements
Not applicable.
Author contributions
Q.F. and Q.W. developed the project. T.F. wrote the manuscript. T.F., X.C. and R.Z. performed all experiments. T.F. and F.S. analyzed the data. T.F. and Q.W. prepared the figures. All authors reviewed the manuscript.
Funding
This work is supported by grants from the National Natural Science Foundation of China (grant nos. 81370981).
Data availability
No datasets were generated or analysed during the current study.
Declarations
Ethics approval and consent to participate
The animal study was reviewed and approved by Committee of Experimental Animals of the School of Medicine and Pharmacy, Ocean University of China (OUCSMP-20240102).
Patient consent for publication
Not applicable.
Competing interests
The authors declare no competing interests.
Footnotes
Publisher’s note
Springer Nature remains neutral with regard to jurisdictional claims in published maps and institutional affiliations.
References
- 1.Ning K, Liu S, Yang B, Wang R, Man G, Wang DE, Xu H. Update on the effects of energy metabolism in bone marrow mesenchymal stem cells differentiation. Mol Metab. 2022;58:101450. [DOI] [PMC free article] [PubMed] [Google Scholar]
- 2.Harris K, Zagar CA, Lawrence KV. Osteoporosis: common questions and answers. Am Fam Physician. 2023;107(3):238–46. [PubMed] [Google Scholar]
- 3.Tokunaga A, Oya T, Ishii Y, Motomura H, Nakamura C, Ishizawa S, Fujimori T, Nabeshima Y, Umezawa A, Kanamori M, et al. PDGF receptor beta is a potent regulator of mesenchymal stromal cell function. J Bone Miner Res. 2008;23(9):1519–28. [DOI] [PubMed] [Google Scholar]
- 4.Bal ZA-O, Kushioka JA-O, Kodama JA-O, Kaito TA-O, Yoshikawa HA-O, Korkusuz PA-O, Korkusuz FA-O. BMP and TGFβ use and release in bone regeneration. Turk J Med Sci. 2020;50(SI–2):1707–22. [DOI] [PMC free article] [PubMed] [Google Scholar]
- 5.Liao J, Huang Y, Wang Q, Chen S, Zhang C, Wang D, Lv Z, Zhang X, Wu M, Chen GA-OX. Gene regulatory network from cranial neural crest cells to osteoblast differentiation and calvarial bone development. Cell Mol Life Sci. 2022;79(3):158. [DOI] [PMC free article] [PubMed] [Google Scholar]
- 6.Marie PJ. Transcription factors controlling osteoblastogenesis. Arch Biochem Biophys. 2008;473(2):98–105. [DOI] [PubMed] [Google Scholar]
- 7.Komori T. Regulation of proliferation, differentiation and functions of osteoblasts by Runx2. Int J Mol Sci. 2019;20(7):1694. [DOI] [PMC free article] [PubMed] [Google Scholar]
- 8.Ke Y, Zhao W, Xiong J, Cao R. miR-149 Inhibits Non-Small-Cell Lung Cancer Cells EMT by Targeting FOXM1. Biochemistry research international. 2013; 2013:506731–506731. [DOI] [PMC free article] [PubMed]
- 9.Vishnoi A, Rani S. miRNA Biogenesis and Regulation of diseases: an updated overview. Methods Mol Biol. 2023;2595:1–12. [DOI] [PubMed] [Google Scholar]
- 10.Yang G, Wu D, Zhu J, Jiang O, Shi Q, Tian J, Weng Y. Upregulation of miR-195 increases the sensitivity of breast cancer cells to Adriamycin treatment through inhibition of Raf-1. Oncol Rep. 2013;30(2):877–89. [DOI] [PubMed] [Google Scholar]
- 11.Philippe S, Delay MA-O, Macian NA-O, Morel V, Pickering ME. Common miRNAs of osteoporosis and Fibromyalgia: a review. Int J Mol Sci. 2023;24(17):13513. [DOI] [PMC free article] [PubMed] [Google Scholar]
- 12.De Martinis MA-O, Ginaldi L, Allegra AA-O, Sirufo MM, Pioggia GA-O, Tonacci AA-O, Gangemi S. The Osteoporosis/Microbiota linkage: the role of miRNA. Int J Mol Sci. 2020;21(23):8887. [DOI] [PMC free article] [PubMed] [Google Scholar]
- 13.Al-Rawaf HA, Gabr SA, Iqbal A, Alghadir AH. MicroRNAs as potential biopredictors for premenopausal osteoporosis: a biochemical and molecular study. BMC Womens Health. 2023;23(1):481. [DOI] [PMC free article] [PubMed] [Google Scholar]
- 14.Gargano G, Asparago G, Spiezia F, Oliva F, Maffulli N. Small interfering RNAs in the management of human osteoporosis. Br Med Bull. 2023;148(1):58–69. [DOI] [PMC free article] [PubMed] [Google Scholar]
- 15.Gargano G, Oliva F, Oliviero A, Maffulli N. Small interfering RNAs in the management of human rheumatoid arthritis. Br Med Bull. 2022;142(1):34–43. [DOI] [PMC free article] [PubMed] [Google Scholar]
- 16.Gargano G, Oliviero A, Oliva F, Maffulli N. Small interfering RNAs in tendon homeostasis. Br Med Bull. 2021;138(1):58–67. [DOI] [PubMed] [Google Scholar]
- 17.Oliviero A, Della Porta G, Peretti GM, Maffulli N. MicroRNA in osteoarthritis: physiopathology, diagnosis and therapeutic challenge. Br Med Bull. 2019;130(1):137–47. [DOI] [PubMed] [Google Scholar]
- 18.Giordano L, Porta GD, Peretti GM, Maffulli N. Therapeutic potential of microRNA in tendon injuries. Br Med Bull. 2020;133(1):79–94. [DOI] [PubMed] [Google Scholar]
- 19.Chen R, Qiu H, Tong Y, Liao F, Hu X, Qiu Y, Liao Y. MiRNA-19a-3p alleviates the progression of osteoporosis by targeting HDAC4 to promote the osteogenic differentiation of hMSCs. Biochem Biophys Res Commun. 2019;516(3):666–72. [DOI] [PubMed] [Google Scholar]
- 20.Hu L, Xie X, Xue H, Wang T, Panayi AC, Lin Z, Xiong Y, Cao F, Yan C, Chen L, et al. MiR-1224-5p modulates osteogenesis by coordinating osteoblast/osteoclast differentiation via the Rap1 signaling target ADCY2. Exp Mol Med. 2022;54(7):961–72. [DOI] [PMC free article] [PubMed] [Google Scholar]
- 21.Yin Z, Shen J, Wang Q, Wen L, Qu W, Zhang Y. Mir-215-5p regulates osteoporosis development and osteogenic differentiation by targeting XIAP. BMC Musculoskelet Disord. 2022;23(1):789. [DOI] [PMC free article] [PubMed] [Google Scholar]
- 22.Alrashed MM, Alshehry AS, Ahmad M, He J, Wang Y, Xu YA-O. miRNA Let-7a-5p targets RNA KCNQ1OT1 and participates in osteoblast differentiation to improve the development of osteoporosis. Biochem Genet. 2022;60(1):370–81. [DOI] [PubMed] [Google Scholar]
- 23.Kureel J, Dixit M, Tyagi AM, Mansoori MN, Srivastava K, Raghuvanshi A, Maurya R, Trivedi R, Goel A, Singh D. Mir-542-3p suppresses osteoblast cell proliferation and differentiation, targets BMP-7 signaling and inhibits bone formation. Cell Death Dis. 2014; 5. [DOI] [PMC free article] [PubMed]
- 24.Soleimani M, Nadri S. A protocol for isolation and culture of mesenchymal stem cells from mouse bone marrow. Nat Protoc. 2009;4(1):102–6. [DOI] [PubMed] [Google Scholar]
- 25.Mazess RB, Nord RH, Hanson JA, Barden HS. Bilateral measurement of femoral bone mineral density. J Clin Densitometry. 2000;3(2):133–40. [DOI] [PubMed] [Google Scholar]
- 26.Krutzfeldt J, Rajewsky N, Braich R, Rajeev KG, Tuschl T, Manoharan M, Stoffel M. Silencing of microRNAs in vivo with ‘antagomirs’. Nature. 2005;438(7068):685–9. [DOI] [PubMed] [Google Scholar]
- 27.Gopinath V. Osteoporosis. Med Clin North Am. 2023;107(2):213–25. [DOI] [PubMed] [Google Scholar]
- 28.Compston J. Osteoporosis: Social and Economic Impact. Radiol Clin North Am. 2010;48(3):477–. [DOI] [PubMed] [Google Scholar]
- 29.Lamouille S, Subramanyam D, Blelloch R, Derynck R. Regulation of epithelial-mesenchymal and mesenchymal-epithelial transitions by microRNAs. Curr Opin Cell Biol. 2013;25(2):200–7. [DOI] [PMC free article] [PubMed] [Google Scholar]
- 30.Mantilla-Escalante DC, López de Las Hazas MC, Gil-Zamorano J, Del Pozo-Acebo L, Crespo MC, Martín-Hernández R, Del Saz A, Tomé-Carneiro J, Cardona F, Cornejo-Pareja I, García-Ruiz A, Briand O, Lasunción MA, Visioli F, Dávalos A. Postprandial circulating miRNAs in response to a Dietary Fat Challenge. Nutrients. 2019;11(6):1326. [DOI] [PMC free article] [PubMed] [Google Scholar]
- 31.Qiu WI, Chen HB, Jiang ZQ, Zhou HG. Effect of Xiaoai Jiedu Recipe on mIRNA expression profiles in H₂₂ tumor-bearing mice. Zhongguo Zhong Xi Yi Jie He Za Zhi. 2016;36(9):1112–8. Chinese. [PubMed] [Google Scholar]
- 32.Iaquinta MR, Lanzillotti C, Mazziotta C, Bononi I, Frontini F, Mazzoni E, Oton-Gonzalez L, Rotondo JC, Torreggiani E, Tognon M, et al. The role of microRNAs in the osteogenic and chondrogenic differentiation of mesenchymal stem cells and bone pathologies. Theranostics. 2021;11(13):6573–91. [DOI] [PMC free article] [PubMed] [Google Scholar]
- 33.Komori T. Molecular mechanism of Runx2-Dependent bone development. Mol Cells. 2020;43(2):168–75. [DOI] [PMC free article] [PubMed] [Google Scholar]
- 34.Komori T. Regulation of bone development and extracellular matrix protein genes by RUNX2. Cell Tissue Res. 2010;339(1):189–95. [DOI] [PubMed] [Google Scholar]
- 35.Komori T, Yagi H, Nomura S, Yamaguchi A, Sasaki K, Deguchi K, Shimizu Y, Bronson RT, Gao YH, Inada M, et al. Targeted disruption of Cbfa1 results in a complete lack of bone formation owing to maturational arrest of osteoblasts. Cell. 1997;89(5):755–64. [DOI] [PubMed] [Google Scholar]
- 36.Jee WSS, Yao W. Animal models of osteopenia and osteoporosis. J Musculoskel Neuronal Interact. 2001;1(3):193–207. [PubMed] [Google Scholar]
Associated Data
This section collects any data citations, data availability statements, or supplementary materials included in this article.
Data Availability Statement
No datasets were generated or analysed during the current study.


