

Abstract
Background:
The overall landscape of health-related quality of life (HRQoL) has not been thoroughly investigated in adolescent and young adult (AYA) cancer patients. Data are also lacking on how well HRQoL at time of cancer diagnosis can prognosticate long-term survival in AYA survivors.
Methods:
We included 3,497 survivors of AYA cancer (age 15–39 years at diagnosis) who completed the SF12 HRQoL questionnaire at diagnosis. Physical component summary (PCS) and mental component summary (MCS) scores were generated with scores <50 representing poor HRQoL. Differences in HRQoL by patient characteristics and tumor type were investigated using violin plots and t-tests/analysis-of-variance. The effect of HRQoL on overall survival was assessed using Kaplan-Meier plots and Cox proportional hazards models.
Results:
Overall mean PCS and MCS scores in this racially/ethnically diverse cohort (64% White, 19% Hispanic, 10% Black, and 7% other patients) were 43.6 and 46.7, respectively. Women with breast cancer reported the most favorable PCS (51.5), and those with cervical cancer reported the lowest MCS (42.8). Age at diagnosis was associated positively with PCS (p<0.001) and inversely with MCS (p<0.001). Females had higher PCS, yet lower MCS than males (both p<0.001). Minoritized populations reported lower PCS than White patients (p≤0.001). Physical and mental HRQoL were prognostic and associated with increased risk of poor survival (HR:1.95, 95% CI:1.73–2.21; HR:1.26, 95% CI:1.13–1.40; respectively).
Conclusions:
Physical and mental HRQoL at diagnosis vary across patient characteristics in AYA cancer survivors. Poor HRQoL at diagnosis may be a prognosticator of diminished overall survival among AYA cancer survivors.
INTRODUCTION
In the US, approximately 87,000 adolescents and young adults (AYAs, age 15–39 years) are diagnosed with cancer each year.[1] The spectrum of cancers diagnosed in this age group is unique compared to the younger and older populations, with some cancer types, such as Hodgkin’s lymphoma (HL) and osteosarcoma, displaying distinct incidence peaks in this age group.[2] Although world-wide, cancer is the most common disease-related cause of death for AYAs,[3, 4] the overall 5-year survival rate for AYA cancer patients has increased in recent decades to over 85%,[1] creating a large and growing cancer survivorship population. Despite this, AYA cancer patients and survivors remain an understudied and underserved population.
Patient-reported outcomes (PROs) are being strongly recommended by regulatory agencies as a superior method to capture patient experience metrics directly from the patient without the need for potentially biased, subjective interpretation.[5, 6] There is also increasing appreciation for their value within the AYA cancer patient population.[7] Health-related quality of life (HRQoL) is a specific, multidimensional type of PRO which includes the patient’s perception of the impact of their disease on their daily life, and on their physical, mental and social well-being. Previous studies have shown that both physical and psychosocial components of HRQoL are poorer in AYAs with cancer compared to their healthy peers,[8, 9] due to the impact of a cancer diagnosis and treatment on physical functioning;[8] development of self-identity, autonomy, body image, and sexuality;[10] ability to form social relationships, worry regarding potential negative effects on education and employment;[11] and financial well-being.[12] Furthermore, increased psychological distress has been noted in AYAs at the time of initial cancer diagnosis[13] and the need to assess HRQoL in AYA cancer patients and survivors with long-term follow-up has been highlighted.[14] The overall landscape of HRQoL in this underserved patient population with regard to age at initial cancer diagnosis, gender, race/ethnicity, and tumor type has not been thoroughly investigated. Furthermore, physical and psychosocial HRQoL measures have been shown to predict overall survival in adult patients.[15–18] Patient-reported HRQoL is also a significant prognostic factor within the clinical trial setting for adult cancers,[19] suggesting that HRQoL may be of value in the AYA cancer population. However, data are lacking on how well HRQoL at time of cancer diagnosis can prognosticate long-term survival in AYA cancers.
Our goal was to characterize HRQoL at diagnosis among AYA with cancer, identify the impact of tumor type, age at diagnosis, gender, and race/ethnicity on HRQoL, and determine the impact of HRQoL on overall survival. This study utilized a large cohort of AYA cancer patients who completed the SF-12 PRO within 6 months of diagnosis. The SF-12 is a validated and effective general health PRO measure that is not disease or health-status specific, consisting of 12 items derived from the longer SF-36 questionnaire.[20, 21] The SF-12 has been used in multiple studies in patients with cancer[22] and measures eight domains of general HRQoL.
MATERIALS AND METHODS
AYA cancer survivor population
The AYA cancer survivor population was generated from a retrospective search of the MD Anderson Cancer Center’s Tumor Registry for those who were evaluated at the institution between 2000 and 2016 and diagnosed with a primary cancer during the AYA age range (15–39 years). As part of routine hospital registration practice for all patients evaluated at MD Anderson between 1999 and 2017, these AYA cancer patients completed a patient health intake questionnaire that included assessment of HRQoL using the validated Short-Form (SF-12)v1 questionnaire.[20] The population was restricted to those who completed the full questionnaire to enable calculation of the SF-12v1 summary scores within six months of cancer diagnosis. A total of 7,030 AYA cancer patients were identified. Patients who did not complete the full questionnaire to enable calculation of the SF-12 summary scores (N=2,098) and those completing the questionnaire more than six months after cancer diagnosis (N=1,435) were removed from the analysis generating the final population of 3,497 AYA cancer patients. The median time from diagnosis to questionnaire completion was 1.1 months (IQR:1.0 month). Nearly 80% of the population completed the questionnaire within 2 months of diagnosis (N=2,771). Data abstracted from the Tumor Registry included cancer diagnosis, date of diagnosis, date of birth, race/ethnicity, gender, vital status, and date of last follow-up. Patients with Asian, Pacific Islander/Native Hawaiian, Amerindian/Alaska Native, or unknown race/ethnicity classification were grouped as “other”. Written informed consent was provided by all participants and the study was approved by MD Anderson’s Institutional Review Board.
SF-12 HRQoL questionnaire and scoring
The SF-12v1 questionnaire consists of twelve items that generate two composite summary scores, the physical component summary (PCS) and mental component summary (MCS).[20] Scoring for the pain interference question of the SF-12 was slightly modified in the questionnaire with responses on a 0–10 scale instead of the SF-12 reported 0–5 scale. Therefore, the scores were adjusted to match the SF-12 scoring range. A norm-based scoring system was used in which the MCS and PCS scores were normalized to a mean score of 50 (SD=10) based on SF-12 data obtained from the US general population. Higher PCS and MCS scores represent better HRQoL. Additionally, a high MCS or PCS (≥50) is indicative of a better HRQoL compared to the general population, while a low MCS or PCS (<50) is indicative of a poor HRQoL compared to the general population. The recall period was four weeks.
Statistical methods
Violin plots were used to visualize the distribution and probability density of PCS and MCS scores by tumor type, age at diagnosis, gender, and race/ethnicity. Differences in mean MCS and PCS scores by these characteristics were assessed using independent samples t-tests or analysis-of-variance (ANOVA) for binomial or multinomial independent variables, respectively. Survival was defined as date of diagnosis to date of death or last follow up, with ascertainment of follow-up through 2022. Survival estimates were calculated by Kaplan-Meier method with corresponding log-rank p-values. An overall multivariable Cox proportional hazards model was created to identify independent risk factors associated with overall survival and included PCS, MCS, gender, race/ethnicity, age at diagnosis, tumor type, and year of diagnosis.
RESULTS
Study population
A total of 3,497 AYA cancer patients were included in the analysis (Table 1). The distribution of patient variables for those included in the analysis compared to those excluded (N=3,533) were comparable, with only slight increases in White patients and those with more favorable diagnoses (breast cancer and Hodgkin lymphoma, for example) in the final patient population compared to those who were removed during the selection process. The median age at diagnosis across the AYA age range was 32 years (IQR:10). Breast cancer was the most frequent diagnosis (20.4%), followed by sarcoma (12.8%) and leukemia (10.5%). Our patient population was diverse, including 35.7% of participants who self-identified as Black, Hispanic, or other. The median follow-up time was 9.2 years (IQR:11.7 years) with 1,402 deaths recorded during this period.
Table 1.
Baseline Characteristics
| N | % | PCS Mean (SD) | P value | MCS Mean (SD) | P value | |
|---|---|---|---|---|---|---|
| TOTAL | 3,497 | 43.6 (11.9) | 46.7 (10.7) | |||
| Tumor Type | ||||||
| Breast | 712 | 20 | 50.8 (9.3) | <0.001 | 46.3 (10.4) | <0.001 |
| Sarcoma | 448 | 13 | 39.7 (12.1) | 48.3 (10.8) | ||
| Leukemia | 366 | 11 | 41.7 (10.7) | 47.4 (10.2) | ||
| Hodgkin’s Lymphoma | 287 | 8.2 | 45.1 (11.1) | 48.0 (10.3) | ||
| Non-Hodgkin’s Lymphoma | 284 | 8.1 | 42.3 (12.2) | 46.4 (10.7) | ||
| Germ Cell Tumor | 226 | 6.5 | 44.0 (10.9) | 47.7 (10.1) | ||
| Colorectal | 215 | 6.2 | 41.0 (12.1) | 46.0 (11.2) | ||
| Central Nervous System | 128 | 3.7 | 43.9 (10.2) | 46.9 (10.9) | ||
| Cervical | 120 | 3.4 | 42.3 (13.2) | 42.8 (11.6) | ||
| Other | 711 | 20 | 40.7 (11.9) | 45.9 (11.2) | ||
| Age at diagnosis | ||||||
| Adolescent (15–18 years) | 205 | 5.9 | 42.0 (11.4) | <0.001 | 49.4 (11.1) | <0.001 |
| Emerging Adult (19–25 years) | 629 | 18 | 42.1 (12.1) | 48.1 (10.6) | ||
| Young Adult (26–39 years) | 2,663 | 76 | 44.1 (11.8) | 46.2 (10.7) | ||
| Gender | ||||||
| Female | 2,006 | 57 | 44.5 (11.9) | <0.001 | 45.6 (10.7) | <0.001 |
| Male | 1,491 | 43 | 42.5 (11.7) | 48.2 (10.6) | ||
| Race/ Ethnicity | ||||||
| White | 2,248 | 64 | 44.1 (11.9) | <0.001 | 46.7 (10.7) | 0.26 |
| Hispanic | 657 | 19 | 43.2 (11.8) | 46.1 (11.0) | ||
| Black | 345 | 9.9 | 41.2 (11.9) | 47.4 (11.0) | ||
| Other | 247 | 7.1 | 43.9 (11.4) | 47.0 (10.2) |
PCS and MCS score distribution and overall survival
The distributions of PCS and MCS scores and impact on overall survival are shown in Figure 1. PCS scores in the overall cohort ranged from 11.3 to 70 with a mean of 43.6 (SD:11.9; Figure 1A). The mean MCS score was slightly higher at 46.7 (SD:10.7, range:10–69; Figure 1C). AYA cancer survivors with poor PCS (<50) at time of cancer diagnosis had lower overall survival durations than their counterparts with PCS ≥50 (log-rank p<0.001) resulting in a >20% reduction in the 5-year survival rate from 78.9% to 56.0% (Figure 1B). Poor PCS was associated with increased risk of death (HR:1.95, 95% CI:1.72–2.21, p<0.001). Poor MCS (<50) at diagnosis compared with MCS ≥50 was associated with decreased survival (log-rank p<0.001) (Figure 1D) and increased risk of death (HR:1.26, 95% CI:1.13–1.40, p<0.001).
Figure 1: PCS and MCS scores at diagnosis and overall survival in AYA cancer patients.

A) Distribution of PCS scores; B) Survival curves stratified by PCS +/− 50; C) Distribution of MCS scores; D) Survival curves stratified by MCS +/−50. Solid line – PCS/MCS ≥50, dotted line – PCS/MCS <50.
PCS and MCS by tumor type
Mean PCS (p<0.001) and MCS (p<0.001) scores varied by tumor type (Table 1). Patients with breast cancer reported the most favorable PCS (50.8) at diagnosis, yet among the lowest MCS (46.3). The distributions of PCS and MCS scores were unique for each tumor type (Supplemental Figure 1A). Apart from breast cancer, all tumor types had median PCS scores below 50 and the proportions of PCS scores below 40 were pronounced for cervical cancer, colorectal cancer, leukemia, and sarcoma. Combined, patients with solid tumors had more favorable PCS compared to those diagnosed with heme malignancies (p<0.001). There was less variation in MCS by tumor type compared to PCS scores. The distributions of MCS scores tended to be more unimodal across all ten tumor types analyzed with only cervical cancer patients reporting a mean MCS score of less than 45 (Table 1).
Overall survival by tumor type is shown in Figure 2A. Patients diagnosed with CNS tumors, colorectal cancer, leukemia, sarcoma, and the other tumors group had 5-year survival rates below 60%. When stratified by tumor type, poor PCS at diagnosis was associated with inferior survival for patients with breast cancer, CNS tumors, colorectal cancer, HL, leukemia, sarcoma, and other tumors (Figure 2B). Poor MCS was associated with lower survival in patients with HL (log-rank p=0.0093), germ cell tumors (log-rank p=0.038), and other tumor types (log-rank p=0.002; Figure 2C).
Figure 2: PCS and MCS scores and overall survival in AYA cancer patients by tumor type.

A) Overall survival by tumor type; B) Survival curves stratified by PCS +/−50; C) Survival curves stratified by MCS +/−50. Solid line – PCS/MCS ≥50, dotted line – PCS/MCS <50.
PCS and MCS by race/ethnicity
Minoritized AYA cancer patients had significantly worse PCS than White AYA cancer patients (p=0.0023). Black AYA cancer patients reported the lowest PCS at diagnosis with 67.8% reporting PCS<50 compared to 60.9% of Hispanic and 58.0% of White patients. No significant differences were observed for MCS by race/ethnicity (Table 1) and the distributions were similar across groups (Supplemental Figure 1B).
Black patients had a 5-year survival rate of 53.2% that was nearly 10% lower than White and Hispanic patients (64% for each; Figure 3A). Survival differed by race/ethnicity (log-rank p<0.001). When stratified by race/ethnicity, a significant reduction in lower survival by poor PCS was observed for Black (log-rank p=0.0026), Hispanic (log-rank p<0.001), White (log-rank p<0.001), and other race/ethnicity (log-rank p=0.0021) AYA cancer patients (Figure 4B). MCS did not differ by race/ethnicity (p=0.26; Table 1), yet the effect of poor MCS on shorter survival was observed in the Hispanic (log-rank p=0.024) and White (log-rank p=0.0019) AYA cancer patient populations (Figure 3C).
Figure 3: PCS and MCS scores and overall survival in AYA cancer patients by race/ethnicity.
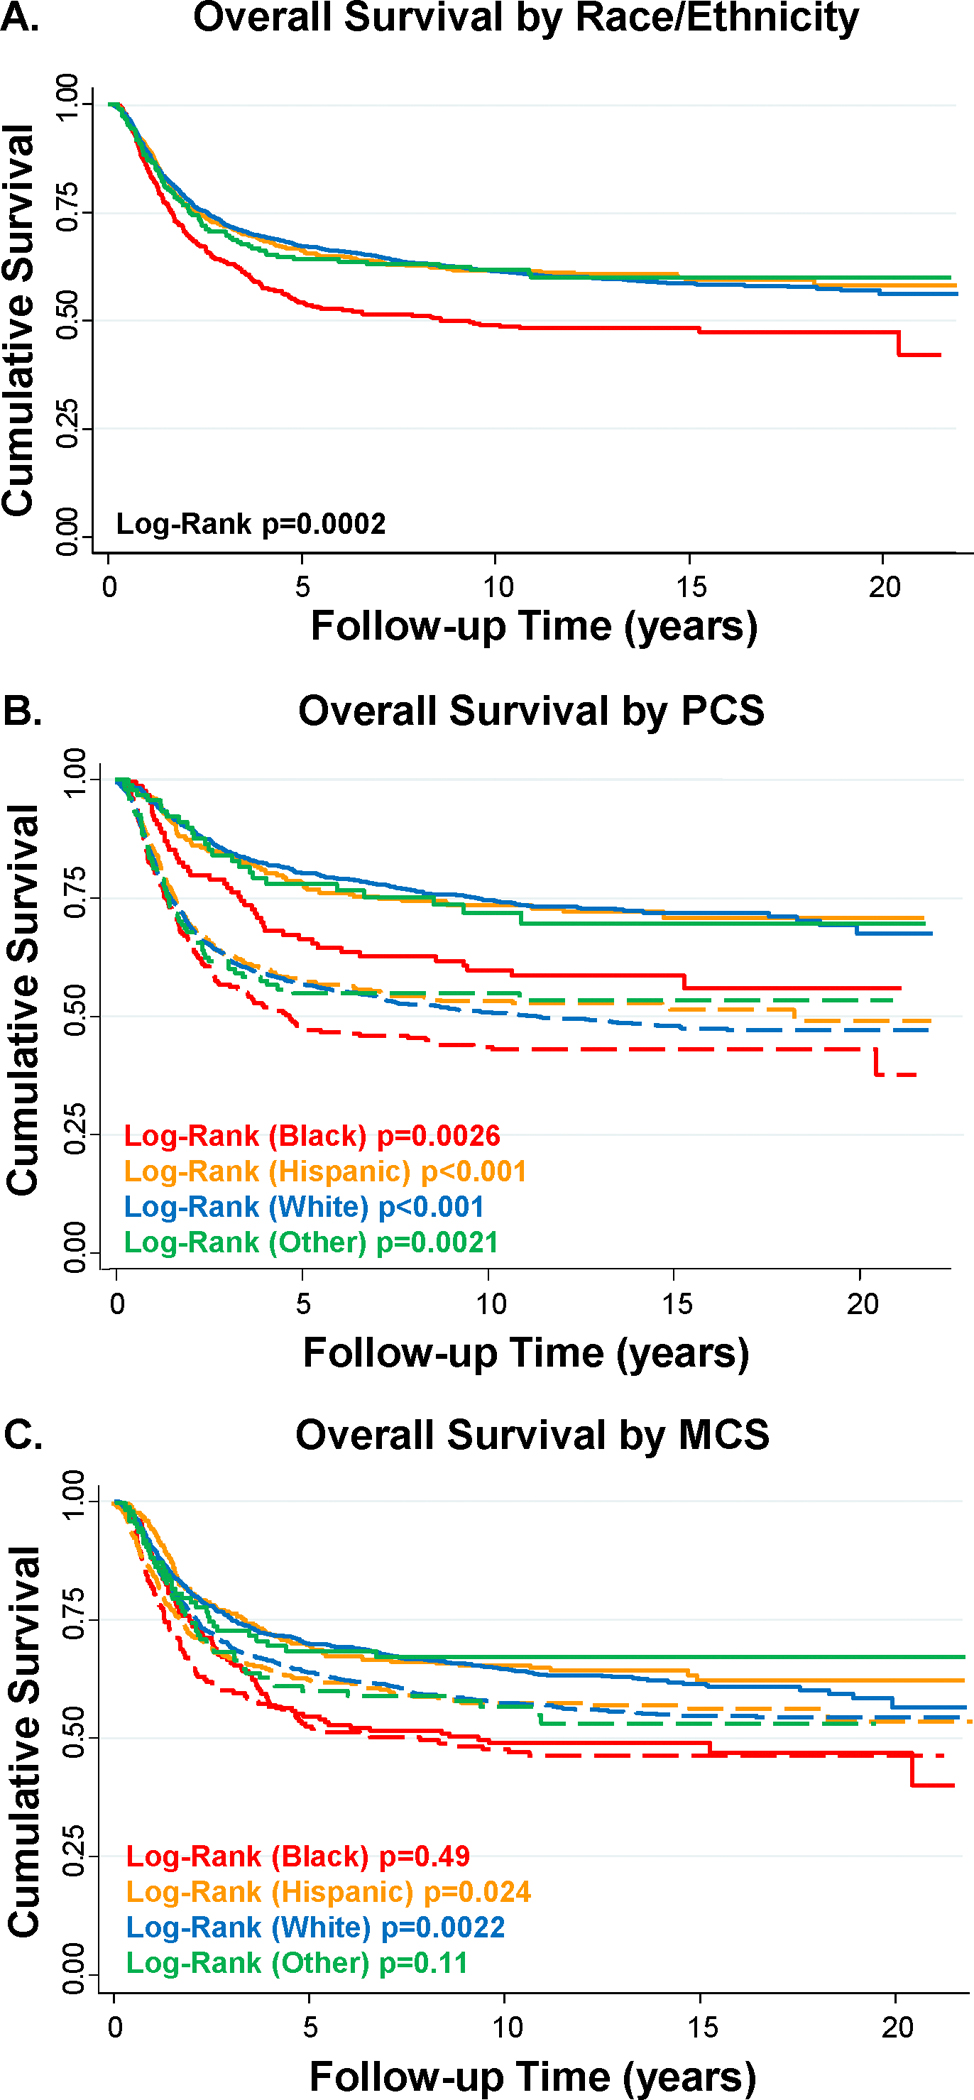
A) Overall survival by race/ethnicity; B) Survival curves stratified by PCS +/−50; C) Survival curves stratified by MCS +/−50. Solid line – PCS/MCS ≥50, dotted line – PCS/MCS <50.
PCS and MCS by age at diagnosis
Older age at diagnosis was associated with a higher mean PCS; however, a lower mean MCS (p<0.001 for each; Table 1). The distribution of PCS and MCS scores stratified by diagnosis age categories show similar features (Supplemental Figure 1C) – a greater proportion of poor PCS scores was observed for adolescent (15–18 years old) patients and lower MCS scores for young adult (26–39 years old) patients. Survival also differed by age category with adolescents having a higher 5-year survival rate compared to both emerging adults (19–25 years old) and young adults (Supplemental Figure 2A). When stratified by age categories, PCS was a significant prognostic feature for all three age categories (Supplemental Figure 2B), yet MCS was prognostic only for emerging adults (Supplemental Figure 2C).
PCS and MCS by gender
Female AYA survivors had significantly higher PCS, yet lower MCS compared to male AYA patients (both p<0.001; Table 1, Supplemental Figure 1D). Males had an increased risk of death compared to females (log-rank p=0.0031; Supplemental Figure 3A). The negative effect of poor PCS on survival was evident in both male and female AYA survivors (both log-rank p<0.0001; Figure 3B). MCS was also associated with survival in males (log-rank p<0.0006) and females (log-rank p=0.0051; Figure 3C).
HRQoL as a predictor of overall survival
Low PCS (HR:1.92, 95% CI:1.69–2.17, p<0.001) and low MCS (HR:1.19, 95% CI:1.06–1.32, p<0.001) at diagnosis were independent predictors of diminished overall survival in multivariable Cox proportional hazards regression model that included gender, diagnosis age, race/ethnicity, tumor type, and year of diagnosis (Table 2).
Table 2.
Multivariable Cox Proportional Hazards Model for Overall Survival
| Variable | HR (95% CI) | P value |
|---|---|---|
| PCS (reference: PCS ≥ 50) | ||
| PCS < 50 | 1.91 (1.69–2.17) | <0.001 |
| MCS (reference: MCS ≥ 50) | ||
| MCS < 50 | 1.18 (1.06–1.32) | 0.002 |
| Gender (reference: Female) | ||
| Male | 1.17 (1.04–1.32) | 0.01 |
| Age at Diagnosis (reference: Adolescent) | ||
| Emerging Adult | 1.48 (1.11–1.97) | 0.007 |
| Young Adult | 1.48 (1.13–1.93) | 0.005 |
| Race/Ethnicity (reference: White) | ||
| Black | 1.33 (1.13–1.57) | 0.001 |
| Hispanic | 1.09 (0.94–1.25) | 0.24 |
| Other race/ethnicity | 1.01 (0.81–1.26) | 0.94 |
| Tumor Type (reference: Breast) | ||
| Cervical | 1.08 (0.77–1.51) | 0.66 |
| CNS | 1.96 (1.47–2.61) | <0.001 |
| CRC | 1.91 (1.51–2.43) | <0.001 |
| GCT | 0.26 (0.16–0.42) | <0.001 |
| HL | 0.31 (0.21–0.45) | <0.001 |
| Leukemia | 1.44 (1.15–1.81) | 0.001 |
| NHL | 0.52 (0.38–0.71) | <0.001 |
| Sarcoma | 1.77 (1.43–2.20) | <0.001 |
| Other tumor types | 2.85 (2.37–3.42) | <0.001 |
| Diagnosis Year (continuous) | 0.99 (0.97–1.00) | 0.079 |
DISCUSSION
In this large, diverse AYA cancer patient cohort, HRQoL at diagnosis was impacted by tumor type, age at diagnosis, race/ethnicity, and gender. Low physical (PCS) and mental (MCS) HRQoL at diagnosis were independent predictors of diminished survival among AYA cancer patients. To the best of our knowledge, our study is the first to show that patient-reported HRQoL at diagnosis is predictive of lower overall survival in AYAs with cancer.
The present study identified distinctive distributions of PCS and MCS scores at diagnosis across the most common tumor types diagnosed in the AYA population, such as CNS tumors, HL, NHL, leukemia, breast cancer, and cervical cancers, for which data on PCS and MCS in AYAs are often lacking. Our physical HRQoL results across individual tumor types extends findings by Smith et al.[8] that found poorer PCS in AYA patients with sarcoma compared with germ cell tumors. However, our finding of differences in physical HRQoL by tumor type contrasts with results from Siembida et al.[23] who showed that physical HRQoL did not differ by whether patients had hematologic or solid tumors in their sample of 572 AYAs. The finding of an association between poor PCS at diagnosis and reduced overall survival in AYA patients, particularly those with sarcoma, colorectal cancer, CNS tumors, breast cancer, HL and leukemia could potentially guide the identification of those in greatest need of supportive interventions to improve overall health and well-being long-term.
Age at diagnosis was an important factor modulating the variation observed in PCS and MCS. The finding that younger AYAs (adolescents and emerging adults) with cancer had worse PCS than older AYAs (young adults) may be due to younger AYAs with cancer potentially having more aggressive tumors than older AYAs. For example, in a study of breast cancer, Murphy et al.[24] found that AYAs aged 15–29 years were more likely to have more advanced stages of disease and human epidermal growth factor receptor-2 positive (HER2+) or triple negative breast cancer (TNBC) disease than AYAs aged 30–39 years. However, in the Siembida et al.[23] analysis, older, off-treatment AYA patients had a higher burden of poor HRQoL than patients aged 15–17 years. The superior MCS scores in younger AYAs than older AYAs in the present study may be explained, in part, by younger AYAs having less financial toxicity than older AYAs,[25] or perhaps by younger AYAs still enjoying greater active parental support and still living with their parents, while older AYAs may also experience greater psychosocial pressures from less tangible family support, and having to live independently, possibly start a career and perhaps bearing greater worry/responsibility regarding their own future and the future of their possibly young families/children.
Few studies have reported the relationship between race/ethnicity and HRQoL in the AYA cancer patient population. Keegan et al.[26] previously reported that racial/ethnic minoritized AYAs are more likely to be diagnosed with cancer at a later stage of disease than non-Hispanic White AYAs. In an analysis of HRQoL in adult colorectal cancer patients from MD Anderson, the relationship between poor HRQoL and survival was evident in patients with stage III and IV disease, while attenuated for those with stages I and II at diagnosis.[15] Data on stage at diagnosis was not available for this analysis to identify if this was a factor in our race/ethnicity and poor HRQoL relationship. The comparatively lower survival rates of Black AYA survivors in this study was striking and follows survival disparities documented in previous cohort studies.[27, 28]
The association between poor mental HRQoL and female sex parallels a similar finding of greater distress in female AYAs with cancer than their male counterparts.[29] Poor HRQoL in female cancer patients has been observed in a previous analysis of adult colorectal cancer patients as well.[15] In a survey of the US general population, females had a higher percentage individuals who reported fair and poor health compared to men.[30] This suggests the possibility that the decreased MCS observed in female AYA cancer patients is not specific to the AYA age group, yet that female gender is a more universal risk factor for poor mental well-being following a cancer diagnosis.
Our finding that patient-reported poor physical functioning (PCS) at diagnosis is predictive of lower survival in AYA cancer survivors extends previous findings. Previously, our group and others have shown that physical HRQoL is predictive of overall survival in adults for multiple tumor types,[15–17] in adult patients in randomized controlled trials[19], and in patients receiving anticancer treatment in phase III clinical trials.[31] The mechanism(s) for this relationship between poor physical functioning and overall survival remain unclear, although it has been hypothesized to be due to cancer aggressiveness or possibly serve as a surrogate marker for undefined underlying biological dysfunction.[32]
The prognostic value of PROs is of interest as it is a cost-effective alternative when compared with laboratory-based markers of prognosis. It also facilitates access to specific potential interventions (i.e. targeting physical functioning and/or mental health) that could improve the patient’s well-being and thus the possibility of altering patients’ long-term prognoses. With the increasing interest in PROs, studies focusing on potential interventions to improve outcomes are emerging. Kent et al. utilized PROs related to pain and pain-related interference with daily activities to determine patient eligibility for a randomized intervention trial. Intervention included cognitive functional therapy with or without wearable-generated movement sensor biofeedback.[33] This intervention produced significant and durable improvements in patient-reported activity limitations and pain scores among this low HRQoL population. In a different phase II randomized, controlled trial, fatigue scores from a symptom assessment scale were used as an eligibility criteria to identify participants with cancer-related fatigue who were subsequently randomized to a successful multimodal intervention of physical activity and dexamethasone aimed at alleviating cancer-related fatigue.[34] Several physical activity interventions utilizing varying intervention characteristics, including individualized physical activity prescriptions, supervised structure, goal setting, and wearable devices have reported improvements in HRQOL, anxiety, and depression among AYA cancer survivors.[35]
Potential limitations include that this study encompasses a single, albeit large, tertiary comprehensive cancer center making it unclear whether these findings are generalizable to other caner care settings, such as community practices. HRQOL was assessed within 6 months of diagnosis, with a median time to questionnaire completion of 1.1 months. This approach was taken to minimize the impact of treatment on HRQOL, but a portion of the participants may be in active treatment at time of assessment potentially inflating the levels of “baseline” HRQOL. Availability of specific treatment and stage information would be informative in our analyses of HRQoL and overall survival. The lack of information on how HRQoL changed longitudinally between baseline and the first two years of survival is a potential limitation as well, as a study by Husson et al.[9] has shown that HRQoL can improve significantly in AYAs between the time of initial cancer diagnosis and 1 year post-diagnosis.
In conclusion, our findings suggest that patient-reported HRQoL in AYAs diagnosed with cancer varies by cancer type and patient demographics, and that poor HRQoL at diagnosis can be used as a potential biomarker of poor prognosis. Furthermore, our study highlights the importance of collecting HRQoL among AYAs at diagnosis, so that they can be offered appropriate interventions to improve their HRQoL and physical and psychological functioning. Further studies are needed to identify these targeted interventions to improve outcomes for AYAs with cancer.
Supplementary Material
Supplemental Figure 1: Distribution of PCS and MCS scores in AYA cancer patients. Violin plot for distribution of PCS and MCS scores by A) tumor type; B) race/ethnicity; C) age at diagnosis; D) gender.
Supplemental Figure 2: PCS and MCS scores and overall survival in AYA cancer patients by age at diagnosis. A) Overall survival by age at diagnosis; B) Survival curves stratified by PCS +/−50; C) Survival curves stratified by MCS +/−50. Solid line – PCS/MCS ≥50, dotted line – PCS/MCS <50.
Supplemental Figure 3: PCS and MCS scores and overall survival in AYA cancer patients by gender. A) Overall survival by gender; B) Survival curves stratified by PCS +/−50; C) Survival curves stratified by MCS +/−50. Solid line – PCS/MCS ≥50, dotted line – PCS/MCS <50.
ACKNOWLEDGEMENTS
The funders had no role in study design, data analysis, data interpretation, or writing of this study.
An abstract (poster) based on the findings from this study was presented at the 2022 Annual AACR Meeting.
FUNDING SUPPORT
Funding support for this study was provided by MD Anderson’s Cancer Center Support Grant P30CA016672, National Cancer Institute R01CA242565 (GCG), the State of Texas Tobacco Settlement Funds for Patient History Database, Harry S. Moss Heart Trust Fund (MATH), and MD Anderson University Cancer Foundation and the Duncan Family Institute for Cancer Prevention and Risk Assessment via the Cancer Survivorship Research Seed Money Grant (MATH).
Footnotes
CONFLICTS OF INTEREST
The authors declare no conflicts of interest.
DATA AVAILABILITY
Data used for this research study can be made available to investigators by request from the senior author.
REFERENCES
- 1.Howlader N, Noone AM, Krapcho M, et al. SEER Cancer Statistics Review, 1975–2018. In: National Cancer Insitute, Bethesda, MD; 2021. [Google Scholar]
- 2.Bleyer A, Barr R, Hayes-Lattin B, et al. The distinctive biology of cancer in adolescents and young adults. Nat Rev Cancer 2008;8(4):288–98. [DOI] [PubMed] [Google Scholar]
- 3.Barr RD, Ferrari A, Ries L, et al. Cancer in Adolescents and Young Adults: A Narrative Review of the Current Status and a View of the Future. JAMA Pediatr 2016;170(5):495–501. [DOI] [PubMed] [Google Scholar]
- 4.Sender L, Zabokrtsky KB. Adolescent and young adult patients with cancer: a milieu of unique features. Nat Rev Clin Oncol 2015;12(8):465–80. [DOI] [PubMed] [Google Scholar]
- 5.Core Patient-Reported Outcomes in Cancer Clinical Trials: Draft Guidance for Industry. In: Excellence OCo, Research CfBEa, Research CfDEa, (eds); 2021. [Google Scholar]
- 6.Measuring Healthy Days: Population assessment of health-related quality of life. In: Prevention CfDCa, (ed). Atlanta, GA; 2000. [Google Scholar]
- 7.Roth ME, Parsons SK, Ganz PA, et al. Inclusion of a core patient-reported outcomes battery in adolescent and young adult cancer clinical trials. J Natl Cancer Inst 2023;115(1):21–28. [DOI] [PMC free article] [PubMed] [Google Scholar]
- 8.Smith AW, Bellizzi KM, Keegan TH, et al. Health-related quality of life of adolescent and young adult patients with cancer in the United States: the Adolescent and Young Adult Health Outcomes and Patient Experience study. J Clin Oncol 2013;31(17):2136–45. [DOI] [PMC free article] [PubMed] [Google Scholar]
- 9.Husson O, Zebrack BJ, Block R, et al. Health-Related Quality of Life in Adolescent and Young Adult Patients With Cancer: A Longitudinal Study. J Clin Oncol 2017;35(6):652–659. [DOI] [PubMed] [Google Scholar]
- 10.Zebrack B, Isaacson S. Psychosocial care of adolescent and young adult patients with cancer and survivors. J Clin Oncol 2012;30(11):1221–6. [DOI] [PubMed] [Google Scholar]
- 11.Bradford NK, Chan RJ. Health promotion and psychological interventions for adolescent and young adult cancer survivors: A systematic literature review. Cancer Treat Rev 2017;55:57–70. [DOI] [PubMed] [Google Scholar]
- 12.Lu AD, Zheng Z, Han X, et al. Medical Financial Hardship in Survivors of Adolescent and Young Adult Cancer in the United States. J Natl Cancer Inst 2021;113(8):997–1004. [DOI] [PMC free article] [PubMed] [Google Scholar]
- 13.Kwak M, Zebrack BJ, Meeske KA, et al. Trajectories of psychological distress in adolescent and young adult patients with cancer: a 1-year longitudinal study. J Clin Oncol 2013;31(17):2160–6. [DOI] [PubMed] [Google Scholar]
- 14.Husson O, Reeve BB, Darlington AS, et al. Next Step for Global Adolescent and Young Adult Oncology: A Core Patient-Centered Outcome Set. J Natl Cancer Inst 2022;114(4):496–502. [DOI] [PMC free article] [PubMed] [Google Scholar]
- 15.Reyes ME, Ye Y, Zhou Y, et al. Predictors of health-related quality of life and association with survival may identify colorectal cancer patients at high risk of poor prognosis. Qual Life Res 2017;26(2):319–330. [DOI] [PMC free article] [PubMed] [Google Scholar]
- 16.Pierzynski JA, Ye Y, Lippman SM, et al. Socio-demographic, Clinical, and Genetic Determinants of Quality of Life in Lung Cancer Patients. Sci Rep 2018;8(1):10640. [DOI] [PMC free article] [PubMed] [Google Scholar]
- 17.van Kleef JJ, Dijksterhuis WPM, van den Boorn HG, et al. Prognostic value of patient-reported quality of life for survival in oesophagogastric cancer: analysis from the population-based POCOP study. Gastric Cancer 2021;24(6):1203–1212. [DOI] [PMC free article] [PubMed] [Google Scholar]
- 18.Peipert JD, Efficace F, Pierson R, et al. Patient-reported outcomes predict overall survival in older patients with acute myeloid leukemia. J Geriatr Oncol 2021; 10.1016/j.jgo.2021.09.007. [DOI] [PubMed] [Google Scholar]
- 19.Mierzynska J, Piccinin C, Pe M, et al. Prognostic value of patient-reported outcomes from international randomised clinical trials on cancer: a systematic review. Lancet Oncol 2019;20(12):e685–e698. [DOI] [PubMed] [Google Scholar]
- 20.Ware J Jr, Kosinski M, Keller SD. A 12-Item Short-Form Health Survey: construction of scales and preliminary tests of reliability and validity. Med Care 1996;34(3):220–33. [DOI] [PubMed] [Google Scholar]
- 21.Ware JE Jr., Sherbourne CD. The MOS 36-item short-form health survey (SF-36). I. Conceptual framework and item selection. Med Care 1992;30(6):473–83. [PubMed] [Google Scholar]
- 22.Bhandari NR, Kathe N, Hayes C, et al. Reliability and validity of SF-12v2 among adults with self-reported cancer. Res Social Adm Pharm 2018;14(11):1080–1084. [DOI] [PMC free article] [PubMed] [Google Scholar]
- 23.Siembida EJ, Reeve BB, Zebrack BJ, et al. Measuring health-related quality of life in adolescent and young adult cancer survivors with the National Institutes of Health Patient-Reported Outcomes Measurement Information System((R)) : Comparing adolescent, emerging adult, and young adult survivor perspectives. Psychooncology 2021;30(3):303–311. [DOI] [PMC free article] [PubMed] [Google Scholar]
- 24.Murphy BL, Day CN, Hoskin TL, et al. Adolescents and Young Adults with Breast Cancer have More Aggressive Disease and Treatment Than Patients in Their Forties. Ann Surg Oncol 2019;26(12):3920–3930. [DOI] [PubMed] [Google Scholar]
- 25.Kaddas HK, Pannier ST, Mann K, et al. Age-Related Differences in Financial Toxicity and Unmet Resource Needs Among Adolescent and Young Adult Cancer Patients. J Adolesc Young Adult Oncol 2020;9(1):105–110. [DOI] [PMC free article] [PubMed] [Google Scholar]
- 26.Keegan THM, Parsons HM, Chen Y, et al. Impact of Health Insurance on Stage at Cancer Diagnosis Among Adolescents and Young Adults. J Natl Cancer Inst 2019;111(11):1152–1160. [DOI] [PMC free article] [PubMed] [Google Scholar]
- 27.Murphy CC, Lupo PJ, Roth ME, et al. Disparities in Cancer Survival Among Adolescents and Young Adults: A Population-Based Study of 88 000 Patients. J Natl Cancer Inst 2021;113(8):1074–1083. [DOI] [PMC free article] [PubMed] [Google Scholar]
- 28.Berkman AM, Andersen CR, Puthenpura V, et al. Impact of Race, Ethnicity, and Socioeconomic Status over Time on the Long-term Survival of Adolescent and Young Adult Hodgkin Lymphoma Survivors. Cancer Epidemiol Biomarkers Prev 2021;30(9):1717–1725. [DOI] [PMC free article] [PubMed] [Google Scholar]
- 29.Miroshnychenko A, Rae C, Tsangaris E, et al. Clinical and Demographic Factors Associated with Distress in Adolescent and Young Adults with Cancer. J Adolesc Young Adult Oncol 2021;10(6):682–689. [DOI] [PubMed] [Google Scholar]
- 30.Zahran HS, Kobau R, Moriarty DG, et al. Health-related quality of life surveillance--United States, 1993–2002. MMWR Surveill Summ 2005;54(4):1–35. [PubMed] [Google Scholar]
- 31.Modi ND, Danell NO, Perry RNA, et al. Patient-reported outcomes predict survival and adverse events following anticancer treatment initiation in advanced HER2-positive breast cancer. ESMO Open 2022;7(3):100475. [DOI] [PMC free article] [PubMed] [Google Scholar]
- 32.Montazeri A Quality of life data as prognostic indicators of survival in cancer patients: an overview of the literature from 1982 to 2008. Health Qual Life Outcomes 2009;7:102. [DOI] [PMC free article] [PubMed] [Google Scholar]
- 33.Kent P, Haines T, O’Sullivan P, et al. Cognitive functional therapy with or without movement sensor biofeedback versus usual care for chronic, disabling low back pain (RESTORE): a randomised, controlled, three-arm, parallel group, phase 3, clinical trial. Lancet 2023;401(10391):1866–1877. [DOI] [PubMed] [Google Scholar]
- 34.Yennurajalingam S, Valero V, Lu Z, et al. Combination Therapy of Physical Activity and Dexamethasone for Cancer-Related Fatigue: A Phase II Randomized Double-Blind Controlled Trial. J Natl Compr Canc Netw 2021;20(3):235–243. [DOI] [PubMed] [Google Scholar]
- 35.Hoover RL, Xu J, Conklin JL, et al. Physical Activity Intervention Characteristics and Effects on Behavioral and Health-Related Outcomes Among Adolescents and Young Adults Living with and Beyond Cancer: A Systematic Review. J Adolesc Young Adult Oncol 2023; 10.1089/jayao.2023.0047. [DOI] [PMC free article] [PubMed] [Google Scholar]
Associated Data
This section collects any data citations, data availability statements, or supplementary materials included in this article.
Supplementary Materials
Supplemental Figure 1: Distribution of PCS and MCS scores in AYA cancer patients. Violin plot for distribution of PCS and MCS scores by A) tumor type; B) race/ethnicity; C) age at diagnosis; D) gender.
Supplemental Figure 2: PCS and MCS scores and overall survival in AYA cancer patients by age at diagnosis. A) Overall survival by age at diagnosis; B) Survival curves stratified by PCS +/−50; C) Survival curves stratified by MCS +/−50. Solid line – PCS/MCS ≥50, dotted line – PCS/MCS <50.
Supplemental Figure 3: PCS and MCS scores and overall survival in AYA cancer patients by gender. A) Overall survival by gender; B) Survival curves stratified by PCS +/−50; C) Survival curves stratified by MCS +/−50. Solid line – PCS/MCS ≥50, dotted line – PCS/MCS <50.
Data Availability Statement
Data used for this research study can be made available to investigators by request from the senior author.