Abstract
Histone acetylation is an important epigenetic modification, modulating the development of many tumors. However, the functions of most histone acetylation-related genes (HARGs) and their prognostic values in Ewing sarcoma (EWS) remain unclear. The current study aimed to investigate the prognostic values and potential functions of HARGs in EWS. After collecting EWS patients with mRNA sequencing data from the Gene Expression Omnibus (GEO) database and a list of HARGs from previous studies, Cox regression and Least Absolute Shrinkage and Selection Operator (LASSO) regression were performed to construct a prognostic gene signature based on HARGs. Then, four HARGs (TAF4, ATF2, HDAC2 and OGA) composed a formula to calculate risk score for each patient in the training cohort. Based on median risk score, all patients were classified into low- and high-risk group, and patients with high-risk score had a poor survival outcome (p < 0.001). The 1-, 2-,3- and 5-year AUC (0.853, 0.886,0.909and 0.833, respectively) showed the good ability of this signature to predict the prognoses of EWS patients. In addition, distinct functional enrichment and immune-related pathways were also observed in two risk groups. All results were validated in an external cohort from two dataset in GEO database. Moreover, it was found that silencing HDAC2 expression in EWS cells significantly suppressed the cell viability and migration capability. In conclusion, this is the first study to detect the prognostic values of HARGs in EWS patients, further developing a good prognostic signature based on HARGs, and HDAC2 might be an oncogene in the development of EWS.
Supplementary Information
The online version contains supplementary material available at 10.1007/s12672-024-01689-4.
Keywords: Ewing sarcoma, Histone acetylation, HDAC2, Prognostic signature
Introduction
Ewing sarcoma (EWS), which mainly occurs in children and adolescents as the second most prevalent primary bone malignancy with an estimated overall survival rate of only 55%, is characterized as a group of small round cells with poor differentiation [1–3]. Currently, the major multimodal treatments, including surgical resection, radiation and neoadjuvant/postoperative chemotherapy, seem to have little effect on improving survival outcomes with obvious side-effects in EWS patients during the last two decades [4]. Therefore, these dismal results warrant an optimal therapeutic strategy with a specific target but less toxic to manage EWS [2].
It is well known that gene expression is typically determined by both epigenetic and non-epigenetic modifications [5, 6]. The term "epigenetics" was coined by Conrad Waddington in 1942 [7], which is defined as the modification of DNA and its packaging without DNA sequence alteration [8]. Its regulatory mechanisms mainly include histone post-translational modification, DNA methylation, non-coding RNA interference, and chromatin remodeling [7, 9]. The increasing studies indicate that disruptions in epigenetics are implicated in the occurrence and development of various diseases, especially cancers [10]. Epigenetics-based therapeutic strategies have shown preliminary effectiveness in several tumor types [11]. Moreover, previous research has found widespread epigenetic changes in EWS, particularly to the expression of EWS-FLI1, in chromatin states of promoters, enhancers, and super-enhancers [12]. Thus, targeting epigenetic-related genes might be one of the effective therapeutic approaches for EWS patients.
Histone acetylation, as an epigenetic regulatory mechanism, is controlled by a pair of competing enzymatic activities: histone acetyltransferases (HATs) and histone deacetylases (HDACs) [13], both of which were firstly reported in 1964 [14]. Normal histone acetylation within cells is critically important, as dysfunction in this process can lead to various diseases, including developmental disorders and cancers [15, 16]. In EWS, the expression of fusion oncogene is associated with histone acetylation. For example, HDAC6 regulates the activator complex that (specificity protein 1 (SP1)/P300 binds to EWSR1 and EWSR1-FLI1 promoters) by regulating the acetylation status of SP1. Conversely, HDAC6 inhibitors may reverse this situation, which leads to EWSR1-FLI1 expression suppression of EWS carcinogenesis [17]. In addition, histone deacetylase inhibitors (HDACi) have been reported to inhibit cancer stem cells growth and promote tumor cell death in EWS [18–20]. Therefore, it is essential and meaningful to conduct a new and in-depth research on histone acetylation in EWS. To our knowledge, these previous studies have primarily focused on a single HDAC or the specific role of HDACi, while neglecting the function of other histone acetylation-related genes (HARGs). For this reason, we aim to comprehensively understand the status of HARGs in EWS networks, including their expression in EWS compared to normal tissues, their prognostic values, and their specific functions.
Materials and methods
Data sources
Two EWS cohorts were included in this study from the Gene Expression Omnibus (GEO) database. The training cohort GSE17674 (https://www.ncbi.nlm.nih.gov/geo/query/acc.cgi?acc=GSE17674) contained 18 normal tissue and 44 EWS samples with RNA sequencing (RNA-seq) data and clinical information. The other is the validation cohort, a combination of GSE63155 (https://www.ncbi.nlm.nih.gov/geo/query/acc.cgi?acc=GSE63155) and GSE63156 (https://www.ncbi.nlm.nih.gov/geo/query/acc.cgi?acc=GSE63156). Similarly, RNA-seq and clinical data of the two datasets were also extracted from the GEO database. It was noteworthy that the reason why using GSE63155 and GSE63156 as a validation cohort was that these two datasets only contained EWS tissues without normal samples. Collectively, a total of 85 samples comprised the validation cohort.
Selecting differentially expressed HARGs between EWS and normal tissues
The HARG candidates in this study were derived from two approaches. One was searching the keyword “acetylation” in the Molecular Signatures Database (http://www.gsea-msigdb.org/gsea/msigdb/genesets.jsp) and then selecting gene sets only related to histone acetylation-related pathways [21]. Another one was referring to the previous study [22]. The list of 166 HARGs was finally collected and shown in Table S1. According to certain criteria (|Log2FoldChange|≥ 1 and adjusted p-value < 0.05), differentially expressed genes (DEGs) in the training cohort were identified by using “limma” package between EWS and normal tissues. Then, the potential HARGs were further selected from the DEGs.
Developing prognostic signature based on HARGs for EWS patients
The prognostic values of differently expressed HARGs in patients with EWS were identified by univariate Cox regression analysis, and HARGs with p < 0.1 were considered significant. Subsequently, significant HARGs were sent into the Least Absolute Shrinkage and Selection Operator (LASSO) regression to narrow down the candidate HARGs. Finally, HARGs with p < 0.05 in multivariate Cox regression analysis were used to develop a prognostic signature and construct a formula to cumulate a risk score for each patient. Risk score = Coef HARGs 1 × Exp HARGs 1 + Coef HARGs 2 × Exp HARGs 2 + …Coef HARGs (n) × Exp HARGs (n). Furthermore, the prognostic values and expression of HARGs used to develop the model were explored.
Evaluating the predictive value of the constructed HARGs signature
According to the median risk score, patients were stratified into low-risk and high-risk groups. The different prognoses of patients in two risk groups were detected by Kaplan–Meier (KM) curves. In addition, risk curve and survival status-related scatterplot were performed to demonstrate the distinct survival status of low-risk and high-risk patients after reordering patients based on risk score. Furthermore, the receiver-operator characteristic (ROC) curves were drawn, and Harrell’s concordance index (C-index) and areas under the curve (AUC) were utilized to assess the feasibility and stability of predictive capability of this signature.
Gene ontology (GO) enrichment and immune-related analyses
The aforementioned selection criteria were also applied to identify DEGs between the two risk groups. Then, the R package "ClusterProfiler" was utilized for Gene Ontology (GO) enrichment analysis to identify pathways that may differ between the groups. In addition, we examined distinct immune-related pathways and immune checkpoints between low-risk and high-risk groups to identify potential therapeutic targets for EWS patients.
Validating the constructed HARGs signature in an external cohort
The risk score of each patient in the validation cohort was also calculated using the same formula as in the training cohort. Similarly, based on the median risk score, patients in the validation cohort were also divided into two risk groups. Then, KM curves were plotted to identify differences in prognosis between the two risk groups. Additionally, risk curve and survival status-related scatterplot were drawn after reordering the patients. Moreover, the AUC was also used to assess the ability of the same characteristics to predict patient’s prognosis in the external cohort. Since the validation cohort included only EWS samples and no normal tissues, we focused solely on exploring the different prognostic values of these HARGs in EWS patients. Finally, GO enrichment and immune-related analyses were also conducted in both groups.
Cell culture and HDAC2 RNA interference
EWS cell line A673/RD-ES was purchased from the National Collection of Authenticated Cell Cultures (Shanghai, China). Briefly, A673/RD-ES cells were cultured in DMEM/1640 with 10% fetal bovine serum (FBS, Gibco) and 100 U/mL penicillin/streptomycin (P/S, Gibco) and maintained in a 37 ℃ humidified incubator with 5% CO2. After seeding A673/RD-ES cells in a 6-well plate at a proper confluency (~ 60%), 3 μL HDAC2-RNAi siRNA and 2 μL lipofectamine 3000 (Thermo, USA) were used to transfect to silence HDAC2 expression in A673/RD-ES cells. The efficiency of silencing HDAC2 in A673/RD-ES cells was detected by performing quantitative real-time polymerase chain reaction (qRT-PCR) and Western Blot (WB) after 48 h transfection. The negative control siRNA (siNC) and siRNAs for HDAC2 (siHDAC2-1: 5′-GGAUAUUGGUGCUGGAAAA-3′, siHDAC2-2: 5′-CAGACUGAUAUGGCUGUUAAU3′) were synthesized by Genepharm Technologies (Shanghai, China).
Cell viability, colony formation, and migration assays
The cell viability of A673/RD-ES cells transfected with siHDAC2 were determined by the commercial Cell Counting Kit-8 (CCK8) reagent (Biosharp, cat#BS350B) after they were seeded into the 96-well plates. Following the kit instructions, the absorbance (450 nm) at different timing (days 0, 1, 3, 5, 7) was tested after incubating cells with CCK8 reagent for 2 h in the 37 ℃ humidified incubator.
Cells with silenced HDAC2 were seeded in a 6-well plate (1000 cells/well) for clonogenic assay. After 14 days, they were stained with 1% crystal violet.
The transwell chambers (pore size: 8 mm, Corning) were used to perform migration assays. Cells placed in the upper compartment were treated with 200 μL serum-free medium, while 500 μL DMEM medium with 10% FBS filled in the lower chambers. After incubation for about 24 h, 4% paraformaldehyde fixed the cells which were further stained by 0.1% crystal violet, and then these cells were pictured with an Olympus inverted microscope.
Statistical analysis
All statistical analyses were performed by GraphPad Prism 8.0 or R project (v4.0.1, https://www.r-project.org). KM curves were plotted by using the log-rank test, and the Wilcox test was used to select the DEGs, analyzing the GO enrichment and immune-related function. Cell proliferation and migration assays were analyzed by t-test. The results with p < 0.1 in all univariate analyses were considered to be statistically significant, while differences with two-tailed p < 0.05 in other analyses were regarded statistically significant (*p < 0.05; **p < 0.01; ***p < 0.001). In addition, the event-free survival (EFS) was used as the survival outcome of EWS patients, because EFS might reveal the more real outcome of patients after receiving treatments.
Results
Selecting differentially expressed HARGs with prognostic value in EWS patients
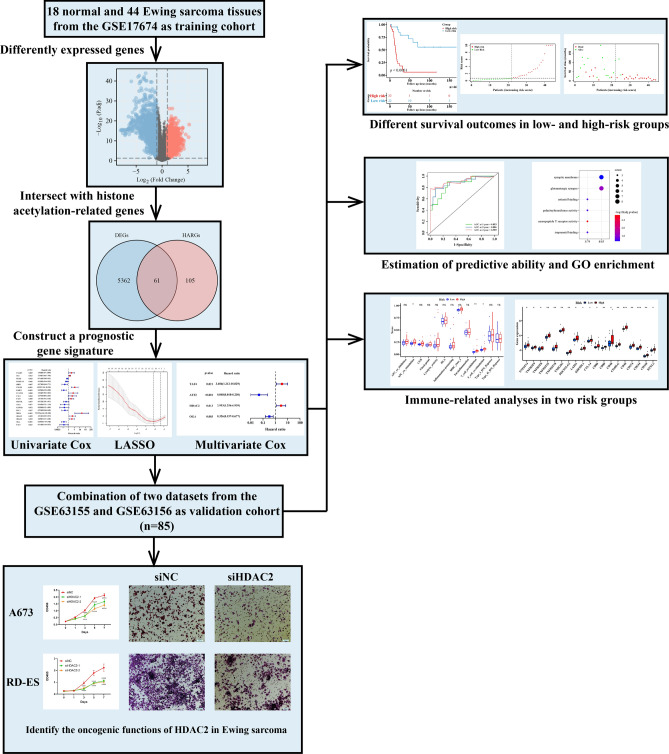
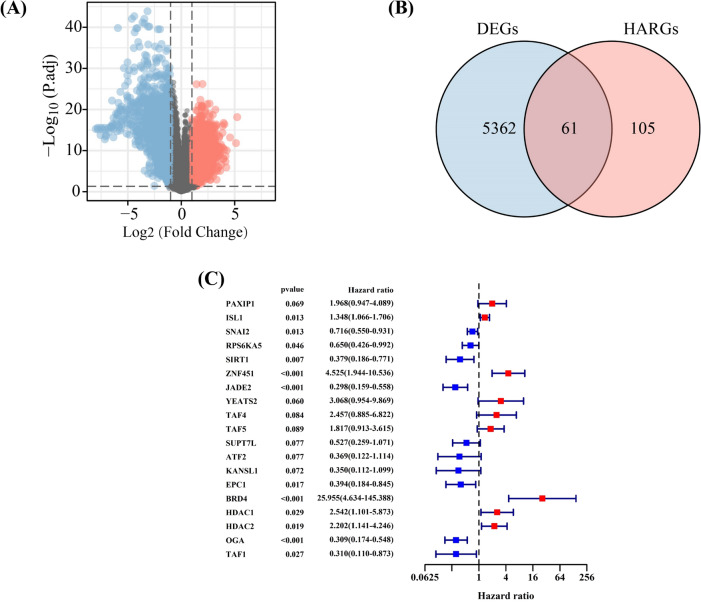
The flowchart was shown in Fig. 1. A total of 5423 DEGs were identified between EWS and normal samples (Fig. 2A), and 61 of them were differentially expressed HARGs (Fig. 2B). Following univariate Cox regression analysis, 19 HARGs were considered as potential factors affecting the prognoses of EWS patients (Fig. 2C), and further sent to the LASSO regression analyses. These results showed that histone acetylation might take part in EWS development and affect the prognosis of EWS patients. Further exploration of its specific role in EWS could be of significance.
Fig. 1.
The flowchart of this study
Fig. 2.
Identifying histone acetylation-related genes (HARGs) associated with the prognoses of Ewing sarcoma (EWS) patients. A The volcano plot of differently expressed genes (DEGs) in normal and EWS samples. B The intersection of DEGs and HARGs. C Univariate Cox regression determining 19 HARGs correlated with prognoses of EWS patients
Constructing a good prognostic signature in the training cohort
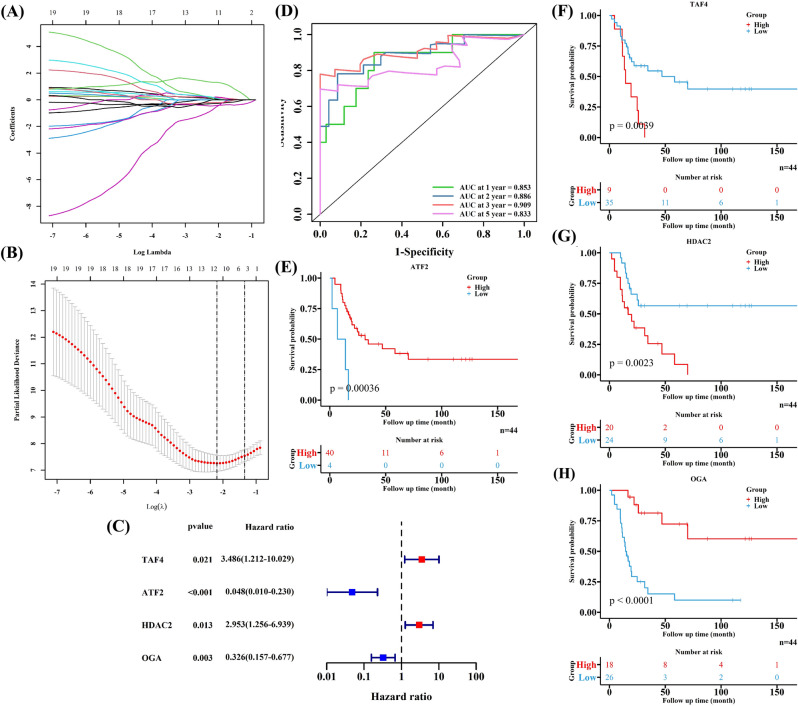
After undergoing cross-validation in LASSO regression analyses (Fig. 3A, B), 12 HARGs were sent into the multivariate Cox regression analysis to figure out the independently prognostic HARGs for EWS patients. Finally, four HARGs (TAF4, ATF2, HDAC2 and OGA) were included in the prognostic model, developing a formula to calculate risk scores for EWS patients (Fig. 3C). The formula was as followed: risk score = 1.2489 * Exp TAF4 – 3.0341 * Exp ATF2 + 1.0827 * Exp HDAC2 – 1.1223 * Exp OGA. The 1-, 2-,3- and 5-year AUC were 0.853, 0.886,0.909and 0.833, respectively (Fig. 3D), and the C-index was 0.802, both of which demonstrated the good ability of the constructed HARGs signature in predicting the prognoses of EWS patients, especially for 3-year survival outcomes. In addition, all four HARGs were significantly correlated with EWS patients’ survival outcomes (Fig. 3E–H). High expression of TAF4 and HDAC2 were linked to a poor survival outcome, while high expression of ATF2 and OGA were associated with a better prognosis. Thus, TAF4 and HDAC2 might be independently risk factors for EWS patients’ prognoses, while ATF2 and OGA might be protective factors by contrast. It was found that the prognostic signature based on HARGs were a good tool to predict EWS patients’ survival probabilities, and HARGs could be regarded as independent factors for prognoses of EWS patients.
Fig. 3.
Developing a prognostic signature based on four HARGs for EWS patients in the training cohort. A, B LASSO regression further selecting HARGs related to the prognoses of EWS patients. C Multivariate Cox regression identifying four HARGs to develop a prognostic signature. D The ROC to test the predictive ability of the constructed signature. E–H The KM curves of the four HARGs
Analyzing the difference between two risk groups in training cohort
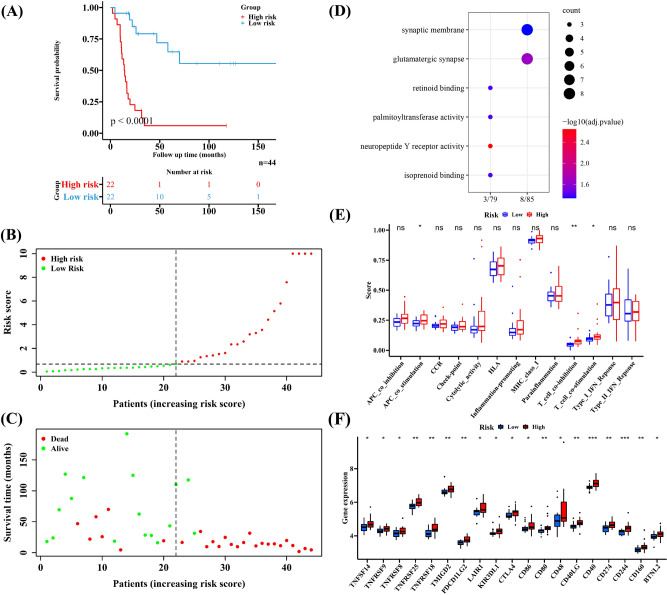
The number of patients in two risk groups was equal (n = 22), and patients with high-risk score had poor survival outcomes (Fig. 4A, p < 0.0001). In addition, the risk curve and survival status-related scatterplot showed similar results with the KM curve, implicating that high-risk score seemed to be linked to a poor prognosis (Fig. 4B, C). Based on the DEGs between the two risk groups, we found that most GO pathways are related to neural excitation, such as neuropeptide Y receptor activity and glutamatergic synapse (Fig. 4D). Additionally, the scores of immune-related pathways in high-risk group were higher, suggesting possible activation of immune functions. Significant differences were observed in APC co-stimulation, T cell co-inhibition or co-stimulation were significantly between the two groups (Fig. 4E). Furthermore, high expression of numerous immune checkpoints was noted in the high-risk groups, indicating that immune checkpoints play a role in treating EWS patients (Fig. 4F). The clinical information of the two cohorts is shown in Table 1.
Fig. 4.
The difference of low- and high-risk groups group in the training cohort. A–C The different survival outcomes of EWS patients. D The results of Gene Ontology (GO) enrichment based on DEGs in two risk groups. E The different immune-related pathways. F The significantly different immune checkpoints
Table 1.
The characteristics of patients in training validation cohort
| Group | Training cohort | Validation cohort | ||||
|---|---|---|---|---|---|---|
| High risk | Low risk | p value | High risk | Low risk | p value | |
| Total (n) | 22 | 22 | 42 | 43 | ||
| Age (yrs, Mean ± SD) | 19.00 (6.90) | 16.73 (7.49) | 0.301 | 14.50 (8.45) | 11.69 (4.99) | 0.064 |
| Sex (n%) | 1 | 0.92 | ||||
| Female | 8 ( 36.4) | 8 (36.4) | 20 (47.6) | 19 (44.2) | ||
| Male | 14 ( 63.6) | 14 (63.6) | 22 (52.4) | 24 (55.8) | ||
| State (n%) | 0.356 | 0.614 | ||||
| Metastasis | 3 (13.6) | 4 (18.2) | – | – | ||
| Primary | 15 (68.2) | 17 (77.3) | – | – | ||
| Recurrence | 4 (18.2) | 1 (4.5) | – | – | ||
| Primary tumor site (n%) | ||||||
| Unknown | – | – | 21 (50.0) | 18 (41.9) | ||
| Extremity | – | – | 4 (9.5) | 5 (11.6) | ||
| Other | – | – | 13 (31.0) | 18 (41.9) | ||
| Pelvis | – | – | 4 (9.5) | 2 (4.7) | ||
| EFS event (n%) | < 0.001 | 0.232 | ||||
| Alive | 2 (9.1) | 15 (68.2) | 22 (52.4) | 29 (67.4) | ||
| Dead | 20 (90.9) | 7 (31.8) | 20 (47.6) | 14 (32.6) | ||
| EFS time (ms, mean ± SD) | 20.23 (23.35) | 60.01 (48.78) | 0.001 | 50.40 (38.56) | 65.26 (30.20) | 0.051 |
| OS event (n%) | < 0.001 | 0.048 | ||||
| Alive | 2 (9.1) | 16 (72.7) | 25 (59.5) | 35 (81.4) | ||
| Dead | 20 (90.9) | 6 (27.3) | 17 (40.5) | 8 (18.6) | ||
| OS time (ms, mean ± SD) | 31.00 (32.49) | 83.03(44.22) | < 0.001 | 57.60 (36.66) | 77.38 (29.73) | 0.008 |
EFS event-free survival, OS overall survival
Validating the developed HARGs signature in an external cohort
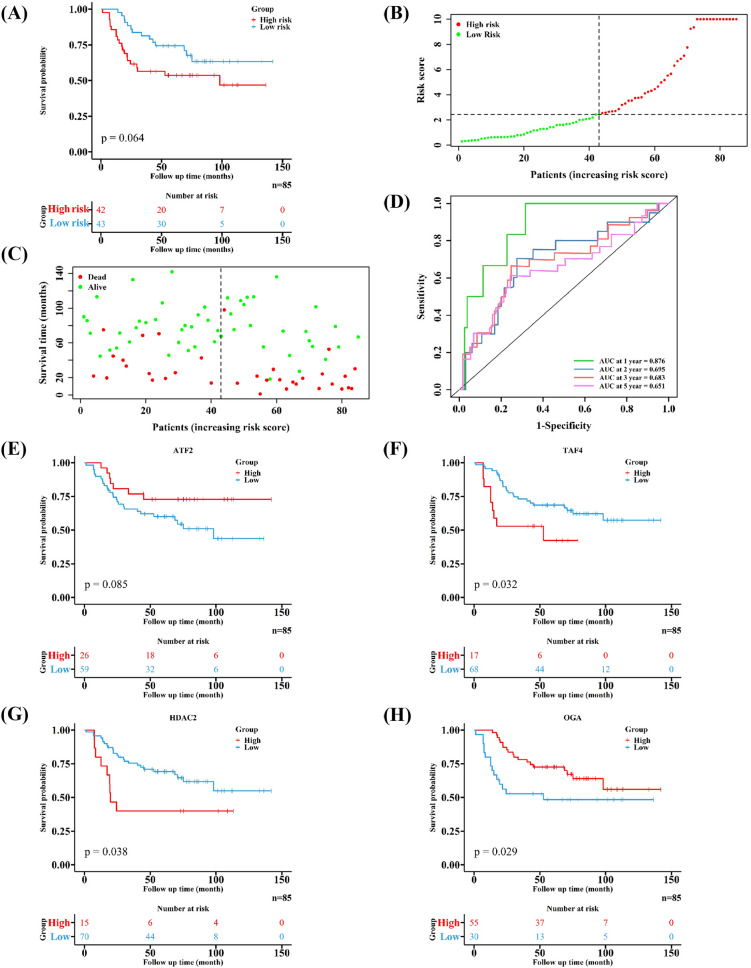
EWS patients were also classified into two groups (low-risk group: 43 samples, high-risk group: 42 samples). Similarly, patients in high-risk group had worse prognoses (Fig. 5A–C). Moreover, the 1-, 2-,3-and 5-year AUC in the validation cohort were 0.876, 0.695, 0.683 and 0.651, respectively (Fig. 5D). The role of four HARGs in affecting the prognosis in the validation cohort was consistent with the training cohort (Fig. 5E–H). These results validate the effective capability of this signature in predicting the prognosis of EWS patients.
Fig. 5.
Validating the developed HARGs signature in an external cohort. A–C The different prognoses of EWS patients in two risk groups. D Estimating the ability of the developed signature to predict survival outcomes of EWS patients. E–H The KM curves of the four HARGs
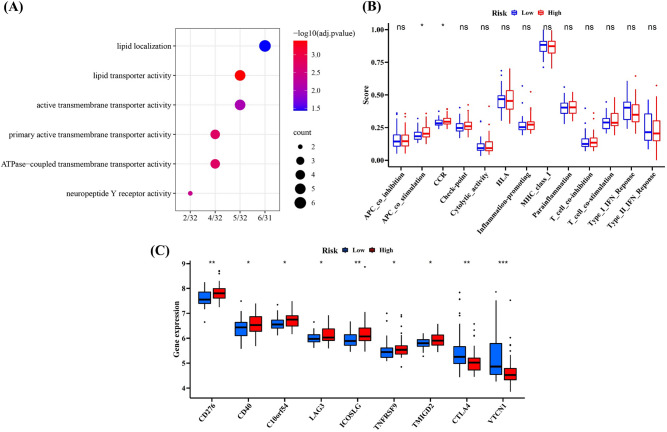
Additionally, neuropeptide Y receptor activity was also considered as a significant pathway in validation cohort by performing GO enrichment analyses (Fig. 6A), and the score of APC co-stimulation was also higher in high-risk group (Fig. 6B). In addition, several immune checkpoints like TNFRSF9, CD276 and CD40 highly expressed in high-risk group, which was found in the training cohort as well (Fig. 6C).
Fig. 6.
The difference of functional analyses in low- and high-risk group in the validation cohort. A The GO enrichment analyses. B The analyses of immune-related pathways. C The detection of differently expressed immune checkpoints
Exploring the specific role of HDAC2 in the development of EWS cells
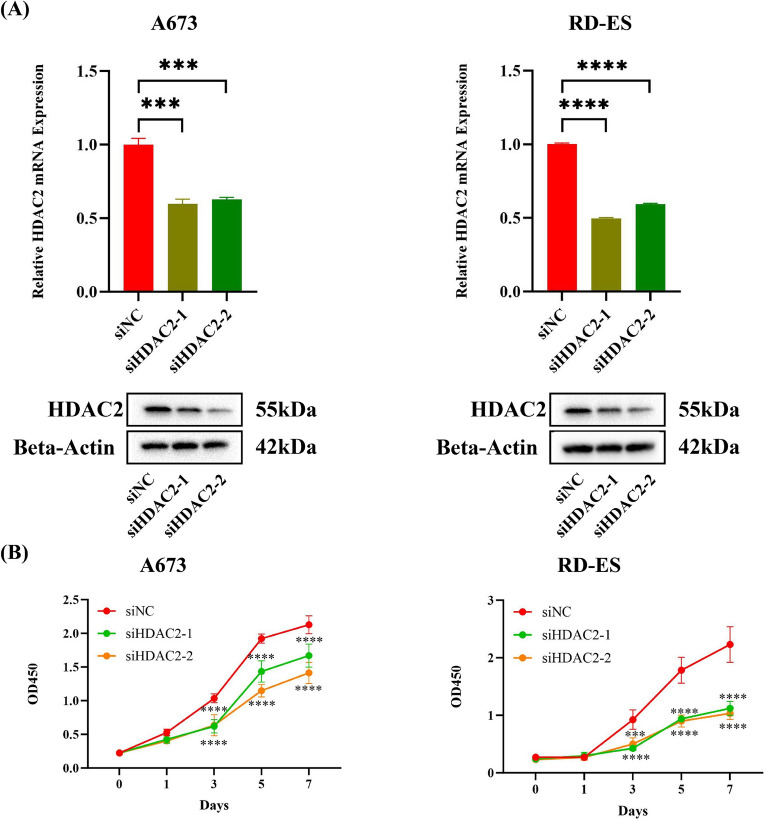
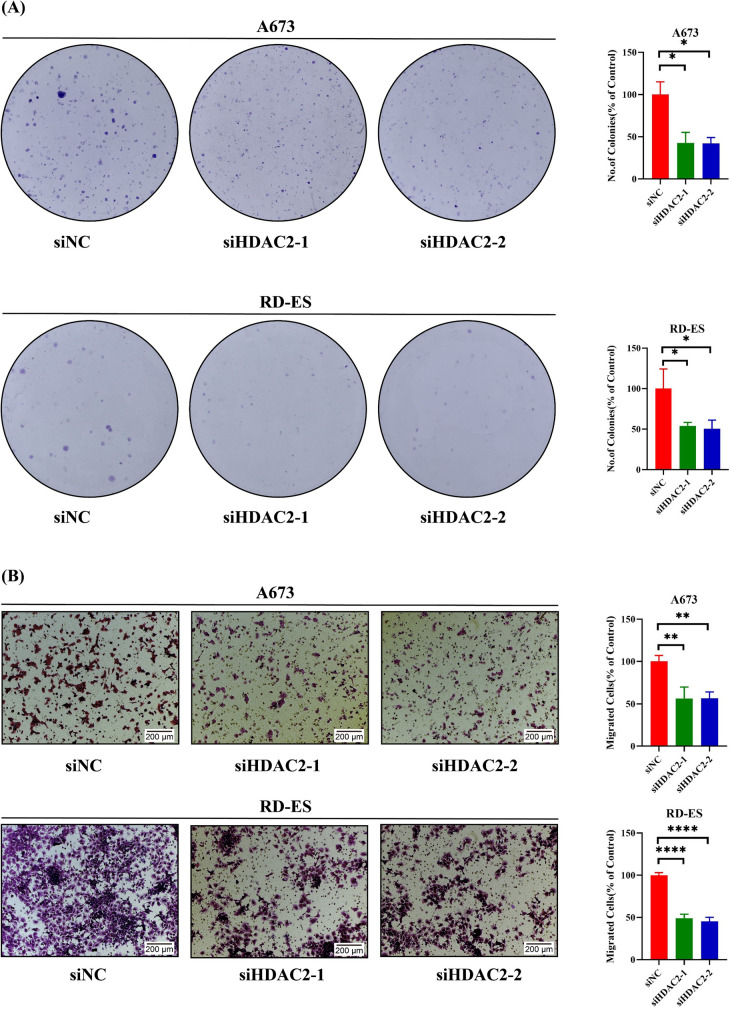
Since HDAC inhibitors have been reported for cancer treatment [23] and HDAC2 was a key gene in histone acetylation, we chose HDAC2 to explore its role in EWS cells. After silencing HDAC2, we first evaluated the silencing efficiency of HDAC2 in A673/RD-ES cells (Fig. 7A). It was found that the cell growth was inhibited in A673/RD-ES cells (Fig. 7B). Concurrently, there was a decrease in both the clonogenic (Fig. 8A) and migratory abilities (Fig. 8B) of the cells. Considering the risk role and the function of HDAC2 in EWS, we propose HDAC2 may be an oncogene in EWS.
Fig. 7.
Exploring the influence of HDAC2 on the development of EWS cells. A The knockdown efficiency of HDAC2 after transfection in A673 and RD-ES cells. B The cell viability of A673 and RD-ES after silencing HDAC2
Fig. 8.
Exploring the influence of HDAC2 on the development of EWS cells. A The cell clonogenic assay of A673 and RD-ES after silencing HDAC2. B The migrated ability of A673 and RD-ES after silencing HDAC2
Discussion
Epigenetic regulation significantly impacts critical biological processes such as genomic integrity, transcriptional regulation, and cell fate [24–26], garnering considerable attention in cancer biology [27]. Histone acetylation modification, as a form of epigenetics, can regulate various biological processes such as cell proliferation, differentiation and apoptosis. Dysregulation alters the normal expression and physiological functions of genes within cells, playing a role in the initiation and progression of tumors [28]. It has been reported that histone deacetylase inhibitors might represent a novel strategy for cancer treatment [29]. With advances in sequencing technology, the use of sequencing to seek new predictive markers and candidates for immune and targeted therapies is becoming one of the important treatment strategies for various cancers, including EWS [30]. Furthermore, research has already developed gene signature based on HARGs for predicting the prognosis of colorectal and identifying biomarkers for colorectal cancer and ovarian cancer [21, 22]. However, understanding of acetylation in EWS is still limited. These evidence provided a strong theoretical basis and preliminary groundwork for constructing a prognostic feature of HARGs in EWS patients. Furthermore, previous research has suggested that miR-22, which is typically suppressed by EWS-FLI1, may inhibit the growth of EWS cells by targeting the histone demethylase KDM3A, involved in H3K9me1/2 histone modifications [13].
This study systematically examined the expression of HARGs in EWS patients, and found that most HARGs are overexpressed in EWS samples and are associated with the prognoses of EWS patients. This suggests that these HARGs may be one of the factors influencing the development of EWS. To improve the efficiency of epigenetic therapy for EWS patients, this study constructed a HARGs signature related to EWS prognoses by performing Cox regression and LASSO regression. We discovered that the constructed signature exhibits specificity and sensitivity in predicting the prognosis of EWS patients, particularly in assessing the 1-year survival rate. The value of 1-year AUC in training and validation cohort are both higher than 0.85, showing that this prognostic signature may be good at predicting the short-term survival for EWS patients. Although the values of 2-, 3-and 5-year AUC in the validation cohort were relatively low, their values are close to 0.7, still implying the significance of HARGs in EWS prognoses. It is undeniable that many factors such as individual differences and tumor heterogeneity may affect the prognosis. In addition, the validation cohort was composed of two GEO datasets, and the process of combining two datasets might change the original gene expression, particularly when performing the normalization procedure. These situations may lead to the low value of AUC. However, the good performance of this HARGs prognostic signature cannot be overlooked. We believed that improved algorithms can assist us in achieving better results in the future.
For the GO enrichment analyses, it was noticed that neuropeptide Y receptor activity was enriched in both training and validation cohort. Neuropeptide Y receptor has five subtypes called Y1, Y2, Y4, Y5, and Y6, belonging to G protein-coupled receptor superfamily [31]. Y1 was highly expressed in EWS and it could potentially be a therapeutic target for EWS [32], while Y5 may promote the progression and bone metastasis for EWS [33]. In addition, Neuropeptide Y pathways seemed could be affected by histone acetylation [34]. However, the role of HARGs in the neuropeptide Y pathway in EWS is not yet clear. Our study suggested that HARGs might be associated with the neuropeptide Y pathway in EWS, which could aid in identifying new effective therapeutic targets for EWS treatment. This hypothesis requires further in-depth research to be substantiated. In the immune-related analyses, we found that APC co-stimulation and several immune checkpoints (CD276, TNFRSF9) were significantly different in two groups. Their scores or expression were relatively higher in the high-risk group, indicating that HARGs may have a certain impact on the immune microenvironment of EWS. However, this specific assertion requires further research for confirmation.
There are three roles in the process of histone acetylation, containing “writers”, “erasers” and “readers”. “Writers” are a group of enzymes that transfer chemical groups to histones, while “erasers” are also a group of enzymes responsible for removing these chemical groups, and “readers” are proteins which could recognize the modified histones [35]. In this study, the prognostic signature was composed of two protective factors (ATF2, OGA) and two risk factors (TAF4, HDAC2). ATF2 (Activating Transcription Factor 2) is a transcription factor with B-Zip-containing, and its encoded protein is a histone acetyltransferase (HAT) specifically acetylating histones H2B and H4 [36]. Previous studies have implicated ATF2 is closely associated with the development and progression of cancer. It has been reported that ATF2 promotes the occurrence and progression of melanoma and renal cell carcinoma, being identified as an oncogene [37–39]. Conversely, ATF2 is speculated to have a specific inhibitory effect on the tumor formation and metastasis of liver cancer [40]. In addition, ATF2 elicits tumor suppressor activity in mammary and skin tumors under a specific environment [36]. Similarly, OGA also plays a duplicated role in the development of tumors. OGA (O-GlcNAcase) contains a structural domain of histone acetyltransferase, which contributed to histone acetylation. OGA was found highly expressed in poorly differentiated laryngeal tumor cells, related to a poor prognosis [41]. OGA was considered as a potential target by stabilizing the activity of P53 pathway in ovarian carcinoma treatment [42]. Although the roles of two genes are different in the process of histone acetylation (ATF2: writers, OGA: erasers), high expression of these two genes may indicate a better prognosis for EWS patients, showing that ATF2 and OGA may be potentially therapeutic targets for EWS patients. TAF4 (TATA-Box Binding Protein Associated Factor 4) is a primary component of the TFIID complex, with a remarkably conserved molecular structure, maintaining stability and integrity of the TFIID complex [43]. TAF4 participates in a series of biological processes, including epigenetic modification and cell development. TAF4 inactivation alters the expression of matrix metalloproteases (CTGF and OPN), which are crucial to regulating metastasis [44]. Furthermore, the loss of TAF4 significantly changes cell adhesion and communication, further inducing the expression of oncogenic markers, and promoting malignant transformation to stimulate tumor formation [44]. Additionally, TAF4 might mediate the tumor invasion and metastasis in gastric cancer by co-expression with TWA1 [45]. These evidences indicated the oncogenic functions of ATF4. HDACs are not only involved in the deacetylation of chromatin proteins, but also take part in the deacetylation of non-histones by directly interacting with transcription factors like P53 and STAT3, influencing cell differentiation and cell cycle [46, 47]. As an “eraser” in histone acetylation, the expression of HDAC2 was highly detected in gastric cancer, and high expression of HDAC2 was associated with nodal spread, correlated with poor survival outcomes for gastric cancer patients [48]. Previous studies have shown that EWS patients with high expression of HDAC2 have a worse prognosis compared to those with low expression [49], which is consistent with our findings. Given the significant regulatory role of HDACs in cancer cells, and the fact that HDAC2 is an important part of a class I HDAC family, we decided to further explore the specific function of HDAC2 in the development of EWS. We noticed that the proliferation and migration abilities of EWS cells were inhibited after silencing HDAC2, indicating oncogenic functions of HDAC2 in EWS. Considering the considerable promise shown by HDAC inhibitors in cancer treatment [50], we believe that targeting HDAC2 may represent a novel and effective approach for treating EWS patients.
This study has certain limitations, which are related to our being the first to use HARGs to establish a prognostic gene model for EWS patients. These limitations are mainly reflected in the following aspects. On the one hand, both the construction and validation of the EWS prognostic model using HARGs are based on retrospective data from public databases. Due to the low incidence of EWS, limited research, and small sample size, the data sets are relatively small in scale. On the other hand, although the function of HDAC2 in EWS has been identified, the roles of the other three HARGs in EWS are still unclear. Further research is warranted to investigate their functions. Moreover, the validation cohort was a combination of two data sheet. The batch effects in the validation cohort are unavoidable, which might contributed to the 2-, 3-, and 5-year AUC values were closed to 0.7. However, the 1-year AUC value in the validation cohort and all the AUC values in the training cohort were more than 0.8. These findings suggested that our prognostic model possessed significant potential for predicted short-term prognosis in patients with Ewing's sarcoma. The accuracy of long-term prognosis for Ewing sarcoma patients might necessitate a larger sample size.
Conclusions
In summary, our study constructed a favorable prognostic signature based on HARGs for EWS patients, providing new insights into histone acetylation in EWS. Additionally, HDAC2 suppresses the proliferation and migration of EWS cells, and inhibiting HDAC may be a potential therapeutic strategy for EWS patients.
Supplementary Information
Supplementary file 1: Table S1: The list of 166 histone acetylation-related genes (HARGs). (XLSX 11 KB)
Acknowledgements
None.
Author contributions
The original ideas of this manuscript were conceived and designed by WHF, HSH, and JDJ. WAS and LFY collected and analyzed the data. WAS and ZL performed the validation experiments. The figures and tables were prepared by JRY and YSJ. ZZH, Qi Zhang and Qian Zhang collected related literature. WAS drafted the initial manuscript, and WHF, HSH, and JDJ reviewed and edited the initial manuscript. All authors have read and approved the manuscript.
Funding
This work was supported by grants from National Natural Science Foundation of China. (No. 82203401), Pujiang Talent Program of Shanghai (22PJD086) and Funding of Shanghai Changning Health Commission (2023QN25).
Data availability
Two EWS cohorts were included in this study from the Gene Expression Omnibus (GEO) database. The training cohort GSE17674 (https://www.ncbi.nlm.nih.gov/geo/query/acc.cgi?acc=GSE17674). The other is the validation cohort, a combination of GSE63155 (https://www.ncbi.nlm.nih.gov/geo/query/acc.cgi?acc=GSE63155) and GSE63156 (https://www.ncbi.nlm.nih.gov/geo/query/acc.cgi?acc=GSE63156).
Declarations
Ethics approval and consent to participate
Not applicable.
Consent for publication
Not applicable.
Competing interests
The authors declare no competing interests.
Footnotes
Publisher's Note
Springer Nature remains neutral with regard to jurisdictional claims in published maps and institutional affiliations.
Anshun Wu, Fayin Liu and Lei Zhou authors have contributed equally to this work and share the first authorship.
Dongjie Jiang, Shaohui He and Haifeng Wei authors contributed equally to this work and shared the last authorship.
Contributor Information
Dongjie Jiang, Email: jdjspine@163.com.
Shaohui He, Email: heshaohui1025@163.com.
Haifeng Wei, Email: weihfspine@126.com.
References
- 1.Osgood CL, Maloney N, Kidd CG, Kitchen-Goosen S, Segars L, Gebregiorgis M, et al. Identification of mithramycin analogues with improved targeting of the EWS-FLI1 transcription factor. Clin Cancer Res. 2016;22(16):4105–18. [DOI] [PMC free article] [PubMed] [Google Scholar]
- 2.Marchetto A, Ohmura S, Orth MF, Knott MML, Colombo MV, Arrigoni C, et al. Oncogenic hijacking of a developmental transcription factor evokes vulnerability toward oxidative stress in Ewing sarcoma. Nat Commun. 2020;11(1):2423. [DOI] [PMC free article] [PubMed] [Google Scholar]
- 3.Jiang R, Hu J, Zhou H, Wei H, He S, Xiao J. A novel defined hypoxia-related gene signature for prognostic prediction of patients with ewing sarcoma. Front Genet. 2022;13: 908113. [DOI] [PMC free article] [PubMed] [Google Scholar]
- 4.Fleuren ED, Versleijen-Jonkers YM, van de Luijtgaarden AC, Molkenboer-Kuenen JD, Heskamp S, Roeffen MH, et al. Predicting IGF-1R therapy response in bone sarcomas: immuno-SPECT imaging with radiolabeled R1507. Clin Cancer Res. 2011;17(24):7693–703. [DOI] [PMC free article] [PubMed] [Google Scholar]
- 5.Takahashi A, de Andrés MC, Hashimoto K, Itoi E, Oreffo RO. Epigenetic regulation of interleukin-8, an inflammatory chemokine, in osteoarthritis. Osteoarthritis Cartil. 2015;23(11):1946–54. [DOI] [PMC free article] [PubMed] [Google Scholar]
- 6.Feinberg AP, Irizarry RA, Fradin D, Aryee MJ, Murakami P, Aspelund T, et al. Personalized epigenomic signatures that are stable over time and covary with body mass index. Sci Transl Med. 2010;2(49):4967. [DOI] [PMC free article] [PubMed] [Google Scholar]
- 7.Janssens Y, Wynendaele E, VandenBerghe W, De Spiegeleer B. Peptides as epigenetic modulators: therapeutic implications. Clin Epigenetics. 2019;11(1):101. [DOI] [PMC free article] [PubMed] [Google Scholar]
- 8.Jung SE, Shin KJ, Lee HY. DNA methylation-based age prediction from various tissues and body fluids. BMB Rep. 2017;50(11):546–53. [DOI] [PMC free article] [PubMed] [Google Scholar]
- 9.Hong X, Kim ES, Guo H. Epigenetic regulation of hepatitis B virus covalently closed circular DNA: Implications for epigenetic therapy against chronic hepatitis B. Hepatology (Baltimore, MD). 2017;66(6):2066–77. [DOI] [PMC free article] [PubMed] [Google Scholar]
- 10.Yu X, Li Z. Epigenetic deregulations in chordoma. Cell Prolif. 2015;48(5):497–502. [DOI] [PMC free article] [PubMed] [Google Scholar]
- 11.Stahl M, Kohrman N, Gore SD, Kim TK, Zeidan AM, Prebet T. Epigenetics in cancer: a hematological perspective. PLoS Genet. 2016;12(10): e1006193. [DOI] [PMC free article] [PubMed] [Google Scholar]
- 12.Parrish JK, Sechler M, Winn RA, Jedlicka P. The histone demethylase KDM3A is a microRNA-22-regulated tumor promoter in Ewing Sarcoma. Oncogene. 2015;34(2):257–62. [DOI] [PMC free article] [PubMed] [Google Scholar]
- 13.Carrico C, Meyer JG, He W, Gibson BW, Verdin E. The mitochondrial acylome emerges: proteomics, regulation by sirtuins, and metabolic and disease implications. Cell Metab. 2018;27(3):497–512. [DOI] [PMC free article] [PubMed] [Google Scholar]
- 14.Valerio DG, Xu H, Eisold ME, Woolthuis CM, Pandita TK, Armstrong SA. Histone acetyltransferase activity of MOF is required for adult but not early fetal hematopoiesis in mice. Blood. 2017;129(1):48–59. [DOI] [PMC free article] [PubMed] [Google Scholar]
- 15.Roccaro AM, Sacco A, Jia X, Azab AK, Maiso P, Ngo HT, et al. microRNA-dependent modulation of histone acetylation in Waldenstrom macroglobulinemia. Blood. 2010;116(9):1506–14. [DOI] [PMC free article] [PubMed] [Google Scholar]
- 16.Otterson GA, Hodgson L, Pang H, Vokes EE. Phase II study of the histone deacetylase inhibitor Romidepsin in relapsed small cell lung cancer (Cancer and Leukemia Group B 30304). J Thorac Oncol. 2010;5(10):1644–8. [DOI] [PMC free article] [PubMed] [Google Scholar]
- 17.García-Domínguez DJ, Hajji N, Sánchez-Molina S, Figuerola-Bou E, de Pablos RM, Espinosa-Oliva AM, et al. Selective inhibition of HDAC6 regulates expression of the oncogenic driver EWSR1-FLI1 through the EWSR1 promoter in Ewing sarcoma. Oncogene. 2021;40(39):5843–53. [DOI] [PMC free article] [PubMed] [Google Scholar]
- 18.Di Pompo G, Salerno M, Rotili D, Valente S, Zwergel C, Avnet S, et al. Novel histone deacetylase inhibitors induce growth arrest, apoptosis, and differentiation in sarcoma cancer stem cells. J Med Chem. 2015;58(9):4073–9. [DOI] [PubMed] [Google Scholar]
- 19.Sampson VB, Vetter NS, Kamara DF, Collier AB, Gresh RC, Kolb EA. Vorinostat enhances cytotoxicity of SN-38 and temozolomide in ewing sarcoma cells and activates STAT3/AKT/MAPK pathways. PLoS ONE. 2015;10(11): e0142704. [DOI] [PMC free article] [PubMed] [Google Scholar]
- 20.Sonnemann J, Dreyer L, Hartwig M, Palani CD, le Hong TT, Klier U, et al. Histone deacetylase inhibitors induce cell death and enhance the apoptosis-inducing activity of TRAIL in Ewing’s sarcoma cells. J Cancer Res Clin Oncol. 2007;133(11):847–58. [DOI] [PubMed] [Google Scholar]
- 21.Jing Z, Ziwang F, Yinhang W, Yani Z, Jian C, Jingwen W, et al. Novel acetylation-related gene signatures for predicting the prognosis of patients with colorectal cancer. Hum Cell. 2022;35(4):1159–73. [DOI] [PubMed] [Google Scholar]
- 22.Dai Q, Ye Y. Development and validation of a novel histone acetylation-related gene signature for predicting the prognosis of ovarian cancer. Front Cell Dev Biol. 2022;10: 793425. [DOI] [PMC free article] [PubMed] [Google Scholar]
- 23.Falkenberg KJ, Johnstone RW. Histone deacetylases and their inhibitors in cancer, neurological diseases and immune disorders. Nat Rev Drug Discov. 2014;13(9):673–91. [DOI] [PubMed] [Google Scholar]
- 24.Sajadian SO, Tripura C, Samani FS, Ruoss M, Dooley S, Baharvand H, et al. Vitamin C enhances epigenetic modifications induced by 5-azacytidine and cell cycle arrest in the hepatocellular carcinoma cell lines HLE and Huh7. Clin Epigenetics. 2016;8:46. [DOI] [PMC free article] [PubMed] [Google Scholar]
- 25.Lay FD, Liu Y, Kelly TK, Witt H, Farnham PJ, Jones PA, et al. The role of DNA methylation in directing the functional organization of the cancer epigenome. Genome Res. 2015;25(4):467–77. [DOI] [PMC free article] [PubMed] [Google Scholar]
- 26.Hill RJ, Crossan GP. DNA cross-link repair safeguards genomic stability during premeiotic germ cell development. Nat Genet. 2019;51(8):1283–94. [DOI] [PMC free article] [PubMed] [Google Scholar]
- 27.Nacev BA, Jones KB, Intlekofer AM, Yu JSE, Allis CD, Tap WD, et al. The epigenomics of sarcoma. Nat Rev Cancer. 2020;20(10):608–23. [DOI] [PMC free article] [PubMed] [Google Scholar]
- 28.Farria A, Li W, Dent SY. KATs in cancer: functions and therapies. Oncogene. 2015;34(38):4901–13. [DOI] [PMC free article] [PubMed] [Google Scholar]
- 29.Rezapour S, Hosseinzadeh E, Marofi F, Hassanzadeh A. Epigenetic-based therapy for colorectal cancer: prospect and involved mechanisms. J Cell Physiol. 2019;234(11):19366–83. [DOI] [PubMed] [Google Scholar]
- 30.Sand LG, Szuhai K, Hogendoorn PC. Sequencing overview of ewing sarcoma: a journey across genomic, epigenomic and transcriptomic landscapes. Int J Mol Sci. 2015;16(7):16176–215. [DOI] [PMC free article] [PubMed] [Google Scholar]
- 31.Michel MC, Beck-Sickinger A, Cox H, Doods HN, Herzog H, Larhammar D, et al. XVI. International Union of Pharmacology recommendations for the nomenclature of neuropeptide Y, peptide YY, and pancreatic polypeptide receptors. Pharmacolog Rev. 1998;50(1):143–50. [PubMed] [Google Scholar]
- 32.Körner M, Waser B, Reubi JC. High expression of neuropeptide Y1 receptors in ewing sarcoma tumors. Clin Cancer Res. 2008;14(16):5043–9. [DOI] [PubMed] [Google Scholar]
- 33.Lu C, Mahajan A, Hong SH, Galli S, Zhu S, Tilan JU, et al. Hypoxia-activated neuropeptide Y/Y5 receptor/RhoA pathway triggers chromosomal instability and bone metastasis in Ewing sarcoma. Nat Commun. 2022;13(1):2323. [DOI] [PMC free article] [PubMed] [Google Scholar]
- 34.Kokare DM, Kyzar EJ, Zhang H, Sakharkar AJ, Pandey SC. Adolescent alcohol exposure-induced changes in alpha-melanocyte stimulating hormone and neuropeptide Y pathways via histone acetylation in the brain during adulthood. Int J Neuropsychopharmacol. 2017;20(9):758–68. [DOI] [PMC free article] [PubMed] [Google Scholar]
- 35.Cheng Y, He C, Wang M, Ma X, Mo F, Yang S, et al. Targeting epigenetic regulators for cancer therapy: mechanisms and advances in clinical trials. Signal Transduct Target Ther. 2019;4:62. [DOI] [PMC free article] [PubMed] [Google Scholar]
- 36.Bhoumik A, Ronai Z. ATF2: a transcription factor that elicits oncogenic or tumor suppressor activities. Cell cycle (Georgetown, Tex). 2008;7(15):2341–5. [DOI] [PubMed] [Google Scholar]
- 37.Berger AJ, Kluger HM, Li N, Kielhorn E, Halaban R, Ronai Z, et al. Subcellular localization of activating transcription factor 2 in melanoma specimens predicts patient survival. Can Res. 2003;63(23):8103–7. [PubMed] [Google Scholar]
- 38.Ronai Z, Yang YM, Fuchs SY, Adler V, Sardana M, Herlyn M. ATF2 confers radiation resistance to human melanoma cells. Oncogene. 1998;16(4):523–31. [DOI] [PubMed] [Google Scholar]
- 39.Wu DS, Chen C, Wu ZJ, Liu B, Gao L, Yang Q, et al. ATF2 predicts poor prognosis and promotes malignant phenotypes in renal cell carcinoma. J Exp Clin Cancer Res CR. 2016;35(1):108. [DOI] [PMC free article] [PubMed] [Google Scholar]
- 40.Gozdecka M, Lyons S, Kondo S, Taylor J, Li Y, Walczynski J, et al. JNK suppresses tumor formation via a gene-expression program mediated by ATF2. Cell Rep. 2014;9(4):1361–74. [DOI] [PubMed] [Google Scholar]
- 41.Starska K, Forma E, Brzezińska-Błaszczyk E, Lewy-Trenda I, Bryś M, Jóźwiak P, et al. Gene and protein expression of O-GlcNAc-cycling enzymes in human laryngeal cancer. Clin Exp Med. 2015;15(4):455–68. [DOI] [PMC free article] [PubMed] [Google Scholar]
- 42.de Queiroz RM, Madan R, Chien J, Dias WB, Slawson C. Changes in O-linked N-acetylglucosamine (O-GlcNAc) homeostasis activate the p53 pathway in ovarian cancer cells. J Biol Chem. 2016;291(36):18897–914. [DOI] [PMC free article] [PubMed] [Google Scholar]
- 43.Langer D, Martianov I, Alpern D, Rhinn M, Keime C, Dollé P, et al. Essential role of the TFIID subunit TAF4 in murine embryogenesis and embryonic stem cell differentiation. Nat Commun. 2016;7:11063. [DOI] [PMC free article] [PubMed] [Google Scholar]
- 44.Kazantseva J, Palm K. Diversity in TAF proteomics: consequences for cellular differentiation and migration. Int J Mol Sci. 2014;15(9):16680–97. [DOI] [PMC free article] [PubMed] [Google Scholar]
- 45.Xiong J, Feng Z, Li Z, Zhong T, Yang Z, Tu Y, et al. Overexpression of TWA1 predicts poor prognosis in patients with gastric cancer. Pathol Res Pract. 2019;215(11): 152594. [DOI] [PubMed] [Google Scholar]
- 46.Johnstone RW. Histone-deacetylase inhibitors: novel drugs for the treatment of cancer. Nat Rev Drug Discov. 2002;1(4):287–99. [DOI] [PubMed] [Google Scholar]
- 47.Lin HY, Chen CS, Lin SP, Weng JR, Chen CS. Targeting histone deacetylase in cancer therapy. Med Res Rev. 2006;26(4):397–413. [DOI] [PubMed] [Google Scholar]
- 48.Weichert W, Röske A, Gekeler V, Beckers T, Ebert MP, Pross M, et al. Association of patterns of class I histone deacetylase expression with patient prognosis in gastric cancer: a retrospective analysis. Lancet Oncol. 2008;9(2):139–48. [DOI] [PubMed] [Google Scholar]
- 49.Schmidt O, Nehls N, Prexler C, von Heyking K, Groll T, Pardon K, et al. Class I histone deacetylases (HDAC) critically contribute to Ewing sarcoma pathogenesis. J Exp Clin Cancer Res CR. 2021;40(1):322. [DOI] [PMC free article] [PubMed] [Google Scholar]
- 50.Minucci S, Pelicci PG. Histone deacetylase inhibitors and the promise of epigenetic (and more) treatments for cancer. Nat Rev Cancer. 2006;6(1):38–51. [DOI] [PubMed] [Google Scholar]
Associated Data
This section collects any data citations, data availability statements, or supplementary materials included in this article.
Supplementary Materials
Supplementary file 1: Table S1: The list of 166 histone acetylation-related genes (HARGs). (XLSX 11 KB)
Data Availability Statement
Two EWS cohorts were included in this study from the Gene Expression Omnibus (GEO) database. The training cohort GSE17674 (https://www.ncbi.nlm.nih.gov/geo/query/acc.cgi?acc=GSE17674). The other is the validation cohort, a combination of GSE63155 (https://www.ncbi.nlm.nih.gov/geo/query/acc.cgi?acc=GSE63155) and GSE63156 (https://www.ncbi.nlm.nih.gov/geo/query/acc.cgi?acc=GSE63156).


