Abstract
Background
Research has consistently highlighted the key role of hepatocyte nuclear factor 1β (HNF1B) in organ development and cancer, including its involvement in colon cancer via shifted-code mutations. However, the specific effects of HNF1B on cancer immunotherapy and the immune microenvironment are not fully understood. This study investigated the impact of HNF1B on colon cancer immunotherapy in depth.
Methods
We analyzed 1,374 colon adenocarcinoma samples from the TCGA and GEO datasets. Our approach involved bioinformatics to uncover how HNF1B influences immunotherapy and the immune microenvironment, with corroboration from external databases and experimental validation.
Results
HNF1B was expressed at low levels in colon adenocarcinoma and was linked to patient prognosis. CIBERSORT, TIME, and GSVA analyses revealed that HNF1B was associated with macrophage infiltration, immune checkpoints, and signaling pathways. Drug prediction suggested a negative relationship between HNF1B and EGFR-targeted therapies, implying potential resistance. Validation with external cohorts confirmed that patients with low HNF1B expression experienced less benefit from immunotherapy.
Conclusion
This study clarifies the role of HNF1B in the treatment of colon adenocarcinoma. This study provides a foundation for further in-depth mechanistic studies and proposes new directions for optimizing immunotherapy strategies for colon adenocarcinoma.
Supplementary Information
The online version contains supplementary material available at 10.1007/s00262-024-03870-8.
Keywords: Colorectal adenocarcinoma, Immunotherapy, Hepatocyte nuclear factor-1β, Tumor microenvironment, Immune checkpoint blockade
Introduction
The hepatocyte nuclear factor (HNF) family comprises a group of transcription factors that play pivotal roles in regulating liver function and a range of metabolic processes [1]. HNF3α (FOXA1) has been demonstrated to exert either tumor-suppressive or oncogenic effects in breast and prostate cancer, contingent on the cellular context and mutation status [2–5]. HNF1α and HNF1B are exemplars of the homodimer transcription factor class and exhibit analogous domains [6]. HNF1α is abundantly expressed in hepatic tissues, where it regulates metabolic genes, including glycogen synthase and glucose-6-phosphatase. The oncogenic role of HNF1B has been documented in numerous tumor types, including prostate, lung, and renal cell carcinomas. In terms of its mechanism of action, HNF1B can exhibit either oncogenic or tumor-suppressive effects, depending on the specific type of cancer in question. For example, in advanced prostate cancer, HNF1B interacts with EZH2 to regulate SLUG gene expression and the epithelial‒mesenchymal transition (EMT) process [7]. HNF1B has been recognized as a gene associated with susceptibility specific to subtypes of ovarian cancer via DNA methylation sequencing and subtype expression profiling [8]. In breast cancer, the methylation of homeobox genes, including HOXB13 and HNF1B, is markedly more pronounced than that in normal samples [9]. Pancreatic intraepithelial neoplasia development and progression are observed in HNF1B mutants, particularly when HNF1B is combined with KRAS [10].
Studies have reported that the upregulation of HNF1B in ovarian clear cell carcinoma (OCCC) activates the STAT3 and NF-κB signaling pathways, inducing immunosuppression through the production of IL-6 and IL-8. This immunosuppressive effect has been observed to synergize with PD-1 therapy [11, 12]. Furthermore, HNF1B has been shown to regulate CD44v9 expression, which in turn modulates its interactions with various molecules, such as EGFR, thereby influencing cellular proliferation, migration, and immune responses [13]. Additionally, case reports have indicated that the p.T376I mutation in the HNF1B gene is associated with the progression of autoimmune diabetes [14]. Nevertheless, the immune related function of HNF1B in colorectal adenocarcinoma (COAD) remains uncertain.
As the second most common malignancy, colorectal cancer (CRC) accounts for more than 1.9 million new cases and an estimated 900,000 deaths annually [15]. Colorectal cancer (CRC) represents the third most common form of cancer globally, preceded only by lung and breast cancer. The incidence of colorectal cancer is relatively high in developed countries and is increasing at a rapid rate in developing nations [16]. In the United States, approximately 152,000 new cases and 53,000 deaths from CRC are anticipated in 2024 [17]. Since the 1950s, the incidence of colorectal cancer (CRC) in the United States has significantly increased. In 2024, it is projected that CRC will become the leading cause of cancer-related mortality in the country, surpassing all other cancers combined. Furthermore, it is estimated that CRC will become the most frequently diagnosed cancer type in men under the age of 50 [17]. The treatment approaches for colorectal cancer are diverse and depend on the stage of the disease and the specific conditions of the patient. The most common treatment modalities include surgical intervention, radiation therapy, chemotherapy, and targeted therapy [18, 19]. The most prevalent pathological type of colon cancer is colon adenocarcinoma (COAD), accounting for more than 90% of cases [15].
In the present investigation, we employed a combination of bioinformatics and in vivo experiments to investigate the tumor-promoting function of HNF1B in colorectal cancer. Our findings indicate that HNF1B deficiency can influence the levels of immune checkpoint genes and the EMT process. Furthermore, we investigated the relationship between HNF1B and resistance to immunotherapy, which suggests a potential association with an inhibitory tumor immune microenvironment (TIME). These results might shed new light on the role of HNF1B in colorectal cancer therapy, particularly within the realm of immunotherapy, and provide a basis for future functional investigations.
Results
Variation in HNF1B expression in COAD
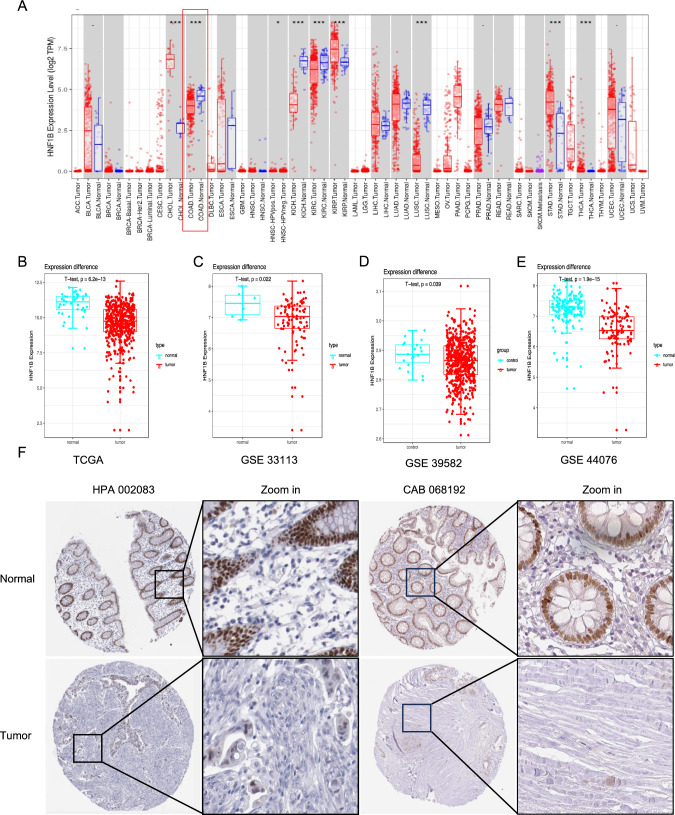
A pan-cancer mRNA sequencing analysis of the TCGA database was conducted to examine the expression levels of HNF1B in various cancers. The results demonstrated that HNF1B is overexpressed in specific cancers, including CHOL (cholangiocarcinoma), KIRP (kidney renal papillary cell carcinoma), STAD (stomach adenocarcinoma), and THCA (thyroid carcinoma). However, in COAD (colon adenocarcinoma), KICH (kidney chromophobe), KIRC (kidney renal clear cell carcinoma) and LUSC (lung squamous cell carcinoma), there was a notable reduction in HNF1B expression (Fig. 1A and S2 A–C). Furthermore, the expression of HNF1B in COAD samples (Table 1) was compared with that in paired normal samples from the TCGA database (N = 41, T = 471) (Fig. 1B), the GSE33113 database (N = 6, T = 102) (Fig. 1C), the GSE39582 database (N = 19, T = 443) (Fig. 1D) and the GSE44076 database (N = 50, T = 98) (Fig. 1E) from the GEO. HNF1B was significantly downregulated in the COAD samples. Moreover, the results of immunohistochemical (IHC) samples from the Human Protein Atlas (HPA) database demonstrated that HNF1B is downregulated in COAD samples stained with HPA002083 or CAB068192 antibodies (Figs. 1F and S2E).
Fig. 1.
The differential expression of HNF1B in COAD. The expression distribution of HNF1B among tumor tissues and normal tissues in TIMER 2.0 (A). The expression level of the HNF1B gene was lower-expressed in tumor samples in TCGA-COAD database (B), GSE33113 (C) GSE39582 (D) and GSE44076 (E). IHC of COAD samples stained with HPA 002083 and CAB 068192 antibody from HPA dataset. Data are presented as mean values ± s.d. Data were analyzed by two-sided unpaired Student's t-test. (*p < 0.05; **p < 0.01; ***p < 0.001)
Table 1.
The Information of patients’ characteristics in TCGA-COAD
| Characteristics | Overall |
|---|---|
| Gender, n (%) | |
| Female | 226 (47.3%) |
| Male | 252 (52.7%) |
| BMI, median (IQR) | 27.116 (23.907, 32.574) |
| Age, median (IQR) | 69 (58, 77) |
| Pathologic T stage, n (%) | |
| T1&T2 | 94 (19.7%) |
| T3 | 323 (67.7%) |
| T4 | 60 (12.6%) |
| Pathologic N stage, n (%) | |
| N0 | 284 (59.4%) |
| N1 | 108 (22.6%) |
| N2 | 86 (18%) |
Decreased HNF1B expression is associated with poor prognostic outcomes in patients with colorectal cancer
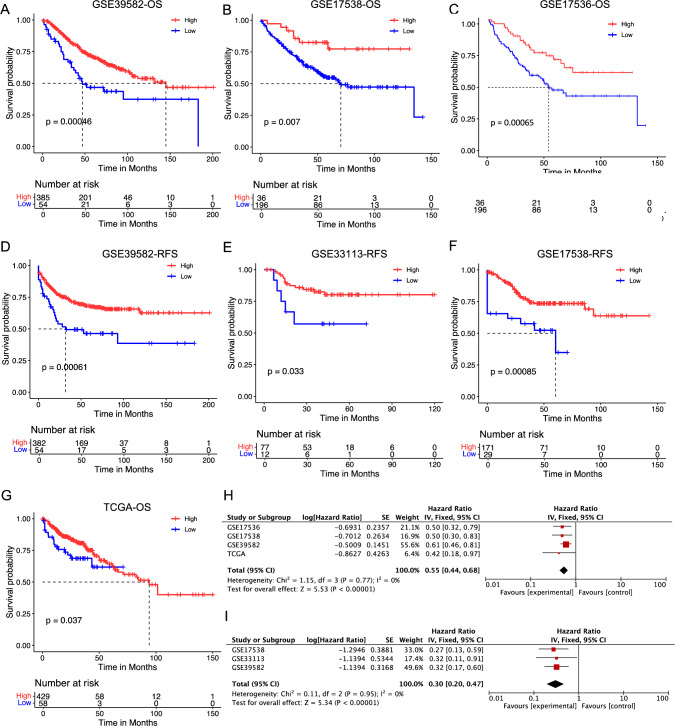
Research has demonstrated a correlation between HNF1B expression in tumor tissues and clinical prognosis in several cancer types [7]. HNF1B expression levels are closely associated with the degree of histological differentiation in various diseases. Its expression has been observed to be higher in differentiated hepatocellular carcinoma (HCC) compared to non-cancerous tissues and is positively correlated with liver cancer recurrence, suggesting a poor prognosis [20]. Additionally, studies have shown that HNF1B expression is linked to the infiltration levels of different immune cell types across various cancers, including CD8 + T cells and CD4 + T cells, prompting our investigation into its potential role in immunotherapy [21, 22]. Nevertheless, its prognostic value in COAD remains to be fully established. The objective of this study was to investigate the impact of HNF1B expression on the clinical outcomes of patients with COAD. To this end, survival analysis and Cox analysis were performed using the TCGA COAD cohort. The results of our analysis indicated that patients with lower HNF1B expression levels exhibited significantly poorer overall survival (OS) than those with higher expression levels (Fig. 1G). This prognostic significance was corroborated by four additional GEO cohorts, namely, GSE39582, GSE33113, GSE 17536 and GSE17538, which consistently demonstrated that lower HNF1B expression was associated with poorer OS and RFS (Fig. 2A–G). The results of the meta-analysis for OS were statistically significant across all four cohorts (combined HR = 0.55, 95% CI = 0.44–0.68; meta-analysis P < 0.00001) (Fig. 2H). With respect to RFS, the GSE39582, GSE33113, and GSE17538 cohorts also demonstrated statistical significance in the meta-analysis (combined HR = 0.30, 95% CI = 0.20–0.47; meta-analysis P < 0.00001) (Fig. 2J). Univariable and multivariable Cox regression analyses based on the TCGA cohort demonstrated that HNF1B expression remained a significant prognostic factor even after adjusting for potential confounding factors, including age, sex, and TNM stage (Table 2). In conclusion, the level of HNF1B expression in tumor tissues serves as a prognostic indicator for COAD, with lower HNF1B levels being independently associated with reduced survival.
Fig. 2.
Low expression of HNF1β leads to a poor prognosis in patients with COAD. Overall survival (OS) analysis for patients with low or high HNF1B level in four independent cohorts: A GSE39582 (n = 439); B GSE17538 (n = 232); C GSE17536 (n = 177); G TCGA (n = 487). Relapse free survival (RFS) analysis for patients with low or high HNF1B level in three independent cohorts: D GSE39582 (n = 436); E GSE33113 (n = 89); F GSE17538 (n = 200). H A meta-analysis for OS related cohorts. I A meta-analysis for RFS related cohorts. Differences in survival between groups were assessed using the log-rank test, with a significance level set at p < 0.05
Table 2.
Univariable and multivariable Cox regression analysis of HNF1B in TCGA dataset
| Characteristics | Univariate analysis | Multivariate analysis | ||
|---|---|---|---|---|
| Odds ratio (95% CI) | P value | Odds ratio (95% CI) | P value | |
| Age | 1.02 (1.00–1.04) | 0.109 | ||
| Gender | 1.09 (0.67–1.78) | 0.726 | ||
| T | 2.90 (1.82–4.64) | < 0.001 | 1.67 (0.95–2.95) | 0.077 |
| N | 2.41 (1.77–3.27) | < 0.001 | 1.19 (0.76–1.86) | 0.450 |
| TNM | 2.71 (2.00–3.67) | < 0.001 | 2.11 (1.34–3.33) | 0.001 |
| hnf1b | 0.70 (0.57–0.85) | 0.001 | 0.73 (0.59–0.90) | 0.004 |
Biological networks connected to HNF1B
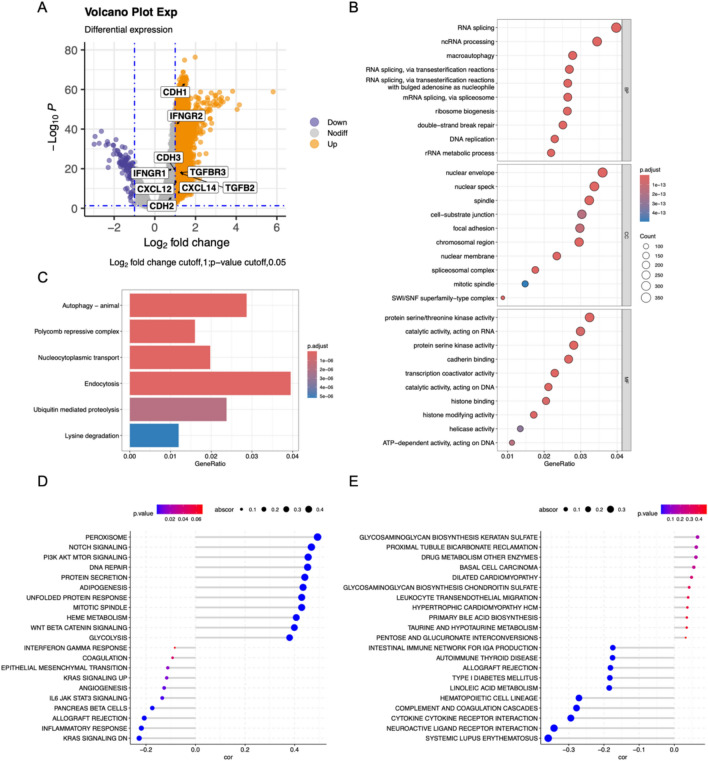
To gain insight into the biological mechanisms through which HNF1B influences COAD progression, we conducted a series of analyses, including gene alteration, DEG analysis and functional enrichment analysis (Figs. 3A and S3A, B). In the TCGA cohort of 512 patients (Table 1), we identified genes that were both upregulated and downregulated between the high and low HNF1B expression subgroups (Fig. 3A). Gene Ontology (GO) analysis of the 145 differentially expressed genes (DEGs) revealed that they are involved primarily in DNA replication, macro autophagy and protease activity (Fig. 3B). KEGG analysis revealed that these genes are involved in autophagy, ubiquitin mediated proteolysis signal pathways (Fig. 3C). Furthermore, we conducted GSVA to gain additional insight into the biological pathways associated with HNF1B expression (Fig. 3D, E). GSVA KEGG term revealed that the DNA repair, cell cycle, and inflammatory response pathways were significantly enriched. Furthermore, GSVA GO term analysis revealed that systemic lupus erythematosus and drug metabolism enzymes were significantly enriched. In conclusion, HNF1B is associated with tumor immunity, inflammation, and oncogenic signaling pathways in COAD.
Fig. 3.
Biological pathways of related to HNF1B. A The volcano map showed the DEGs between patients with high HNF1B levels and patients with low HNF1B levels. GO (B) and KEGG (C) enrichment analysis for these identified DEGs. GSEA hallmark term analysis (D) and GO term analysis (E) for high and low HNF1B expression groups. Correlation analyses were performed using Pearson correlation tests (two-sided)
Correlation of HNF1B with four pathways involved in tumorigenesis
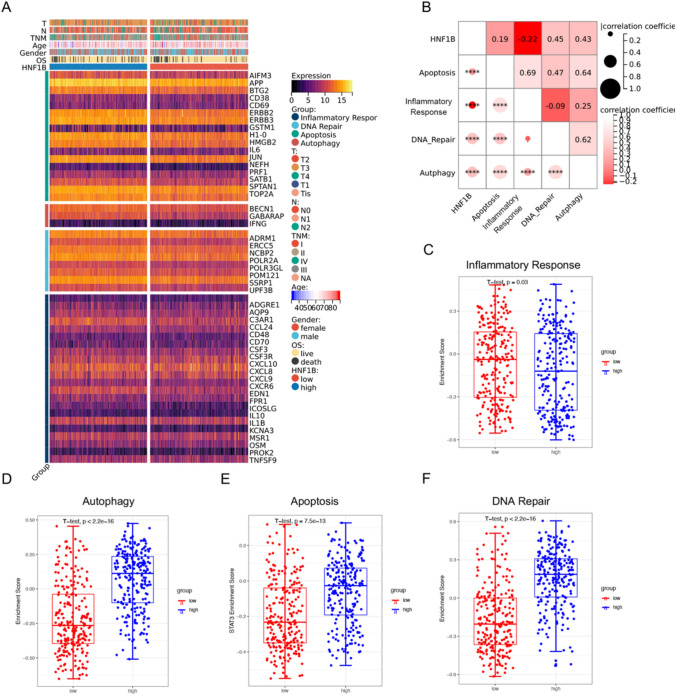
To further substantiate the correlations between HNF1B and the inflammatory response, autophagy, apoptosis, and DNA repair pathways in COAD, as indicated by GO, KEGG, and GSEA analyses, we examined the expression of pivotal genes in these signaling pathways in the high and low HNF1B expression subgroups from the TCGA cohort. The heatmap demonstrated that genes associated with autophagy, apoptosis, and DNA repair were predominantly downregulated in the low HNF1B expression subgroup, whereas inflammatory response genes exhibited a similar trend in the low HNF1B expression subgroup (Fig. 4A). GSVA and correlograms revealed notable differences in the activation of these pathways between the high and low HNF1B expression groups (Figs. 4B–F and S3C, D).
Fig. 4.
The relationship between HNF1B and four tumorigenic pathways. A Heatmap was used to visualize Inflammatory response, DNA repair, Apoptosis and Autophagy gene expression profiles. B Correlogram was generated based on Pearson analysis between HNF1B expression and the four tumorigenic pathways. C Differences in Inflammatory Response pathway (D) Autophagy pathway (E) Apoptosis pathway (F) DNA Repair pathway between high HNF1B and low HNF1B groups. Correlation analyses were performed using Pearson correlation tests (two-sided). P values of less than 0.05 were considered significant. Data are presented as mean values ± s.d. Data we analyzed by two-sided unpaired Student's t-test. (*p < 0.05; **p < 0.01; ***p < 0.001)
Correlations between immune cell infiltration patterns and HNF1B in COAD
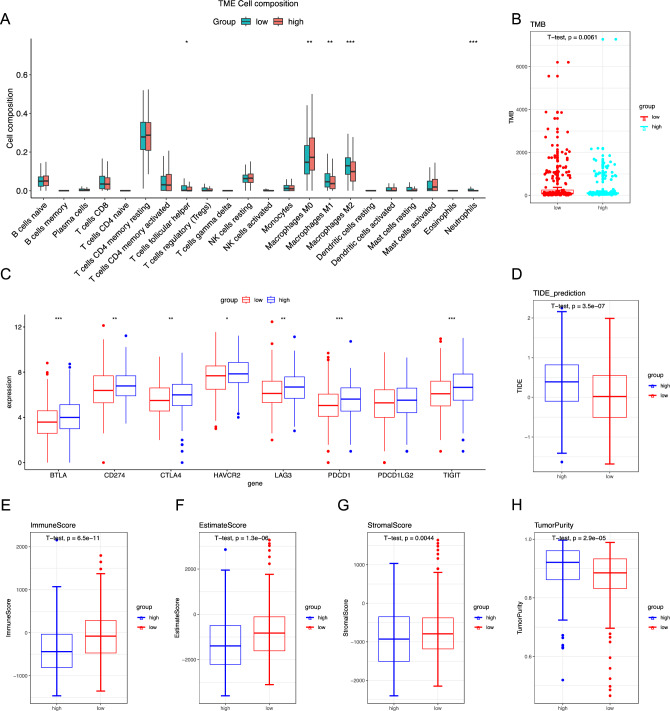
To elucidate the relationship between HNF1B expression and immune cell infiltration in the tumor microenvironment, we employed the CIBERSORT algorithm to determine the relative proportions of infiltrating immune cells. Figure 5A shows the estimated distributions of 22 immune cell types in the high-expression and low-expression groups. Compared with the high-expression group, the low-expression group exhibited significantly greater infiltration of follicular helper T cells, M1 macrophages, M2 macrophages, and neutrophils. Conversely, the high-expression group presented a significantly lower proportion of M0 macrophages. While differences in T cell and macrophage infiltration were noted, HNF1B expression was absent in our single-cell data, possibly due to its mitochondrial localization, which may hinder detection in single-cell analyses (Figs. S5 and S6).
Fig. 5.
Immune infiltration and immunotherapy response in patients from the TCGA–COAD cohort. A The abundance of different infiltrating immune cells in the two risk subgroups. B Tumor mutational burden (TMB) in both groups. C Immune checkpoint gene expression in high HNF1B and low HNF1B groups in TCGA-COAD cohort. D The TIDE prediction score in both groups (E–H) The Estimation of Stromal and Immune cells in Malignant Tumors using Expression data (ESTIMATE) analyses of the TCGA–COAD cohort, Data are presented as mean values ± s.d. Data were analyzed by two-sided unpaired Student's t-test. (*p < 0.05; **p < 0.01; ***p < 0.001)
Furthermore, we investigated the expression of immune checkpoint genes and observed notable increases in the expression levels of BTLA, CD274, CTLA4, HAVCR2, LAG3, PDCD1, PDCD1LG2, and TIGIT in the high-expression group (Fig. 5C). These findings indicate that patients with high HNF1B expression may exhibit a greater response to immunotherapy. Further analysis of the tumor mutational burden (TMB) revealed that the low-expression group presented a greater TMB (Fig. 5B). Furthermore, the ESTIMATE algorithm was employed to evaluate immune and stromal cell infiltration, revealing that the low-expression group presented elevated immune, stromal, and ESTIMATE scores (Fig. 5E–G). Conversely, tumor purity was lower in the low-expression group than in the high-expression group (Fig. 5H). Collectively, these findings suggest that immunotherapy may be more advantageous for low-risk patients with an active immune response.
A comprehensive analysis of drug sensitivity
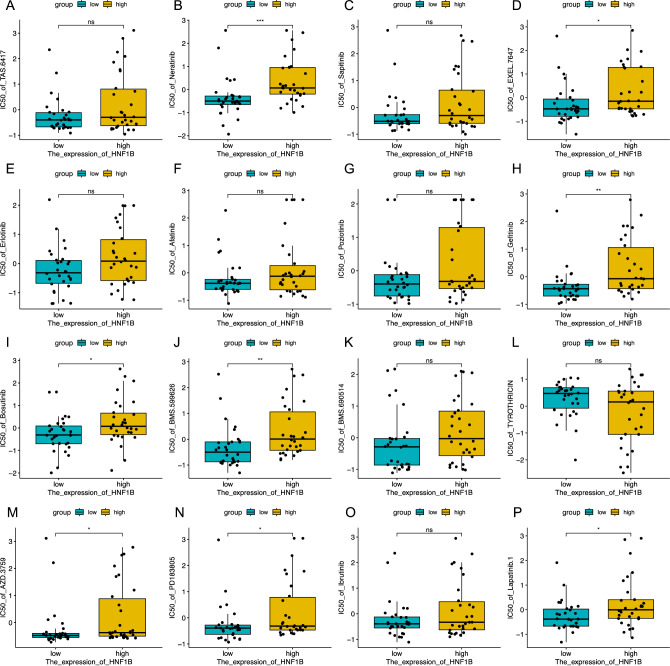
Using the CellMiner database, an investigation was conducted to determine the correlation between HNF1B expression and drug sensitivity to identify potential pharmaceutical agents for patients with low HNF1B levels. These findings indicate that patients with reduced HNF1B expression exhibit heightened sensitivity to a range of pharmacological agents. By employing processed data from the CellMiner database, we were able to estimate the disparate degrees of chemosensitivity exhibited by patients with low and high HNF1B expression. The results demonstrated that the group with low expression exhibited greater sensitivity to several chemotherapeutic agents, including TKI inhibitors (neratinib, gefitinib, lapatinib, AZD.3759, and bosutinib), EGFR inhibitors (EXEL.7647), HER2 inhibitors (BMS.599626), and ERBB inhibitors (PD183805). With respect to drugs such as erlotinib, afatinib, poziotinib, sapitinib, and ibrutinib, the low-expression group exhibited greater sensitivity than did the high-expression group, although these differences were not statistically significant (Fig. 6). Furthermore, correlation analysis revealed a positive correlation between HNF1B expression and the IC50 values of numerous drugs, with only a few, such as thyrothricin, exhibiting a negative correlation (Fig. S4). These findings suggest that high HNF1B expression may be associated with drug resistance in tumor cells.
Fig. 6.
Analysis of Drug Sensitivity. Analysis of Drug Sensitivity in high HNF1B and low HNF1B groups, Data are presented as mean values ± s.d. Data were analyzed by two-sided unpaired Student's t-test. (*p < 0.05; **p < 0.01; ***p < 0.001)
HNF-1β and immunotherapy biomarkers have synergistic effects on cancer immunotherapy
Immunotherapy has emerged as a highly efficacious clinical strategy for the treatment of cancer. A comprehensive understanding of the mechanisms underlying the clinical response and treatment resistance is essential for further expanding the clinical benefits of immunotherapy. Among these therapeutic modalities, immune checkpoint inhibitors (ICBs) and cytokine treatments, including IFNG and IL2, play pivotal roles in cancer immunotherapy, with favorable outcomes observed in some patients. A substantial body of evidence has revealed the interference and synergistic effects associated with ICB therapies. For example, targeting of the IFNγ-PKM2-β-catenin axis has been demonstrated to prevent HPD in preclinical models, whereas TGF-β has been shown to facilitate anti-PD-L1 therapy in urothelial cancer. As previously stated, functional enrichment analysis indicated that HNF1B expression is associated with immune-related pathways in COAD and immunotherapy. Accordingly, we further investigated the role of HNF1B in immunotherapy via a comprehensive RNA-seq dataset comprising 348 urothelial cancer patients who had been treated with the anti-PD-L1 drug atezolizumab (Table S1). The term "responders" was used to describe patients who achieved a complete response (CR) or partial response (PR), whereas the term "nonresponses" was used to describe patients who exhibited stable disease (SD) or progressive disease (PD). Patients with low HNF1B expression exhibited a poor prognosis among those with metastatic urothelial cancer. Although the p value was not statistically significant when comparing the CR/PR and SD/PD groups, it indicated a potential adverse effect of HNF1B on the atezolizumab response (Fig. S7A). Moreover, the expression and prognosis of PD-1, PD-L1, CTLA-4, CD20, and IFNγ in this cohort were examined, and effects analogous to those observed for HNF1B were identified (Fig. S7B–F).
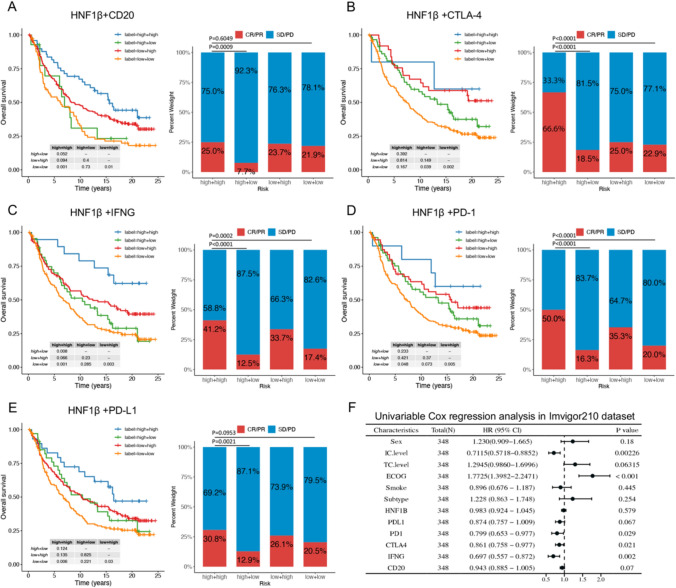
The cohort was classified into four subgroups on the basis of the expression levels of HNF1B and CD20, CTLA-4, IFNG, PD-1, and PDL1. Analysis of the HNF1B and CD20 subgroups revealed that patients with low expression of both HNF1B and CD20 presented the poorest prognosis. High HNF1B expression mitigated some of the adverse effects associated with low CD20 expression on survival outcomes. The subgroup exhibiting low HNF1B and high CD20 expression presented a prognosis comparable to that of the subgroup with high HNF1B and low CD20 expression (Fig. 7A, Table S2). Significant differences in the response to atezolizumab were observed among the four subgroups. Patients with high expression of both HNF1B and CD20 presented the greatest response to atezolizumab immunotherapy, whereas those with high HNF1B and low CD20 expression presented the lowest response, followed by the group with low expression of both markers (Fig. 7A). A comparison of the second and fourth bars, as well as the first and third bars in Fig. 7A, indicated that higher HNF1B levels enhanced the response to atezolizumab mediated by CD20. Conversely, CD20 was found to significantly influence the ability of HNF1B to enhance the response to immunotherapy (p = 0.0133 and p = 0.0013, Fig. 7A). Similar patterns were observed for CTLA-4, IFNG, PD-1, and PD-L1. These findings indicate that HNF1B and CD20, in conjunction with CTLA-4, IFNG, PD-1, and PD-L1, exert a synergistic influence on patient prognosis and the efficacy of ICB therapy (Fig. 7B–E).
Fig. 7.
HNF1B and Immunotherapy biomarkers had a synergistic effect on cancer immunotherapy. HNF1B and CD20 (A), CTLA-4 (B), IFN-γ (C), PD-1 (D), PD-L1 (E) had a synergistic effect on reduced overall survival and response to therapy response of urothelial cancer patients treated with PD-L1 blockade. F Univariable Cox regression analysis in Imvigor210 dataset. Differences in survival between groups were assessed using the log-rank test, with a significance level set at p < 0.05. Bar graph showing the distribution of CR/PR and SD/PD across different groups. The chi-square test was performed to evaluate the association between two groups. (*p < 0.05; **p < 0.01; ***p < 0.001)
Inhibition of HNF1B expression has been demonstrated to significantly promote colon adenocarcinoma cell proliferation and migration and regulate epithelial‒mesenchymal transition (EMT) and inflammatory biomarker expression
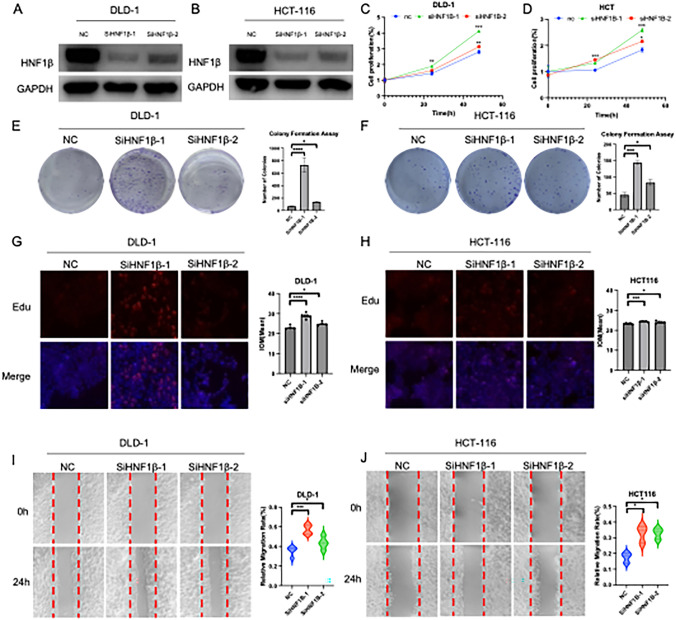
To corroborate the findings of the bioinformatic analysis, a series of in vitro experiments were conducted. The efficacy of HNF1B siRNA knockdown in the DLD-1 and HCT116 cell lines was corroborated by Western blot analysis (Fig. 8A, B). A CCK8 assay was used to determine the impact of HNF1B knockdown on the proliferation of HCT116 and DLD-1 cells. The results demonstrated a notable increase in proliferation following HNF1B knockdown (Fig. 8C, D). Colony formation assays demonstrated that HNF1B knockdown resulted in a statistically significant increase in the number of colonies formed by DLD-1 and HCT116 cells (Fig. 8E, F). Furthermore, the EdU staining results demonstrated that HNF1B knockdown markedly increased the proliferation rates of DLD-1 and HCT116 cells compared with those in the control group (Fig. 8G, H). Given the potential role of HNF1B in regulating cell migration, wound healing assays were conducted, which demonstrated that HNF1B knockdown significantly enhanced cell migration (Fig. 8I, J).
Fig. 8.
Inhibition of HNF1β can significantly promote colon adenocarcinoma cell proliferation, immigration in vitro. Protein levels of HNF1β post-siRNA transfection in DLD-1 (A) and HCT-116 (B). GAPDH was used as an internal control. C, D Cell proliferation, E, F Colony formation, G, H EDU staining assay and I, J wound healing assay was performed and quantified post-siRNA transfection. The results were acquired from triplicated experiments. Data are presented as mean values ± s.d. Data were analyzed by two-sided unpaired Student's t-test. (*p < 0.05; **p < 0.01; ***p < 0.001)
As evidenced by previous single-cell RNA seq analyses and published literature, HNF1B is expressed in tumor cells and epithelial cells (Figs. S5 and S6). Therefore, the primary mechanisms by which HNF1B affects COAD progression may involve EMT and the inflammatory response. To test this hypothesis, Western blot analyses were conducted to examine whether HNF1B influences the expression of EMT-related proteins. Our findings indicated that E-cadherin protein levels significantly decreased following HNF1B knockdown in the DLD-1 and HCT116 cell lines, confirming the role of HNF1B in the EMT process in COAD cells (Fig. S8 B, C). Moreover, qPCR analysis demonstrated that HNF1B markedly influences the transcription levels of Kras, STAT1, ACKR3, and CXCL12R (Fig. S8 D–F), substantiating our hypothesis. In conclusion, the absence of HNF1B is associated with an increased risk of COAD progression, with EMT and the inflammatory response representing the underlying mechanisms. Our results demonstrated that reduced HNF1B expression is associated with increased proliferation and migration in colorectal cancer cell lines, and it also influences the mRNA expression of downstream immune signaling molecules,
Discussion
HNF-1β is an effective and specific marker for the diagnosis of intrahepatic cholangiocarcinoma (iCCA) and the identification of the cholangiocarcinoma (CCA) component in combined hepatocellular-cholangiocarcinoma (cHCC-CCA). The absence of HNF-1β expression may be used to exclude the possibility of iCCA in cases of adenocarcinomas of unknown primary origin. HNFs play pivotal roles in the regulation of liver-specific gene expression, metabolism, development, cell growth, and a multitude of cellular functions. These genes are activated or influenced by hormones and insulin-like growth factors (IGFs), and different combinations of the four HNF factors form a network that controls the expression of liver-specific or liver-enriched genes [23]. As transcription factors, HNFs regulate liver development and differentiation and maintain liver function by controlling the expression of downstream genes. Furthermore, HNF-1B is a valuable biomarker for diagnosing pancreatic ductal adenocarcinoma (PDAC) when used in conjunction with other lineage-specific biomarkers [24]. In a genome-wide association study, HNF1B variants were identified and analyzed for their association with endometrial cancer in large case‒control studies within two prospective cohorts. Next-generation sequencing revealed HNF1B methylation in ovarian cancer (OC) patients, which was associated with specific clinicopathological characteristics [25]. Research in clear cell renal cell carcinoma (ccRCC) and chromophobe renal cell carcinoma (chRCC) indicates that while HNF1B functions as an oncogene in papillary renal cell carcinoma, it may act as a tumor suppressor [26]. This study is the first to comprehensively examine the relationship between HNF1B expression levels and immunotherapy response in colon adenocarcinoma (COAD). The potential value of HNF1B as a candidate target for tumor immune microenvironment (TIME) immunotherapy across various solid cancers was investigated. The results of our study indicate that patients with low HNF1B expression demonstrate reduced benefit from various immunotherapies, including anti-PD1/L1 and anti-CTLA4 treatments.
Furthermore, we investigated the relationship between HNF1B and established immunotherapy biomarkers, including the TMB and TIDE score. In COAD, a negative correlation was observed between HNF1B stromal component scores and estimation scores. The TIDE score is becoming increasingly recognized as a predictive indicator of immunotherapy response and survival rates. The results demonstrate that patients with low HNF1B expression in COAD exhibit elevated TIDE scores, indicating suboptimal immunotherapy efficacy and a correlation with unfavorable prognosis. In conclusion, low HNF1B expression may be associated with immunotherapy resistance.
To date, clinical trials and pharmacological interventions targeting HNF1B remain limited. However, animal studies have demonstrated that HNF1B mutations are linked to hypomagnesemia and renal magnesium excretion, and a magnesium-deficient diet in rats has been shown to upregulate HNF1B expression [27]. In a study examining HNF1B expression in ovarian clear cell tumors, significant differences in protein levels were observed between clear cell carcinoma and non-clear cell carcinoma, highlighting its potential as a molecular marker for ovarian clear cell carcinoma [28]. Elevated HNF1B expression is strongly associated with glutathione metabolism and chemotherapy resistance in ovarian clear cell carcinoma, and its abnormal expression may facilitate tumor cell survival and growth [29, 30]. In post-liver transplantation patients, Regulation of AFP expression at the transcriptional level by HNF1B may contribute to various stages of hepatocellular carcinoma progression following recurrence, suggesting that HNF1B expression could serve as a predictive marker for liver cancer recurrence [20, 31]. While clinical research on HNF1B in colorectal cancer is sparse, our findings suggest that its differential expression is correlated with survival and recurrence in COAD, offering a novel biomarker for the future diagnosis of COAD.
EGFR-TKI inhibitors constitute one of the earliest classes of targeted drugs to be developed for the treatment of cancer. However, as these drugs are employed in clinical practice and treatment progresses, additional resistance mechanisms have been identified in various tumor patients [32–34]. Previous studies have demonstrated that the downregulation of HNF1B can regulate drug resistance-related biological processes, thereby promoting cisplatin resistance in ovarian cancer [35]. Additionally, HNF1B has been linked to insulin resistance in hepatic metabolism, as evidenced by studies [36, 37]. Nevertheless, research examining its correlation with EGFR and HER2 inhibitor drug resistance remains scarce. The present study revealed that patients with low HNF1B expression presented greater sensitivity to EGFR-TKI treatment than did those with high HNF1B expression. These findings suggest that high HNF1B expression may be associated with resistance to EGFR-TKIs and HER2 inhibitors, thereby providing a direction for further research.
To elucidate the immune-related roles of HNF1B in the TIME, our study demonstrated a close relationship between HNF1B levels and stromal scores, immune scores, and ESTIMATE scores. Notably, HNF1B was found to be positively correlated with the infiltration of various immune cells, particularly M1 and M2 macrophages. Although research on the influence of HNF1B on macrophages is scarce, it has been demonstrated that SUMOylation of HNF1B in atherosclerosis facilitates its inhibition of sortilin expression, thereby reducing the lipid content in macrophages [38]. Our findings first revealed an association between HNF1B and macrophages, thereby establishing a potential link between HNF1B dysregulation and immunotherapy resistance in COAD. Furthermore, the relationships between HNF1B and various novel immune checkpoints were evaluated, and positive correlations were identified between HNF1B and key immunotherapy response effectors, including BTLA, LAG3, PDCD1, CTLA4, CD274, and TIGIT, in COAD. However, the limitation of this study was validated exclusively through bioinformatics analysis and in vitro experiments, lacking sufficient in vivo experimentation and a thorough investigation of the underlying mechanisms. Additionally, our research was limited to colorectal adenocarcinoma, without extending to other cancer types. These findings indicate that HNF1B may play a pivotal role in the tumor immune microenvironment (TIME) across a range of tumor types.
The present study revealed that low HNF1B expression is associated with a protumor role in COAD. However, further experimental data are needed to validate the bioinformatics analysis results and elucidate the related molecular pathways, including HNF1B regulation of immune expression, autophagy, and EMT mechanisms. Further research is needed to elucidate the synergistic effects of novel immune checkpoint inhibitors and HNF1B on poor patient ICB treatment response. Moreover, further validation is needed to ascertain the carcinogenic impact of HNF1B in other cancer types. Furthermore, it would be beneficial to explore the potential of corresponding targeted drugs for HNF1B.
Materials and methods
Data collection and processing
We utilized data from four independent databases for our study, including transcriptomic sequencing and clinical information from 512 COAD patients in the TCGA database (https://portal.gdc.cancer.gov/). The GSE39582 dataset was utilized to demonstrate and validate a multi-molecular signature for molecular stratification in colorectal cancer [39]. Both GSE17538 and GSE17536 datasets provide gene expression profiles of highly metastatic and invasive colorectal cancer cells, used to investigate the risks of recurrence and mortality in colorectal cancer. GSE17538 includes a training cohort and a validation cohort, whereas GSE17536 serves as an independent validation cohort [40, 41]. The GSE33113 dataset was employed to evaluate the risk of recurrence and metastasis in colorectal cancer patients following surgical resection [42]. Additionally, we downloaded pathological specimens from the publicly available pathology database HPA (https://www.proteinatlas.org/). R version 4.3.1 software was used to normalize and process the data. The RNA-seq and clinical data of the urothelial cancer cohort were obtained from IMvigor210.
Survival analysis and meta-analysis
The associations between HNF1B expression levels and clinical outcomes in patients with COAD, as well as the combined impact of HNF1B with CTLA4, PD-L1, PD-1, and IFNγ on postimmunotherapy outcomes, were analyzed via the "survival" R package in the TCGA, GEO, and IMvigor210 datasets. The log-rank test was used to assess the statistical significance of differences between survival curves. Meta-analysis was conducted via the Sangerbox online tool [43].
Immune cell infiltration and tumor microenvironment analysis
We applied the CIBERSORT algorithm in the R package to analyze the immune infiltration relationships of different genes across 22 cell types from the TCGA database. The immune score, estimate score, stromal score, and tumor purity were evaluated via the estimate algorithm in R. The tumor mutation burden (TMB) was computed via the maftools package in R. Furthermore, the tumor immune dysfunction and exclusion (TIDE) scores were retrieved from a web-based tool (http://tide.dfci.harvard.edu/).
Functional enrichment analysis
We performed differential expression gene (DEG) analysis on COAD cases with varying HNF1B expression levels via the TCGA dataset. A volcano plot was generated to display the fold changes and p values of DEGs between the high and low HNF1B expression groups. Additionally, a heatmap was used to visualize the expression patterns of genes related to the inflammatory response, DNA repair, apoptosis, and autophagy across these groups. Gene Ontology (GO) and Kyoto Encyclopedia of Genes and Genomes (KEGG) pathway analyses were conducted on the identified genes via the R packages "clusterProfiler," "org.Hs.eg.db," "enrichplot," and "ggplot2".
GSVA and GSEA
We employed GSVA to assess the associations between HNF1B and various cell death pathways in the TCGA and GEO datasets. The GSVA scores indicate the degree of gene set enrichment in the samples. To explore the relationships between HNF1B and the four tumorigenesis pathways, we conducted Pearson’s correlation analysis. Additionally, hallmark term and GO term analyses were performed via GSEA software (V.4.1.0) to identify relevant signaling pathways in groups with high and low HNF1B expression.
Cell culture and transfection
The COAD cell lines DLD-1 and HCT116 were obtained from the American Type Culture Collection (ATCC). The cells were cultured according to the protocols provided on the ATCC website. In accordance with the manufacturer's instructions, DLD-1 and HCT116 cells were transfected twice with 50 nM double-stranded siRNA oligonucleotides synthesized by GenePharma (Biotech, Shanghai, China). The sequences for HNF1B siRNA were as follows: siHNF1B-1: 5’-3’ GGAAUGCAACAGGGCAGAATT, 3’-5’ UUCUGCCCUGUUGCAUUCCTT; siHNF1B-2: 5’-3’ GCUCCUCUCCUCCAAACAATT, 3’-5’ UUGUUUGGAGGAGAGGAGCTT. Cell transfections were carried out via either Lipofectamine 3000 or GP-transfect-mate (GenePharma, Shanghai, China).
CCK-8 assay
The COAD cell lines DLD-1 and HCT116 were subjected to transfection via either siRNAs specifically designed to target HNF1B or a negative control vector that served as a baseline reference. After successful transfection, these cells were carefully seeded into 96-well plates, with each well containing a uniform density of 2000 cells to ensure consistency across all experimental conditions. The cells were then allowed to incubate for 24, 48, or 72 h to assess the impact of HNF1B knockdown over time. At each of these time points, 10 μL of CCK-8 reagent was added to each well to facilitate the quantification of cell viability. This reagent interacted with the cells during a subsequent 2-h incubation period, after which the optical density was meticulously measured at 450 nm. This measurement provided critical data on the metabolic activity and viability of the cells, reflecting the effects of HNF1B suppression on cell proliferation.
EDU staining and quantification
The cells were cultured and treated following the established experimental protocol. EDU (10 μM) was added to the culture medium, which was subsequently incubated at 37 °C for 2 h. After incubation, the cells were fixed and permeabilized. The cells were subsequently incubated with the Click-iT reaction cocktail (Invitrogen) according to the manufacturer’s guidelines. Nuclei were counterstained with Hoechst. Proliferation rates were assessed by counting the number of EDU-positive cells observed under a fluorescence microscope and analyzing at least five random fields per sample. The number of positive stained cells was then calculated and compared across the different experimental conditions. The staining intensity was quantified via ImageJ 2.9.0.
Wound healing assay
The cells were grown to confluence in a 6-well plate, and a sterile 200 μL pipette tip was used to create a wound. The detached cells were removed with PBS. Images of the wound area were captured at various times via an inverted microscope. The degree of wound closure was determined by measuring the residual wound width.
Statistical analysis
Data analysis was conducted via R version 4.3.1 and GraphPad Prism 9. Statistical analyses and the number of samples (n) were described in detail for each figure panel. Prognostic differences were evaluated via the log-rank test. Hazard ratios were computed with a univariate Cox regression model. Survival data are represented by Kaplan–Meier curves, and tests for different groups were conducted with log-rank test (two-sided) statistics Spearman correlation coefficients were calculated to assess the relationships between HNF1B and gene sets related to the inflammatory response, autophagy, apoptosis, and DNA repair. Group differences were assessed via a two-tailed unpaired Student’s t test. The results are presented as the means ± SDs, with P values less than 0.05 regarded as statistically significant.
Supplementary Information
Below is the link to the electronic supplementary material.
Acknowledgements
We are very grateful to TCGA database and GEO datasets for providing valuable data resources.
Author contributions
Author Contributions: Conceptualization, F.G., W.G; methodology, F.G, H.Y and W.G; software, Z.Z and H.H; validation, Z.Z. and F.G.; formal analysis, H.H.; writing—original draft preparation, F.G.; writing—review and editing, F.G. and Y.G.; visualization, W.G.; supervision, F.S, Y.G, J.H.; project administration, F.S, Y.G, J.H.; funding acquisition, F.S, Y.G, J.H. All authors have read and agreed to the published version of the manuscript.
Funding
This work was supported by the National Key R&D Program of China (2023YFC3503200, 2023YFC3503205; 2021YFC2501900), the National Natural Science Foundation of China (82188102; 32100574, 82372812; 82122053), the Beijing Municipal Science & Technology Commission (Z191100006619115), CAMS Initiative for Innovative Medicine (2021-I2M-1–012, 2021-I2M-1–015; 2021-I2M-1–067), Aiyou Foundation (KY201701), R&D Program of Beijing Municipal Education Commission (KJZD20191002302), Key-Area Research and Development Program of Guangdong Province (2021B0101420005), Shenzhen Science and Technology Program (RCJC20221008092811025, ZDSYS20220606101604009), Shenzhen High-level Hospital Construction Fund, and Sanming Project of Medicine in Shenzhen (SZSM202211011).
Data availability
Only publicly available data were used in this study. The datasets used are available from the corresponding author on reasonable request.
Declarations
Conflict of interest
The authors declare no competing interests.
Footnotes
Publisher's Note
Springer Nature remains neutral with regard to jurisdictional claims in published maps and institutional affiliations.
Fushan Gao and Wenlin Gong have contributed equally to this work and are co-first authors.
Contributor Information
Fei Shao, Email: shaofei@cicams.ac.cn.
Yibo Gao, Email: gaoyibo@cicams.ac.cn.
Jie He, Email: hejie@cicams.ac.cn.
References
- 1.Lau HH, Ng NHJ, Loo LSW, Jasmen JB, Teo AKK (2018) The molecular functions of hepatocyte nuclear factors - in and beyond the liver. J Hepatol 68:1033–1048. 10.1016/j.jhep.2017.11.026 [DOI] [PubMed] [Google Scholar]
- 2.Azmi AS, Bao GW, Gao J, Mohammad RM, Sarkar FH (2013) Network insights into the genes regulated by hepatocyte nuclear factor 4 in response to drug induced perturbations: a review. Curr Drug Discov Technol 10:147–154. 10.2174/1570163811310020007 [DOI] [PMC free article] [PubMed] [Google Scholar]
- 3.Arruabarrena-Aristorena A, Maag JLV, Kittane S et al (2020) FOXA1 mutations reveal distinct chromatin profiles and influence therapeutic response in breast cancer. Cancer Cell 38:534–50.e9. 10.1016/j.ccell.2020.08.003 [DOI] [PMC free article] [PubMed] [Google Scholar]
- 4.Liu Y, Yu K, Kong X et al (2023) FOXA1 O-GlcNAcylation-mediated transcriptional switch governs metastasis capacity in breast cancer. Sci Adv 9:eadg7112. 10.1126/sciadv.adg7112 [DOI] [PMC free article] [PubMed] [Google Scholar]
- 5.Shou J, Lai Y, Xu J, Huang J (2016) Prognostic value of FOXA1 in breast cancer: a systematic review and meta-analysis. Breast 27:35–43. 10.1016/j.breast.2016.02.009 [DOI] [PubMed] [Google Scholar]
- 6.Mendel DB, Hansen LP, Graves MK, Conley PB, Crabtree GR (1991) HNF-1 alpha and HNF-1 beta (vHNF-1) share dimerization and homeo domains, but not activation domains, and form heterodimers in vitro. Genes Dev 5:1042–1056. 10.1101/gad.5.6.1042 [DOI] [PubMed] [Google Scholar]
- 7.Wang J, He C, Gao P et al (2020) HNF1B-mediated repression of SLUG is suppressed by EZH2 in aggressive prostate cancer. Oncogene 39:1335–1346. 10.1038/s41388-019-1065-2 [DOI] [PMC free article] [PubMed] [Google Scholar]
- 8.Shen H, Fridley BL, Song H et al (2013) Epigenetic analysis leads to identification of HNF1B as a subtype-specific susceptibility gene for ovarian cancer. Nat Commun 4:1628. 10.1038/ncomms2629 [DOI] [PMC free article] [PubMed] [Google Scholar]
- 9.Tommasi S, Karm DL, Wu X, Yen Y, Pfeifer GP (2009) Methylation of homeobox genes is a frequent and early epigenetic event in breast cancer. Breast Cancer Res 11:R14. 10.1186/bcr2233 [DOI] [PMC free article] [PubMed] [Google Scholar]
- 10.Quilichini E, Fabre M, Dirami T et al (2019) pancreatic ductal deletion of Hnf1b disrupts exocrine homeostasis, leads to pancreatitis, and facilitates tumorigenesis. Cell Mol Gastroenterol Hepatol 8:487–511. 10.1016/j.jcmgh.2019.06.005 [DOI] [PMC free article] [PubMed] [Google Scholar]
- 11.Yamaguchi K, Mandai M, Oura T, Matsumura N, Hamanishi J, Baba T, Matsui S, Murphy SK, Konishi I (2010) Identification of an ovarian clear cell carcinoma gene signature that reflects inherent disease biology and the carcinogenic processes. Oncogene 29:1741–1752. 10.1038/onc.2009.470 [DOI] [PubMed] [Google Scholar]
- 12.Oda K, Hamanishi J, Matsuo K, Hasegawa K (2018) Genomics to immunotherapy of ovarian clear cell carcinoma: unique opportunities for management. Gynecol Oncol 151:381–389. 10.1016/j.ygyno.2018.09.001 [DOI] [PMC free article] [PubMed] [Google Scholar]
- 13.Akasaka J, Uekuri C, Shigetomi H, Koike M, Kobayashi H (2013) Hepatocyte nuclear factor (HNF)-1β and its physiological importance in endometriosis. Biomed Rep 1:13–17. 10.3892/br.2012.19 [DOI] [PMC free article] [PubMed] [Google Scholar]
- 14.Haynes AL, Healy AM (2019) HNF1B diabetes or maturity-onset diabetes of the young type 5 with rare HNF1B mutation: a case report. Clin Diabetes 37:180–182. 10.2337/cd18-0033 [DOI] [PMC free article] [PubMed] [Google Scholar]
- 15.Dekker E, Tanis PJ, Vleugels JLA, Kasi PM, Wallace MB (2019) Colorectal cancer. Lancet 394:1467–1480. 10.1016/s0140-6736(19)32319-0 [DOI] [PubMed] [Google Scholar]
- 16.Bray F, Laversanne M, Sung H, Ferlay J, Siegel RL, Soerjomataram I, Jemal A (2024) Global cancer statistics 2022: GLOBOCAN estimates of incidence and mortality worldwide for 36 cancers in 185 countries. CA Cancer J Clin 74:229–263. 10.3322/caac.21834 [DOI] [PubMed] [Google Scholar]
- 17.Siegel RL, Giaquinto AN, Jemal A (2024) Cancer statistics, 2024. CA Cancer J Clin 74:12–49. 10.3322/caac.21820 [DOI] [PubMed] [Google Scholar]
- 18.Biller LH, Schrag D (2021) Diagnosis and treatment of metastatic colorectal cancer: a review. JAMA 325:669–685. 10.1001/jama.2021.0106 [DOI] [PubMed] [Google Scholar]
- 19.Van Cutsem E, Cervantes A, Adam R et al (2016) ESMO consensus guidelines for the management of patients with metastatic colorectal cancer. Ann Oncol 27:1386–1422. 10.1093/annonc/mdw235 [DOI] [PubMed] [Google Scholar]
- 20.Yu DD, Jing YY, Guo SW et al (2015) Overexpression of hepatocyte nuclear factor-1beta predicting poor prognosis is associated with biliary phenotype in patients with hepatocellular carcinoma. Sci Rep 5:13319. 10.1038/srep13319 [DOI] [PMC free article] [PubMed] [Google Scholar]
- 21.Nie C, Wang B, Wang B, Lv N, Zhang E (2020) Integrative analysis of HNF1B mRNA in human cancers based on data mining. Int J Med Sci 17:2895–2904. 10.7150/ijms.51213 [DOI] [PMC free article] [PubMed] [Google Scholar]
- 22.Chandra S, Srinivasan S, Batra J (2021) Hepatocyte nuclear factor 1 beta: a perspective in cancer. Cancer Med 10:1791–1804. 10.1002/cam4.3676 [DOI] [PMC free article] [PubMed] [Google Scholar]
- 23.Huang WT, Weng CF (2010) Roles of hepatocyte nuclear factors (HNF) in the regulation of reproduction in teleosts. J Fish Biol 76:225–239. 10.1111/j.1095-8649.2009.02480.x [DOI] [PubMed] [Google Scholar]
- 24.Bai S, Lindberg J, Whalen G, Bathini V, Zou J, Yang MX (2021) Utility of HNF-1B and a panel of lineage-specific biomarkers to optimize the diagnosis of pancreatic ductal adenocarcinoma. Am J Cancer Res 11:858–865 [PMC free article] [PubMed] [Google Scholar]
- 25.Bubancova I, Kovarikova H, Laco J, Ruszova E, Dvorak O, Palicka V, Chmelarova M (2017) Next-generation sequencing approach in methylation analysis of HNF1B and GATA4 genes: searching for biomarkers in ovarian cancer. Int J Mol Sci. 10.3390/ijms18020474 [DOI] [PMC free article] [PubMed] [Google Scholar]
- 26.Bártů M, Hojný J, Hájková N et al (2020) Analysis of expression, epigenetic, and genetic changes of HNF1B in 130 kidney tumours. Sci Rep 10:17151. 10.1038/s41598-020-74059-z [DOI] [PMC free article] [PubMed] [Google Scholar]
- 27.Martin H, Antoine D, Coste-Sarguet L, Seydou Sarr F, Richert L, Berthelot A (2017) Magnesium deficiency affects HNF1B expression in rat liver in vivo and in vitro. Magnes Res 30:98–105. 10.1684/mrh.2017.0428 [DOI] [PubMed] [Google Scholar]
- 28.Kato N, Motoyama T (2008) Overexpression of osteopontin in clear cell carcinoma of the ovary: close association with HNF-1beta expression. Histopathology 52:682–688. 10.1111/j.1365-2559.2008.03006.x [DOI] [PubMed] [Google Scholar]
- 29.Lopes-Coelho F, Gouveia-Fernandes S, Gonçalves LG, Nunes C, Faustino I, Silva F, Félix A, Pereira SA, Serpa J (2016) HNF1B drives glutathione (GSH) synthesis underlying intrinsic carboplatin resistance of ovarian clear cell carcinoma (OCCC). Tumour Biol 37:4813–4829. 10.1007/s13277-015-4290-5 [DOI] [PubMed] [Google Scholar]
- 30.Amano Y, Mandai M, Yamaguchi K et al (2015) Metabolic alterations caused by HNF1B expression in ovarian clear cell carcinoma contribute to cell survival. Oncotarget 6:26002–26017. 10.18632/oncotarget.4692 [DOI] [PMC free article] [PubMed] [Google Scholar]
- 31.Shim JH, Lee HC, Han S, Kang HJ, Yu E, Lee SG (2013) Hepatocyte nuclear factor 1β is a novel prognostic marker independent of the Milan criteria in transplantable hepatocellular carcinoma: a retrospective analysis based on tissue microarrays. Liver Transpl 19:336–345. 10.1002/lt.23584 [DOI] [PubMed] [Google Scholar]
- 32.Guardiola S, Varese M, Sánchez-Navarro M, Giralt E (2019) A third shot at EGFR: new opportunities in cancer therapy. Trends Pharmacol Sci 40:941–955. 10.1016/j.tips.2019.10.004 [DOI] [PubMed] [Google Scholar]
- 33.Nathanson DA, Gini B, Mottahedeh J et al (2014) Targeted therapy resistance mediated by dynamic regulation of extrachromosomal mutant EGFR DNA. Science 343:72–76. 10.1126/science.1241328 [DOI] [PMC free article] [PubMed] [Google Scholar]
- 34.Lev S (2020) Targeted therapy and drug resistance in triple-negative breast cancer: the EGFR axis. Biochem Soc Trans 48:657–665. 10.1042/bst20191055 [DOI] [PubMed] [Google Scholar]
- 35.Li J, Zhang Y, Gao Y, Cui Y, Liu H, Li M, Tian Y (2014) Downregulation of HNF1 homeobox B is associated with drug resistance in ovarian cancer. Oncol Rep 32:979–988. 10.3892/or.2014.3297 [DOI] [PubMed] [Google Scholar]
- 36.Kornfeld JW, Baitzel C, Könner AC et al (2013) Obesity-induced overexpression of miR-802 impairs glucose metabolism through silencing of Hnf1b. Nature 494:111–115. 10.1038/nature11793 [DOI] [PubMed] [Google Scholar]
- 37.Hosoe J, Miya F, Kadowaki H et al (2020) Clinical usefulness of multigene screening with phenotype-driven bioinformatics analysis for the diagnosis of patients with monogenic diabetes or severe insulin resistance. Diabetes Res Clin Pract 169:108461. 10.1016/j.diabres.2020.108461 [DOI] [PubMed] [Google Scholar]
- 38.Liu F, Chen S, Ming X, Li H, Zeng Z, Lv Y (2023) Sortilin-induced lipid accumulation and atherogenesis are suppressed by HNF1b SUMOylation promoted by flavone of Polygonatum odoratum. J Zhejiang Univ Sci B 24:998–1013. 10.1631/jzus.B2200682 [DOI] [PMC free article] [PubMed] [Google Scholar]
- 39.Marisa L, de Reyniès A, Duval A et al (2013) Gene expression classification of colon cancer into molecular subtypes: characterization, validation, and prognostic value. PLoS Med 10:e1001453. 10.1371/journal.pmed.1001453 [DOI] [PMC free article] [PubMed] [Google Scholar]
- 40.Smith JJ, Deane NG, Wu F et al (2010) Experimentally derived metastasis gene expression profile predicts recurrence and death in patients with colon cancer. Gastroenterology 138:958–968. 10.1053/j.gastro.2009.11.005 [DOI] [PMC free article] [PubMed] [Google Scholar]
- 41.Freeman TJ, Smith JJ, Chen X et al (2012) Smad4-mediated signaling inhibits intestinal neoplasia by inhibiting expression of β-catenin. Gastroenterology 142:562–71.e2. 10.1053/j.gastro.2011.11.026 [DOI] [PMC free article] [PubMed] [Google Scholar]
- 42.de Sousa EMF, Colak S, Buikhuisen J et al (2011) Methylation of cancer-stem-cell-associated Wnt target genes predicts poor prognosis in colorectal cancer patients. Cell Stem Cell 9:476–485. 10.1016/j.stem.2011.10.008 [DOI] [PubMed] [Google Scholar]
- 43.Shen W, Song Z, Zhong X et al (2022) Sangerbox: a comprehensive, interaction-friendly clinical bioinformatics analysis platform. Imeta 1:e36. 10.1002/imt2.36 [DOI] [PMC free article] [PubMed] [Google Scholar]
Associated Data
This section collects any data citations, data availability statements, or supplementary materials included in this article.
Supplementary Materials
Data Availability Statement
Only publicly available data were used in this study. The datasets used are available from the corresponding author on reasonable request.


