Abstract
The study suggests a better multi-objective optimization method called 2-Archive Multi-Objective Cuckoo Search (MOCS2arc). It is then used to improve eight classical truss structures and six ZDT test functions. The optimization aims to minimize both mass and compliance simultaneously. MOCS2arc is an advanced version of the traditional Multi-Objective Cuckoo Search (MOCS) algorithm, enhanced through a dual archive strategy that significantly improves solution diversity and optimization performance. To evaluate the effectiveness of MOCS2arc, we conducted extensive comparisons with several established multi-objective optimization algorithms: MOSCA, MODA, MOWHO, MOMFO, MOMPA, NSGA-II, DEMO, and MOCS. Such a comparison has been made with various performance metrics to compare and benchmark the efficacy of the proposed algorithm. These metrics comprehensively assess the algorithms' abilities to generate diverse and optimal solutions. The statistical results demonstrate the superior performance of MOCS2arc, evidenced by enhanced diversity and optimal solutions. Additionally, Friedman's test & Wilcoxon’s test corroborate the finding that MOCS2arc consistently delivers superior optimization results compared to others. The results show that MOCS2arc is a highly effective improved algorithm for multi-objective truss structure optimization, offering significant and promising improvements over existing methods.
Keywords: Archive, Truss, Structure design, Pareto dominance, Diversity, Convergence
Subject terms: Civil engineering, Mechanical engineering, Engineering, Mathematics and computing
Introduction
Engineering optimization seeks to identify the best solutions for complex engineering problems, traditionally accomplished through extensive trial and error. Historically, this process involved creating and testing multiple prototypes to evaluate different designs, such as modifying the structure of a bridge to enhance its load-bearing capacity. This approach, however, was time-consuming, costly, labor-intensive, and susceptible to human error. To overcome these limitations, researchers developed automated optimization algorithms, which offer a more efficient method of discovering optimal designs, thereby reducing costs, human involvement, and errors.
Despite these advancements, developing effective optimization algorithms remains crucial to addressing intricate engineering challenges. The quest for the most efficient solutions has always been a central objective in engineering optimization. Conventional methods often relied on laborious trial-and-error processes that demanded significant resources. However, the advent of metaheuristic algorithms has revolutionized this field. Inspired by natural processes or computational paradigms, metaheuristic algorithms excel at exploring solution spaces and finding near-optimal solutions. Unlike traditional optimization techniques that may struggle with non-linear or high-dimensional problems, metaheuristic algorithms are robust and versatile, making them suitable for various engineering applications. Recently proposed metaheuristics such as Ivy algorithm1, Parrot optimizer2, Duck swarm algorithm3, GOOSE algorithm4, The Portuguese Man o’ war5, Green anaconda optimization6, Hippopotamus optimization7, Artificial protozoa optimizer8, Crested Porcupine Optimizer9, Stochastic paint optimizer10, Ebola Optimization search algorithm11, Squid Game Optimizer12, Geometric mean optimizer13, The coronavirus search optimizer14, Puma Optimizer15, Zebra Optimization algorithm16, Brown Bear Optimization Algorithm17, are based on swarm intelligence, human behavior, physical low inspired and evolution-based metaheuristic optimization algorithms.
Several highly regarded methods originally developed for single-objective optimization have been improved to handle multi-objective optimization (MOO). These algorithms store an archive that includes the best Pareto optimum solutions (POS) found, and they primarily use Pareto dominance for solution comparisons18. All posteriori techniques have the same underlying structure. The optimization method begins with a collection of arbitrary solutions. Following the identification and archiving of the POS, efforts are directed toward improving these solutions to find better Pareto optimum results. An efficient multi-objective optimization method must achieve a harmonious equilibrium between these conflicting attributes. A multitude of tactics are used to enhance the extent of coverage. Pareto-optimal solutions located in sparsely populated areas of the archive have a higher probability of selection as leaders in MO Particle Swarm Optimization (MOPSO)19. NSGA-II20, also known as Non-dominated Sorting Genetic Algorithm-II, uses non-dominated sorting to determine the Pareto optimum solutions and give them distinct values. This ranking method increases the likelihood of achieving better Pareto optimum solutions, which significantly contributes to the creation of the subsequent generation.
Additional commonly used multi-objective (MO) optimization techniques include multi-objective generalized normal distribution optimization21, MO mantis search algorithm22, MO plasma generation optimizer23, MO thermal exchange optimization24,25, differential evolution for MO optimization26, MO bat algorithm27, water cycle algorithm for MO problems28, MO artificial vultures optimization algorithm29, MO Lichtenberg algorithm30, MO passing vehicle search31, MO heat transfer search32, MO atomic orbital search33, MO material generation algorithm34, MO crystal structure algorithm35, MO chaos game optimization36, MO hippopotamus optimizer37, MO cheetah optimizer38, and others. Each algorithm uses distinct strategies to balance convergence and coverage properly. Together, these methods improve multi-objective optimization by consistently boosting the accuracy and spread of Pareto optimum solutions39.
Many researchers have hybridized and improved existing MO algorithms. Some noteworthy improvised MO algorithms include the decomposition-based MO symbiotic organism search algorithm. A number of different search algorithms have been developed over the years, including the MO grey wolf-cuckoo search algorithm40, the improved MO ant-lion optimizer based on quasi-oppositional and levy flight41, the hybrid MO cuckoo search with dynamical local search42, the improved MPA43, the improved heat transfer search44, the two-archive MO MVO45, and the enhanced MOGWO46.
The "No Free Lunch" theorem emphasizes the understanding that no single metaheuristic can universally solve all real-world problems47. This recognition has driven the continuous development and refinement of algorithms. Put otherwise, no one method can be considered optimal or efficient for every kind of optimization or learning problem. As a result, the quest for creating new and more effective metaheuristics (MHs) is still an active area of study.
Although various MO optimization algorithms have been developed for structural optimization, most need better convergence and diversity balance, especially in the high-dimensional search spaces relevant to truss structure design. Standard cuckoo search and other metaheuristics often lack mechanisms for simultaneously improving solution quality and maintaining solution diversity across the Pareto front. This research gap highlights the need for a two-archive strategy, which the MOCS2arc algorithm implements. This strategy combines convergence and divergence archives to enhance solution refinement and diversity. The proposed approach fills these gaps and helps enable more robust, multi-objective optimization for complex structural problems.
New developments in MO optimization, like surrogate-assisted algorithms and adaptive constraint-handling methods, offer fresh ways to solve tough optimization problems. For example, A Surrogate-Assisted Evolutionary Algorithm for Seeking Multiple Solutions to Expensive Multimodal Optimization Problems has demonstrated that surrogate models can improve efficiency in expensive multimodal optimization problems by providing approximate evaluations48. Adaptive repair methods for constrained optimization, like the one used in an ʻ-constrained multi-objective differential evolution with an adaptive gradient-based repair method, are also used to fix violations of constraints on the fly49.
Optimization of truss structures is a critical area in structural engineering. It focuses on achieving the best possible performance while minimizing material usage and cost. Traditionally, these optimization problems involve multiple conflicting objectives, such as minimizing mass and compliance. As a result, developing robust multi-objective optimization algorithms has become essential to address these challenges effectively.
This work specifically uses a two-archive strategy-boosted multi-objective cuckoo search optimization algorithm to optimize eight truss structures with compliance and mass minimization as its dual objectives. Two different archives are used to improve the algorithm: a divergence archive and a convergence archive. The divergence archive makes sure that different parts of the design space are explored and that solution variability is kept. The convergence archive, on the other hand, focuses on improving convergence by making solutions closer to the ideal Pareto front. The algorithm successfully balances exploration and exploitation during optimization by merging these two archives. The iterative approach uses the current population and the historical archives along with population-based metaheuristics and non-dominated sorting to keep the Pareto front up to date. This method improves the algorithm's capacity to handle challenging, multi-objective truss optimization issues by dynamically adjusting the trade-off between variety and convergence, which is essential for producing excellent results.
A newly developed MOCS2arc algorithm is utilized to optimize eight truss structures: 10-bar truss, 25-bar truss, 37-bar truss, 60-bar truss, 72-bar truss, 120-bar truss, 200-bar truss, and 942-bar truss. The objectives are to minimize structural mass and compliance subject to allowable stress constraints. The following outline highlights the principal achievements of this research and its development, which surpass existing benchmarks:
An improved version of MOCS by integrating a two-archive strategy is proposed for optimizing different planner and spatial truss structures with two objectives.
The performance of MOCS2arc for eight trusses is compared with eight contemporary MO algorithms, viz. the MO Sine cosine algorithm (MOSCA)50, the MO Dragonfly Algorithm (MODA)51, the MO Whale optimization algorithm (MOWHO)52, the MO Moth Flame Optimization (MOMFO)53, NSGA-II20, the MO Marine Predator Algorithm (MOMPA)54, the Differential Evolution for MO Optimization (DEMO)26, and the MO Cuckoo Search Algorithm55.
Performance evaluations between the MOCS2arc and other methods are conducted using many performance metrics across all structural problems considered.
The qualitative characteristics of each algorithm's best Pareto-front plots are analyzed. Additionally, a comprehensive study ranks the algorithms using a statistical test at a prescribed significance level.
Swarm plots and diversity curves illustrate the convergence and divergence of the proposed MO algorithms, providing visualizations of efficient optimization processes.
The following contributions were made to this study:
Section "Mathematical representations of MOCS2arc" represents the mathematical model of the improvised version of MOCS, MOCS2arc, with dual archives.
Section "The truss design, FEA perspective, and MO compliance" elaborates on the truss design problems and its MO compliance.
The overview of the manuscript evaluation matrix is presented in Section "Computational investigations".
Section "Results, analysis, and comparative study" of the manuscript provides the experimental assessment of MOCS2arc and compares its performance with other well-known optimizers with well-known performance metrics and statistical tests.
The study concludes by offering final observations and insights in section "Conclusion".
Mathematical representations of MOCS2arc
The brood parasitism behavior of certain cuckoo species stimulates the Multi-Objective Cuckoo Search (MOCS) algorithm55, which integrates the power of Lévy flight-based random walks to generate new candidate solutions. In the cuckoo search approach, cuckoos lay their eggs in randomly selected nests, aiming to replace the host's offspring. Similarly, MOCS generates new candidate solutions (or eggs) using Lévy flights, a type of random walk characterized by steps that follow a power-law distribution56. This approach confirms an inclusive search of the solution space while efficiently pointing to optimistic regions of the search landscape. Lévy flights enable global exploration, which aids the optimizer in avoiding local optima and enhances the probability of finding the global optimal solution.
MOCS also includes a random permutation mechanism to enhance diversity among candidate solutions. In multi-objective optimization, maintaining diverse solutions is essential for continuing exploration, and this randomness ensures significant differences between the solutions. The two-archive strategy further enhances the algorithm’s efficiency, which balances convergence and divergence. The convergence archive refines solutions toward optimality, while the divergence archive promotes exploring alternative solutions. This balance lets MOCS handle goals that are at odds with each other well, like minimizing mass and compliance in truss structure optimization, which leads to a well-distributed Pareto front in the end.
Fundamental MOCS approach and MO compliance
Motivated by cuckoo birds that deposit their eggs in random nests, the Cuckoo Search optimizer replaces the host's children with a new solution56. Using Lévy flights to produce solutions facilitates efficient exploration of the search space. This approach increases the probability of finding the global optimum by balancing local and global refinement. The CS optimizer intelligently employs the various techniques listed below.
Step 1: Initialization
The optimizer starts by arbitrarily creating an initial population of potential solutions, or "nests," defining potential solutions.
 |
1 |
where  is the i-th solution vector in the population with j-th design variables in Eq. 1.
  is the vector of lower bounds for the design variables.
  is the vector of upper bounds for the design variables.
  is a vector of random values uniformly distributed between 0 and 1 for the i-th solution.
Step 2: Levy flights
New candidate solutions are generated through Lévy flights, a random walk characterized by long jumps. This stochastic process adheres to a heavy-tailed probability distribution, allowing optimizer to explore the search space's far-reaching regions and minimize the risk of trapping at local optima.
 |
2 |
 |
3 |
Equation 2 indicates the Levy flight step by utilizing random step u and a normal distribution v. Equation 3 scales the step size to control the magnitude of the movement, guiding the search towards the current best solution. Then, the current solution S is updated by adding the calculated step size with some random perturbation within bounds.
Step 3: Empty nest replacement
The optimizer imitates the natural behavior of host birds discovering and rejecting cuckoo eggs by replacing less optimal nests with new candidate solutions. This mechanism ensures that poor solutions are continuously discarded, promoting the evolution of better-performing nests over iterations.
 |
4 |
Equation 4 simulates the selective random walks. The step size for each nest is computed by randomly permuting the current population twice and calculating their difference. This introduces diversity and randomness in generating new solutions. The new solutions are then calculated by Eq. 4, applying the step size only to those nests marked for modification by K. A status matrix K generates 1 for undiscovered nests and 0 for those to be replaced. This vector allows for selective modification of nests based on the probability.
Step 4: Non-dominated sorting
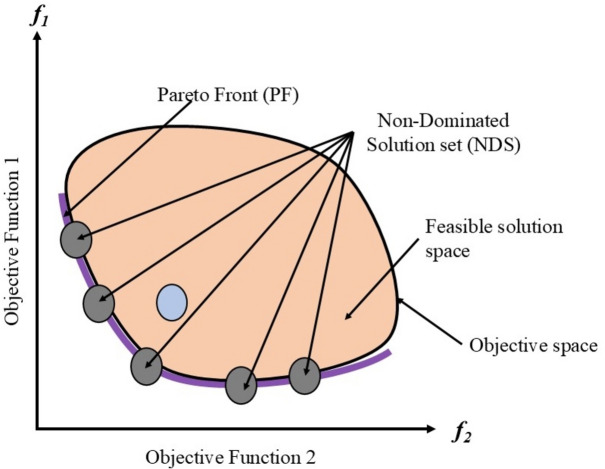
Based on dominance relationships, solutions are separated into several Pareto fronts; a solution is deemed dominant if it performs better than others for every objective. The initial front of non-dominated solutions is identified in non-dominated (ND) sorting, while solutions dominated by those in earlier fronts fill successive fronts. Higher-ranked fronts are worse than lower-ranked ones, with solutions falling within the same front and sharing the same rating. The viable solution space is made up of all possible solutions that satisfy the constraints. In contrast, the Pareto front is the set of ND solutions that provide the best trade-offs between competing objectives and create an efficient frontier. Pareto dominance, as seen in Fig. 1, suggests that a solution in MO performs better than another if it is strictly superior in at least one goal and at least as excellent in all of them.
Fig. 1.
Pareto Dominance and NDS.
Step 5: Crowding distance calculation
The Pareto front uses crowding distances to ensure diversity by measuring the proximity of solutions to their neighbors57. Higher distances indicate better spread and prevent convergence to narrow regions. In this step, these distances are computed by sorting solutions, normalizing the range of adjacent solutions, and assigning infinite distances to edge solutions, with results aggregated for analysis.
MOCS2arc with the two-archive implementation
In addition to non-dominating and crowding distance, the two-archive strategy incorporates two distinct archives: one aimed at enhancing search exploitation and the other focused on boosting search exploration58. This method has been successfully used in various multi- and many-objective optimizers59. The first archive represents the original multi-objective problem's Pareto archive, while the second archive emphasizes the diversity of solutions. Three key ideas focus on the following main components of the two-archive strategy.
Initialization and mating selection
The Two-Archive strategy maintains two archives throughout the optimizer process: a Convergence Archive (CA) and a Diversity Archive (DA). The initial population initializes both archives, depending on their predefined storing capacities. The DA does not guarantee the consistent inclusion of any given solution. The first secondary objective function resembles a sharing function, assigning a lower value to solutions located in less crowded regions. Meanwhile, the second objective function is a weighted sum of the original objective functions, which serves to assess the quality of a solution. Consequently, DA facilitates both exploration and exploitation.
Offspring generation and archive updates
During each iteration, a solution from MOCS is stored in CA as per its fitness value, and the most diverse solutions are as per their crowding distance, which is mainly spread out in the objective space stored in DA. The secondary objective functions of a solution Si are defined by Eq. 5 and 6.
 |
5 |
 |
6 |
where N2 is the total design solution under consideration and fi is the objective function vector of Si. w is the weighing factor [w1, w2]T and w1 + w2 = 1. The values of w1 and w2 are generated randomly for each generation.
Leader selection and probability
In the optimization process, the algorithm alternates between two leader selection methods. Leaders-1 is the selection from CA to emphasize exploitation, and Leaders-2 is the Random selection from DA to emphasize exploration. The selection process of the leaders from CA increases as the iteration progresses, indicating a shift from exploration to exploitation.
 |
7 |
where  is the probability of selecting leaders from CA as per Eq. 7, which increases as iteration progresses, indicating a shift from exploration to exploitation. t is the current generation, and T is the maximum number of generations.
  and
and  are the initial and final probabilities of selecting leaders from CA.
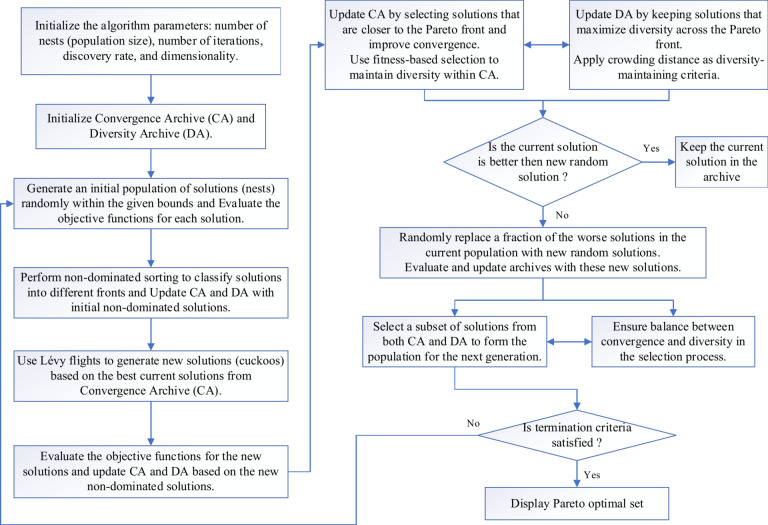
As seen in Fig. 2, the first step in the Multi-objective Cuckoo Search with Two Archive Strategy (MOCS2arc) is to initialize a population of solutions and populate two archives: a Diversity Archive (DA) to preserve variety throughout the front and a Convergence Archive (CA) for solutions that progress towards the Pareto front. Using Lévy flights, the program iteratively creates new solutions, assesses them, and updates the archives appropriately. The program forms the population of the following generation by selecting solutions from both archives, ensuring a balance between convergence and variety. The ultimate Pareto-optimal solutions are then obtained, and this procedure continues until the stopping criteria are satisfied.
Fig. 2.
Flowchart of MOCS2arc.
Multi-objective (MO) methods are a class of optimization algorithms that simultaneously incorporate several fitness functions to tackle many difficulties in one domain. Similarly, some domains that impact management outcomes include chemical process plants, bioinformatics, computational biology, structural optimization of trusses, and aerodynamics design optimization. Moreover, the classic form of the algorithm, which concentrates on a single fitness function, may result in fewer function evaluations for truss optimization than the multi-objective version. Truss optimization with the MO version successfully handles two main objectives, which expect unique results for each fitness function.
The truss design, FEA perspective, and MO compliance
The study emphasizes eight MO truss optimization problems: 10-bar truss, 25-bar truss, 37-bar truss, 60-bar truss, 72-bar truss, 120-bar truss, 200-bar truss, and 942-bar truss. The primary objectives are to minimize structural mass and compliance while ensuring that the designs adhere to permitted stress constraints. These structures are formulated in the equation. The equation determines the mass of the structures and compliance. 9. The displacement and loading vectors in these equations are obtained using finite element analysis (FEA).
 |
8 |
 |
9 |
where  is the density of material,
  is the section area of element e &
  is the length of element e. The stress in each element must satisfy the allowable stress constraint as per Eq. 10,
  is the maximum permissible stress.
 |
10 |
The dynamic penalty function is used to consider constraint violation. The penalty function is presented as bellows:
 |
11 |
where, is constraint violation considering
  . The penalty function fine-tunes the objective functions as per the constraint violation.
  and
and  are assumed with equivalent research findings.
The MOCS2arc algorithm employs a two-archive strategy to enhance convergence and solution diversity during optimization. The algorithm maintains two separate archives: a convergence archive (CA), which refines solutions for the Pareto front, and a diversity archive (DA), which promotes exploration by preserving diverse solutions across the objective space. Lévy flight-inspired random walks generate new solutions, facilitating both local exploitation and broader exploration of the search space. Each generation involves selecting leaders from the archives, with CA emphasizing exploitation and DA enhancing exploration. This balanced approach helps ensure that the algorithm does not converge prematurely and that the Pareto front maintains a diverse set of high-quality solutions.
Truss structures
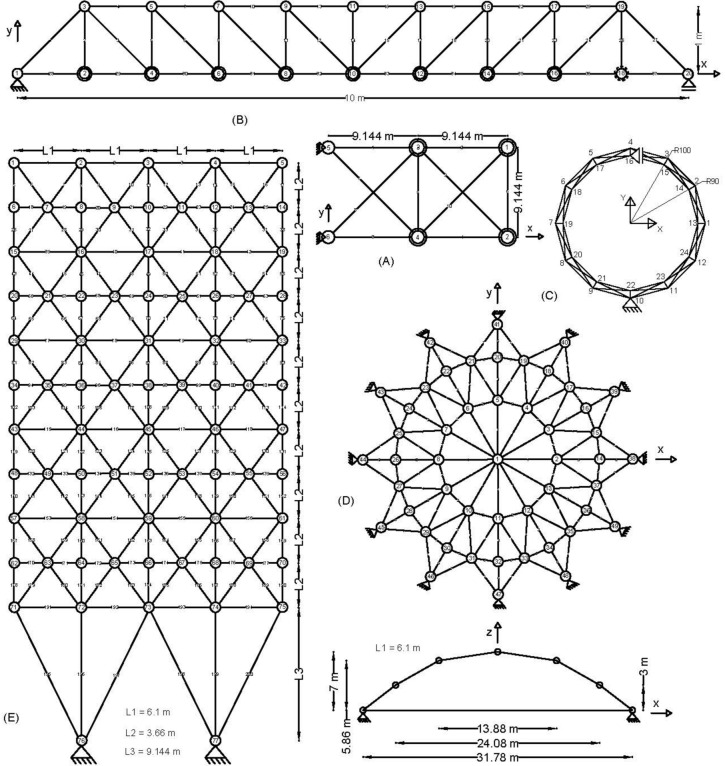
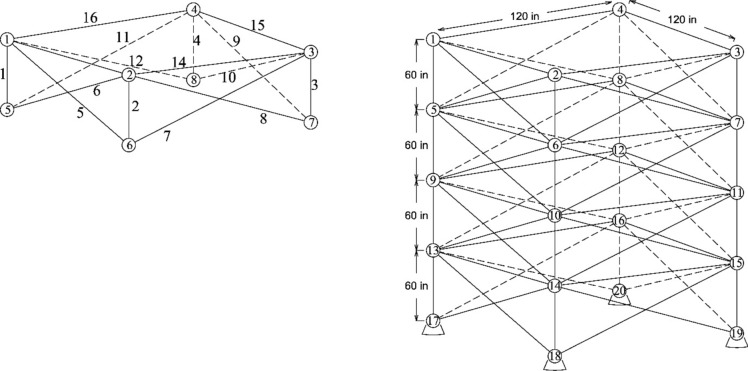
All test problems have the same definitions for the material attributes and permissible stress values. The density is fixed at 7850 kg/m3, the allowable stress at 400 MPa, and the modulus of elasticity at 200 GPa as per Table 1. The design variables in this study are regarded as discrete since standard truss element sizing often places constraints on structural elements in real-world applications. Figure 3A–E displays the ground constructions for the trusses with 10 bars, 37 bars, 60 bars, 120 bars, and 200 bars; Fig. 4 represents 25 bars of a 3-D truss; Fig. 5 shows 72 bars of a 3-D truss, and Fig. 6 represents 942-bar tower truss respectively. Additionally, some problems include grouped design variables, meaning the number of design variables does not always correspond to the truss elements. Table 1 represents the design consideration of all considered truss structures with loading conditions.
Table 1.
Design Considerations of truss structures.
| The 10-bar truss | The 25-bar truss | The 37-bar truss | The 60-bar truss | The 72-bar truss | The 120-bar truss | The 200-bar truss | The 942-bar truss | |
|---|---|---|---|---|---|---|---|---|
Design variables (
|
 |
 |
 |
 |
 |
 |
 |
 |
| Stress constraints (σmax) in MPa | 400 | |||||||
| Density (ρ) in kg/m3 | 7850 | |||||||
| Youngs modulus (E) in GPa | 200 | |||||||
Size variables  , , |
*1e-3 m2 |
*1e-3 m2 |
*1e-3 m2 |
*1e-3 m2 |
*1e-3 m2 |
*1e-3 m2 |
*1e-3 m2 |
*1e-1 m2 |
| Loading conditions |
|
|
|
Case 1:
Case 2: Case 3:
|
Case 1:
Case 2:
|
|
|
At each node: vertical loading: Section 1;
Section 2;
Section 3;
Lateral loading: Right-hand side;
Left-hand side;
Lateral loading:
|
Fig. 3.
(A) 10-bar truss, (B). 37-bar truss, (C). 60-bar truss, (D). 120-bar truss, and (E). 200-bar truss.
Fig. 4.
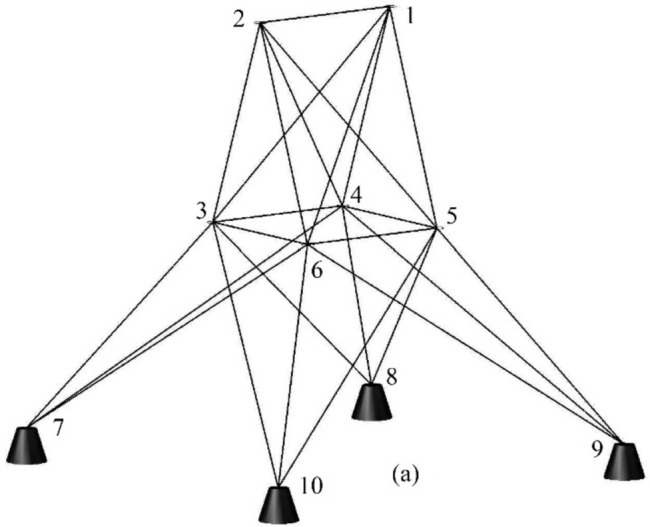
The 25-bar truss.
Fig. 5.
The 72-bar truss.
Fig. 6.

The 942-bar truss.
Computational investigations
Empirical evaluations
Evaluating performance metrics is crucial for accurately comparing the MOCS2arc algorithm to other multi-objective (MO) optimization algorithms. Four well-known metrics are utilized: the Hypervolume (HV)60, which assesses the portion of the objective space occupied by the non-dominated solution set (higher values indicate better performance) as per Eq. 11; Generational Distance (GD)61, which measures the gap between the true Pareto-optimal front and the estimated front found during the search (lower values are preferable) as referred by Eq. 12, and Inverted Generational Distance (IGD)62, which evaluates the convergence of the obtained Pareto front to the true Pareto front by calculating the average distance between points on the produced front and their nearest counterparts on the true front (lower values indicate better convergence), as represented by Eq. 13. The Spacing to an Extent (STE)63 ratio also looks at the spread and distribution of solutions across the Pareto front by combining the extent (ET) and spacing (SP) metrics. A lower STE value signifies a well-distributed and extensive Pareto front, indicating more efficient and non-dominated solutions.
 |
12 |
 |
13 |
 |
14 |
 |
15 |
HV in Eq. 11 offers insights into the quality of the solution set S. Each solution i in S is related to a hypercube Vi formed by a set of reference points. |P| represents the number of outcomes in the Pareto front in Eq. 12, where di denotes the Euclidean distance to the nearest solution from the reference front. It measures the volume of the objective space that is dominated by the solutions in the Pareto front. |P’| indicates the number of solutions on the reference plane in Eq. 13. This metric is used to evaluate both front expansions and advancements. The Euclidean distance di measures the separation between the objective function vector of the ith solution and its nearest neighbor.  represents the mean value of all di, where M is the number of objective functions.
  and
and  The maximum and minimum values of the ith objective function of the front represent the STE matrix's Eq. 14.
Section "Results, analysis, and comparative study", which discusses the study's empirical results, now incorporates the evaluation metrics and methods previously outlined in Section "Computational investigations". This integrated approach provides a cohesive view of the algorithm’s performance metrics—HV, GD, IGD, and STE—alongside detailed experimental results. These performance metrics are crucial to finding the most efficient and robust MO algorithm for truss structural optimization.
Results, analysis, and comparative study
Statistical results
Statistical tests of eight truss structures using the MOCS2arc algorithm against eight multi-objective (MO) optimizers show big differences in how well they do in a number of areas. When it came to HV, GD, IGD, and STE, the MOCS2arc algorithm did well, showing that it can find a good balance between structural mass and compliance goals. MOCS2arc demonstrated statistical consistency and excelled in hypervolume measures, indicating its robust coverage of the Pareto front. It consistently ranked among the top performers. Each algorithm was tested using trial parameters on a 10-bar truss to find the best parameters of the algorithm. Table 2 presents the considered parameters of each algorithm. The Friedman rank test demonstrated the algorithm's ability to produce effective, evenly distributed Pareto-optimal solutions, validating its strong performance in a variety of truss optimization problems. These results validate the applicability of MOCS2arc in complex engineering design scenarios where multi-objective optimization is critical.
Table 2.
The specific parameters used of each algorithm.
| Algorithm | Population size | Max FEs | Crossover rate | Mutation rate | Discovery rate (if applicable) | Other key parameters |
|---|---|---|---|---|---|---|
| MOSCA | 100 | 50,000 | 0.9 | 0.1 | N/A | Social learning rate: 1.5 |
| MODA | 100 | 50,000 | 0.8 | 0.05 | N/A | Scaling factor (F): 0.5 |
| MOWHO | 100 | 50,000 | 0.9 | 0.02 | N/A | Inertia weight: 0.5 |
| MOMFO | 100 | 50,000 | 0.8 | 0.1 | N/A | Mutation step size: 0.01 |
| MOMPA | 100 | 50,000 | 0.7 | 0.05 | N/A | Levy exponent: 1.5 |
| NSGA-II | 100 | 50,000 | 0.9 | 0.1 | N/A | Selection method: tournament |
| DEMO | 100 | 50,000 | 0.85 | 0.02 | N/A | Differential weight: 0.5 |
| MOCS | 100 | 50,000 | N/A | N/A | 0.25 | Archive Size: 100 |
| MOCS2arc | 100 | 50,000 | N/A | N/A | 0.25 | Convergence & divergence archive size: 100 |
Convergence analysis through HV Metric
Table 3 displays the HV values of the eight truss structures, taking into account all MO optimization algorithms. When compared to MOCS, DEMO, NSGA-II, MOMPA, MOMFO, MOWHO, MODA, and MOSCA, MOCS2arc ranks first for the 10-bar truss, with the highest average of 2.41E + 09 HV and 1,177,861 standard deviation. Smaller 3-D truss 25-bar, MOCS, and MOCS2arc have similar performance for the HV metric with average, maximum, and minimum HV with Friedman’s rank as first and second, respectively, as the best-performing MO optimization. For 37-bar and 60-bar planner truss structures, an average HV value of 1.56E + 08 and 4.98E + 08 are the highest with the first rank compared with considered state-of-the-art MO algorithms.
Table 3.
The hypervolume (HV) obtained for the eight trusses.
| HV | MOSCA | MODA | MOWHO | MOMFO | MOMPA | NSGA-II | DEMO | MOCS | MOCS2arc | |
|---|---|---|---|---|---|---|---|---|---|---|
| 10-bar | Average | 1.86E + 09 | 2.22E + 09 | 2.31E + 09 | 2.35E + 09 | 2.3E + 09 | 2.16E + 09 | 1.87E + 09 | 2.36E + 09 | 2.41E + 09 |
| Max | 2.22E + 09 | 2.34E + 09 | 2.34E + 09 | 2.36E + 09 | 2.35E + 09 | 2.25E + 09 | 2.05E + 09 | 2.42E + 09 | 2.42E + 09 | |
| Min | 1.09E + 09 | 2.12E + 09 | 2.22E + 09 | 2.29E + 09 | 2.22E + 09 | 1.86E + 09 | 1.76E + 09 | 2.15E + 09 | 2.41E + 09 | |
| Std | 2.61E + 08 | 53,390,824 | 23,743,601 | 13,641,612 | 38,548,017 | 81,087,395 | 60,920,753 | 62,785,764 | 1,177,861 | |
| Friedman | 8 | 6 | 5 | 3 | 4 | 7 | 9 | 3 | 1 | |
| 25-bar | Average | 4.13E + 08 | 5.37E + 08 | 5.39E + 08 | 5.54E + 08 | 5.39E + 08 | 5.2E + 08 | 4.74E + 08 | 5.69E + 08 | 5.69E + 08 |
| Max | 4.97E + 08 | 5.6E + 08 | 5.5E + 08 | 5.58E + 08 | 5.5E + 08 | 5.43E + 08 | 5.2E + 08 | 5.71E + 08 | 5.7E + 08 | |
| Min | 2.76E + 08 | 4.79E + 08 | 5.24E + 08 | 5.48E + 08 | 5.25E + 08 | 4.67E + 08 | 4.38E + 08 | 5.59E + 08 | 5.69E + 08 | |
| Std | 62,774,301 | 17,440,111 | 7,514,513 | 2,075,881 | 7,445,570 | 19,128,010 | 16,982,969 | 2,839,189 | 280,888.7 | |
| Friedman | 9 | 5 | 5 | 3 | 5 | 7 | 8 | 1 | 2 | |
| 37-bar | Average | 1.25E + 08 | 1.37E + 08 | 1.47E + 08 | 1.51E + 08 | 1.47E + 08 | 1.37E + 08 | 1.17E + 08 | 1.54E + 08 | 1.56E + 08 |
| Max | 1.44E + 08 | 1.44E + 08 | 1.51E + 08 | 1.53E + 08 | 1.52E + 08 | 1.53E + 08 | 1.23E + 08 | 1.56E + 08 | 1.56E + 08 | |
| Min | 74,429,861 | 1.27E + 08 | 1.4E + 08 | 1.5E + 08 | 1.43E + 08 | 43,400,281 | 1.08E + 08 | 1.49E + 08 | 1.56E + 08 | |
| Std | 15,241,020 | 4,124,711 | 2,753,524 | 661,944.7 | 2,404,063 | 19,006,014 | 3,623,926 | 1,826,119 | 91,112.33 | |
| Friedman | 8 | 7 | 5 | 3 | 5 | 6 | 9 | 2 | 1 | |
| 60-bar | Average | 3.88E + 08 | 4.05E + 08 | 4.35E + 08 | 4.67E + 08 | 4.28E + 08 | 4.42E + 08 | 3.37E + 08 | 4.57E + 08 | 4.98E + 08 |
| Max | 4.09E + 08 | 4.35E + 08 | 4.55E + 08 | 4.8E + 08 | 4.55E + 08 | 4.61E + 08 | 3.59E + 08 | 4.92E + 08 | 5.02E + 08 | |
| Min | 3.52E + 08 | 3.56E + 08 | 4.11E + 08 | 4.54E + 08 | 3.89E + 08 | 3.85E + 08 | 3.09E + 08 | 4.04E + 08 | 4.92E + 08 | |
| Std | 14,939,315 | 16,657,340 | 11,458,913 | 7,437,823 | 16,056,111 | 14,356,430 | 13,482,190 | 16,665,986 | 2,549,001 | |
| Friedman | 8 | 7 | 5 | 2 | 5 | 4 | 9 | 3 | 1 | |
| 72-bar | Average | 2.63E + 09 | 2.79E + 09 | 2.97E + 09 | 3.13E + 09 | 2.98E + 09 | 2.82E + 09 | 2.26E + 09 | 3.17E + 09 | 3.21E + 09 |
| Max | 2.86E + 09 | 2.97E + 09 | 3.05E + 09 | 3.15E + 09 | 3.05E + 09 | 3.03E + 09 | 2.43E + 09 | 3.22E + 09 | 3.21E + 09 | |
| Min | 1.97E + 09 | 2.63E + 09 | 2.86E + 09 | 3.1E + 09 | 2.9E + 09 | 1.7E + 09 | 2.04E + 09 | 3.08E + 09 | 3.2E + 09 | |
| Std | 1.84E + 08 | 88,307,133 | 48,131,720 | 12,129,810 | 42,805,173 | 2.93E + 08 | 75,064,466 | 28,071,164 | 1,714,075 | |
| Friedman | 8 | 7 | 5 | 3 | 5 | 6 | 9 | 2 | 1 | |
| 120-bar | Average | 5.99E + 10 | 7.91E + 10 | 7.94E + 10 | 8.19E + 10 | 7.99E + 10 | 7.42E + 10 | 6.81E + 10 | 8.27E + 10 | 8.49E + 10 |
| Max | 7.77E + 10 | 8.21E + 10 | 8.15E + 10 | 8.28E + 10 | 8.18E + 10 | 8E + 10 | 7.34E + 10 | 8.51E + 10 | 8.5E + 10 | |
| Min | 3.46E + 10 | 7.11E + 10 | 7.55E + 10 | 8.1E + 10 | 7.82E + 10 | 1.61E + 10 | 6.33E + 10 | 7.55E + 10 | 8.48E + 10 | |
| Std | 1.13E + 10 | 2.38E + 09 | 1.74E + 09 | 3.7E + 08 | 9.28E + 08 | 1.14E + 10 | 2.76E + 09 | 2.56E + 09 | 31,678,015 | |
| Friedman | 9 | 5 | 5 | 3 | 5 | 7 | 8 | 3 | 1 | |
| 200-bar | Average | 2.51E + 10 | 2.34E + 10 | 2.65E + 10 | 2.85E + 10 | 2.68E + 10 | 2.64E + 10 | 1.99E + 10 | 2.92E + 10 | 2.94E + 10 |
| Max | 2.72E + 10 | 2.59E + 10 | 2.78E + 10 | 2.88E + 10 | 2.75E + 10 | 2.74E + 10 | 2.16E + 10 | 2.94E + 10 | 2.94E + 10 | |
| Min | 2.05E + 10 | 2.22E + 10 | 2.43E + 10 | 2.83E + 10 | 2.57E + 10 | 2.37E + 10 | 1.86E + 10 | 2.9E + 10 | 2.94E + 10 | |
| Std | 1.6E + 09 | 7.71E + 08 | 7.1E + 08 | 1.37E + 08 | 4.42E + 08 | 8.84E + 08 | 7.27E + 08 | 1.15E + 08 | 13,760,608 | |
| Friedman | 7 | 8 | 5 | 3 | 5 | 5 | 9 | 2 | 1 | |
| 942-bar | average | 2.05E + 14 | 1.74E + 14 | 2.02E + 14 | 2.21E + 14 | 2.02E + 14 | 2.1E + 14 | 1.48E + 14 | 2.32E + 14 | 2.35E + 14 |
| Max | 2.14E + 14 | 1.85E + 14 | 2.09E + 14 | 2.24E + 14 | 2.1E + 14 | 2.25E + 14 | 1.57E + 14 | 2.35E + 14 | 2.36E + 14 | |
| Min | 1.8E + 14 | 1.58E + 14 | 1.9E + 14 | 2.18E + 14 | 1.97E + 14 | 1.78E + 14 | 1.43E + 14 | 2.27E + 14 | 2.34E + 14 | |
| Std | 8.34E + 12 | 6.78E + 12 | 6.02E + 12 | 1.33E + 12 | 3.23E + 12 | 1.03E + 13 | 3.76E + 12 | 1.87E + 12 | 3.21E + 11 | |
| Friedman | 5 | 8 | 6 | 3 | 6 | 5 | 9 | 2 | 1 | |
| Average Friedman | 60.93 | 52.80 | 40.67 | 23.10 | 39.87 | 46.47 | 69.47 | 17.53 | 9.17 | |
| Overall Friedman rank | 8 | 7 | 5 | 3 | 5 | 6 | 9 | 2 | 1 | |
Significance values are in bold.
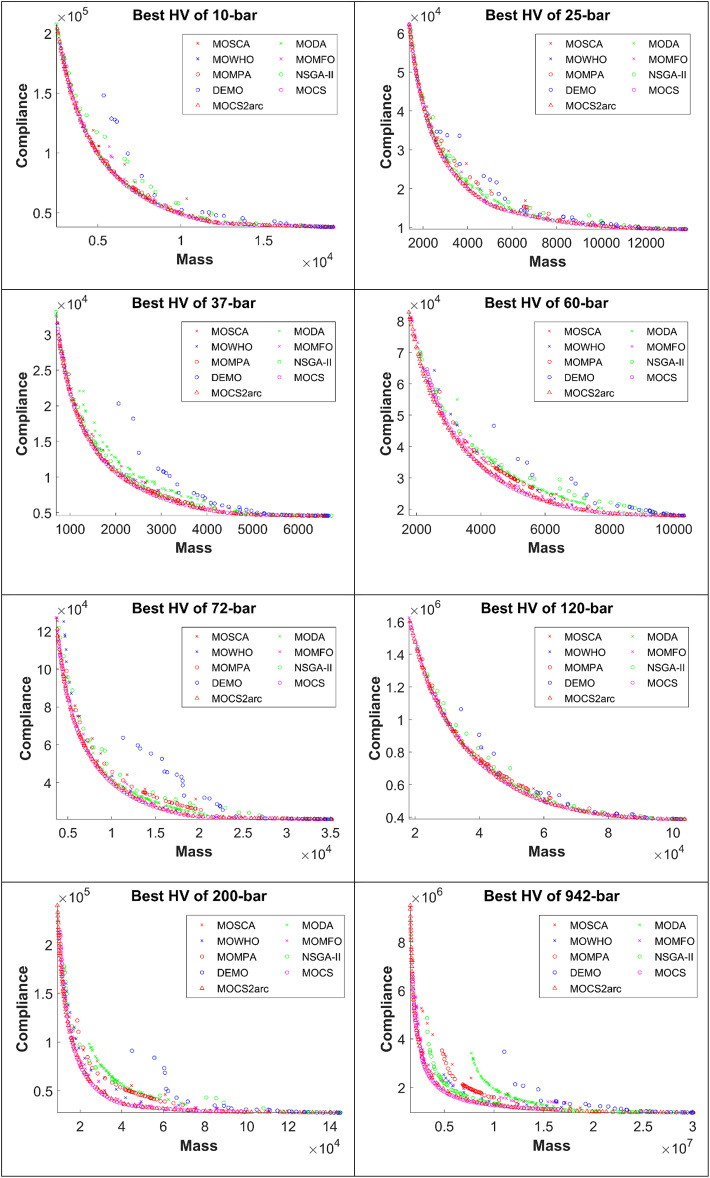
Figure 7 provides a representation of the best Pareto fronts attained by all the eight MO methods that include the MOCS2arc for the optimization of both objectives-mass and compliance-on the truss structures considered. Such Pareto fronts are comprised of non-dominating solutions that minimize structural mass and compliance under stress constraints. In this regard, MOCS2arc obtains regular, high-quality Pareto fronts to ensure proper trade-offs between the conflicting objectives. This is enabled by the fact that MOCS2arc systematically explores the design space to provide the best Pareto fronts-a continuous set of feasible design alternatives that can then be used to make informed decisions based on specific needs and preferences.
Fig. 7.
Best Pareto fronts of the considered truss structures.
The average HV for MOCS2arc at 120-bar and 200-bar is 8.49E + 10 and 2.94E + 10, respectively. These values are the highest, with the least variation, at 31,678,015 and 13,760,608. Friedman’s test revealed MOCS2arc as a superior MO algorithm with high-quality solutions and a secure first rank compared with others. 72-bar and 942-bar 3-D trusses are tower trusses with multiple loading conditions, as per Table 1. The three best-performing MO algorithms for 72-bar and 942-bar are MOCS2arc, MOCS, and MOMFO, as per the average HV from Table 3. The overall Friedman's rank test showed that MOCS2arc outperformed MOCS with the second rank, MOMFO with the third rank, and MOMPA, MOWHO, NSGA-II, MODA, MOSCA, and DEMO, respectively.
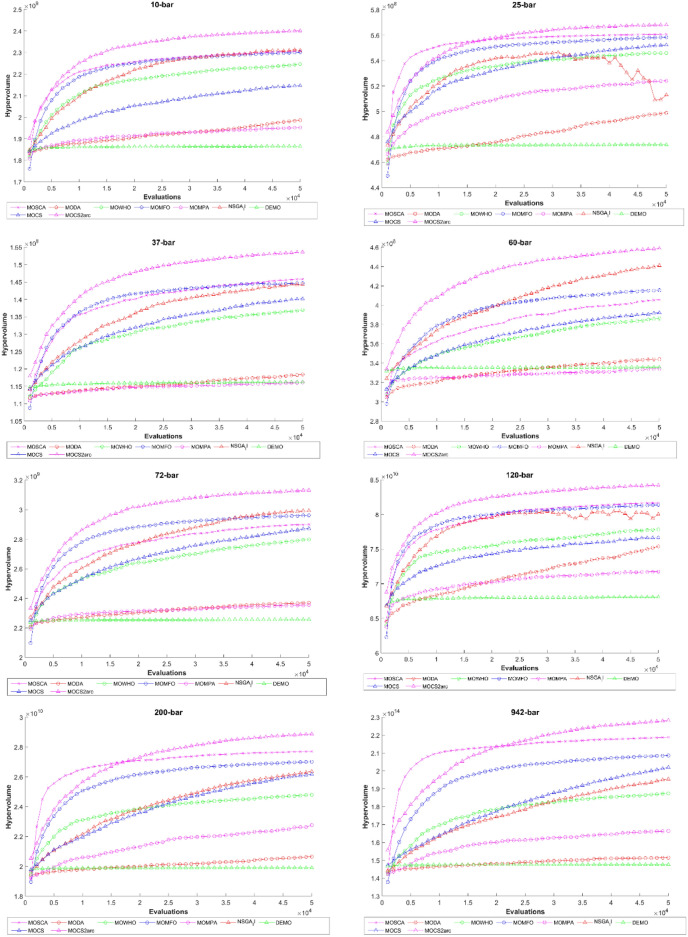
The hypervolume evolution (up to 50,000 FEs) for all truss structures as found by the eight MO optimizers is shown in Fig. 8. A well-defined trend in this analysis indicates that the MOCS2arc optimizer can provide the maximum hypervolume values with increased FEs. Such a trend can be interpreted as being related to the possibility that MOCS2arc can run a compelling exploration in diverse regions of the search space to evaluate a wide range of possible solutions for every truss structure. The much higher hypervolume values that MOCS2arc got clearly show how well it works in MO optimization and how it can provide solutions that are much better at minimizing mass and meeting compliance requirements. All of these results show that MOCS2arc is very good at dealing with complicated optimization landscapes and finding good solutions that balance the trade-off between different goals for the different types of truss structures we've looked at so far.
Fig. 8.
Comparative hypervolume evolution for considered truss structures.
Effectivity analysis by GD metric
Table 4 presents the outcomes of the GD metric for the MO algorithms under consideration, spanning a variety of truss arrangements. A lower GD score indicates superior performance, reflecting a high-quality, non-dominated front closely approximating the true Pareto optimal front. MOCS and MOCS2arc have the lowest GD values with overall first and second Friedman’s rank for all the considered truss structures. On the other hand, MODA and MOMPA exhibit the highest GD values, indicating a greater difference between the true Pareto and the Pareto produced by MO algorithms. According to the overall Friedman rank, MOMFO, MOWHO, and NSGA-II emerged as third, fourth, and fifth. The algorithms MOSCA, MODA, MOMPA, and DEMO perform the worst, exhibiting higher GD values and a higher standard deviation. With the higher values of std, there is a greater variability in the distance between the solutions obtained from a multi-objective algorithm and the true Pareto front, reflecting poor convergence and diversity. A high standard deviation indicates significant variations in the algorithm's performance across different runs, rendering it unstable and unpredictable in its ability to identify optimal Pareto fronts.
Table 4.
The Generational Distance (GD) metric obtained for the eight trusses.
| GD | MOSCA | MODA | MOWHO | MOMFO | MOMPA | NSGA-II | DEMO | MOCS | MOCS2arc | |
|---|---|---|---|---|---|---|---|---|---|---|
| 10-bar | Average | 81.22 | 88.46 | 67.32 | 70.42 | 102.94 | 87.36 | 264.55 | 52.23 | 58.32 |
| Max | 131.02 | 145.26 | 110.45 | 98.19 | 208.99 | 147.97 | 336.37 | 60.21 | 66.12 | |
| Min | 38.58 | 53.66 | 34.67 | 46.91 | 58.49 | 52.90 | 205.65 | 35.34 | 53.20 | |
| Std | 19.19 | 21.75 | 18.56 | 13.26 | 38.38 | 23.48 | 34.07 | 5.26 | 2.96 | |
| Friedman | 5 | 6 | 4 | 4 | 7 | 6 | 9 | 2 | 3 | |
| 25-bar | Average | 33.82 | 54.73 | 25.23 | 33.09 | 75.30 | 38.56 | 105.88 | 16.80 | 20.32 |
| Max | 96.72 | 75.76 | 39.69 | 51.33 | 112.74 | 61.37 | 144.86 | 21.34 | 22.09 | |
| Min | 12.45 | 31.21 | 18.12 | 26.03 | 36.71 | 19.56 | 62.51 | 5.77 | 18.31 | |
| Std | 16.23 | 11.65 | 4.98 | 6.19 | 19.20 | 9.97 | 20.13 | 4.04 | 0.93 | |
| Friedman | 4 | 7 | 3 | 5 | 8 | 5 | 9 | 1 | 2 | |
| 37-bar | Average | 17.53 | 34.61 | 18.84 | 15.60 | 27.33 | 25.97 | 75.05 | 9.76 | 11.03 |
| Max | 26.29 | 46.16 | 33.93 | 21.66 | 54.01 | 34.73 | 129.49 | 11.06 | 12.43 | |
| Min | 10.76 | 21.30 | 12.36 | 8.89 | 14.41 | 13.82 | 38.49 | 8.48 | 9.56 | |
| Std | 3.76 | 6.83 | 5.77 | 2.71 | 9.26 | 5.58 | 26.15 | 0.58 | 0.59 | |
| Friedman | 4 | 7 | 5 | 4 | 7 | 6 | 9 | 1 | 2 | |
| 60-bar | Average | 43.13 | 87.57 | 51.96 | 34.08 | 61.22 | 56.56 | 191.35 | 23.81 | 23.22 |
| Max | 67.40 | 116.06 | 85.68 | 42.82 | 90.43 | 73.80 | 231.66 | 56.17 | 26.57 | |
| Min | 27.58 | 67.91 | 31.77 | 27.42 | 39.98 | 37.56 | 130.02 | 16.41 | 19.92 | |
| Std | 9.44 | 13.07 | 12.58 | 4.02 | 13.32 | 9.74 | 23.34 | 7.88 | 1.39 | |
| Friedman | 4 | 8 | 5 | 3 | 6 | 6 | 9 | 2 | 2 | |
| 72-bar | Average | 113.43 | 239.32 | 115.56 | 71.41 | 197.95 | 122.09 | 465.80 | 41.01 | 42.93 |
| Max | 181.92 | 402.59 | 190.85 | 114.02 | 277.33 | 235.73 | 689.13 | 56.67 | 48.08 | |
| Min | 52.52 | 114.58 | 69.01 | 55.93 | 125.12 | 58.43 | 269.63 | 34.09 | 38.91 | |
| Std | 33.63 | 64.64 | 29.88 | 12.57 | 44.05 | 35.74 | 90.51 | 5.05 | 2.68 | |
| Friedman | 5 | 8 | 5 | 3 | 7 | 5 | 9 | 1 | 2 | |
| 120-bar | Average | 557.51 | 441.84 | 395.32 | 443.24 | 608.57 | 395.01 | 908.62 | 367.42 | 404.56 |
| Max | 730.24 | 605.87 | 633.89 | 606.89 | 929.99 | 579.63 | 1297.79 | 435.26 | 444.86 | |
| Min | 321.92 | 320.36 | 215.09 | 329.61 | 409.49 | 231.97 | 576.24 | 291.15 | 349.28 | |
| Std | 102.68 | 72.50 | 106.16 | 71.88 | 129.89 | 86.01 | 155.70 | 27.75 | 23.46 | |
| Friedman | 7 | 5 | 3 | 5 | 7 | 3 | 9 | 2 | 4 | |
| 200-bar | Average | 521.89 | 1120.15 | 542.69 | 224.99 | 565.73 | 470.48 | 1967.71 | 104.30 | 111.82 |
| Max | 1010.81 | 1612.03 | 912.99 | 299.73 | 887.45 | 725.87 | 2682.24 | 217.77 | 125.08 | |
| Min | 166.17 | 409.60 | 247.78 | 147.42 | 400.14 | 217.52 | 1234.84 | 92.27 | 101.85 | |
| Std | 217.10 | 295.61 | 160.88 | 45.73 | 117.95 | 127.75 | 374.15 | 22.20 | 4.74 | |
| Friedman | 5 | 8 | 6 | 3 | 6 | 5 | 9 | 1 | 2 | |
| 942-bar | Average | 92,707.63 | 58,690.98 | 46,049.22 | 37,420.07 | 41,414.17 | 37,999.36 | 68,877.23 | 11,223.40 | 13,120.63 |
| Max | 143,318.56 | 103,360.16 | 82,501.98 | 46,643.30 | 78,357.72 | 80,304.43 | 106,358.25 | 13,879.34 | 16,739.39 | |
| Min | 66,320.25 | 32,922.23 | 23,724.33 | 26,637.04 | 21,620.65 | 17,216.42 | 43,963.51 | 8612.12 | 11,284.82 | |
| Std | 16,199.47 | 18,591.74 | 15,467.51 | 4062.99 | 14,883.13 | 12,510.65 | 16,885.92 | 1061.14 | 1099.50 | |
| Friedman | 9 | 7 | 5 | 5 | 5 | 4 | 7 | 1 | 2 | |
| Average Friedman | 44.00 | 55.00 | 36.67 | 31.73 | 52.07 | 41.17 | 70.17 | 11.50 | 17.70 | |
| Overall Friedman rank | 6 | 7 | 5 | 4 | 7 | 5 | 9 | 1 | 2 | |
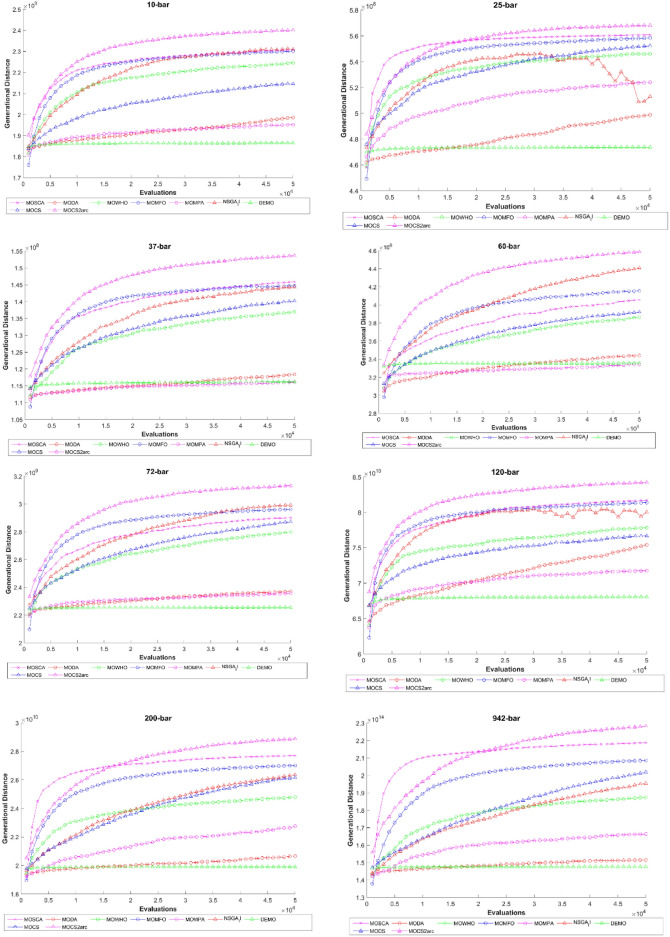
Figure 9 illustrates the generational distance (GD) over a range of function evaluations (FEs) for various MO optimization methods applied to all eight truss structures considered. The generational distance metric evaluates how close the solutions are to the true Pareto front, with lower values indicating better convergence. The curves represent the performance of eight algorithms, including MOCSA, MOCS2arc, NSGA-II, and DEMO. MOCS2arc demonstrates strong convergence by maintaining relatively low GD values across all evaluations compared to other algorithms. While some algorithms, such as NSGA-II and DEMO, show faster initial convergence, MOCS2arc consistently performs well over the long term, indicating its robustness in minimizing generational distance as the optimization progresses. This suggests that MOCS2arc effectively identifies high-quality solutions, achieving a balance between convergence speed and solution accuracy.
Fig. 9.
Comparative GD evolutions for considered truss structures.
Diversity analysis by IGD metric
Table 5 presents the compared algorithms' IGD values over different truss structures; it is clear that the smaller value is better, hence dominating Pareto fronts. The average IGD values for MOCS2arc over truss structures from 10 to 942-bar are 72.53, 23.50, 25.28, 250.87, 275.61, 544.97, 184.39, and 16,144.13, respectively. These values are lower than those obtained by other well-known optimizers, thus allowing the superiority of MOCS2arc in producing high-quality Pareto fronts. Also, MOCS2arc yielded excellent results that show a satisfactory balance between convergence and diversity. The optimal solutions will produce lower IGD values, indicating their spatial distribution and tendency to maintain diversity. This will allow the decision-maker to explore a more extensive solution space with better knowledge of the trade-offs between the competing objectives. Such results would be a meaningful contribution to multi-objective optimization problems.
Table 5.
The Inverted Generational Distance (IGD) metric obtained for the eight trusses.
| IGD | MOSCA | MODA | MOWHO | MOMFO | MOMPA | NSGA-II | DEMO | MOCS | MOCS2arc | |
|---|---|---|---|---|---|---|---|---|---|---|
| 10-bar | average | 2745.62 | 2730.20 | 832.73 | 370.75 | 1213.78 | 702.55 | 2976.14 | 1558.64 | 72.53 |
| max | 6933.49 | 4529.78 | 1708.29 | 665.96 | 3101.46 | 1882.79 | 4225.34 | 4623.60 | 87.79 | |
| min | 555.55 | 1332.31 | 555.71 | 304.74 | 433.02 | 304.85 | 1500.75 | 329.46 | 58.16 | |
| std | 1489.92 | 873.66 | 266.99 | 65.35 | 572.63 | 356.30 | 655.62 | 1043.12 | 6.61 | |
| Friedman | 7 | 8 | 4 | 2 | 5 | 4 | 8 | 6 | 1 | |
| 25-bar | average | 1073.18 | 618.77 | 295.24 | 125.33 | 271.10 | 215.57 | 864.37 | 119.32 | 23.50 |
| max | 2066.33 | 1586.14 | 684.00 | 167.86 | 878.91 | 336.73 | 1598.96 | 462.12 | 27.23 | |
| min | 300.94 | 102.34 | 196.79 | 91.15 | 161.33 | 110.29 | 430.16 | 7.83 | 21.14 | |
| std | 494.35 | 382.31 | 114.99 | 18.78 | 145.10 | 65.69 | 342.00 | 129.73 | 1.44 | |
| Friedman | 8 | 7 | 6 | 3 | 5 | 4 | 8 | 3 | 1 | |
| 37-bar | average | 467.90 | 538.91 | 268.45 | 109.96 | 331.13 | 197.20 | 616.06 | 255.97 | 25.28 |
| max | 1168.71 | 877.15 | 454.91 | 172.82 | 569.71 | 568.30 | 899.63 | 475.72 | 50.48 | |
| min | 192.92 | 178.41 | 101.83 | 66.40 | 155.09 | 56.53 | 361.37 | 54.72 | 12.64 | |
| std | 218.64 | 171.10 | 91.23 | 24.43 | 109.49 | 104.47 | 164.34 | 113.09 | 9.33 | |
| Friedman | 7 | 8 | 5 | 2 | 6 | 4 | 8 | 5 | 1 | |
| 60-bar | average | 1792.82 | 1218.85 | 1098.17 | 376.56 | 1361.96 | 629.12 | 1396.28 | 1234.36 | 250.87 |
| max | 2196.37 | 2153.27 | 1746.90 | 536.28 | 1998.78 | 1083.90 | 1804.59 | 1731.91 | 514.03 | |
| min | 1400.48 | 506.93 | 582.06 | 196.12 | 669.87 | 258.34 | 896.16 | 543.63 | 34.13 | |
| std | 196.28 | 427.45 | 356.96 | 88.20 | 362.78 | 229.27 | 230.65 | 283.86 | 145.91 | |
| Friedman | 8.53 | 5.80 | 5.57 | 2.00 | 6.40 | 2.93 | 6.67 | 5.80 | 1.30 | |
| 72-bar | average | 1680.48 | 2007.66 | 606.59 | 532.77 | 1222.06 | 710.20 | 2844.78 | 1120.69 | 275.61 |
| max | 3446.79 | 3150.15 | 1189.26 | 670.61 | 2597.02 | 1963.66 | 3935.13 | 2025.45 | 597.13 | |
| min | 787.05 | 979.36 | 411.93 | 339.26 | 491.13 | 337.15 | 1995.98 | 337.18 | 87.29 | |
| std | 542.05 | 615.41 | 158.43 | 70.45 | 685.10 | 359.63 | 521.40 | 433.13 | 120.53 | |
| Friedman | 7 | 8 | 3 | 3 | 5 | 4 | 9 | 5 | 1 | |
| 120-bar | average | 26,458.45 | 15,990.03 | 8830.44 | 2428.11 | 9071.80 | 6095.71 | 24,671.07 | 9779.50 | 544.97 |
| max | 53,490.61 | 35,165.67 | 16,283.00 | 3633.72 | 19,669.17 | 24,881.92 | 35,150.31 | 25,483.75 | 776.25 | |
| min | 8165.97 | 4364.32 | 4224.91 | 1901.44 | 4935.16 | 2033.41 | 14,953.92 | 744.96 | 454.88 | |
| std | 12,466.54 | 6585.11 | 3236.28 | 434.42 | 3808.48 | 4485.86 | 5147.76 | 5923.13 | 67.73 | |
| Friedman | 8 | 7 | 5 | 2 | 5 | 4 | 8 | 5 | 1 | |
| 200-bar | average | 4649.28 | 6850.88 | 6325.99 | 3056.08 | 5989.27 | 3336.65 | 7056.72 | 2849.64 | 184.39 |
| max | 6931.05 | 8949.37 | 8988.69 | 4148.98 | 7409.83 | 5447.93 | 8653.60 | 4045.14 | 257.54 | |
| min | 2991.74 | 4579.69 | 3700.03 | 1525.47 | 4058.73 | 1358.92 | 5444.14 | 1430.83 | 125.62 | |
| std | 1169.91 | 1170.68 | 1415.24 | 631.53 | 903.21 | 856.21 | 740.43 | 641.99 | 32.18 | |
| Friedman | 5 | 8 | 7 | 3 | 7 | 3 | 8 | 3 | 1 | |
| 942-bar | average | 572,834.83 | 652,778.82 | 582,596.86 | 508,433.96 | 492,513.50 | 230,009.60 | 794,526.32 | 537,864.91 | 16,144.13 |
| max | 1,004,369.86 | 787,377.71 | 707,085.27 | 792,921.10 | 673,367.45 | 488,478.09 | 846,384.22 | 808,868.98 | 21,722.53 | |
| min | 214,886.91 | 545,782.82 | 471,859.15 | 382,213.59 | 395,964.30 | 151,661.35 | 684,481.80 | 218,764.99 | 12,820.02 | |
| std | 203,982.40 | 61,138.65 | 63,207.04 | 91,830.57 | 60,257.84 | 67,035.00 | 39,121.22 | 149,751.72 | 2108.47 | |
| Frank | 6 | 7 | 6 | 5 | 4 | 2 | 9 | 6 | 1 | |
| Average Friedman | 57.10 | 57.13 | 41.50 | 21.77 | 43.50 | 27.83 | 64.67 | 37.93 | 8.57 | |
| Overall Friedman rank | 7 | 7 | 5 | 3 | 5 | 3 | 8 | 5 | 1 | |
Significance values are in bold.
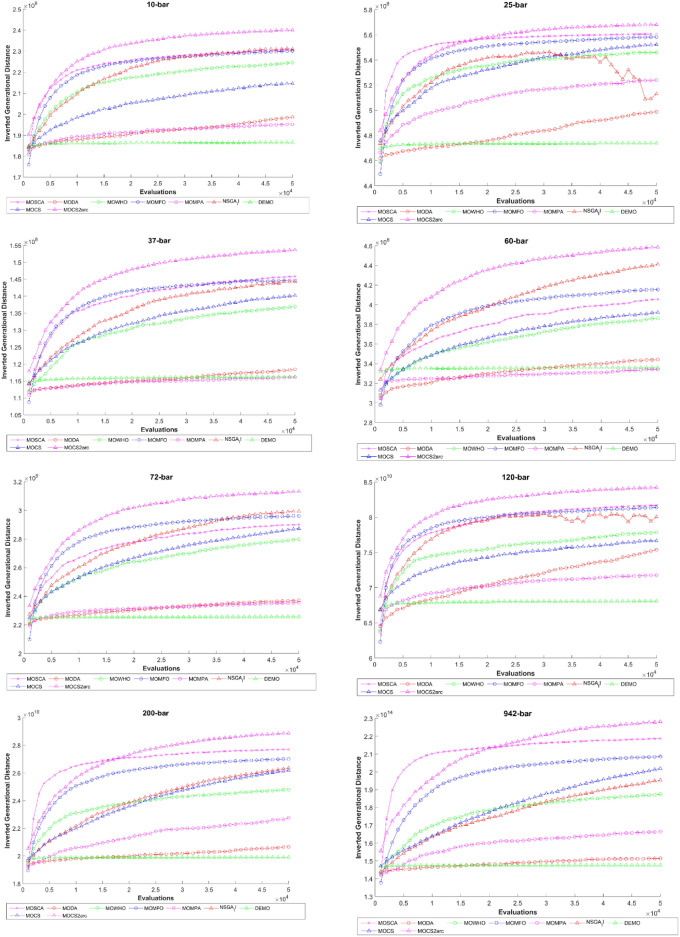
Figure 10 represents the performance comparison of eight MO optimization algorithms by plotting IGD against the number of evaluations for the considered trusses. IGD acts as a metric that calculates the distance between the obtained solution and the true Pareto front. The smaller the value of IGD, the better the performance. Due to the low IGD values during the runs of most algorithms, MOCS2arc exhibits the best convergence throughout the run. This means that MOCS2arc has not only been convergent, but it has also been keeping a wide range of good solutions close to the Pareto front. This shows that the solution of MO problems in truss design works well overall.
Fig. 10.
Comparative IGD evolutions for considered truss structures.
STE matrix-based quality evaluation of ND solutions
The STE metric simultaneously assesses both spacing and extent and, therefore, is crucial with regard to characterizing the quality of non-dominated fronts. In this context, spacing signifies the distribution of solutions across a Pareto front, indicating their level of dispersion. Uniformity in distribution could be interpreted as better coverage of objective space, probably accompanied by higher diversity among solutions. On the other hand, the spread measure of the STE metric provides the range of the Pareto front in the objective space and gives an idea of how stretched the solutions are over different objective values. The more extensive, the better, and the more comprehensive the range of trade-off solutions obtained.
Table 6 shows that a more miniature STE score for all the truss structures investigated in this paper reflects a better balance between spacing and extent, indicating that a non-dominated front is more optimal. In the following analysis, we found that MOCS2arc, MOCS, and MOWHO recorded the most miniature average STE scores among all investigated multi-objective optimization algorithms, with a confidence level of 95% in Friedman's statistical test, making them the top three algorithms. The fact that STE values are consistently lower across all trusses shows that the algorithms can get a balanced Pareto front, which improves their overall performance in multi-objective optimization.
Table 6.
The STE values for the considered truss structures.
| STE | MOSCA | MODA | MOWHO | MOMFO | MOMPA | NSGA-II | DEMO | MOCS | MOCS2arc | |
|---|---|---|---|---|---|---|---|---|---|---|
| 10-bar | Average | 0.0208 | 0.0187 | 0.0033 | 0.0091 | 0.0083 | 0.0150 | 0.0300 | 0.0057 | 0.0052 |
| Max | 0.0340 | 0.0516 | 0.0213 | 0.0148 | 0.0254 | 0.0377 | 0.0545 | 0.0123 | 0.0057 | |
| Min | 0.0000 | 0.0053 | 0.0000 | 0.0055 | 0.0019 | 0.0071 | 0.0093 | 0.0034 | 0.0046 | |
| Std | 0.0092 | 0.0128 | 0.0052 | 0.0022 | 0.0058 | 0.0054 | 0.0128 | 0.0021 | 0.0003 | |
| Friedman | 7.1000 | 6.7333 | 1.9667 | 4.7333 | 3.9000 | 6.6667 | 8.3000 | 2.9000 | 2.7000 | |
| 25-bar | Average | 0.0203 | 0.0167 | 0.0015 | 0.0081 | 0.0098 | 0.0148 | 0.0181 | 0.0042 | 0.0044 |
| Max | 0.0349 | 0.0508 | 0.0122 | 0.0136 | 0.0190 | 0.0295 | 0.0529 | 0.0095 | 0.0050 | |
| Min | 0.0000 | 0.0057 | 0.0000 | 0.0034 | 0.0036 | 0.0083 | 0.0090 | 0.0030 | 0.0036 | |
| std | 0.0084 | 0.0105 | 0.0033 | 0.0026 | 0.0043 | 0.0049 | 0.0086 | 0.0015 | 0.0003 | |
| Friedman | 8 | 7 | 2 | 4 | 5 | 7 | 7 | 2 | 3 | |
| 37-bar | Average | 0.0210 | 0.0172 | 0.0048 | 0.0089 | 0.0084 | 0.0141 | 0.0209 | 0.0045 | 0.0047 |
| Max | 0.0324 | 0.0594 | 0.0159 | 0.0139 | 0.0339 | 0.0317 | 0.0387 | 0.0122 | 0.0064 | |
| Min | 0.0039 | 0.0057 | 0.0000 | 0.0057 | 0.0029 | 0.0010 | 0.0076 | 0.0026 | 0.0040 | |
| Std | 0.0075 | 0.0129 | 0.0048 | 0.0017 | 0.0059 | 0.0064 | 0.0079 | 0.0021 | 0.0005 | |
| Friedman | 8 | 7 | 3 | 5 | 4 | 6 | 8 | 2 | 2 | |
| 60-bar | Average | 0.0271 | 0.0199 | 0.0042 | 0.0088 | 0.0086 | 0.0127 | 0.0333 | 0.0041 | 0.0061 |
| Max | 0.0456 | 0.0454 | 0.0245 | 0.0127 | 0.0230 | 0.0249 | 0.0592 | 0.0082 | 0.0116 | |
| Min | 0.0000 | 0.0054 | 0.0000 | 0.0047 | 0.0039 | 0.0051 | 0.0133 | 0.0024 | 0.0040 | |
| Std | 0.0131 | 0.0116 | 0.0056 | 0.0019 | 0.0047 | 0.0043 | 0.0123 | 0.0012 | 0.0018 | |
| Friedman | 7 | 7 | 2 | 5 | 4 | 6 | 8 | 2 | 3 | |
| 72-bar | Average | 0.0185 | 0.0144 | 0.0040 | 0.0091 | 0.0102 | 0.0157 | 0.0290 | 0.0040 | 0.0049 |
| Max | 0.0327 | 0.0462 | 0.0206 | 0.0151 | 0.0316 | 0.0281 | 0.0530 | 0.0111 | 0.0100 | |
| Min | 0.0000 | 0.0047 | 0.0000 | 0.0045 | 0.0032 | 0.0041 | 0.0122 | 0.0024 | 0.0037 | |
| Std | 0.0096 | 0.0090 | 0.0056 | 0.0026 | 0.0069 | 0.0062 | 0.0107 | 0.0018 | 0.0012 | |
| Friedman | 7 | 6 | 2 | 5 | 5 | 7 | 9 | 2 | 3 | |
| 120-bar | Average | 0.0194 | 0.0151 | 0.0033 | 0.0088 | 0.0114 | 0.0139 | 0.0276 | 0.0060 | 0.0050 |
| Max | 0.0368 | 0.0330 | 0.0192 | 0.0152 | 0.0417 | 0.0247 | 0.0674 | 0.0222 | 0.0057 | |
| Min | 0.0000 | 0.0057 | 0.0000 | 0.0047 | 0.0020 | 0.0021 | 0.0136 | 0.0038 | 0.0042 | |
| Std | 0.0127 | 0.0070 | 0.0050 | 0.0021 | 0.0080 | 0.0049 | 0.0126 | 0.0034 | 0.0003 | |
| Friedman | 7 | 6 | 2 | 5 | 5 | 6 | 8 | 3 | 3 | |
| 200-bar | Average | 0.0190 | 0.0204 | 0.0031 | 0.0089 | 0.0077 | 0.0126 | 0.0284 | 0.0034 | 0.0030 |
| Max | 0.0348 | 0.0487 | 0.0170 | 0.0121 | 0.0167 | 0.0188 | 0.0472 | 0.0061 | 0.0036 | |
| Min | 0.0000 | 0.0080 | 0.0000 | 0.0041 | 0.0008 | 0.0083 | 0.0163 | 0.0017 | 0.0025 | |
| Std | 0.0094 | 0.0105 | 0.0042 | 0.0019 | 0.0036 | 0.0033 | 0.0088 | 0.0012 | 0.0003 | |
| Friedman | 7 | 7 | 2 | 5 | 4 | 6 | 9 | 2 | 2 | |
| 942-bar | Average | 0.0301 | 0.0164 | 0.0028 | 0.0080 | 0.0089 | 0.0106 | 0.0177 | 0.0044 | 0.0047 |
| Max | 0.0432 | 0.0450 | 0.0133 | 0.0127 | 0.0214 | 0.0258 | 0.0254 | 0.0086 | 0.0055 | |
| min | 0.0049 | 0.0058 | 0.0000 | 0.0049 | 0.0034 | 0.0023 | 0.0107 | 0.0021 | 0.0040 | |
| std | 0.0117 | 0.0103 | 0.0038 | 0.0020 | 0.0045 | 0.0052 | 0.0037 | 0.0015 | 0.0004 | |
| Frank | 8 | 7 | 2 | 5 | 5 | 5 | 8 | 2 | 3 | |
| Average friedman | 58.6000 | 53.1000 | 17.9000 | 38.4000 | 35.7000 | 50.9667 | 64.5667 | 19.3667 | 21.4000 | |
| Overall friedman rank | 7 | 7 | 2 | 5 | 4 | 6 | 8 | 2 | 3 | |
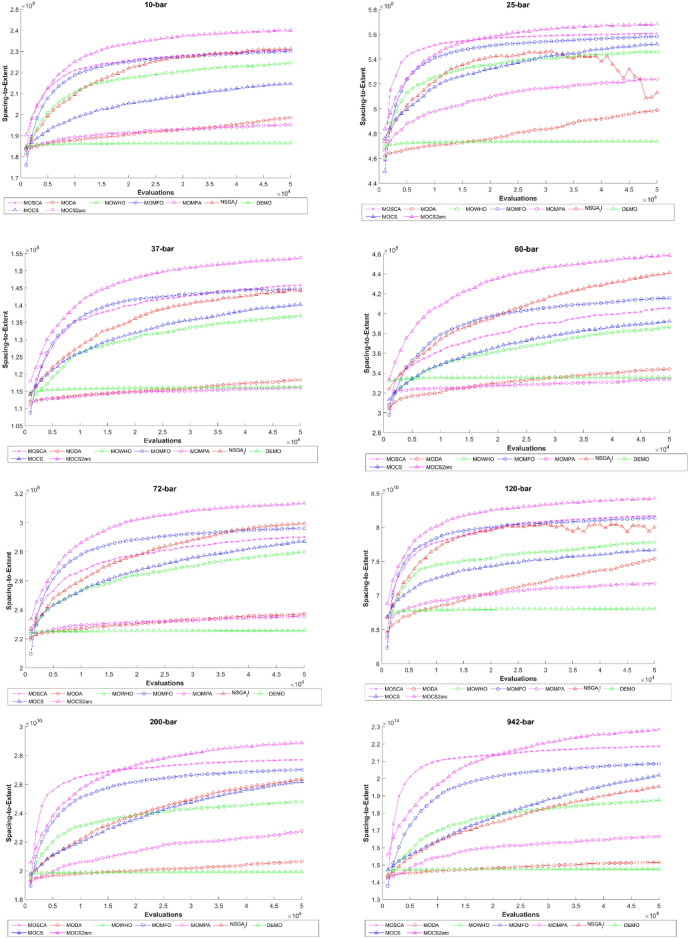
Figure 11 shows the STE metric as a function of the evaluations for all truss designs, comparing eight MO optimization algorithms. The STE metric shows a lower value for higher spacing and uniformity among the solutions. It analyzes the spread of the solutions across the Pareto front. Throughout the entire evaluation process, the MOCS2arc algorithm consistently displays the highest STE values compared to all other algorithms. This suggests that MOCS2arc effectively distributes the solutions across the Pareto front. It balances convergence and diversity, necessary for MO optimization problems and truss design.
Fig. 11.
Comparative STE evolutions for considered truss structures.
Table 7 depicts the statistically detailed comparison of each truss structure's Friedman rank test results for the investigated techniques. MOCS2arc obtained the best ranking with an average Friedman score of 14.21, ranking first among MOCS, MOMFO, MOWHO, NSGA-II, MOMPA, MODA, MOSCA, and DEMO. The convergence rate of MOCS2arc is considerably better than those of other well-known multi-objective optimization methods. Friedman's rank test statistically validates this at a 95% confidence level, confirming its superiority over the various methods considered in this study. The MOCS2arc has the best hypervolume (HV) values, which is indicative of the proficiency of this algorithm in exploring the solution space well and maintaining diversity. Consequently, it has always provided the lowest GD and IGD values in different scenarios; thus, it can be considered a good balance between convergence and diversity. If all the performance metrics are considered, MOCS2arc is the most effective method for solving MO Truss problems.
Table 7.
The Overall Friedman rank for the eight trusses.
| MOSCA | MODA | MOWHO | MOMFO | MOMPA | NSGA-II | DEMO | MOCS | MOCS2arc | |
|---|---|---|---|---|---|---|---|---|---|
| 10-bar | 7.07 | 6.54 | 3.58 | 3.50 | 5.06 | 5.75 | 8.45 | 3.23 | 1.82 |
| 25-bar | 7.32 | 6.47 | 3.89 | 3.76 | 5.78 | 5.83 | 8.08 | 1.88 | 2.01 |
| 37-bar | 6.69 | 7.11 | 4.24 | 3.53 | 5.23 | 5.59 | 8.42 | 2.53 | 1.66 |
| 60-bar | 7.04 | 6.83 | 4.62 | 3.09 | 5.56 | 4.77 | 8.23 | 3.10 | 1.76 |
| 72-bar | 6.51 | 7.07 | 3.95 | 3.44 | 5.39 | 5.43 | 8.77 | 2.74 | 1.70 |
| 120-bar | 7.46 | 5.69 | 3.85 | 3.65 | 5.48 | 5.08 | 8.39 | 3.26 | 2.14 |
| 200-bar | 6.00 | 7.64 | 5.15 | 3.52 | 5.43 | 5.02 | 8.65 | 2.07 | 1.53 |
| 942-bar | 7.07 | 7.16 | 4.90 | 4.26 | 4.87 | 4.14 | 8.23 | 2.78 | 1.60 |
| Average Friedman | 55.16 | 54.51 | 34.18 | 28.75 | 42.78 | 41.61 | 67.22 | 21.58 | 14.21 |
| Overall Friedman rank | 8 | 7 | 4 | 3 | 6 | 5 | 9 | 2 | 1 |
Significance values are in bold.
Our empirical study examines the HV, GD, IGD, and STE metrics in depth. The outcomes show that MOCS2arc consistently gets better HV values, which means it covers a larger objective space and gets closer to the Pareto front. Lower GD and IGD values show that MOCS2arc gives solutions that are very close to the real Pareto-optimal front. This proves that it can converge very well. The low STE values of the algorithm also show that the solutions are spread out evenly along the Pareto front. This shows that the dual-archive strategy works well for keeping both convergence and diversity. By leveraging the Convergence Archive (CA) to refine solution quality and the Diversity Archive (DA) to promote exploration, MOCS2arc effectively balances convergence and diversity. This dual-archive strategy is particularly beneficial for high-dimensional truss optimization problems, where achieving a close approximation to the Pareto front and a well-spread solution set is critical. Our expanded analysis thus substantiates the robustness of the proposed MOCS2arc approach, establishing its efficacy across diverse optimization scenarios and reinforcing its contribution to multi-objective optimization research.
Box-plots and swarm chart analysis
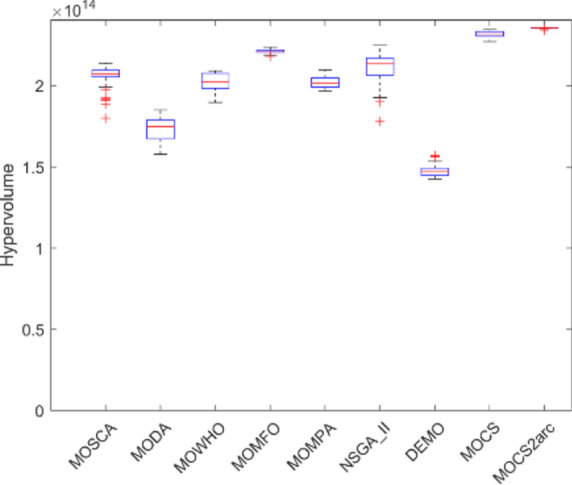
Figures 12, 13, 14, 15, 16, 17, 18, 19 present the hypervolume distribution of all considered MO optimization algorithms over eight truss structures. Boxplots are used to visually compare the central trend and dispersion of generated objective values using different algorithms. The median line within a box offers the interquartile range, IQR, of the objective values, while the whiskers—with removed outliers—provide a representation of the range of the data. These boxplots help analyze the performance of algorithms and, mainly, build insight into MOCS2arc. Indeed, the box plots produced by MOCS2arc exhibit minimal variability in the hypervolume distribution due to the close clustering of results, thereby demonstrating consistent performance. The MOCS2arc always does well with narrow boxplots, which show a high level of convergence towards a certain area of the objective space where the solutions it generates cluster together closely. These results underline the stability and reliability of MOCS2arc in performing robust optimizations.
Fig. 12.
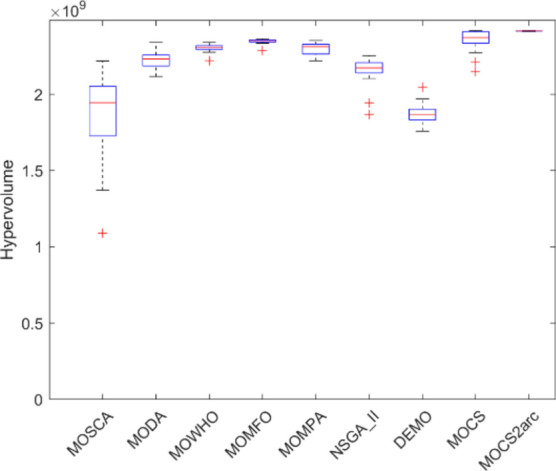
Boxplots of 10-bar truss.
Fig. 13.
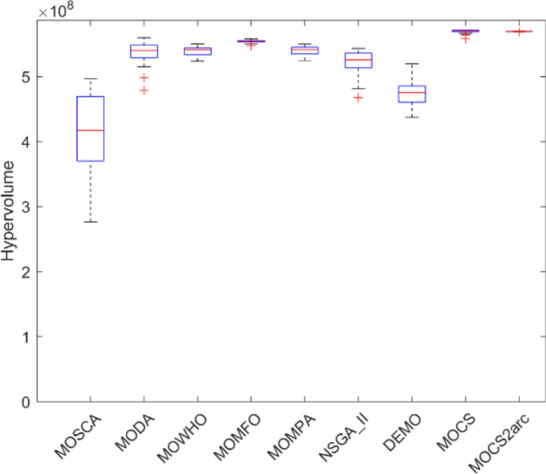
Boxplots of 25-bar truss.
Fig. 14.
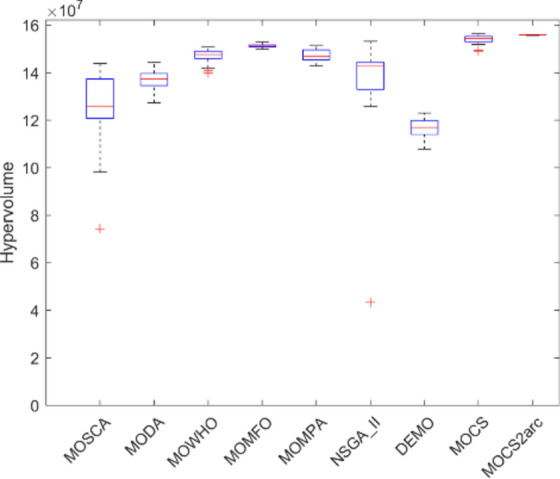
Boxplots of 37-bar truss.
Fig. 15.
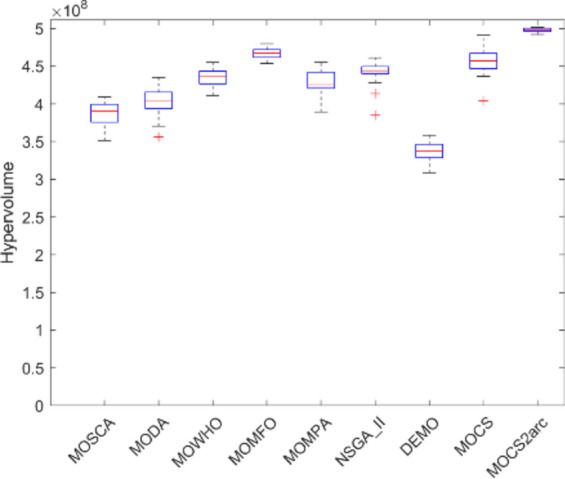
Boxplots of 60-bar truss.
Fig. 16.
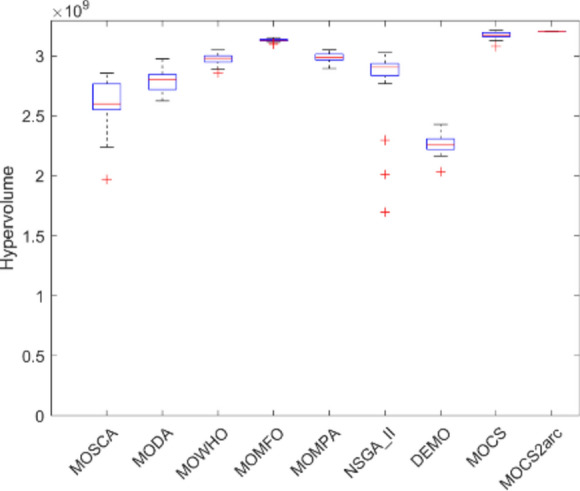
Boxplots of 72-bar truss.
Fig. 17.
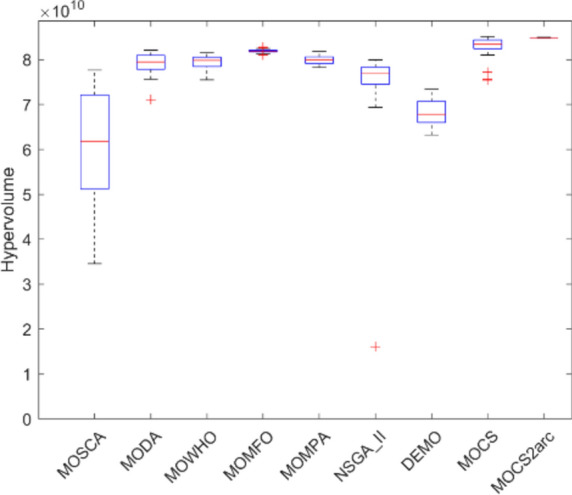
Boxplots of 120-bar truss.
Fig. 18.
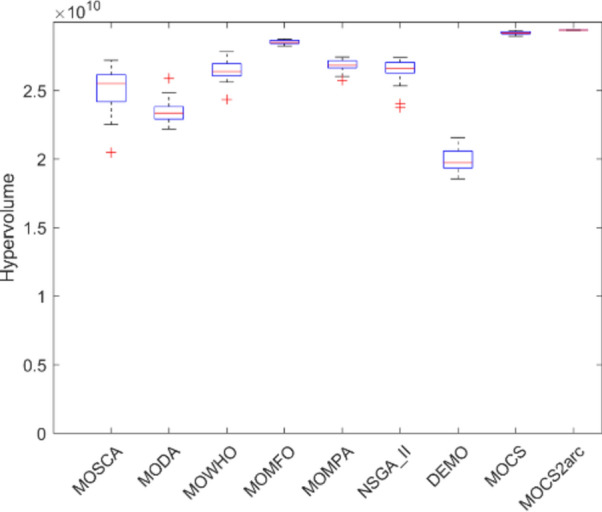
Boxplots of 200-bar truss.
Fig. 19.
Boxplots of 942-bar truss.
Convergence and diversity analysis by diversity curves
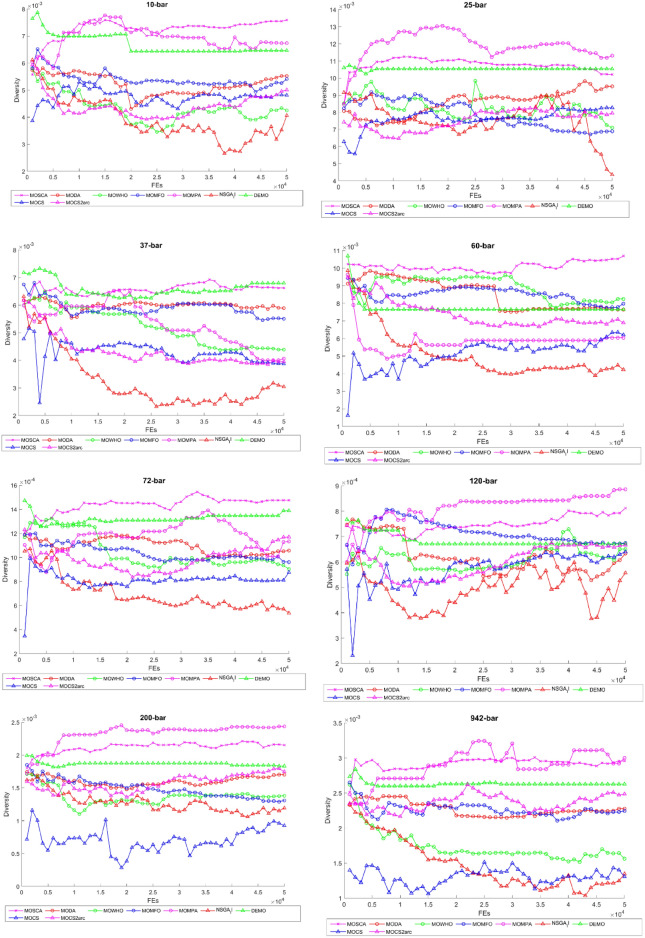
Figure 20 illustrates the diversity curves for all the MO optimization algorithms considered, spanning over 50,000 FEs for various truss structures. The diversity curve is essential for comparing the various algorithms' relative balance of convergence diversity. Algorithms that can preserve higher diversity during convergence to the Pareto front are generally more robust and effective. Diversity curves indicate the rate at which the solutions get closer to the Pareto front as FEs keep elapsing. A steep fall in diversity indicates rapid convergence, which means MOCS2arc is efficient in refining solutions.
Fig. 20.
The diversity curves of considered truss structures.
Diversity maintenance by MOCS2arc
Fluctuations in the diversity curve reflect how well the algorithm maintains diversity during convergence. In fact, maintaining diversity helps MOCS2arc be successful in finding optimal Pareto fronts and creating high-quality solutions. A fluctuating diversity curve can indicate stagnation within the optimization process. However, the diversity curve for MOCS2arc is smooth, primarily due to its good exploitation phase, and it does not contribute to stagnation. Diversity curves highlight how solutions explore and exploit the solution space during a run. MOCS2arc performs dynamic balancing for these phases, positioning this algorithm as one of the most robust truss MO structure design optimization contenders.
To find out how different important factors impact the performance of MOCS2arc, we did a sensitivity analysis on the Lévy flight step size, the probability of choosing the leader, and the weighting factors of the Convergence Archive (CA) and Diversity Archive (DA). It was shown that increasing CA weighting usually speeds up convergence but lowers diversity. On the other hand, increased DA weighting results in a better spread of solutions on the Pareto front at a potential cost to convergence. Likewise, we found that larger Lévy flight step sizes lead to broader exploration and, thus, lower chances of getting stuck in local optima. In comparison, smaller step sizes lead to more local refinement. These new information about the parameters shows that careful tuning is needed to get the best results in a number of truss structure optimization problems while keeping the MOCS2arc framework's balance between exploring and exploiting. In the future, researchers should look into how to add advanced diversity-boosting methods like adaptive density control and dynamic population expansion to MOCS2arc's dual-archive framework. This could significantly improve solutions spread across the Pareto front and better tackle complex, high-dimensional optimization challenges64,65.
Performance on ZDT benchmark
The five performance metrics are considered for six ZDT benchmark functions:66 hypervolume (HV), inverted generational distance + (IGD+), spread (SD), spacing (SP), and runtime (RT). We checked significance via a Wilcoxon signed-rank test (WSRT) at 0.05 significance levels, allowing us to compare with the test problems used in this study on whether each method solved MO problems better, worse, or the same using + / − / ~ . All test functions are tested with 100 population sizes and for 10,000 function evaluations.
MOCS2Arc competes well with the hypervolume metric analysis on ZDT benchmark functions, as MOCS2Arc gets higher HV values for most test functions, as shown in Table 8. Compared with several other approaches, MOCS2Arc gets generally larger hypervolume values in most of the considered tests, which means it can cover a large region of the objective space. Specifically, its performance is remarkable on ZDT1, ZDT2, and ZDT3 problems, where it performs better than the other algorithms, which denotes that MOCS2Arc is better regarding convergence and solution diversity in the objective space. This is also supported by the Wilcoxon signed-rank test, which depicts that MOCS2Arc behaves remarkably well regarding comprehensive, objective space coverage, and its hypervolume values are statistically better than considered MO algorithms.
Table 8.
Results of HV for considered MO algorithms on ZDT benchmark problems.
| Problem | FE | MOSCA | MODA | MOWHO | MOMFO | NSGA-II | DEMO | MOCS | MOCS2Arc |
|---|---|---|---|---|---|---|---|---|---|
| ZDT1 | 10,000 | 6.9594e–1 (5.99e–3) – | 1.7165e–1 (7.41e–2) – | 5.4817e–1 (2.53e–2) – | 5.5701e–1 (4.32e–2) – | 7.0541e–1 (3.14e–3) = | 6.7620e–1 (6.57e–2) = | 7.0570e–1 (3.50e–3) = | 7.0708e-1 (3.32e-3) |
| ZDT2 | 10,000 | 3.9970e–1 (2.24e–2) – | 0.0000e + 0 (0.00e + 0) – | 2.2055e–1 (3.56e–2) – | 3.4876e–2 (7.16e–2) – | 4.1847e–1 (2.33e–2) = | 2.0055e–1 (9.95e–2) – | 4.1890e–1 (2.55e–2) = | 4.2010e-1 (1.92e-2) |
| ZDT3 | 10,000 | 5.9948e–1 (3.16e–2) + | 2.8124e–1 (6.51e–2) – | 4.8256e–1 (2.89e–2) – | 5.3523e–1 (3.63e–2) – | 5.9245e–1 (1.88e–3) = | 6.1319e–1 (5.50e–2) + | 5.9496e–1 (1.66e–2) = | 5.9780e–1 (2.30e–2) |
| ZDT4 | 10,000 | 2.4013e–1 (1.68e–1) – | 0.0000e + 0 (0.00e + 0) – | 3.2122e–2 (9.18e–2) – | 4.0462e–2 (8.07e–2) – | 5.1933e–1 (1.47e–1) = | 0.0000e + 0 (0.00e + 0) – | 2.3181e–1 (1.39e–1) – | 4.9915e–1 (1.58e–1) |
| ZDT5 | 10,000 | 7.7699e–1 (3.96e–3) – | 7.8458e–1 (9.61e–3) = | 7.4650e–1 (1.41e–2) – | 7.8314e–1 (9.72e–3) = | 7.8564e–1 (8.33e–3) = | 8.3456e–1 (2.21e–2) + | 7.3314e–1 (1.20e–2) – | 7.8273e–1 (6.11e–3) |
| ZDT6 | 10,000 | 1.7020e–1 (5.66e–2) – | 2.7901e–1 (1.49e–1) = | 8.8886e–2 (4.13e–2) – | 3.3483e–2 (5.49e–2) – | 3.1493e–1 (4.04e–2) = | 3.0111e–1 (1.18e–1) = | 1.8934e–1 (5.90e–2) – | 3.2383e–1 (3.10e–2) |
| + /-/ = | 1/5/0 | 0/4/2 | 0/6/0 | 0/5/1 | 0/0/6 | 2/2/2 | 0/3/3 | ||
The results in Table 9 show that MOCS2Arc does well on the IGD+ measure, which checks how good the solution set is by how close it is to the real Pareto front. Low IGD+ values suggest that it effectively converges closer to the optimal front and performs better than others in most ZDT test functions. Other MO algorithms, like MODA and MOMFO, had higher IGD+ values, which meant they were farther from the Pareto front. This performance shows that MOCS2Arc can make a well-converged solution set. The Wilcoxon test results reflect these results, demonstrating statistically significant gains for MOCS2Arc over other algorithms in IGD+ , thereby confirming its reliability in successfully approaching the Pareto front.
Table 9.
Results of IGD+ for considered MO algorithms on ZDT benchmark problems.
| Problem | MOSCA | MODA | MOWHO | MOMFO | NSGA-II | DEMO | MOCS | MOCS2Arc |
|---|---|---|---|---|---|---|---|---|
| ZDT1 | 1.9546e–2 – | 1.2896e–1 – | 5.3880e–1 – | 1.2757e–1 – | 1.2928e–2 = | 4.0476e–2 = | 1.12e–2 = | 1.1674e–2 = |
| ZDT2 | 3.2276e–2 – | 1.7648e–1 – | 1.3832e + 0 – | 5.1594e–1 – | 1.9683e–2 = | 2.1967e–1 – | 1.985e–2 = | 1.8605e–2 = |
| ZDT3 | 1.7930e–2 – | 1.5608e–1 – | 4.6373e–1 – | 1.0709e–1 – | 9.3869e–3 = | 4.2392e–2 = | 9.9828e–3 = | 1.11E–02 |
| ZDT4 | 4.8581e–1 – | 1.1663e + 0 – | 1.1621e + 1 – | 9.8818e–1 – | 1.7435e–1 = | 3.2313e + 0 – | 4.6242e–1 – | 1.96E–01 |
| ZDT5 | 8.1684e–1 – | 1.1358e + 0 – | 7.4627e–1 = | 7.6474e–1 = | 7.3410e–1 = | 2.5104e–1 + | 1.2971e + 0 – | 7.63E–01 |
| ZDT6 | 2.0693e–1 – | 3.1655e–1 – | 1.4810e–1 – | 6.1124e–1 – | 5.8877e–2 = | 9.2544e–2 = | 1.8387e–1 – | 5.11E–02 |
| + /–/ = | 0/6/0 | 0/6/0 | 0/5/1 | 0/5/1 | 0/0/6 | 1/2/3 | 0/3/3 |
The spread values in Table 10 indicate that MOCS2Arc maintains a lead in spreading a well-distributed solution set across ZDT problems. The low spread values of MOCS2Arc on functions such as ZDT1 and ZDT5 demonstrate its capabilities, setting it apart from algorithms such as MOWHO and MOSCA, which exhibit higher spread values and, consequently, less diversity. This balanced spread means MOCS2Arc outperforms other algorithms in reaching a diversified yet converged solution set, which suggests it can avoid premature convergence. The Wilcoxon signed-rank test showed that the spread values of MOCS2Arc are statistically superior in many cases, and MOCS2Arc performs consistently well in achieving diversity along the Pareto front.
Table 10.
Results of Spread for considered MO algorithms on ZDT benchmark problems.
| Problem | MOSCA | MODA | MOWHO | MOMFO | NSGA-II | DEMO | MOCS | MOCS2Arc |
|---|---|---|---|---|---|---|---|---|
| ZDT1 | 4.8331e–1 – | 5.8822e–1 – | 8.3819e–1 – | 3.6900e–1 = | 5.8399e–1 – | 8.0440e–1 – | 3.5480e–1 = | 3.51E–01 |
| ZDT2 | 5.9713e–1 – | 7.2154e–1 – | 9.4693e–1 = | 4.1999e–1 = | 9.4026e–1 – | 9.7249e–1 – | 4.0250e–1 = | 4.20E–01 |
| ZDT3 | 5.8311e–1 – | 6.2722e–1 – | 8.1650e–1 – | 4.0257e–1 = | 7.1104e–1 – | 7.8201e–1 – | 4.0460e–1 = | 4.32E–01 |
| ZDT4 | 9.1089e–1 = | 9.5612e–1 – | 9.9919e–1 – | 8.4418e–1 = | 9.9950e–1 – | 1.0007e + 0 – | 8.5277e–1 = | 8.67E–01 |
| ZDT5 | 1.3872e + 0 – | 9.3158e–1 + | 1.0800e + 0 = | 1.2382e + 0 = | 1.6850e + 0 – | 1.4809e + 0 – | 9.7667e–1 + | 1.14E + 00 |
| ZDT6 | 8.3680e–1 – | 8.0000e–1 – | 1.2123e + 0 – | 6.6943e–1 = | 6.6918e–1 = | 9.2950e–1 – | 7.1315e–1 = | 6.78E–01 |
| + /–/ = | 0/5/1 | 1/5/0 | 0/4/2 | 0/0/6 | 0/5/1 | 0/6/0 | 1/0/5 |
Regarding spacing, MOCS2Arc routinely outperforms other algorithms on the ZDT suite, as demonstrated in Table 11. By eliminating significant gaps in the Pareto front, MOCS2Arc can generate a set of solutions with a uniform distribution, as indicated by the smaller spacing values. For example, it outperforms several others in terms of solution consistency on ZDT2 and ZDT3, retaining lower spacing values and demonstrating its efficacy in keeping a well-spaced solution set. The Wilcoxon signed-rank test results corroborate these conclusions, revealing a statistically significant improvement in spacing across several ZDT functions through MOCS2Arc.
Table 11.
Results of Spacing for considered MO algorithms on ZDT benchmark problems.
| Problem | MOSCA | MODA | MOWHO | MOMFO | NSGA-II | DEMO | MOCS | MOCS2Arc |
|---|---|---|---|---|---|---|---|---|
| ZDT1 | 9.2691e–3 – | 2.2377e–2 – | 1.2148e–2 – | 1.4204e–2 – | 6.6930e–3 = | 1.0526e–2 – | 6.56e–3 = | 6.5276e–3 = |
| ZDT2 | 1.0926e–2 – | 4.2711e–2 – | 7.5687e–3 = | 4.1443e–2 – | 7.4623e–3 = | 7.3628e–3 + | 7.8663e–3 = | 8.00E–03 |
| ZDT3 | 9.8315e–3 – | 3.3057e–2 – | 1.2362e–2 – | 1.3088e–2 – | 7.3247e–3 = | 1.2763e–2 – | 7.83e–3 = | 7.1468e–3 = |
| ZDT4 | 5.0164e–2 – | 1.2022e–1 – | 1.2359e–2 + | 2.4954e–2 = | 2.1218e–2 = | 3.4301e–1 – | 7.1399e–2 – | 2.36E–02 |
| ZDT5 | 4.2099e–1 – | 3.0953e + 0 – | 9.1593e–2 = | 9.8079e–1 – | 2.6327e–1 – | 7.3530e–1 – | 3.0278e + 0 – | 1.34E–01 |
| ZDT6 | 5.3833e–2 – | 4.9797e–2 – | 6.2920e–2 – | 4.4420e–2 – | 1.9179e–2 = | 3.2483e–2 = | 2.4918e–2 – | 1.91E–02 |
| + /–/ = | 0/6/0 | 0/6/0 | 1/3/2 | 0/5/1 | 0/1/5 | 1/4/1 | 0/3/3 |
The MOCS2Arc is efficient at runtime compared to computationally expensive methods like DEMO and NSGA-II. Table 12 shows that the MOCS2Arc achieves faster convergence without sacrificing quality in the solution set, while also significantly reducing runtime for a wide range of test functions. This approach is appropriate for large-scale multi-objective optimization problems with limited computer resources because it can balance computational efficiency with solution correctness. The Wilcoxon test confirms that MOCS2Arc is computationally more efficient with statistically shorter running times than other methods.
Table 12.
Results of Runtime for considered MO algorithms on ZDT benchmark problems.
| Problem | MOSCA | MODA | MOWHO | MOMFO | NSGA-II | DEMO | MOCS | MOCS2Arc |
|---|---|---|---|---|---|---|---|---|
| ZDT1 | 1.6296e + 0 – | 6.8671e–1 – | 6.1331e–1 – | 1.3567e + 0 – | 1.9781e + 0 – | 1.0660e + 1 – | 7.8592e–1 – | 5.59E–01 |
| ZDT2 | 1.4307e + 0 – | 6.1097e–1 – | 4.5990e–1 + | 5.2558e–1 = | 1.8287e + 0 – | 7.7914e + 0 – | 7.2705e–1 – | 5.27E–01 |
| ZDT3 | 1.4471e + 0 – | 6.9670e–1 – | 5.1570e–1 + | 4.9546e–1 + | 2.0707e + 0 – | 7.3315e + 0 – | 7.5352e–1 – | 5.85E–01 |
| ZDT4 | 1.1969e + 0 – | 6.2313e–1 – | 4.5227e–1 – | 5.0288e–1 – | 1.7792e + 0 – | 8.0954e + 0 – | 5.0183e–1 – | 3.12E–01 |
| ZDT5 | 1.4709e + 0 – | 5.9081e–1 – | 5.5892e–1 – | 4.4795e–1 – | 3.9062e + 0 – | 8.0901e + 0 – | 3.9296e–1 – | 3.18E–01 |
| ZDT6 | 1.9845e + 0 – | 7.1864e–1 – | 5.9377e–1 – | 4.9010e–1 – | 1.8001e + 0 – | 9.1741e + 0 – | 4.9960e–1 – | 3.06E–01 |
| + /–/ = | 0/6/0 | 0/6/0 | 2/4/0 | 1/4/1 | 0/6/0 | 0/6/0 | 0/6/0 |
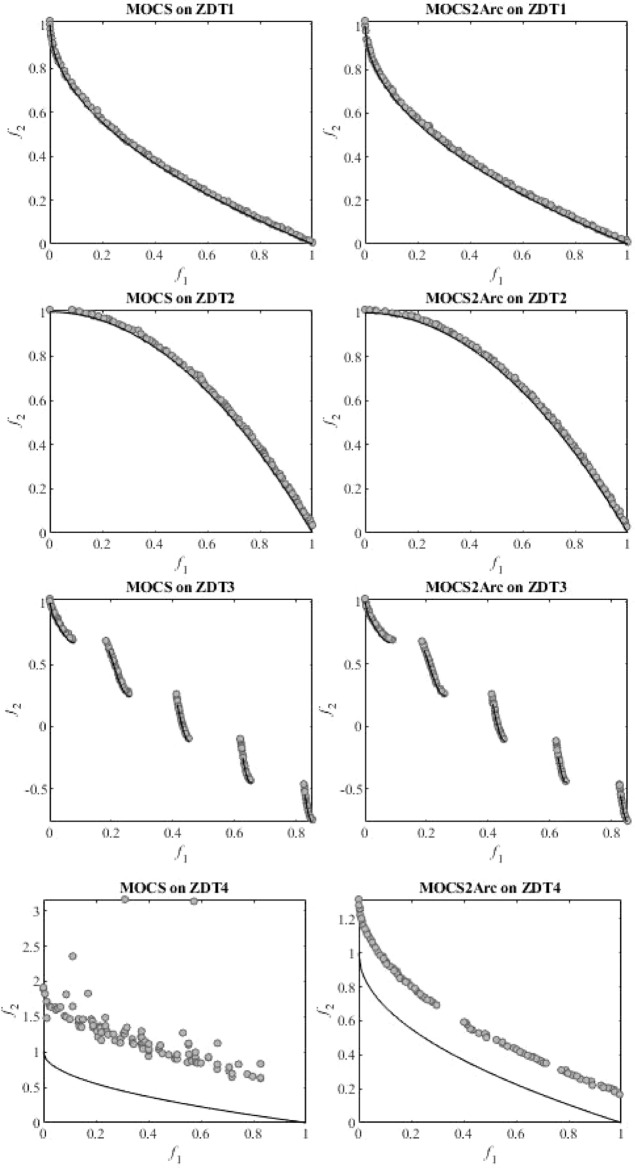
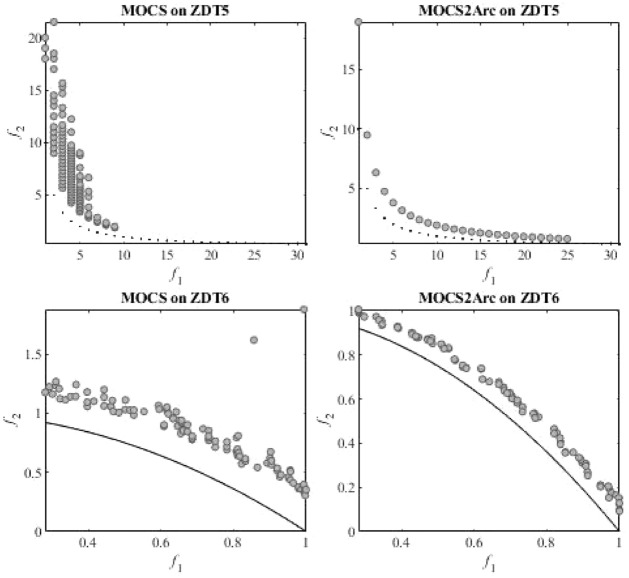
Figure 21 shows the comparative best Pareto fronts for ZDT test functions that MOCS and MOCS2Arc could obtain. Each subplot displays the distribution of solutions along the true Pareto front for both algorithms on various ZDT test functions. The results show that MOCS and MOCS2Arc effectively converge and vary for ZDT1 and ZDT2. They are very close to the real Pareto front and have a smooth spread across the objective space. Both techniques also strongly align with the segments of the actual front in ZDT3, which has a discontinuous Pareto front, albeit there are slight distributional differences. ZDT4 to ZDT6 demonstrated the true potential of MOCS2Arc, which generates solutions near true Pareto fronts. These comparisons demonstrate how well MOCS2Arc produces superior Pareto-optimal solutions for various multi-objective test function types.
Fig. 21.
Comparative Best Pareto fronts obtained by MOCS and MOCS2Arc on ZDT Test Suits.
Conclusion
This study looked into how to optimize eight different truss structures and six ZDT test functions with multiple goals in mind. It did this by suggesting a new MOCS2arc algorithm that mainly aims to reduce mass and compliance. MOCS2arc is considered a two-archive-based optimization algorithm that is efficient in generating Pareto-optimal solutions. These Pareto-optimal solutions effectively balance the critical objectives of minimizing structural mass and compliance, which are fundamental properties of high importance in truss design. MOCS2arc effectively balanced exploration and exploitation, resulting in the retention of several diverse and highly qualitative solutions in the archive throughout the run. This planned strategy helped the algorithm do better than other advanced multi-objective optimization methods and work well with many different types of truss configurations. It proved to be a strong algorithm that can solve difficult truss design problems in structural engineering.
The Friedman rank test and the Wilcoxon rank sum test, along with other statistical tests, showed that MOCS2arc was better than other cutting-edge multi-objective algorithms. The algorithm consistently ranked among the best-evaluated ones, demonstrating its ability to achieve relatively good and not overly diversified results. These results highlight MOCS2arc as a robust algorithm suitable for real-world applications, particularly in engineering scenarios where multi-objective optimization holds significant importance. The algorithm's degree of adaptability and effectiveness indicates its extendibility and possibility for hybridization with further optimization techniques, providing still more chances for solving large-scale and complex real-world engineering problems. The results demonstrate that MOCS2arc is a robust and reliable algorithm for structural optimization problems, which has a significant impact on both academic research and practical engineering design. The MOCS2arc algorithm does a good job with truss structure optimization and ZDT test functions, but its success may depend on how well you tune its parameters to fit the needs of the problem. Also, because it uses a dual-archive mechanism, it might take longer to run on bigger, more complicated problems. Future research on the MOCS2arc algorithm would focus on several promising directions for further enhancing its effectiveness in MO truss optimization. Another area that could be studied is creating hybrid optimization methods that combine MOCS2arc with other well-known algorithms, such as genetic algorithms or differential evolution, to use the best features of each and possibly make the search process faster. Moreover, adapting MOCS2arc to solve high-dimensional and large-scale optimization problems may open new applications for more complex structural optimization problems. Additionally, enhancing the algorithm's constraint-handling mechanisms could facilitate its application in real-world structural design problems that require stricter feasibility requirements and accommodate more complex constraint types.
Acknowledgements
The author extends the appreciation to the Deanship of Postgraduate Studies and Scientific Research at Majmaah University for funding this research work through the project number (ER-2024-1449).
Author contributions
All authors have contributed equally.
Data availability
The datasets used and/or analysed during the current study available from the corresponding author on reasonable request.
Declarations
Competing interests
The authors declare no competing interests.
Footnotes
Publisher's note
Springer Nature remains neutral with regard to jurisdictional claims in published maps and institutional affiliations.
Contributor Information
Ghanshyam G. Tejani, Email: p.shyam23@gmail.com
Sunil Kumar Sharma, Email: s.sharma@mu.edu.sa.
References
- 1.Ghasemi, M. et al. Optimization based on the smart behavior of plants with its engineering applications: Ivy algorithm. Knowl. Based Syst.10.1016/j.knosys.2024.111850 (2024). [Google Scholar]
- 2.Lian, J. et al. Parrot optimizer: Algorithm and applications to medical problems. Comput. Biol. Med.10.1016/j.compbiomed.2024.108064 (2024). [DOI] [PubMed] [Google Scholar]
- 3.Zhang, M. and Wen, G. “Duck swarm algorithm: theory, numerical optimization, and applications,”10.21203/rs.3.rs-3537143/v1, (2023).
- 4.Hamad, R. K. and Rashid, T. A. “GOOSE Algorithm: A powerful optimization tool for real-world engineering challenges and beyond.”
- 5.Miarnaeimi, F., Safaeian, N. and Ahmadi, M. “PMW: The portuguese Man o’ war optimization algorithm”, 10.21203/rs.3.rs-3930990/v1, (2024).
- 6.Dehghani, M., Trojovský, P. & Malik, O. P. Green anaconda optimization: A new bio-inspired metaheuristic algorithm for solving optimization problems. Biomimetics10.3390/biomimetics8010121 (2023). [DOI] [PMC free article] [PubMed] [Google Scholar]
- 7.Amiri, M. H. et al., “Hippopotamus optimization algorithm: A novel nature-inspired optimization algorithm,” 10.21203/rs.3.rs-3503110/v1, (2023). [DOI] [PMC free article] [PubMed]
- 8.Wang, X. et al. Artificial protozoa optimizer (APO): A novel bio-inspired metaheuristic algorithm for engineering optimization. Knowl. Based Syst.10.1016/j.knosys.2024.111737 (2024). [Google Scholar]
- 9.Abdel-Basset, M., Mohamed, R. & Abouhawwash, M. Crested porcupine optimizer: A new nature-inspired metaheuristic. Knowl. Based Syst.10.1016/j.knosys.2023.111257 (2024). [Google Scholar]
- 10.Kaveh, A., Talatahari, S. & Khodadadi, N. Stochastic paint optimizer: Theory and application in civil engineering. Eng. Comput.38(3), 1921–1952. 10.1007/s00366-020-01179-5 (2022). [Google Scholar]
- 11.Oyelade, O. N., Ezugwu, A.E.-S., Mohamed, T. I. A. & Abualigah, L. Ebola optimization search algorithm: A new nature-inspired metaheuristic optimization algorithm. IEEE Access10, 16150–16177. 10.1109/ACCESS.2022.3147821 (2022). [Google Scholar]
- 12.Azizi, M., BaghalzadehShishehgarkhaneh, M., Basiri, M. & Moehler, R. C. Squid game optimizer (SGO): A novel metaheuristic algorithm. Sci. Rep.13(1), 5373. 10.1038/s41598-023-32465-z (2023). [DOI] [PMC free article] [PubMed] [Google Scholar]
- 13.Rezaei, F., Safavi, H. R., AbdElaziz, M. & Mirjalili, S. GMO: geometric mean optimizer for solving engineering problems. Soft Comput.27(15), 10571–10606. 10.1007/s00500-023-08202-z (2023). [Google Scholar]
- 14.Golalipour, K. et al. The corona virus search optimizer for solving global and engineering optimization problems. Alex. Eng. J.78, 614–642. 10.1016/j.aej.2023.07.066 (2023). [Google Scholar]
- 15.Abdollahzadeh, B. et al. Puma optimizer (PO): A novel metaheuristic optimization algorithm and its application in machine learning. Cluster Comput.10.1007/s10586-023-04221-5 (2024). [Google Scholar]
- 16.Trojovska, E., Dehghani, M. & Trojovsky, P. Zebra optimization algorithm: A new bio-inspired optimization algorithm for solving optimization algorithm. IEEE Access10, 49445–49473. 10.1109/ACCESS.2022.3172789 (2022). [Google Scholar]
- 17.Mehta, P., Kumar, S. & Tejani, G. G. MOBBO: A multiobjective brown bear optimization algorithm for solving constrained structural optimization problems. J. Optim.10.1155/2024/5546940 (2024). [Google Scholar]
- 18.Branke, J., Deb, K., Dierolf, H. and Osswald, M. “Finding knees in multi-objective optimization,” in Parallel Problem Solving from Nature - PPSN VIII, Yao, X., Burke, E. K., Lozano, J. A., Smith, J., Merelo-Guervós, J. J., Bullinaria, J. A., Rowe, J. E., Tiňo, P., Kabán, A., and Schwefel, H.-P. Eds., Berlin, Heidelberg: Springer Berlin Heidelberg, 2004, pp. 722–731.
- 19.Coello, C. A. C. and Lechuga, M. S., “MOPSO: A proposal for multiple objective particle swarm optimization,” in Proceedings of the 2002 Congress on Evolutionary Computation. CEC’02 (Cat. No.02TH8600), 2002, pp. 1051–1056 vol.2. 10.1109/CEC.2002.1004388.
- 20.Deb, K., Pratap, A., Agarwal, S. and Meyarivan, T. “A Fast and Elitist Multiobjective Genetic Algorithm: NSGA-II,” (2002).
- 21.Khodadadi, N. et al. Multi-objective generalized normal distribution optimization: A novel algorithm for multi-objective problems. Cluster Comput.10.1007/s10586-024-04467-7 (2024). [Google Scholar]
- 22.Jameel, M. & Abouhawwash, M. Multi-objective Mantis Search Algorithm (MOMSA): A novel approach for engineering design problems and validation. Comput. Methods Appl. Mech. Eng.10.1016/j.cma.2024.116840 (2024). [Google Scholar]
- 23.Kumar, S., Jangir, P., Tejani, G. G., Premkumar, M. & Alhelou, H. H. MOPGO: A new physics-based multi-objective plasma generation optimizer for solving structural optimization problems. IEEE Access9, 84982–85016. 10.1109/ACCESS.2021.3087739 (2021). [Google Scholar]
- 24.Kumar, S., Jangir, P., Tejani, G. G. & Premkumar, M. MOTEO: A novel physics-based multiobjective thermal exchange optimization algorithm to design truss structures. Knowl. Based Syst.242, 108422. 10.1016/j.knosys.2022.108422 (2022). [Google Scholar]
- 25.Mashru, N., Patel, P., Tejani, G. G., and Kaneria, A. “Multi-objective thermal exchange optimization for truss structure,” in Advanced Engineering Optimization Through Intelligent Techniques: Select Proceedings of AEOTIT 2022, Springer, pp. 139–146, (2023).
- 26.Robič, T. and Filipič, B. “DEMO: Differential evolution for multiobjective optimization,” in Evolutionary Multi-Criterion Optimization, Coello, C. A., Hernández Aguirre, A., and Zitzler, E. Eds., Berlin, Heidelberg: Springer Berlin Heidelberg, 2005, pp. 520–533.
- 27.Yang, X.-S. Bat algorithm for multi-objective optimisation. Int. J. Bio-Insp. Comput.3(5), 267–274. 10.1504/IJBIC.2011.042259 (2011). [Google Scholar]
- 28.Sadollah, A., Eskandar, H., Bahreininejad, A. & Kim, J. H. Water cycle algorithm for solving multi-objective optimization problems. Soft Comput.19(9), 2587–2603. 10.1007/s00500-014-1424-4 (2015). [Google Scholar]
- 29.Khodadadi, N., SoleimanianGharehchopogh, F. & Mirjalili, S. MOAVOA: A new multi-objective artificial vultures optimization algorithm. Neural Comput. Appl.34(23), 20791–20829. 10.1007/s00521-022-07557-y (2022). [Google Scholar]
- 30.Luiz Junho Pereira, J., Antônio Oliver, G., Brendon Francisco, M., Simões Cunha, S. Jr. & Ferreira Gomes, G. Multi-objective lichtenberg algorithm: A hybrid physics-based meta-heuristic for solving engineering problems. Expert Syst. Appl.187, 115939. 10.1016/j.eswa.2021.115939 (2022). [Google Scholar]
- 31.Kumar, S., Tejani, G. G., Pholdee, N. & Bureerat, S. Multi-objective passing vehicle Search algorithm for structure optimization. Expert Syst. Appl.10.1016/j.eswa.2020.114511 (2021). [Google Scholar]
- 32.Tejani, G. G., Kumar, S. & Gandomi, A. H. Multi-objective heat transfer search algorithm for truss optimization. Eng. Comput.37(1), 641–662. 10.1007/s00366-019-00846-6 (2021). [Google Scholar]
- 33.Azizi, M., Talatahari, S., Khodadadi, N. & Sareh, P. Multiobjective atomic orbital search (MOAOS) for global and engineering design optimization. IEEE Access10, 67727–67746. 10.1109/ACCESS.2022.3186696 (2022). [Google Scholar]
- 34.Nouhi, B., Khodadadi, N., Azizi, M., Talatahari, S. & Gandomi, A. H. Multi-objective material generation algorithm (MOMGA) for optimization purposes. IEEE Access10, 107095–107115. 10.1109/ACCESS.2022.3211529 (2022). [Google Scholar]
- 35.Khodadadi, N., Azizi, M., Talatahari, S. & Sareh, P. Multi-objective crystal structure algorithm (MOCryStAl): Introduction and performance evaluation. IEEE Access9, 117795–117812. 10.1109/ACCESS.2021.3106487 (2021). [Google Scholar]
- 36.Khodadadi, N., Abualigah, L., Al-Tashi, Q. & Mirjalili, S. Multi-objective chaos game optimization. Neural Comput. Appl.35(20), 14973–15004. 10.1007/s00521-023-08432-0 (2023). [Google Scholar]
- 37.Mashru, N., Tejani, G. G., Patel, P., and Khishe, M. “Optimal truss design with MOHO: A multi-objective optimization perspective,” 10.1371/journal.pone.0308474, (2024). [DOI] [PMC free article] [PubMed]
- 38.Kumar, S. et al. Optimization of truss structures using multi-objective cheetah optimizer. Mech. Design Struct. Mach.10.1080/15397734.2024.2389109 (2024). [Google Scholar]
- 39.Mashru, N., Tejani, G. G., and Patel, P. “Many-objective optimization of a 120-Bar 3D dome truss structure using three metaheuristics,” in Advanced Engineering Optimization Through Intelligent Techniques, R. Venkata Rao and J. Taler, Eds., Singapore: Springer Nature Singapore, 2024, pp. 231–239.
- 40.Vo, N., Tang, H. & Lee, J. A multi-objective grey wolf-cuckoo search algorithm applied to spatial truss design optimization. Appl. Soft. Comput.10.1016/j.asoc.2024.111435 (2024). [Google Scholar]
- 41.Yadong, W., Quan, S., Weixing, S., and Qiang, W. “Improve multi-objective ant lion optimizer based on quasi-oppositional and levy fly,” in 2019 Chinese Control And Decision Conference (CCDC), 2019, pp. 12–17. 10.1109/CCDC.2019.8832365.
- 42.Zhang, M., Wang, H., Cui, Z. & Chen, J. Hybrid multi-objective cuckoo search with dynamical local search. Memet. Comput.10(2), 199–208. 10.1007/s12293-017-0237-2 (2018). [Google Scholar]
- 43.Hassan, M. H., Daqaq, F., Selim, A., Domínguez-García, J. L. & Kamel, S. MOIMPA: Multi-objective improved marine predators algorithm for solving multi-objective optimization problems. Soft comput.27(21), 15719–15740. 10.1007/s00500-023-08812-7 (2023). [Google Scholar]
- 44.Kumar, S., Tejani, G. G., Pholdee, N. & Bureerat, S. Multiobjecitve structural optimization using improved heat transfer search. Knowl. Based Syst.10.1016/j.knosys.2021.106811 (2021). [Google Scholar]
- 45.Kumar, S. et al. A two-archive multi-objective multi-verse optimizer for truss design. Knowl. Based Syst.10.1016/j.knosys.2023.110529 (2023). [Google Scholar]
- 46.Al-Tashi, Q. et al. Enhanced multi-objective grey wolf optimizer with lévy flight and mutation operators for feature selection. Comput. Syst. Sci. Eng.47(2), 1937–1966. 10.32604/csse.2023.039788 (2023). [Google Scholar]
- 47.Wolpert, D. H. and Macready, W. G. “No Free Lunch Theorems for Optimization,” 1997.
- 48.Ji, J.-Y., Tan, Z., Zeng, S., See-To, E. W. K. & Wong, M.-L. A surrogate-assisted evolutionary algorithm for seeking multiple solutions of expensive multimodal optimization problems. IEEE Trans. Emerg. Top Comput. Intell.8(1), 377–388. 10.1109/TETCI.2023.3301794 (2024). [Google Scholar]
- 49.Ji, J.-Y., Tan, Z., Zeng, S. & Wong, M.-L. An ɛ-constrained multiobjective differential evolution with adaptive gradient-based repair method for real-world constrained optimization problems. Appl. Soft Comput.152, 111202. 10.1016/j.asoc.2023.111202 (2024). [Google Scholar]
- 50.Tawhid, M. A. & Savsani, V. Multi-objective sine-cosine algorithm (MO-SCA) for multi-objective engineering design problems. Neural Comput. Appl.31(2), 915–929. 10.1007/s00521-017-3049-x (2019). [Google Scholar]
- 51.Mirjalili, S. Dragonfly algorithm: A new meta-heuristic optimization technique for solving single-objective, discrete, and multi-objective problems. Neural Comput. Appl.27(4), 1053–1073. 10.1007/s00521-015-1920-1 (2016). [Google Scholar]
- 52.Kumawat, I. R., Nanda, S. J., and Maddila, R. K. “Multi-objective whale optimization,” in TENCON 2017 - 2017 IEEE Region 10 Conference, 2017, pp. 2747–2752. 10.1109/TENCON.2017.8228329.
- 53.Vikas and Nanda, S. J. “Multi-objective Moth Flame Optimization,” in 2016 International Conference on Advances in Computing, Communications and Informatics (ICACCI), 2016, pp. 2470–2476. 10.1109/ICACCI.2016.7732428.
- 54.Zhong, K., Zhou, G., Deng, W., Zhou, Y. & Luo, Q. MOMPA: Multi-objective marine predator algorithm. Comput. Methods Appl. Mech. Eng.385, 114029. 10.1016/j.cma.2021.114029 (2021). [Google Scholar]
- 55.Yang, X.-S. & Deb, S. Multiobjective cuckoo search for design optimization. Comput. Oper. Res.40(6), 1616–1624. 10.1016/j.cor.2011.09.026 (2013). [Google Scholar]
- 56.Yang, X.-S. and Deb, S. “Cuckoo Search via Lévy flights,” in 2009 World Congress on Nature & Biologically Inspired Computing (NaBIC), 2009, pp. 210–214. 10.1109/NABIC.2009.5393690.
- 57.Kumar, S., Jangir, P., Tejani, G. G. & Premkumar, M. MOTEO: A novel physics-based multiobjective thermal exchange optimization algorithm to design truss structures. Knowl.-Based Syst.242, 108422. 10.1016/j.knosys.2022.108422 (2022). [Google Scholar]
- 58.Wang, H., Jiao, L. & Yao, X. Two Arch2: An improved two-archive algorithm for many-objective optimization. IEEE Transact. Evolut. Comput.19(4), 524–541. 10.1109/TEVC.2014.2350987 (2015). [Google Scholar]
- 59.K. Praditwong and X. Yao, “A New Multi-objective Evolutionary Optimisation Algorithm: The Two-Archive Algorithm.”
- 60.Auger, A., Bader, J., Brockhoff, D. & Zitzler, E. Hypervolume-based multiobjective optimization: Theoretical foundations and practical implications. Theor. Comput. Sci.425, 75–103. 10.1016/j.tcs.2011.03.012 (2012). [Google Scholar]
- 61.Liu, Y., Wei, J., Li, X. & Li, M. Generational distance indicator-based evolutionary algorithm with an improved niching method for many-objective optimization problems. IEEE Access7, 63881–63891. 10.1109/ACCESS.2019.2916634 (2019). [Google Scholar]
- 62.Ishibuchi, H., Imada, R., Setoguchi, Y. & Nojima, Y. Reference point specification in inverted generational distance for triangular linear pareto front. IEEE Transact. Evolut. Comput.22(6), 961–975. 10.1109/TEVC.2017.2776226 (2018). [Google Scholar]
- 63.Audet, C., Bigeon, J., Cartier, D., Le Digabel, S. & Salomon, L. Performance indicators in multiobjective optimization. Eur. J. Oper. Res.292(2), 397–422. 10.1016/j.ejor.2020.11.016 (2021). [Google Scholar]
- 64.Ji, J.-Y., Yu, W.-J., Zhong, J. & Zhang, J. Density-enhanced multiobjective evolutionary approach for power economic dispatch problems. IEEE Trans. Syst. Man Cybern. Syst51(4), 2054–2067. 10.1109/TSMC.2019.2953336 (2021). [Google Scholar]
- 65.Ji, J.-Y., Zeng, S. & Wong, M. L. ε-Constrained multiobjective differential evolution using linear population size expansion. Inf. Sci. (N Y)609, 445–464. 10.1016/j.ins.2022.07.108 (2022). [Google Scholar]
- 66.Zitzler, E., Deb, K. & Thiele, L. Comparison of multiobjective evolutionary algorithms: empirical results. Evol. Comput.8(2), 173–195. 10.1162/106365600568202 (2000). [DOI] [PubMed] [Google Scholar]
Associated Data
This section collects any data citations, data availability statements, or supplementary materials included in this article.
Data Availability Statement
The datasets used and/or analysed during the current study available from the corresponding author on reasonable request.


