

Abstract
This study aims to explore the low phosphorus (P) tolerance of saplings from different Gleditsia sinensis Lam. families. It also seeks to screen for Gleditsia sinensis families with strong low P tolerance and identify key indicators for evaluating their tolerance. This research provides a foundation for the breeding of superior families of Gleditsia sinensis and the study of mechanisms underlying low P tolerance. Using saplings from 30 Gleditsia sinensis families as the research subjects, a sand culture pot experiment was conducted. This study set up low P treatment (0.01 mmol L−1) and normal P treatment (1 mmol L−1). Twenty-five indicators including growth morphology, biomass, root morphology, and P content were measured. The low P tolerance coefficient was used as the basic data for assessing the low P tolerance of Gleditsia sinensis. The fuzzy comprehensive evaluation method was employed to comprehensively assess the low P tolerance types of Gleditsia sinensis a stepwise regression model was established to identify the key evaluation indicators for low P tolerance. The results indicate that low P stress reduced plant height, stem diameter, and biomass in most Gleditsia sinensis families, but increased the root morphological indicators, root-shoot ratio and PUE of various organs. Principal component analysis transformed the 25 indicators into 6 independent comprehensive indicators, with a cumulative contribution rate of 86.743%. The fuzzy comprehensive evaluation method calculated a comprehensive evaluation value (D value), enabling the screening of Gleditsia sinensis families into low P tolerant and low P sensitive types. Cluster analysis grouped the 30 Gleditsia sinensis families into 4 types. Among them, F13, F10, F9, F18, F15, and F28 were classified as low P tolerant types; F6, F23, F3, F17, F20, F2, F12, F11, F16, F8, F5, F27, F1, and F26 were categorized as intermediate types; F30, F7, F22, F4, F19, F29, F24, F14 and F25 were considered low P sensitive types, and F21 was classified as extremely low P sensitive types. The stepwise regression analysis identified the indicators stem diameter, total root volume, shoot dry weight, total root projection area, and leaf P content as the key factors for discriminating the low P tolerance of Gleditsia sinensis. The regression model is as follows: D=-0.005 + 0.323 stem diameter *+0.154 * total root volume + 0.196* shoot dry weight + 0.139* total root projection area − 0.112* leaf P content. In summary, low P stress inhibited the growth of Gleditsia sinensis saplings, but it increased the root morphological indicators, root-shoot ratio and PUE of various organs to cope with low P environments. The screening identified F13, F10, F9, F18, F15, and F28 as low P tolerant Gleditsia sinensis families. The evaluation indicators for low P tolerance in Gleditsia sinensis were identified as stem diameter, total root volume, shoot dry weight, total root projection area and leaf P content.
Supplementary Information
The online version contains supplementary material available at 10.1038/s41598-024-82071-w.
Keywords: Gleditsia sinensis Lam., Low phosphorus stress, Germplasm resources, Screening evaluation
Subject terms: Physiology, Plant sciences
Introduction
P is an essential nutrient that plays a crucial regulatory role in plant growth and development1. P is one of the essential elements for plant growth and is a crucial component of large molecular substances such as nucleic acids and proteins, playing a vital role in plant development2. Although soils may contain a large amount of total P, only a small proportion is immediately available to plants, P in the soil is primarily absorbed by plants in the form of inorganic P. Due to the tendency of metal ions such as iron, aluminum, and calcium to form insoluble substances with soil particles, the effective P content available for plant absorption and utilization in the soil is often very low3–6. Plants are susceptible to low P stress, which affects their growth, development, and yield7. P is limiting for crop yield on > 30% of the world’s arable land and, by some estimates, world resources of inexpensive P may be depleted by 2050. Improvement of P acquisition and use by plants is critical for economic, humanitarian and environmental reasons8. Applying P fertilizer is a direct method to address plant P deficiency, but excessive use of P fertilizer can lead to soil compaction and, at the same time, cause water pollution. Therefore, fertilization is not the optimal solution9–11. Research has found that plants develop different nutrient absorption strategies during the genetic process, and there are significant differences in nutrient absorption and utilization efficiency among different families of the same plant12–14. Therefore, studying the differences in P tolerance among different families of the same plant and screening for low P tolerant families can reduce the application of phosphate fertilizers and, to some extent, alleviate the soil P resource crisis. Previous research has conducted extensive studies on the stress mechanisms of plants in response to low P stress, and many studies have reported significant differences in morphological and physiological response mechanisms to low P stress both within and between species15–17. Under low P conditions, some species can grow normally, while others experience growth impairment or even death. The efficiency of P use varies among these species, primarily in terms of P allocation, utilization, transport, and absorption18. Plants have evolved various mechanisms to adapt to low P conditions, such as inducing root development and promoting lateral root growth19,20; secreting more organic acids from roots21; promoting mycorrhizal formation22; producing acid phosphatases to counteract low P stress23,24; altering plant metabolic pathways25,26; and inducing or repressing the expression of P-related genes27. Currently, soil improvement, fertilization, and management techniques can reduce the application of phosphate fertilizers, but these measures do not fundamentally address the problem of insufficient available P in the soil. Screening and cultivating low P tolerant families is of great significance, as it is one of the key measures to mitigate the depletion of phosphate rock, reduce the application of phosphate fertilizers, and address the scarcity of available P in the soil while maintaining relatively stable yields and protecting the agricultural ecological environment.
Gleditsia sinensis Lam. belongs to the Leguminosae family and Gleditsia genus, is a common deciduous tall tree in China. The Gleditsia genus has important economic value, the main usable parts of Gleditsia are the pod, thorns, and seeds28. It is widely used in carbon sequestration forests, ecological forests, economic forests, landscape forests, and as a species for chemical raw material forests. It is a typical multifunctional and distinctive economic forest species29,30. Additionally, Gleditsia sinensis contains abundant chemical constituents such as terpenoids, flavonoids, phenolic acids, and steroids, making it a natural raw material for pharmaceuticals, food, health products, cosmetics, and cleaning products. It has extremely high ecological, economic, and medicinal value, which has gradually garnered extensive attention31,32. Therefore, Gleditsia sinensis has broad application and research prospects. Gleditsia sinensis is mainly distributed in southern China, where the available P content in forest soils is low33, limiting the growth of Gleditsia sinensis P deficiency inhibits the growth of many plants, but during long-term evolution, plants have developed a complete set of adaptive mechanisms in response to low P stress. These mechanisms include changes in root morphology, physiological and biochemical processes, and gene expression25,34,35. However, the mechanisms by which Gleditsia sinensis responds to low P stress are still unclear. In recent years, research on Gleditsia sinensis has gradually increased but has mainly focused on medicinal components, sapling afforestation techniques, grafting propagation techniques, resource surveys, and the effects of different environmental conditions on the growth and development of Gleditsia sinensis. It remains uncertain whether the research results on low P adaptation mechanisms in different species are applicable to Gleditsia sinensis, whether there are differences in P use efficiency among different Gleditsia sinensis families, whether their tolerance to low P stress is consistent, and what the physiological response mechanisms to low P stress. To screen for low P tolerant Gleditsia sinensis families and establish a simple, rapid, and accurate sapling stage screening system, this study used a sand culture pot method with 30 different Gleditsia sinensis families. Two P concentrations were set: low P treatment (0.01 mmol L−1) and normal P treatment (1 mmol L−1), to explore the differences in low P tolerance among the 30 Gleditsia sinensis families. This aims to establish a preliminary screening system at the sapling stage, simplify the screening process for low P tolerance in Gleditsia sinensis, clarify the initial screening indicators for low P tolerance, and identify low P tolerant Gleditsia sinensis families. This has significant implications for the breeding of superior Gleditsia sinensis families and alleviating phosphate fertilizer consumption, providing a foundation and basis for saving phosphate fertilizer resources and protecting the agricultural ecological environment.
Materials and methods
Experimental materials
This study selected 30 families of Gleditsia sinensis from different regions in Guizhou Province as experimental materials. Seeds harvested, dried, and then refrigerated at 4 ℃. Seeds of all Gleditsia sinensis families were subjected to acid scarification, warm water soaking, and then sown. Apply low-phosphorus stress after 2 months of cultivation.
Experimental design
This study employed a completely randomized block design, and the sand culture experiment was conducted in the greenhouse of the College of Forestry at Guizhou University (106°66693′E, 26°45644′N). The environmental conditions were maintained at a temperature of 25 °C ± 2 °C, a photoperiod of 12 h per day, and a relative humidity ranging from 50 to 75%. The experiment involved two P levels: normal P (1 mmol L−1) and low P (0.01 mmol L−1), resulting in a total of 60 treatments. After cultivating Gleditsia sinensis saplings for two months, low P treatment was initiated. Each family was divided into two groups: one group received P at a concentration of 1 mmol L−1 in Hoagland nutrient solution, and the other group received P at a concentration of 0.01 mmol L−1 in Hoagland nutrient solution. Nutrient solutions were applied every 7 days with appropriate water supplementation during the period. After 3 months of stress treatment, various growth and nutrient indicators of Gleditsia sinensis saplings under normal P and low P conditions were measured, with 30 saplings per treatment.
Nutrient solution formulation
The formulation of the P-deficient Hoagland nutrient solution is as fol-lows: K2SO4: 607 mg L−1, MgSO4: 493 mg L−1, (NH4)2SO4: 66.02 mg L−1, C10H12 FeNaN2O8·3 H2O: 20 mg L−1, FeSO4: 15 mg L−1, H3BO3: 2.86 mg L−1, Na2B4O7·10H2O: 4.5 mg L−1, MnSO4: 2.13 mg L−1, CuSO4: 0.05 mg L−1, ZnSO4: 0.22 mg L−1, The P source and its concentration are provided by KH2PO4. Potassium deficient in low P concentration is supplemented with KCl. The prepared Hoagland nutrient solution is adjusted to a pH between 6 and 7 using 1 mol L− 1 NaOH.
Measurement indicators and methods
Measurement of growth indicators: Ten Gleditsia sinensis saplings were selected, and a ruler was used to measure parameters such as plant height, stem diameter after low P treatment. After low P stress treatment, Gleditsia sinensis saplings were divided into three parts: roots, stems, and leaves. Their fresh weights were measured using a precision balance. The samples were then subjected to blanching in a 105 °C oven for half an hour, followed by drying at 65 °C to a constant weight. The dry weights of each part were measured, and the root-shoot ratio was calculated.
Measurement of root morphological indicators: After low P stress treatment, ten Gleditsia sinensis saplings were selected. The roots were cleaned with tap water and then scanned using an Epson Scan root scanner (Expression 12000XL, Japan). Subsequently, the WinRHIZO Pro 2019 root analysis system was used to quantify parameters such as total root length, total root surface area, total root volume, and average root diameter.
P content measurement: The total P content in roots, stems, and leaves after low P stress treatment was determined using Inductively Coupled Plasma Atomic Emission Spectroscopy (ICPE-9820). P absorption efficiency and P use efficiency were then calculated based on the results.
Data statistics and analysis
Correlation analysis, principal component analysis, and stepwise regression analysis were conducted using SPSS 23.0 and Origin 2022 statistical software. The comprehensive evaluation of low P tolerance sequence for the 30 families of Gleditsia sinensis was performed using the fuzzy membership function. The formulas for calculating correlation indices are as follow36:
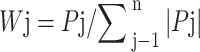
Low phosphorus tolerance coefficient = measurement value of a characteristic under low P / measurement value of the same characteristic under normal P.
 : In the formula, PAE represents P absorption efficiency (mg), PC represents P concentration (mg g−1), and DW represents dry weight (g).
PUE = DW÷PAE: In the formula, PUE represents P utilization efficiency (g mg−1);
Uxj=(Xj−Xmin)/Xmax − Xmin j = 1,2,3,……n.
In the formula: Uxj represents the membership function of the j evaluation indicator for the X family; Xj represents the j comprehensive indicator; Xmin represents the minimum value of the j comprehensive indicator; Xmax represents the maximum value of the j comprehensive indicator.
-
(5)
 j=1, 2, 3, …… n
In the formula: Wj represents the importance of the j comprehensive indicator among all the comprehensive indicators, which is the weight; Pj is the contribution rate of the j comprehensive indicator for each family line.
-
(6)
The formula for calculating the overall low P tolerance of families is as follows:
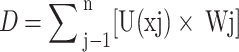
In the formula: D represents the comprehensive evaluation value of low P tolerance for Gleditsia sinensis germplasm from different sources under low P stress.
Results
Effects of low P stress treatment and different families on various indicators in Gleditsia sinensis saplings
Through non-parametric two-factor analysis of variance on various indicators. Table 1 shows that, from a single factor perspective, the differences among different family lines have reached a significant level (p < 0.05) for agronomic traits, root traits, P content, PAE and PUE. The low P treatment does not significantly affect total root length, stem P content, and stem PUE, while showing significant effects on other indicators (p < 0.05). Simultaneously, the interactive effects of different family lines × low P treatment have reached significant levels (p < 0.05) for ground diameter, main root thickness, root dry weight, root-shoot ratio, total root length, root PAE, stem P content, and stem PUE. The interactive effects of different family lines × low P treatment are not significant for the remaining indicators. The results indicate that family lines and P levels significantly influence agronomic traits, root traits, P content, PAE and PUE in Gleditsia sinensis saplings. Additionally, there is a certain degree of interaction effect observed in various indicators due to the interaction between different family lines and low P treatment.
Table 1.
Analysis of variance for measurement indicators of Gleditsia sinensis saplings under low P treatment and different family lines differences.
| Indicator | Family | P level | Family × P Level | |||
|---|---|---|---|---|---|---|
| H | p | H | p | H | p | |
| Plant height | 98.809 | 0.0000 | 31.942 | 0.0000 | 41.035 | 0.0684 |
| Stem diameter | 85.452 | 0.0000 | 36.530 | 0.0000 | 43.728 | 0.0389 |
| Main root diameter | 87.881 | 0.0000 | 12.893 | 0.0003 | 46.518 | 0.0208 |
| Root dry weight | 106.090 | 0.0000 | 11.310 | 0.0008 | 54.060 | 0.0032 |
| Stem dry weight | 114.548 | 0.0000 | 24.610 | 0.0000 | 31.816 | 0.3280 |
| Leaf dry weight | 95.002 | 0.0000 | 40.904 | 0.0000 | 29.747 | 0.4267 |
| Shoot dry weight | 107.575 | 0.0000 | 36.856 | 0.0000 | 28.162 | 0.5093 |
| Total dry weight | 111.84 | 0.0000 | 24.088 | 0.0000 | 37.782 | 0.1273 |
| Root-shoot ratio | 71.264 | 0.0000 | 9.275 | 0.0023 | 76.005 | 0.0000 |
| Total root length | 130.008 | 0.0000 | 0.347 | 0.5556 | 47.382 | 0.0170 |
| Total root surface area | 132.188 | 0.0000 | 10.304 | 0.0013 | 34.009 | 0.2389 |
| Total root projection area | 123.44 | 0.0000 | 8.424 | 0.0037 | 42.095 | 0.0551 |
| Total root volume | 128.596 | 0.0000 | 19.475 | 0.0000 | 27.526 | 0.5433 |
| Average root diameter | 87.690 | 0.0000 | 46.462 | 0.0000 | 32.199 | 0.3112 |
| Root P content | 80.512 | 0.0000 | 62.916 | 0.0000 | 33.349 | 0.2639 |
| Root PAE | 45.903 | 0.0240 | 79.497 | 0.0000 | 43.456 | 0.0413 |
| Root PUE | 80.512 | 0.0000 | 62.916 | 0.0000 | 33.349 | 0.2639 |
| Stem P content | 131.020 | 0.0000 | 2.022 | 0.1551 | 43.808 | 0.0383 |
| Stem PAE | 64.311 | 0.0002 | 66.763 | 0.0000 | 35.346 | 0.1934 |
| Stem PUE | 131.02 | 0.0000 | 2.022 | 0.1551 | 43.808 | 0.0383 |
| Leaf P content | 132.902 | 0.0000 | 5.970 | 0.0146 | 38.325 | 0.1153 |
| Leaf PAE | 76.508 | 0.0000 | 58.241 | 0.0000 | 31.130 | 0.3593 |
| Leaf PUE | 132.907 | 0.0000 | 5.984 | 0.0144 | 38.305 | 0.1157 |
| Total plant PAE | 45.869 | 0.0242 | 99.408 | 0.0000 | 27.381 | 0.5512 |
| Total plant PUE | 116.921 | 0.0000 | 21.151 | 0.0000 | 39.636 | 0.0901 |
H = test statistic, P = probability (P-value) associated with the H statistic, indicating significance.
Differential analysis of low P tolerance coefficients for various indicators in Gleditsia sinensis saplings from different families under low P stress
Due to significant growth differences among the offspring of different Gleditsia sinensis families under low and normal P conditions, in order to eliminate inter-species errors, the use of the low P tolerance coefficient can more accurately reflect their low P tolerance37. By analyzing the low-P tolerance coefficient of each trait at the sapling stage for various Gleditsia sinensis families (Fig. 1), the results showed that for morphological indicators, most Gleditsia sinensis families had a low P tolerance coefficient of less than 1 for plant height, stem diameter, main root diameter, and dry weight of root, stem, and leaf organs. However, compared to other morphological indicators, a relatively larger number of families had a low P tolerance coefficient for root dry weight greater than 1. Among these morphological indicators, the F9 family had the highest low P tolerance coefficient for root dry weight at 1.66, while the lowest tolerance coefficient for stem dry weight was 0.23. This indicates that, compared to normal P conditions, low P stress significantly reduced the plant height, stem diameter, and biomass of most Gleditsia sinensis families, suggesting that a low P environment inhibits the growth and development of most Gleditsia sinensis. Morphological comparison of Gleditsia sinensis families with low phosphorus tolerance (F13) and low phosphorus sensitivity (F21) is shown in Fig. S1.
Fig. 1.

Low P tolerance coefficients for various indicators in Gleditsia sinensis.
For root morphological indicators, the low P tolerance coefficient for total root length ranged from 0.65 to 2.44, with the F13 family having the highest coefficient. Notably, 14 Gleditsia sinensis families had a total root length tolerance coefficient greater than 1. Eight families had a tolerance coefficient greater than 1 for both total root surface area and total root projection area. The total root surface area tolerance coefficient ranged from 0.58 to 1.53, and the total root projection area tolerance coefficient ranged from 0.46 to 1.50. Remarkably, the F13 family showed the highest tolerance coefficients in both total root surface area and total root projection area. Six families had a total root volume tolerance coefficient greater than 1, ranging from 0.32 to 1.43, with the F10 family having the highest coefficient. Five families had a root average diameter tolerance coefficient greater than 1, ranging from 0.65 to 1.16, with the F15 family having the highest coefficient. Our study results indicate that low P stress significantly affects the root-shoot ratio of Gleditsia sinensis saplings. The root-shoot ratio tolerance coefficient ranged from 0.53 to 2.46. Twenty families had a root-shoot ratio tolerance coefficient greater than 1, with the highest reaching 2.46. Only ten families had a root-shoot ratio tolerance coefficient less than 1, and within these ten, two families had coefficients close to 1, at 0.99 and 0.98, with the lowest being 0.53.Therefore, under low P stress, Gleditsia sinensis saplings may increase root indicators such as total root length, total root surface area, and total root projection area to obtain more P for growth and development, as well as significantly increase the root-shoot ratio to adapt to the low P environment.
By measuring the P content in the roots, stems, and leaves of different Gleditsia sinensis families under low P stress, we found that low P stress reduced the P content and PAE in most Gleditsia sinensis roots, stems, and leaves, with the most significant reduction in root P content. However, it increased the PUE in these organs. Except for two families, the low P tolerance coefficient of PUE in the roots of the remaining 28 families was greater than 1, ranging from 0.84 to 2.8. The low P tolerance coefficient of PUE in the stems and leaves of 20 families was greater than 1, and 25 families had a whole plant PUE tolerance coefficient greater than 1. Therefore, low P stress can significantly increase the P absorption and utilization in Gleditsia sinensis families, and increased PUE is one of the strategies Gleditsia sinensis employs to resist and adapt to low P environments. Under low P stress, different Gleditsia sinensis families exhibit varying degrees of changes in each indicator. Evaluating the low P tolerance of Gleditsia sinensis using the low P tolerance coefficients of individual indicators may yield different results. Therefore, judging the low P tolerance of Gleditsia sinensis based on the low P tolerance coefficients of individual indicators may lead to significant differences in the results.
Correlation analysis of low P tolerance coefficients for various indicators in Gleditsia sinensis saplings from different families under low P stress
By analyzing the low P tolerance coefficients of various indicators under low P stress, we found significant correlations among many trait indicators, as shown in Fig. 2. This indicates that there is a certain degree of overlap in the information provided by each indicator, making it challenging to scientifically evaluate the low P tolerance of different Gleditsia sinensis families based solely on individual indicators. In our study, we used a correlation heatmap to show the relationships between various variables (Fig. 2), revealing a clear pattern of correlations. The correlation heatmap uses color and size to represent correlation coefficients, with red indicating positive correlation, blue indicating negative correlation, and the depth of the color representing the strength of the correlation.
Fig. 2.

Correlation analysis of low P tolerance coefficients for each indicators. * indicates significance at the 0.05 level, ** indicates significance at the 0.01 level, ***indicates significance at the 0.001 level.
Specifically, plant height and stem diameter had a significant positive correlation (r = 0.54), indicating that as the height of Gleditsia sinensis increases, the stem diameter also increases, likely due to overall plant growth driving stem expansion. The total dry weight was highly correlated with the dry weights of various parts, the correlation with root dry weight was r = 0.87, indicating that an increase in root biomass significantly drives the increase in total biomass. The correlation with stem dry weight was r = 0.61, suggesting that stem biomass also greatly contributes to total biomass. The correlation with leaf dry weight was r = 0.52, showing that leaf biomass is also an important component of total biomass. Root PAE and root dry weight had a very strong positive correlation (r = 0.88), demonstrating a close relationship between PAE and root biomass, possibly because a robust root system can more effectively facilitate P absorption. Root dry weight and root-shoot ratio had a significant positive correlation (r = 0.75), indicating that an increase in root dry weight can enhance the root-shoot ratio of Gleditsia sinensis saplings. The correlations of root P content with root PAE and root PUE were r=-0.076 and r=-0.91, respectively, with a highly significant negative correlation between root P content and root PUE. This suggests that higher P content may reduce PAE and PUE, possibly due to P saturation effects or relative deficiencies of other nutrients. There was no significant correlation between root-shoot ratio and root surface area, stem P content, and stem PUE, indicating no direct relationship between these variables. Leaf P content and whole plant PAE were not significantly correlated (r=-0.14), indicating no obvious linear relationship between leaf P content and whole plant PAE. These correlation results provide valuable insights into the relationships among different parts of Gleditsia sinensis and the interactions of various growth and physiological parameters. For example, the highly significant negative correlation between whole plant PUE and the P content of roots, stems, and leaves indicates that when P is abundant in the plant, the PUE decreases. Only under relatively low P conditions might Gleditsia sinensis rapidly activate PUE to maintain growth and development. The positive correlation between root dry weight and root-shoot ratio may suggest a trade-off in resource allocation, where an increase in root biomass leads to an increased root-shoot ratio, ensuring the plant remains in a relatively stable state.
Principal component analysis of low P tolerance coefficients for various indicators in Gleditsia sinensis saplings from different families under low P stress
As shown in Fig. 3, It is challenging to scientifically evaluate the low P tolerance of different families of Gleditsia sinensis based on individual indicators alone. In order to more accurately analyze the low P tolerance of different Gleditsia sinensis families, principal component analysis was conducted on the low P tolerance coefficients for various indicators. This transformation of the original indicators into fewer composite indicators reduces information loss, condenses data, and simplifies the indicators. Principal component analysis was conducted on the low P tolerance coefficients for 25 indicators of different Gleditsia sinensis families. The results (Table S1) indicate that the principal component analysis transformed the 25 low P-related indicators into 6 principal components, each with eigenvalues greater than 1. Among them, the eigenvalue of Principal Component 1 is 9.530, contributing 38.120%; the eigenvalue of Principal Component 2 is 5.009, contributing 20.037%; the eigenvalue of Principal Component 3 is 2.553, contributing 10.214%; the eigenvalue of Principal Component 4 is 2.108, contributing 8.430%; the eigenvalue of Principal Component 5 is 1.366, contributing 5.464%; and the eigenvalue of Principal Component 6 is 1.120, contributing 4.478%. The cumulative contribution rate is 86.743%. These 6 principal components can be used as comprehensive indicators to evaluate the low P tolerance of Gleditsia sinensis.
Fig. 3.

PCA of low P tolerance coefficients for each indicators.
The characteristic vectors indicate the degree and direction of the load impact of each trait on the principal components. The research results indicate (Table S1), in the first principal component, root PUE, total plant PUE, and leaf PUE have significantly positive coefficient values, while root P content and leaf P content have significantly negative coefficient values. This suggests that when the first principal component is large, root PUE, total plant PUE, and leaf PUE increase, while root P content and leaf P content decrease. The first principal component mainly reflects the plant’s P nutrition accumulation ability, so it is classified as a P nutrition indicator. In the second principal component, root PAE, root dry weight, root-shoot ratio, total plant PAE, and total dry weight have significantly positive coefficient values, indicating that these five indicators have a significant positive impact on the second principal component. These indicators mainly reflect the PAE and biomass of the root system and the entire plant. Therefore, the second principal component is classified as a biomass indicator. In the third principal component, leaf dry weight and leaf PAE have significantly positive coefficient values, indicating that these two indicators have a significant positive impact on the third principal component. These two indicators mainly reflect the biomass and PAE of the leaves. Therefore, the third principal component is classified as leaf indicators. In the fourth principal component, stem dry weight and stem PUE have significantly positive coefficient values, while stem P content has a significantly negative coefficient value. These three indicators are mainly related to the stem, so the fourth principal component is classified as stem indicators. In the fifth principal component, total root surface area, total root projection area, and total root length have significantly positive coefficient values, indicating that these three indicators have a substantial positive impact on the fifth principal component. These indicators primarily reflect the growth of Gleditsia sinensis root system, so the fifth principal component is classified as root morphology indicators. In the sixth principal component, root average diameter, stem diameter, and total root volume have significantly positive coefficient values, indicating that these three indicators have a substantial positive impact on the sixth principal component. These indicators primarily reflect the thickness of root and stem, so the sixth principal component is classified as volume indicators.
Comprehensive evaluation of low P tolerance in different Gleditsia sinensis families
Through principal component analysis, the 25 individual indicators have been transformed into six independent composite indicators. The membership function values for each composite indicator were calculated using Eq. (4), as shown in Table 2. The corresponding membership function value µ(Xi) was calculated based on the values of each composite indicator CIi. The Wj were calculated using Eq. (5), where the weights for each indicator were determined based on their contribution rates. The weights for the six independent composite indicators were 0.4395, 0.2310, 0.1178, 0.0972, 0.0630, and 0.0516, respectively. The research results indicate that the low P tolerance varies among different Gleditsia sinensis families. The comprehensive evaluation value (D value) of low P tolerance for different Gleditsia sinensis families was calculated using Eq. (6). A larger D value implies stronger low P tolerance. Among them, the family F13 had the highest comprehensive evaluation value, reaching 0.8053, indicating that the F13 family is the most tolerant to low P conditions. On the other hand, the family F21 had the smallest comprehensive evaluation value, measuring 0.3014, suggesting its relatively poor low P tolerance. The low P tolerance of different Gleditsia sinensis families, from highest to lowest, is as follows:
Table 2.
Comprehensive trait index values, weights, membership function values, and comprehensive evaluation values of different Gleditsia sinensis families.
| Family number | CI1 | CI2 | CI3 | CI4 | CI5 | CI6 | µ(X1) | µ(X2) | µ(X3) | µ(X4) | µ(X5) | µ(X6) | D | Ranking |
|---|---|---|---|---|---|---|---|---|---|---|---|---|---|---|
| F1 | 0.7273 | -1.9157 | -1.2814 | -0.8938 | 0.1517 | -0.0661 | 0.6206 | 0.3703 | 0.4286 | 0.3924 | 0.5499 | 0.4250 | 0.5034 | 19 |
| F2 | 1.7657 | 0.5646 | -0.7441 | -1.9143 | -0.9534 | -0.2887 | 0.7042 | 0.5860 | 0.5002 | 0.2432 | 0.3590 | 0.3788 | 0.5696 | 12 |
| F3 | 0.0617 | 1.6342 | 0.2046 | 1.4182 | -0.1731 | -0.7905 | 0.5669 | 0.6791 | 0.6266 | 0.7305 | 0.4938 | 0.2746 | 0.5961 | 9 |
| F4 | -1.9915 | 0.0260 | 0.5013 | -2.2413 | 0.1039 | -1.1028 | 0.4015 | 0.5392 | 0.6662 | 0.1954 | 0.5416 | 0.2098 | 0.4434 | 24 |
| F5 | -1.4984 | 1.4255 | -1.9072 | 0.6633 | 1.9496 | -0.5416 | 0.4412 | 0.6609 | 0.3452 | 0.6201 | 0.8605 | 0.3263 | 0.5185 | 17 |
| F6 | 5.4362 | -6.1731 | 1.6069 | 1.2005 | 0.5415 | -2.1130 | 1.0000 | 0.0000 | 0.8135 | 0.6987 | 0.6172 | 0.0000 | 0.6420 | 7 |
| F7 | 1.8114 | -3.9117 | -3.3006 | 0.6331 | -1.1904 | -0.9902 | 0.7079 | 0.1967 | 0.1595 | 0.6157 | 0.3180 | 0.2331 | 0.4672 | 22 |
| F8 | -0.0425 | -0.7866 | 0.8665 | -0.4585 | -0.3302 | -0.5154 | 0.5585 | 0.4685 | 0.7149 | 0.4561 | 0.4666 | 0.3317 | 0.5287 | 16 |
| F9 | 4.0510 | 4.2331 | -0.8731 | -2.1482 | 0.9320 | 0.1289 | 0.8884 | 0.9051 | 0.4830 | 0.2090 | 0.6847 | 0.4655 | 0.7438 | 3 |
| F10 | 4.2983 | 2.7433 | -1.0333 | 2.3896 | 2.7569 | -0.7248 | 0.9083 | 0.7755 | 0.4617 | 0.8726 | 1.0000 | 0.2882 | 0.7953 | 2 |
| F11 | 0.8116 | -0.6763 | -1.3358 | 0.4896 | -0.0818 | -0.5738 | 0.6274 | 0.4781 | 0.4213 | 0.5947 | 0.5096 | 0.3196 | 0.5422 | 14 |
| F12 | 1.1123 | -0.7001 | -1.0304 | -1.1537 | 0.6507 | 0.4186 | 0.6516 | 0.4760 | 0.4621 | 0.3544 | 0.6361 | 0.5257 | 0.5524 | 13 |
| F13 | 4.3947 | 5.3238 | 0.2447 | 1.6843 | -3.0311 | -0.0090 | 0.9161 | 1.0000 | 0.6320 | 0.7694 | 0.0000 | 0.4369 | 0.8053 | 1 |
| F14 | -2.0956 | -0.5482 | -4.4973 | 0.4419 | 0.0119 | 0.5335 | 0.3931 | 0.4893 | 0.0000 | 0.5878 | 0.5257 | 0.5495 | 0.4044 | 28 |
| F15 | 3.3637 | -1.7514 | 1.2121 | 1.7740 | 0.6447 | 2.7030 | 0.8330 | 0.3846 | 0.7609 | 0.7826 | 0.6351 | 1.0000 | 0.7122 | 5 |
| F16 | 1.3993 | -1.2700 | 0.0399 | -3.5776 | -0.5050 | 1.4432 | 0.6747 | 0.4265 | 0.6047 | 0.0000 | 0.4364 | 0.7384 | 0.5318 | 15 |
| F17 | 2.5673 | -1.4451 | -1.2038 | -0.6760 | -1.8090 | 1.0617 | 0.7688 | 0.4112 | 0.4389 | 0.4243 | 0.2111 | 0.6592 | 0.5731 | 10 |
| F18 | 3.7185 | 0.4219 | 2.9282 | 0.9166 | -1.4866 | -0.5337 | 0.8616 | 0.5736 | 0.9896 | 0.6572 | 0.2668 | 0.3279 | 0.7253 | 4 |
| F19 | -4.1818 | 1.1300 | 1.5862 | -0.5751 | 0.2186 | -0.4003 | 0.2250 | 0.6352 | 0.8108 | 0.4391 | 0.5615 | 0.3556 | 0.4375 | 25 |
| F20 | 0.2605 | 1.6664 | 0.2835 | -1.3204 | -0.3853 | -0.0389 | 0.5830 | 0.6819 | 0.6372 | 0.3301 | 0.4571 | 0.4307 | 0.5718 | 11 |
| F21 | -6.9744 | 0.5460 | -0.3466 | 0.0081 | -0.3888 | -0.1044 | 0.0000 | 0.5844 | 0.5532 | 0.5243 | 0.4565 | 0.4171 | 0.3014 | 30 |
| F22 | -4.4784 | 1.4403 | 0.1711 | 3.2610 | -1.0837 | 0.3751 | 0.2011 | 0.6622 | 0.6222 | 1.0000 | 0.3365 | 0.5166 | 0.4597 | 23 |
| F23 | -0.1206 | 2.3303 | 0.1265 | -0.0839 | 0.5182 | 1.2427 | 0.5523 | 0.7396 | 0.6162 | 0.5109 | 0.6132 | 0.6968 | 0.6103 | 8 |
| F24 | -3.0391 | -1.2794 | 1.8308 | -0.2206 | -1.3899 | 0.5916 | 0.3171 | 0.4257 | 0.8434 | 0.4909 | 0.2836 | 0.5616 | 0.4315 | 27 |
| F25 | -4.7494 | -2.4880 | 1.3294 | 0.9851 | -0.1540 | -0.0312 | 0.1793 | 0.3205 | 0.7766 | 0.6672 | 0.4971 | 0.4323 | 0.3627 | 29 |
| F26 | -1.2606 | 0.3403 | 1.0216 | -0.9524 | 0.2151 | -1.5063 | 0.4604 | 0.5665 | 0.7355 | 0.3839 | 0.5609 | 0.1260 | 0.4989 | 20 |
| F27 | -1.4385 | -2.2163 | -0.2399 | 1.2912 | 0.8360 | 2.6195 | 0.4461 | 0.3442 | 0.5674 | 0.7120 | 0.6681 | 0.9827 | 0.5043 | 18 |
| F28 | 2.4159 | 0.1582 | 3.0060 | -0.6140 | 2.0483 | 0.7308 | 0.7566 | 0.5507 | 1.0000 | 0.4334 | 0.8776 | 0.5905 | 0.7053 | 6 |
| F29 | -4.0184 | 0.3231 | 1.2628 | -0.5675 | 1.1943 | -0.2603 | 0.2382 | 0.5650 | 0.7677 | 0.4402 | 0.7300 | 0.3847 | 0.4342 | 26 |
| F30 | -2.3063 | 0.8549 | -0.4285 | 0.2409 | 0.1889 | -1.2578 | 0.3761 | 0.6113 | 0.5423 | 0.5584 | 0.5563 | 0.1776 | 0.4688 | 21 |
| Weight | 0.4395 | 0.2310 | 0.1178 | 0.0972 | 0.0630 | 0.0516 |
F13 > F10 > F9 > F18 > F15 > F28 > F6 > F23 > F3 > F17 > F20 > F2 > F12 > F11 > F16 > F8 > F5 > F27 > F1 > F26 > F30 > F7 > F22 > F4 > F19 > F29 > F24 > F14 > F25 > F21.
Cluster analysis
As shown in Fig. 4, cluster analysis was conducted on the comprehensive evaluation values of low P tolerance (D value) using the euclidean distance method. When the euclidean distance was set at 5, the 30 Gleditsia sinensis families could be classified into 4 groups based on their low P tolerance capabilities.
Fig. 4.

Cluster diagram of low P tolerance for 30 different Gleditsia sinensis families.
Cluster I comprise 6 families, divided into two subgroups. The first subgroup consists of 2 families (F13, F10), and the second subgroup comprises 4 families (F9, F18, F15, F28). This cluster exhibits higher comprehensive evaluation values for low P tolerance (D value), ranging from 0.7053 to 0.8053. The average D value is 0.7479, and the overall ranking is within the top 1–6. This group is classified as low-P tolerant types.
Cluster II comprise 14 families, divided into two subgroups. The first subgroup consists of 6 families (F6, F23, F3, F17, F20, F2), and the second subgroup comprises 8 families (F12, F11, F16, F8, F5, F27, F1, F26). This cluster exhibits comprehensive evaluation values for low P tolerance (D value) ranging from 0.4989 to 0.6420. The average D value is 0.5531, and the overall ranking is generally in the middle, ranging from 7th to 20th. These families are classified as intermediate types in terms of low P tolerance.
Cluster III consists of 9 families, divided into two subgroups. The first subgroup comprises 7 families (F30, F7, F22, F4, F19, F29, F24), and the second subgroup consists of 2 families (F14, F25). This cluster exhibits relatively low comprehensive evaluation values for low P tolerance (D value), ranging from 0.3627 to 0.4688. The average D value is 0.4344, and the overall ranking is generally towards the lower end, ranging from 21st to 29th. This cluster is classified as relatively low P sensitive types.
Cluster IV consists of a single family, F21, with a low P tolerance comprehensive evaluation value (D value) of 0.3014. It is ranked 30th, occupying the last position. This family is classified as extremely low P sensitive type.
Establishing regression models and selecting identification indicators
To understand the correlation between various measurement indicators and the comprehensive evaluation value for low P tolerance (D value), key identification indicators for low P tolerance in Gleditsia sinensis were selected. In this study, a stepwise regression analysis was conducted with the comprehensive evaluation value as the dependent variable and the low P tolerance coefficients of various measurement indicators as independent variables.
The established regression model is as follows: D=-0.005 + 0.323* Stem diameter + 0.154 * Total root volume + 0.196* Shoot dry weight + 0.139* Total root projection area − 0.112* Leaf P content (where the equation’s coefficient of determination R2 = 0.988, P < 0.01, and the F-value is 397.192). This indicates a high credibility and strong explanatory power of the regression equation. It can be utilized for screening low P identification indicators and predicting low P tolerance. Based on the equation results, the following five indicators were selected as having stronger correlations among the 25 indicators: stem diameter, total root volume, shoot dry weight, total root projection area, and leaf P content. From Table 3, it is evident that further precision comparison of the regression equation reveals that the accuracy of the 30 Gleditsia sinensis families is all above 93.00%, with an average accuracy of 97.78%. This suggests that these five indicators have a significant impact on the low P tolerance of Gleditsia sinensis. The regression equation provides a high level of accuracy in evaluating the low P tolerance of Gleditsia sinensis families, making it suitable for assessing the low P tolerance of other Gleditsia sinensis families.
Table 3.
Accuracy analysis of the regression equation for low P tolerance evaluation of 30 Gleditsia sinensis families.
| Family number | Original value | Regression value | Difference value | Accuracy (%) |
|---|---|---|---|---|
| F1 | 0.5034 | 0.5078 | -0.0043 | 99.1443 |
| F2 | 0.5696 | 0.5573 | 0.0123 | 97.8471 |
| F3 | 0.5961 | 0.5957 | 0.0004 | 99.9391 |
| F4 | 0.4434 | 0.4506 | -0.0072 | 98.3728 |
| F5 | 0.5185 | 0.4966 | 0.0219 | 95.7771 |
| F6 | 0.6420 | 0.6398 | 0.0023 | 99.6456 |
| F7 | 0.4672 | 0.4757 | -0.0085 | 98.1907 |
| F8 | 0.5287 | 0.5409 | -0.0122 | 97.6947 |
| F9 | 0.7438 | 0.7352 | 0.0087 | 98.8347 |
| F10 | 0.7953 | 0.7897 | 0.0056 | 99.2941 |
| F11 | 0.5422 | 0.5264 | 0.0158 | 97.0854 |
| F12 | 0.5524 | 0.5685 | -0.0161 | 97.0763 |
| F13 | 0.8053 | 0.8032 | 0.0021 | 99.7393 |
| F14 | 0.4044 | 0.4082 | -0.0038 | 99.0575 |
| F15 | 0.7122 | 0.7076 | 0.0046 | 99.3556 |
| F16 | 0.5318 | 0.5292 | 0.0027 | 99.5002 |
| F17 | 0.5731 | 0.5698 | 0.0033 | 99.4285 |
| F18 | 0.7253 | 0.7520 | -0.0267 | 96.3193 |
| F19 | 0.4375 | 0.4672 | -0.0297 | 93.2136 |
| F20 | 0.5718 | 0.5896 | -0.0178 | 96.8848 |
| F21 | 0.3014 | 0.3182 | -0.0168 | 94.4220 |
| F22 | 0.4597 | 0.4641 | -0.0045 | 99.0317 |
| F23 | 0.6103 | 0.5954 | 0.0150 | 97.5425 |
| F24 | 0.4315 | 0.4096 | 0.0219 | 94.9140 |
| F25 | 0.3627 | 0.3724 | -0.0096 | 97.3407 |
| F26 | 0.4989 | 0.4775 | 0.0215 | 95.6952 |
| F27 | 0.5043 | 0.5155 | -0.0111 | 97.7916 |
| F28 | 0.7053 | 0.7133 | -0.0080 | 98.8666 |
| F29 | 0.4342 | 0.4204 | 0.0138 | 96.8294 |
| F30 | 0.4688 | 0.4617 | 0.0071 | 98.4815 |
Discussion
As one of the most important mineral elements, P is not only a component of many essential compounds in plants, such as nucleic acids, proteins, and phospholipids, but also plays a crucial role in photosynthesis, respiration, and numerous enzyme-catalyzed reactions38. P is an essential and abundant nutrient element in plants, serving various functions39. P deficiency directly impacts the morphological development, biomass, and yield of plants40. To ensure crop yield and quality, farmers often increase the application of P fertilizer on P-deficient soils. The low availability of P in soil highlights the importance of strategies aimed at improving soil P effectiveness and enhancing the internal organ P utilization efficiency in plants, which are key measures for enhancing the productivity of crops in low P soils41.
The afforestation area of Gleditsia sinensis is increasing year by year, and most Gleditsia sinensis plantations have adopted intensive management. However, the yield remains low, especially the yield per unit area. Our investigation found that within the same stand and under the same management measures, there is a significant difference in yield among different strains of the same family of Gleditsia sinensis. Soil nutrient content measurements from several sample plots revealed varying nutrient levels across different plots. Therefore, we preliminarily conclude that the low yield of Gleditsia sinensis might be due to insufficient soil nutrients. Different crop species and families within the same crop can exhibit varying levels of tolerance to P42–48. The lowP tolerance of crops is a complex trait influenced by numerous factors. To adapt to low P environments, plants develop a unique set of adaptive mechanisms during their growth and development processes49. The seedling stage is a critical period for determining the establishment of crop populations. Simultaneously, seedling-stage breeding offers advantages such as short screening time and large capacity50,51. Therefore, screening low P tolerant Gleditsia sinensis families during the sapling stage is of significant importance for production. In recent years, research on Gleditsia sinensis has primarily focused on resource collection and evaluation52, the phylogenetic evolution of Gleditsia sinensis plants53, chemical composition analysis of Gleditsia sinensis seeds54, morphological characteristics of Gleditsia sinensis thorns55, seedling cultivation and cultivation techniques, as well as the extraction process and analysis of bioactive substances56. However, there is currently no comprehensive research reported on the low P tolerance of Gleditsia sinensis during the sapling stage. Most scholars generally believe that a screening and evaluation system combining multiple indicators and methods is more reliable57–59. However, when screening for P tolerance in different crops or families of the same crop, previous studies have employed different indicators60,61. Therefore, using a single indicator or method cannot accurately and effectively assess a plant’s tolerance to low P, and the reliability of the selected indicators cannot be determined. The use of a comprehensive evaluation value to assess P efficiency types has been applied to multiple plants62,63.
In terms of root morphology, numerous studies showed that plants developed their own adaptive mechanisms in low P environments. Under low P conditions, the root system was the most visibly affected part of the plant64. Plants could adapt to low P stress by altering root characteristics and morphology to enhance P absorption and utilization65. Low P stress increased root surface area, total root number, lateral root length, lateral root number, and root volume, thereby expanding the root’s P absorption area66. In Zea mays, some genotypes responded to low P stress by increasing the number and length of lateral roots, while other genotypes exhibited completely opposite responses67. Providing a certain amount of Ca2+ resulted in longer roots, larger root surface area, greater root diameter, and larger root volume in Cunninghamia lanceolata seedlings under low P stress43. Some study suggests that, the P-ring may have acted as a signaling dock that regulated lateral root emergence through P signaling. The relative central position of the P-ring in root cross-sections and the P-rich pericycle cells indicated that the P contained in these cells might be utilized for vascular/non-vascular tissue growth on either side of the P-ring, besides supporting or signaling lateral root formation68. In the roots of gymnosperm Pinus pinea, dicot Zea mays, and Arachis hypogaea seedlings, it was found that the distribution of K and P was species-specific. The P-ring (P-rich cells) was present in all three species and was located in a similar position, indicating the evolutionary and physiological significance of these cells in the growth and development of seedling roots69. It remains to be studied whether a similar P-ring exists in the root system of Gleditsia sinensis saplings and whether it plays a role. Our study results indicated that the total root length, total root surface area, total root projection area, and total root volume of low P tolerant Gleditsia sinensis families such as F10, F13 and F15 all had a low P tolerance coefficient greater than 1. Notably, the F13 family had the highest low P tolerance coefficient for total root length at 2.44, indicating that low P stress significantly increased these root morphology indicators, thus promoting root growth in Gleditsia sinensis. Conversely, in low P-sensitive families, the changes were opposite. The total root surface area, total root projection area, total root volume, and average root diameter of the low P-sensitive Gleditsia sinensis family F21 were all less than 1, with the total root volume having the lowest low P tolerance coefficient of 0.47. This indicated that low P conditions significantly inhibited root development in low P-sensitive Gleditsia sinensis families, leading to poor root development. Therefore, changes in root morphology were one of the important responses of Gleditsia sinensis saplings to low P stress.
In terms of the root-shoot ratio, changes in this ratio are typical adaptive responses of plants to variations in nutrient utilization capacity70. Deficiencies in N, P, or S can lead to a shift in dry matter distribution favoring root growth71. A positive correlation between P uptake efficiency and root-shoot ratio was observed across all cultivars at low Pi supply72. Studies have shown that under low P conditions, plants allocate more nutrients to the roots by reducing shoot growth, leading to an increased root-shoot ratio73. Under low P stress, efficient P activating Arachis hypogaea families increase the activation of insoluble inorganic P in the environment by altering root structure, enhancing root-shoot ratio, root activity, and the secretion of protons and organic acids74. Different scions significantly affect the root-shoot ratio, root morphology, and other traits of Camellia oleifera75. Under P deficiency conditions, the root-shoot ratio of Phyllostachys edulis increased, tolerant Phyllostachys edulis exhibited a robust response to external low P conditions, marked by elevated expression levels of PHOSPHATE TRANSPORTERs and SYG1/PHO81/XPR1s78.Our study results showed that under low P stress, 20 out of 30 Gleditsia sinensis families had a root-shoot ratio greater than 1, with the highest low P tolerance coefficient for root-shoot ratio reaching 2.46. Only 10 Gleditsia sinensis families had a root-shoot ratio tolerance coefficient less than 1, and among these, two families had a root-shoot ratio tolerance coefficient close to 1, at 0.99 and 0.98. The lowest root-shoot ratio tolerance coefficient was 0.53. Therefore, it is evident that most Gleditsia sinensis families significantly increased their root-shoot ratio to adapt to low P environments when subjected to low P stress. Our research results are largely consistent with previous findings76.
In terms of morphological growth, many studies showed that low P stress had a significant impact on root growth, but it also affected other morphological indicators of plants. The root- shoot biomass ratio changed; however, the belowground biomass did not change in response to decreased P content of the growing substrate77. Research indicated that under low P stress, the growth of eucalyptus was inhibited, with a significant reduction in stem and root biomass78. Under P deficiency conditions, the total biomass decreased in several genotypes79. Low P stress treatment reduced the total dry weight of Malus pumila, causing slow growth of the above-ground parts of the Malus pumila80. Our study results showed that under low P stress, the height, stem diameter, and biomass of root, stem, and leaf organs of most Gleditsia sinensis Lam. families significantly decreased. Only two Gleditsia sinensis families had a low P tolerance coefficient for height greater than or equal to 1, while the other 29 families were less than 1. However, the low P tolerance coefficient values for height in the tolerant F10 and F13 families were still relatively high, at 0.95. The low P tolerance coefficients for stem diameter, main root thickness, root dry weight, and total dry weight in the F10 and F13 tolerant Gleditsia sinensis families were all greater than 1, while the opposite was true for the F21 sensitive family, where these indicators had low P tolerance coefficients of less than 1, with the lowest being 0.35. This indicated that low P stress inhibited the growth of most Gleditsia sinensis families, but the impact was minimal on the low P tolerant families. It indicated that the low P tolerant Gleditsia sinensis families were the least inhibited, and stable dry matter accumulation was an important reason for maintaining homeostasis in the low P tolerant families.
In terms of P utilization efficiency, low P stress had a significant impact on P absorption and utilization efficiency. For example, low P stress affected the P absorption efficiency of different Dioscorea esculenta genotypes, resulting in variations in P content among different organs, there was a high correlation between root dry matter and P absorption, and genotypes S11 and S17 exhibited higher P utilization efficiency, physiological efficiency and P utilization efficiency were significantly positively correlated with tuber dry matter, indicating that low P limited Dioscorea esculenta growth81. Different Solanum tuberosum varieties had varying strategies for P deficiency, and their responses to phosphorus fertilizer might differ. Under low P conditions, the Mondial family achieved the highest tuber yield, P absorption efficiency, and P utilization efficiency82. Different Cunninghamia lanceolata with varying P utilization efficiencies secreted different amounts of organic acids under low P stress conditions. In the absence of insoluble P in the rhizosphere, organic acid secretion did not improve P utilization efficiency. However, it was noteworthy that high P utilization efficiency Cunninghamia lanceolata adapted more effectively to low P environments compared to low P utilization efficiency Cunninghamia lanceolata83. A comparison of two Oryza sativa families with strong low P tolerance and two families with weak low P tolerance under normal and low P levels indicated that STVs had higher grain yield and PUE under low P conditions84. Low P stress significantly reduced Malus mandshurica aboveground biomass, photosynthetic rate, and total P content, and significantly increased the ACP, SOD, POD, CAT, with many enzyme-related candidate genes such as MmCAT1, MmSOD1, and MmPOD21 being significantly upregulated85. The results of this study indicated that, with a few exceptions, low P stress significantly increased the P utilization efficiency of most Gleditsia sinensis families roots, stems, leaves, and whole plants. Specifically, the P utilization efficiency of the low P tolerant families F10 and F13 was greater than 1 for all organs and the whole plant, indicating that low P stress significantly enhanced the P absorption and utilization of low P tolerant Gleditsia sinensis families. In contrast, the sensitive family F21 had P utilization efficiency values less than 1 for these indicators. Therefore, increased P utilization efficiency is one of the strategies for Gleditsia sinensis to withstand low P environments, and improved P utilization efficiency is a hallmark response for low P tolerant Gleditsia sinensis families adapting to low P conditions.
In summary, this study used 30 Gleditsia sinensis families to measure growth indicators, root morphology, P content at different sites, P absorption and P utilization efficiency under low P stress, with the aim of exploring the P tolerance of different Gleditsia sinensis families. To eliminate inherent biological and genetic differences between the original data, the P tolerance coefficient of each Gleditsia sinensis family was used as a basic indicator. The comprehensive evaluation value (D value) of P tolerance was then calculated using the membership function method. Subsequently, cluster analysis divided the 30 Gleditsia sinensis families into four categories. Finally, stepwise regression analysis was conducted with the D value as the dependent variable and the remaining 25 indicators as independent variables to obtain the regression model equation and identify five indicators used to evaluate P tolerance at the sapling stage of different Gleditsia sinensis families. When plants are deficient in P, they are induced by P deficiency signals, leading to an increased allocation of assimilates to the roots. Due to metabolic disturbances caused by P deficiency, soluble carbohydrate synthesis and transport are impeded, resulting in increased root biomass while reducing the accumulation of above-ground biomass. However, overall growth is still reduced compared to normal P levels86. The results of this study indicate that Gleditsia sinensis saplings mainly adapt to P deficiency environments through slow growth of the shoot parts and increased allocation of assimilates to the roots. Therefore, Gleditsia sinensis roots accelerate growth, resulting in a larger P absorption area to complete the absorption, transport, distribution, and reutilization of P in the growing environment, thus adapting to P deficiency conditions.
Conclusion
This study began with an examination of the morphology, root growth, and physiological and biochemical aspects of Gleditsia sinensis saplings, using P tolerance coefficients to preliminarily investigate the P tolerance response of these saplings. Cluster analysis categorized the 30 Gleditsia sinensis families into four groups: six were classified as P tolerant, fourteen as intermediate, nine as P sensitive, and one as extremely P sensitive. Compared to normal P supply, low P stress significantly affected the growth of Gleditsia sinensis saplings. Under low P stress, most saplings exhibited significant reductions in plant height, stem diameter, root, stem and leaf biomass, and total biomass. Among these morphological growth indicators, the P tolerance coefficient for leaf dry weight of the P tolerant family F13 was as low as 0.92, while the root dry weight tolerance coefficient was as high as 1.60. In contrast, the P sensitive family F21 had a minimum stem dry weight tolerance coefficient of 0.35 and a maximum plant height tolerance coefficient of 0.74, indicating that the P tolerant families experienced the least suppression, with stable dry biomass accumulation being a key reason for maintaining stability within these families. Root morphology of different Gleditsia sinensis saplings varied under low P conditions. The P tolerant families adapted to the low P environment by significantly increasing total root length, total root surface area, total root projection area, total root volume, and root-shoot ratio, whereas the P sensitive families exhibited the opposite trend, with generally low P tolerance coefficients for these root morphology indicators. This suggests that their root growth was inhibited, and changes in root morphology and increased root-shoot ratio were important responses of saplings to low P stress. The P tolerance coefficients for PAE and PUE of the P tolerant family F13 were both greater than 1, indicating that significantly improving PAE and PUE was also a key strategy for adapting to low P conditions. Therefore, there are substantial differences in the response strategies to low P between P tolerant and P sensitive families. Additionally, for future evaluations of P tolerance in Gleditsia sinensis germplasm resources, stem diameter, total root volume, shoot dry weight, total root projection area, and leaf P content can be used as key indicators for initial screening of P tolerance at the sapling stage. This approach ensures a certain level of accuracy while improving testing efficiency, shortening the screening period, and significantly increasing the efficiency of screening tests. This study provides a theoretical basis for screening P tolerance in Gleditsia sinensis germplasm resources.
Electronic supplementary material
Below is the link to the electronic supplementary material.
Abbreviations
- Len
Total root length
- SA
Total root surface area
- PA
Total root projection area
- Vol
Total root volume
- AvgD
Average root diameter
- PUE
Phosphorus utilization efficiency
- PAE
Phosphorus absorption efficiency
Author contributions
L.C.Y., and Z.Y., conceived and designed the study. L.C.Y., Z.R. and W.X.R., collected the data. L.C.Y., Z.R. and X.F., analysed and interpreted the data. L.C.Y., wrote and translated the paper. All authors read and approved the final manuscript.
Funding
This research has been supported by the Characteristic Forestry Industry Research Project of Guizhou Province (GZMC-ZD20202102); The China National Key R&D Program (Grant No. 2022YFD1601712).
Data availability
Data is provided within the manuscript or supplementary information files. All data are presented in the article, and can be requested from the corresponding author if required.
Declarations
Competing interests
The authors declare no competing interests.
Ethics approval and consent to participate
All seeds of G. sinensis were collected in this study with aid from the corresponding personnel of the Forestry and Grassland Bureau of Guizhou Province, we had obtained the permissions from that unit, some wild plant seeds were collected after obtaining permission through friendly communication and consultation with the plant owners, without any conflict of interest. The collection of plant material and all experiments were performed following relevant institutional, national, and international guidelines and legislation. All seeds were identified by the Professor Yang Zhao and Xiurong Wang, and all voucher specimens were deposited in the Forestry College of Guizhou University (voucher ID numbers: Gs20230101).
Footnotes
Publisher’s note
Springer Nature remains neutral with regard to jurisdictional claims in published maps and institutional affiliations.
References
- 1.Abel, S., Ticconi, C. A. & Delatorre, C. A. Phosphate sensing in higher plants. Physiol. Plant115, 1–8 (2002). [DOI] [PubMed] [Google Scholar]
- 2.Zhang, T. C., Dahab, M. F., Nunes, G. S., Hu, C. & Surampalli, R. Phosphorus fate and transport in soil columns loaded intermittently with influent of high phosphorus concentrations. Water Environ. Res.79, 2343–2351 (2007). [DOI] [PubMed] [Google Scholar]
- 3.Richardson, A. E., Hocking, P. J., Simpson, R. J. & George, T. Plant mechanisms to optimise access to soil phosphorus. Crop Pasture Sci.60, 124–143 (2009). [Google Scholar]
- 4.Yang, J. C. et al. Inorganic phosphorus fractionation and its translocation dynamics in a low-P soil. J. Environ. Radioact.112, 64–69 (2012). [DOI] [PubMed] [Google Scholar]
- 5.Ch’ng, H. Y., Ahmed, O. H. & Majid, N. M. Ab. Improving phosphorus availability in an acid soil using organic amendments produced from agroindustrial wastes. Sci. World J. 506356 (2014). [DOI] [PMC free article] [PubMed]
- 6.Johan, P. D., Ahmed, O. H., Omar, L. & Hasbullah, N. A. Phosphorus transformation in soils following co-application of charcoal and wood ash. Agronomy11, 2010 (2021). [Google Scholar]
- 7.Shen, J. B. et al. Phosphorus dynamics: From soil to plant. Plant Physiol.156, 997–1005 (2011). [DOI] [PMC free article] [PubMed] [Google Scholar]
- 8.Vance, C. P., Uhde-Stone, C. & Allan, D. L. Phosphorus acquisition and use: Critical adaptations by plants for securing a nonrenewable resource. New Phytol.157, 423–447 (2003). [DOI] [PubMed] [Google Scholar]
- 9.Withers, P., Edwards, A. & Foy, R. H. Phosphorus cycling in UK Agriculture and implications for phosphorus loss from soil. Soil Use Manag.17, 139–149 (2001). [Google Scholar]
- 10.Owens, L. B., Bonta, J. V., Shipitalo, M. J. & Rogers, S. Effects of winter manure application in Ohio on the quality of surface runoff. J. Environ. Qual.40, 153–165 (2011). [DOI] [PubMed] [Google Scholar]
- 11.Bai, Z. H. et al. The critical soil P levels for crop yield, soil fertility and environmental safety in different soil types. Plant. Soil.372, 27–37 (2013). [Google Scholar]
- 12.Zhang, H. C., Xu, C. K., Wang, G. P. & Xu, X. Z. Interclonal differences in phosphorus efficiency of Poplar. J. Nanjing For. Univ.25, 14–18 (2001). [Google Scholar]
- 13.Rondina, A. B. L. et al. Plants of distinct Successional stages have different strategies for nutrient acquisition in an atlantic rain forest ecosystem. Int. J. Plant Sci.180, 186–199 (2019). [Google Scholar]
- 14.Zhang, M., Zhang, L., Yao, X., Li, J. & Deng, Q. Co-evaluation of plant leaf nutrient concentrations and resorption in response to fertilization under different nutrient-limited conditions. Diversity14, 385 (2022). [Google Scholar]
- 15.Zhang, Y. K. et al. Genetic improvement of root growth contributes to efficient phosphorus acquisition in maize (Zea mays L). J. Integr. Agric.12, 1098–1111 (2013). [Google Scholar]
- 16.Niu, Y. F. et al. Responses of root architecture development to low phosphorus availability: A review. Ann. Botany. 112, 391–408 (2013). [DOI] [PMC free article] [PubMed] [Google Scholar]
- 17.Yang, A. H. et al. Response of soybean root to phosphorus deficiency under sucrose feeding: Insight from morphological and metabolome characterizations. BioMed Res. Int. e2148032 (2020). [DOI] [PMC free article] [PubMed]
- 18.Abbas, M., Irfan, M., Shah, J. A., Depar, N. & Sial, N. A. Differential growth response, phosphorus absorption, transport and utilization by wheat genotypes under phosphorus deficiency. Pak. J. Agric. Agric. Eng. Vet. Sci.35, 17–24 (2019). [Google Scholar]
- 19.Bates, T. R. & Lynch, J. P. Plant growth and phosphorus accumulation of wild type and two root hair mutants of Arabidopsis thaliana (Brassicaceae). Am. J. Bot.87, 958–963 (2000). [PubMed] [Google Scholar]
- 20.O’Rourke, J. A. et al. An RNA-Seq transcriptome analysis of orthophosphate-deficient white lupin reveals novel insights into phosphorus acclimation in plants. Plant Physiol.161, 705–724 (2013). [DOI] [PMC free article] [PubMed] [Google Scholar]
- 21.Ciereszko, I., Szczygła, A. & Żebrowska, E. Phosphate deficiency affects acid phosphatase activity and growth of two wheat varieties. J. Plant Nutr.34, 815–829 (2011). [Google Scholar]
- 22.Paszkowski, U., Kroken, S., Roux, C. & Briggs, S. P. Rice phosphate transporters include an evolutionarily divergent gene specifically activated in arbuscular mycorrhizal symbiosis. Proc. Natl. Acad. Sci. USA99, 13324–13329 (2002). [DOI] [PMC free article] [PubMed]
- 23.Haran, S., Logendra, S., Seskar, M., Bratanova, M. & Raskin, I. Characterization of arabidopsis acid phosphatase promoter and regulation of acid phosphatase expression. Plant Physiol.124, 615–626 (2000). [DOI] [PMC free article] [PubMed] [Google Scholar]
- 24.Plaxton, W. C. & Tran, H. T. Metabolic adaptations of phosphate-starved plants. Plant Physiol.156, 1006–1015 (2011). [DOI] [PMC free article] [PubMed] [Google Scholar]
- 25.Zhang, Z., Liao, H. & Lucas, W. J. Molecular mechanisms underlying phosphate sensing, signaling, and adaptation in plants. J. Integr. Plant Biol.56, 192–220 (2014). [DOI] [PubMed] [Google Scholar]
- 26.Luo, J. J. et al. Metabolic alterations provide insights into Stylosanthes roots responding to phosphorus deficiency. BMC Plant Biol.20, 85 (2020). [DOI] [PMC free article] [PubMed] [Google Scholar]
- 27.Li, J. H. et al. Response of Chinese fir seedlings to low phosphorus stress and analysis of gene expression differences. J. Res.30, 183–192 (2019). [Google Scholar]
- 28.Xiao, F., Zhao, Y., Wang, X., Jian, X. & Zhou, H. Analysis of differential mRNA and miRNA expression induced by heterogeneous grafting in Gleditsia sinensis. Int. J. Biol. Macromol.270, 132235 (2024). [DOI] [PubMed] [Google Scholar]
- 29.Wang, L., Liu, Z., Liu, Q., Li, J. & Zhang, Y. Q. Study on medicinal value and comprehensive utilization of Gleditsia Sinensis. J. Liaoning Univ. TCM. 22, 181–184 (2020). [Google Scholar]
- 30.Liu, Q., Yang, J., Wang, X. & Zhao, Y. Studies on pollen morphology, pollen vitality and preservation methods of Gleditsia sinensis Lam. Fabaceae. Forests14, 243 (2023). [Google Scholar]
- 31.Li, J. J., Shang, X. C. & Zhou, X. T. Overview of medicinal research on Gleditsia sinensis. Biology Teach.43, 68–69 (2018). [Google Scholar]
- 32.Liu, Y., Xu, W., Lei, F., Li, P. & Jiang, J. Comparison and characterization of galactomannan at different developmental stages of Gleditsia sinensis Lam. Carbohydr. Polym.223, 115127 (2019). [DOI] [PubMed] [Google Scholar]
- 33.Cao, S., Hu, H. Y., Zhang, H., Zhou, C. F. & Liu, B. Causes and countermeasures of plantation soil available phosphorus deficiency in Southern China. World Forestry Res.32, 78–84 (2019). [Google Scholar]
- 34.Lin, W. Y., Lin, S. I. & Chiou, T. J. Molecular regulators of phosphate homeostasis in plants. J. Exp. Bot.60, 1427–1438 (2009). [DOI] [PubMed] [Google Scholar]
- 35.Calderón-Vázquez, C. & Sawers, R. J. H. Herrera-Estrella, L. Phosphate deprivation in maize: Genetics and genomics. Plant Physiol.156, 1067–1077 (2011). [DOI] [PMC free article] [PubMed] [Google Scholar]
- 36.Dai, H. F., Wu, H., Amanguli.Maimaitiali, Wang, L. H., Zhang, J. S. & Maimaiti.Apizi & Analysis of salt-tolerance and determination of salt-tolerant evaluation indicators in cotton seedlings of different genotypes. Scientia Agricultura Sinica. 47, 1290–1300 (2014). [Google Scholar]
- 37.Li, Z. Y. et al. Analysis of morphological and physiological responses to low pi stress in different alfalfas. Scientia Agricultura Sinica. 50, 3898–3907 (2017). [Google Scholar]
- 38.Kamerlin, S. C. L., Sharma, P. K., Prasad, R. B. & Warshel, A. Why nature really chose phosphate. Q. Rev. Biophys.46, 1–132 (2013). [DOI] [PMC free article] [PubMed] [Google Scholar]
- 39.Wu, T. et al. Emerging roles of inositol pyrophosphates in signaling plant phosphorus status and phytohormone signaling. Plant. Soil. 1–19 (2023).
- 40.Chen, B. L., Wang, Q. H., Ye, Z. P., Stiles Shane & Feng, G. Optimisation of phosphorus fertilisation promotes biomass and phosphorus nutrient accumulation, partitioning and translocation in three cotton (Gossypium hirsutum) genotypes. Crop Pasture Sci.71, 56–69 (2020). [Google Scholar]
- 41.Hu, A. Y., Xu, S. N., Qin, D. N., Li, W. & Zhao, X. Q. Role of silicon in mediating phosphorus imbalance in plants. Plants10, 51 (2021). [DOI] [PMC free article] [PubMed] [Google Scholar]
- 42.Duan, H. Y., Shi, L., Ye, X. S., Wang, Y. H. & Xu, F. S. Identification of phosphorous efficient germplasm in oilseed rape. J. Plant Nutr.32, 1148–1163 (2009). [Google Scholar]
- 43.Rashid, M. H. U. et al. Calcium-mediated adaptive responses to low phosphorus stress in Chinese fir. Trees34, 825–834 (2020). [Google Scholar]
- 44.Kale, R. R. et al. Morphological and molecular screening of rice germplasm lines for low soil P tolerance. J. Plant. Biochem. Biotechnol.30, 275–286 (2021). [Google Scholar]
- 45.Lee, W. C., Zotarelli, L., Rowland, D. L. & Liu, G. Evaluation of potato varieties grown in hydroponics for phosphorus use efficiency. Agriculture11, 668 (2021). [Google Scholar]
- 46.Li, P., Weng, J., Rehman, A. & Niu, Q. Root Morphological and physiological adaptations to low phosphate enhance Phosphorus Efficiency at Melon (Cucumis melo L.) Seedling Stage. Horticulturae8, 636 (2022). [Google Scholar]
- 47.Tantriani, Cheng, W. & Tawaraya, K. Screening for low phosphorus-tolerant soybean cultivars from the Japanese core collection. Euphytica219, 13 (2023). [Google Scholar]
- 48.Iqbal, A. et al. Differential responses of contrasting low phosphorus tolerant cotton genotypes under low phosphorus and drought stress. BMC Plant. Biol.23, 168 (2023). [DOI] [PMC free article] [PubMed] [Google Scholar]
- 49.Yang, C. T. et al. Screening genotypes and identifying indicatora of different Fagopyrum tataricum varieties with low phosporus tolerance. Chin. J. Appl. Ecol.29, 2997–3007 (2018). [DOI] [PubMed] [Google Scholar]
- 50.Ahmad, Z., Gill, M. A., Qureshi, R. H., Hamud-ur-Rehman & Mahmood, T. Phosphorus nutrition of cotton cultivars under deficient and adequate levels in solution culture. Commun. Soil Sci. Plant Anal.32, 171–187 (2001). [Google Scholar]
- 51.Iqbal, A. et al. Genotypic variation in cotton genotypes for phosphorus-use efficiency. Agronomy9, 689 (2019). [Google Scholar]
- 52.Li, W. Research on Genetic resources evaluation of Gleditsia sinensis in Sourth China. (Chin. Acad. Forestry, 2014).
- 53.Xing, J. L. Phylogenetic analyses and SSR mining of Genus Gleditsia (Anhui Agricultural University, 2017).
- 54.Hu, X., Liu, Y., Yang, J. J., Luo, J. S. & Kan, H. Analysis component and drink production of Perisperms from Gleditsia japonica var. Delavayi. Food Ind.41, 57–62 (2020). [Google Scholar]
- 55.Li, J. J., Ma, J. X., Shang, X. C., Ye, C. L. & Zhang, G. T. Comparative analysis of morphological characteristics and medicinal representative components of pods and spines of Gleditsia sinensis in different producing areas. J. Chin. Med. Mater.41, 2296–2301 (2018). [Google Scholar]
- 56.Gao, J., Dong, W. B., Wang, Y., Zhang, Q. R. & Zhang, W. X. Optimization of ultrasonic assisted extraction and antioxidant activity of polysaccharide from Gleditsia Japonic Miq. Sci. Technol. Food Ind.40, 124–129 (2019). [Google Scholar]
- 57.Guan, Z. Y. et al. Salt tolerance screening of 32 Taxa from Chrysanthemum and its relative Genera. Sci. Agric. Sin.43, 4063–4071 (2010). [Google Scholar]
- 58.Wu, Z. Y. Evaluation of low phosphate tolerance at seedling stage and molecular essential study on phosphate in soybean (Nanjing Agricultural Univ., 2014).
- 59.Wu, Q. et al. Screening and identification for drought resistance during germination in Sorghum cultivars. Acta Agron. Sin.42, 1233–1246 (2016). [Google Scholar]
- 60.Zeng, J. et al. Screening of Camellia oleifera rootstock genotypes tolerant to low phosphorus and identification of indexes tolerant to phosphorus deficiency. For. Res.34, 166–173 (2021). [Google Scholar]
- 61.Zhu, R. L., Mao, L. L., Wang, L., Yi, K. K. & Sun, J. W. Screening of Vicia Villosa varieties with low phosphorus tolerance at seedling stage and evaluation of their phosphorus efficiency types. Soil. Fertil. Sci. China 148–157 (2022).
- 62.Wang, P. P. et al. Evaluation and identification indexes of phosphorus tolerance of Cotton varieties with different genotypes at seedling stage. Guizhou Agric. Sci.47, 8–12 (2019). [Google Scholar]
- 63.Gong, S. Y. et al. Screening of tobacco genotypes tolerant to low-phosphorus and their phosphorus efficiency at tobacco seedling stage. J. Plant. Nutr. Fertil.25, 661–670 (2019). [Google Scholar]
- 64.Soumya, P. R., Singh, D., Sharma, S., Singh, A. M. & Pandey, R. Evaluation of diverse wheat (Triticum aestivum) and Triticale (× Triticosecale) genotypes for low phosphorus stress tolerance in soil and hydroponic conditions. J. Soil. Sci. Plant. Nutr.21, 1236–1251 (2021). [Google Scholar]
- 65.Gong, H., Xiang, Y., Wako, B. K. & Jiao, X. Complementary effects of phosphorus supply and planting density on maize growth and phosphorus use efficiency. Front. Plant. Sci.13 (2022). [DOI] [PMC free article] [PubMed]
- 66.Hernández, G. et al. Phosphorus stress in common bean: Root transcript and metabolic responses. Plant Physiol.144, 752–767 (2007). [DOI] [PMC free article] [PubMed] [Google Scholar]
- 67.Bayuelo-Jiménez, J. S. et al. Genotypic variation for root traits of maize (Zea mays L.) from the Purhepecha Plateau under contrasting phosphorus availability. Field Crops Res.121, 350–362 (2011). [Google Scholar]
- 68.Acharya, A. & Pesacreta, T. C. P-ring: the conserved nature of phosphorus enriched cells in seedling roots of distantly related species. Plant Signal. Behav.18, 2217389 (2023). [DOI] [PMC free article] [PubMed] [Google Scholar]
- 69.Acharya, A. & Pesacreta, T. C. Localization of seed-derived and externally supplied nutrients in peanut seedling root. Theor. Exp. Plant. Physiol.34, 37–51 (2022). [Google Scholar]
- 70.López-Bucio, J., Cruz-Ramírez, A. & Herrera-Estrella, L. The role of nutrient availability in regulating root architecture. Curr. Opin. Plant. Biol.6, 280–287 (2003). [DOI] [PubMed] [Google Scholar]
- 71.Forde, B. & Lorenzo, H. The nutritional control of root development. Plant. Soil.232, 51–68 (2001). [Google Scholar]
- 72.Neto, A. P., Favarin, J. L., Hammond, J. P., Tezotto, T. & Couto, H. T. Z. Analysis of phosphorus use efficiency traits in Coffea genotypes reveals Coffea arabica and Coffea canephora have contrasting phosphorus uptake and utilization efficiencies. Front. Plant. Sci.7 (2016). [DOI] [PMC free article] [PubMed]
- 73.Hermans, C., Hammond, J. P., White, P. J. & Verbruggen, N. How do plants respond to nutrient shortage by biomass allocation? Trends Plant Sci.11, 610–617 (2006). [DOI] [PubMed] [Google Scholar]
- 74.Tan, Z. et al. Morphological and physiological mechanism of activating insoluble inorganic phosphorus of different peanut (Arachis hypogaea L.) varieties under low phosphorus. Agriculture13, 2270 (2023). [Google Scholar]
- 75.Zeng, J. et al. Effects of scion variety on the phosphorus efficiency of grafted Camellia Oleifera seedlings. Forests13, 203 (2022). [Google Scholar]
- 76.Dai, Y. et al. Comparative physiological and proteomic analysis reveals different responding mechanisms of phosphate deficiency between two clones of Pinus elliottii × P. Caribaea. Ind. Crops Prod.218, 118994 (2024). [Google Scholar]
- 77.Xu, J. et al. The combined effect of root morphological and resistance traits alleviated the growth limitations of Pinus massoniana seedlings under low phosphorus conditions. Plant. Soil. 1–16 (2024).
- 78.Bichara, S., Mazzafera, P. & de Andrade, S. A. L. Root morphological changes in response to low phosphorus concentration in eucalypt species. Trees35, 1933–1943 (2021). [Google Scholar]
- 79.Hang, T. T. et al. Low phosphorus impact on Moso bamboo (Phyllostachys edulis) root morphological polymorphism and expression pattern of the related genes. Tree Physiol.44, tpad138 (2024). [DOI] [PubMed] [Google Scholar]
- 80.Sun, T. T. et al. Transcriptome and metabolome analyses revealed the response mechanism of apple to different phosphorus stresses. Plant Physiol. Biochem.167, 639–650 (2021). [DOI] [PubMed] [Google Scholar]
- 81.Li, C., Wang, J. & Zhang, Y. C. Root growth and phosphorus efficiency among sweet potato genotypes under low phosphorus. J. Plant Nutr.43, 1320–1330 (2020). [Google Scholar]
- 82.Fernandes, A. M. & Soratto, R. P. Response of potato cultivars to phosphate fertilization in tropical soils with different phosphorus availabilities. Potato Res.59, 259–278 (2016). [Google Scholar]
- 83.Zou, X. H. et al. Strategies of organic acid production and exudation in response to low-phosphorus stress in Chinese fir genotypes differing in phosphorus-use efficiencies. Trees32, 897–912 (2018). [Google Scholar]
- 84.Sun, Z. W. et al. Agronomic and physiological performance of the Indica rice varieties differing in tolerance to low phosphorus. Agronomy14, 41 (2024). [Google Scholar]
- 85.Zhao, H. et al. Cross-talk between transcriptome analysis and physiological characterization identifies the genes in response to the low phosphorus stress in Malus mandshurica. Int. J. Mol. Sci.23, 4896 (2022). [DOI] [PMC free article] [PubMed] [Google Scholar]
- 86.Qu, X., Zhou, J., Masabni, J. & Yuan, J. Phosphorus relieves aluminum toxicity in oil tea seedlings by regulating the metabolic profiling in the roots. Plant Physiol. Biochem.152, 12–22 (2020). [DOI] [PubMed] [Google Scholar]
Associated Data
This section collects any data citations, data availability statements, or supplementary materials included in this article.
Supplementary Materials
Data Availability Statement
Data is provided within the manuscript or supplementary information files. All data are presented in the article, and can be requested from the corresponding author if required.