

Abstract
Harmful algal blooms (HABs) can release cyanotoxins such as microcystins (MCs), especially, microcystin-leucine-arginine (MC-LR) which is one of the commonest and most toxic, into our water bodies and can lead to several acute or chronic diseases such as liver diseases and respiratory irritation in humans. There is an increasing need for rapid and simple detection of MC-LR in water bodies for early warning of HABs. In this study, we developed an innovative on-site screening electrochemical impedance spectroscopy (EIS) biosensor with a simplified calibration curve that can rapidly detect blooms for early action in similar water bodies. The novel aspect of this research is that various chemical cleaning procedures and surface modifications were evaluated to improve the antibody-embedded electrochemical sensor performance. In addition, a simplified calibration curve was constructed from different water samples to reduce the need for frequent recalibration in practical applications. In this study, two distinct commercially available screen-printed carbon electrodes (SPCEs) were modified as a cost-effective substrate for MC-LR biosensing with anti-MC-LR/MC-LR/cysteamine-coating. The study showed that an appropriate cleaning procedure might minimize the sensor performance difference after each electrode modification. The biosensor showed excellent sensitivity toward MC-LR detection in lake water samples with a limit of detection (LOD) of 0.34 ngL-1. The simplified calibration curve was developed and used to predict unknown MC-LR concentrations in several lake water samples with a relative standard deviation (RSD) of 1.0–4.4% and a recovery of 75–112%, indicating the suitability of the developed biosensor and a streamlined calibration curve for rapid MC-LR measurements for different water bodies with similar water quality. This approach can therefore reduce the need for frequent calibration efforts and can be employed as the first line of testing for MC-LR in drinking and recreational water sources, especially in emergencies.
Keywords: Antibody, Biosensor, Cyanotoxins, Harmful algal blooms (HABs), Microcystin-LR, Simplified calibration curve
Subject terms: Environmental monitoring, Environmental impact
Introduction
The increasing rate of pollution of water sources for drinking as well as for recreation can lead to the escalation of disease-causing organisms such as harmful algal blooms (HABs) in these water bodies which impacts negatively the water quality1. HABs thrive in water bodies with excessive nutrients such as nitrogen and phosphorus that are introduced into the water from diverse sources like agricultural runoff, sewage, or industrial discharges. HABs have been a significant concern to public health and the environment as they produce harmful algal/cyanobacteria toxins in surface waters. Microcystins (MCs) also known as hepatotoxins are the prevalent cyanotoxins linked to HABs and human contact with these MCs can cause acute or chronic diseases2. MCs are found to target the liver potentially causing liver diseases or even contributing to colon cancer3,4. Furthermore, some studies have identified kidney and reproductive defects after exposure to the toxin and that exposure to the cyanobacteria cell itself can also lead to gastrointestinal (GI) inflammation as well as dermatologic, eye/ear, and respiratory irritation5–7.
There are over 300 known MCs8 with microcystin-leucine-arginine (MC-LR) being the most toxic and commonest species, having a tolerable daily intake (TDI) of 0.04 μg kg−1 body weight per day9 with a guideline value of 1 μg L−1 for MC-LR in drinking water set by the World Health Organization (WHO), and a limit of 8 μg L−1 recommended by the United States (U.S.) Environmental Protection Agency (EPA) for recreational purposes10. Many surface water sources experience HABs of cyanobacteria (CyanoHABs) and this can potentially affect people who depend on these sources either for recreation or as drinking water sources. There is therefore the need to monitor these HABs in advance for public health safety. There are several monitoring systems for cyanoHABs including the use of hyperspectral image (HSI) sensors11, and satellite image-based tools12. However, these imaging tools may not be effective as cyanobacteria and toxins can occur at unsafe levels even without a visual bloom. There are also conventional methods such as enzyme-linked immunosorbent assay (ELISA, EPA method 546)13, liquid chromatography/tandem mass spectrometry (LC/MS/MS, EPA method 544)14, and high-performance liquid chromatography (HPLC, EPA method 8315A)15. Although these methods are accurate and have good detection limits, they are time-consuming and require expensive equipment and highly skilled personnel.
Biosensors have been used to detect trace amounts of various emerging contaminants such as viruses16, pharmaceuticals, antibiotics17, and infectious diseases18. Bioelectrochemical sensors among the different types of biosensors provide a simple and cost-effective option for MC-LR detection where the sensing mechanism depends mainly on the affinity between the antibody and MC-LR molecules. There are commercially available screen-printed electrodes (SPEs) that offer a ready-to-use option with modification of the working electrode (WE) for MC-LR detection. The use of these SPEs with carbon electrodes, gold or glass carbon electrodes (GCE)19–21has resulted in a reduction in the volumes of samples used and hence the cost of conducting experiments22,23.
The effectiveness of SPEs in analysis can frequently be influenced by factors such as the type, dimensions, and charge of the electrode24. Cleaning of SPEs holds significance in improving electrode signal and increasing active surface area25. Hence, various pretreatments of the SPEs are employed during and post-production to eliminate impurities from the electrode surface26. Studies have shown that pretreatment methods such as mechanical polishing27, potassium hydroxide (KOH) potential sweeping28, chemical cleaning using acids and alcohols (acetone and ethanol)29, as well as using H2O2 solution with multiple cyclic voltammetry30at low sweep speed29 can cause surface modification that can improve sensor sensitivity27–29. Ultrasonication using ethanol or acetone has also been used as a cleaning method for biosensor fabrication22,29.
The main objective of this study was to develop an antibody-based electrochemical biosensor using a screen-printed carbon electrode (SPCE) for rapid MC-LR detection in real water samples (Fig. 1). The monoclonal antibody such as MC10E7, was used as a bioreceptor for the fabrication of the biosensor due to its high sensitivity and selectivity22,31. This study introduces several novel aspects. First, various chemical cleaning procedures and surface modifications were evaluated to improve the antibody-embedded electrochemical sensor performance. The study tested two different commercially available SPCEs as a cost-effective substrate: Type 2 (2 mm in diameter of WE) and Type 4 (4 mm in diameter of WE) to demonstrate the applicability of the process to different SPCEs. Then, the surface functionalization processes of the biosensors were investigated using CV and electrochemical impedance spectroscopy (EIS). Compared to other immunosensors (e.g., Au-based substrate), the use of commercially available SPCEs provides a cost-effective and scalable substrate, making the biosensor suitable for practical applications such as an early warning monitoring tool for harmful algal bloom (HAB) events, addressing a critical need in water quality management. In addition, this study explored molybdenum disulfide (MoS2) as a new substrate for the modification of the cysteamine self-assembled monolayer (SAM) to improve the sensor sensitivity. Finally, the simplified calibration curve provides an innovative approach for MC-LR detection in different water sources to reduce the need for frequent recalibration in practical applications. The MC-LR concentrations were cross-validated using the ELISA kit method to determine the reliability and acceptability of the fabricated biosensor. The innovations in this work demonstrate a comprehensive approach to advancing biosensor technology for MC-LR detection.
Fig. 1.

Surface functionalization of the MC-LR biosensor surface and mechanism for the SPCE coated with MC-LR molecules.
Results and discussion
Electrochemical characterization of the electrode cleaning process. CV was used to investigate the effectiveness of the electrode cleaning process by the CV analysis before and after the cleaning process using either acetone or ethanol. The ultrasonication process was conducted for 5 min and 90 min after which the electrodes were rinsed with isopropanol and Milli-Q water and then dried with N2 before CV measurements were conducted. The CV results of the different electrode types and cleaning methods are shown in Fig. 2 for the SPCE Type 2 electrode and Fig. 3for the SPCE Type 4 electrode, respectively. The effect of cleaning on SPCEs was evidenced by the redox peak currents (µA) and the difference in the redox peak values (∆µA)27,29,32. Generally, the redox peak current values for the SPCE Type 4 were higher than the Type 2 and this could be attributed to the larger surface area of the working electrode. As shown in Fig. 2, cleaning with acetone for 90 min produced the best surface modification effect for the SPCE Type 2, resulting in the highest peak (18.95 µA) with maximum current differences (∆µA:18.37 µA) (Table S1). Cleaning of the SPCE Type 4 with the same condition also showed the highest peak (226.02 µA) and maximum current differences (∆µA: 130.45 µA) (Table S1). While cleaning with ethanol for 90 min for the SPCE Type 4 also produced a good surface modification effect with a significant peak current difference of 50.94 µA (Fig. 3(b)), cleaning with the same condition for the SPCE Type 2 showed no significant difference in peak current value for 90 min (∆µA: 0.27 µA) (Fig. 2(b)) and 5 min (∆µA: 1.43 µA) (Fig. 2(d)), respectively. The bare SPCE Type 2 before cleaning with acetone for 5 min seemed to have a clean surface with a high peak current (20.90 µA) but a reduction in the peak current (∆µA: −0.68 µA) after cleaning showed that the cleaning could not improve the SPCE (Fig. 2(c)). The characterization of CV curves showed that the bare SPCE may have inconsistent initial electrochemical properties and thus there is a need for the cleaning process for commercial SPCE before the surface modification. This cleaning procedure may minimize the sensor performance difference after each electrode modification, especially for a disposable MC-LR biosensor in this study. Overall, the cleaning of the SPCEs with acetone or ethanol for 90 min was further investigated with electrochemical characterization of the functionalized electrode.
Fig. 2.

The effect of cleaning on SPCE Type 2 (a) acetone for 90 min, (b) ethanol for 90 min, (c) acetone for 5 min, and (d) ethanol for 5 min. The redox probe solution (50 ml) of 5 mM [Fe(CN)6]3-/4- in 10 mM PBS was used.
Fig. 3.

The effect of cleaning on SPCE Type 4. (a) acetone for 90 min, (b) ethanol for 90 min, (c) acetone for 5 min, and (d) ethanol for 5 min. The redox probe solution (50 ml) of 5 mM [Fe(CN)6]3-/4- in 10 mM PBS was used.
Electrochemical characterization of the fabricated biosensor. After cleaning the SPCEs with acetone or ethanol for 90 min, the electrode surfaces were functionalized for detecting MC-LR and electrochemically characterized with the CV curves at each stage of the biosensor fabrication process using the redox probe solution of 5 mM [Fe(CN)6]3-/4- in 10 mM PBS (Fig. 4). The cleaned bare SPCEs showed the lowest redox peak values due to the hindrance of electron transport because of the absence of the SAM layer on the WE. The highest redox peak currents of the CV curves were observed with the cysteamine SAM layer on SPCE when the cysteamine was coated on the carbon working electrode. The SPCE Type 2 with the SAM layer recorded oxidation peak values of 27.59 µA with acetone cleaning and 40.67 µA with ethanol cleaning, respectively, while the SPCE Type 4 recorded the highest peak values of 248.89 µA with acetone cleaning and 130.45 µA with ethanol cleaning, respectively (Fig. 4). The SPCE Type 4 showed higher current peaks compared to the SPCE Type 2 due to larger surface areas of the WE.
Fig. 4.

Cyclic voltammogram during the surface functionalization process of the MC-LR biosensor. (a) SPCE Type 2 with acetone cleaning for 90 min, (b) SPCE Type 2 with ethanol cleaning for 90 min, (c) SPCE Type 4 with acetone cleaning for 90 min, and (d) SPCE Type 4 with ethanol cleaning for 90 min. The redox probe solution (50 ml) of 5 mM [Fe(CN)6]3-/4- in 10 mM PBS was used.
During the electrode surface modification, the formation of the cysteamine SAM on the electrode surface resulted in an increase in the peak current during CV, indicating improved electrochemical properties of the SPCE. Cysteamine enhances electron transfer by providing a conductive interface between the electrolyte (5 mM [Fe(CN)6]3-/4-in 10 mM PBS) and the electrode. It was proposed that the protonation of the amine group in the cysteamine SAM increases the electrostatic attraction between positively charged amine groups of the cysteamine SAM and the negatively charged redox probe solution, leading to enhanced current flow33. However, Shervedani et al. (2007) indicated that protonation occurs predominantly in acidic conditions (pH 3), enhancing electron transfer, while the amine group of cysteamine remains neutral in alkaline conditions (pH 8), reducing current flow33. Our results showed the highest peak current at pH 7.3, suggesting that protonation may not occur. Instead, the neutral cysteamine SAM layer likely provides a more stable surface for electron transfer34 compared to bare carbon, reducing electron transfer resistance and improving interaction with the redox probe solution. Upon immobilization of MC-LR on the SAM-coated electrode, a decrease in peak current was observed due to high electron transfer resistance.
There was a slight decrease in peak current values for the SPCE Type 2 after embedding MC-LR in the WE, resulting in 23.73 µA with acetone cleaning and 37.68 µA with ethanol cleaning (Fig. 4 (a) and (b)). The SPCE Type 4 also recorded 104.56 µA with acetone cleaning (Fig. 4(c)). For our study, the absorption of the microcystin onto the carbon was facilitated by the cysteamine SAM layer, providing stability and increased anchoring sites for the MC-LR molecules compared to the bare SPCE. When the microcystins are absorbed on the carbon electrode, they can interact with the redox probe solution due to their carboxylic functional group affecting the electron transfer environment. At pH 7.3, the MC-LR could be negatively charged35 and this could lead to repulsion between the MC-LR and the negatively charged redox probe solution, leading to increased electron transfer resistance and hence reduction in the peak current observed. A slight increase in the peak current of the SPCE Type 4 with ethanol cleaning after MC-LR immobilization indicates that ethanol cleaning may not be a good option for electrode cleaning. Overall, the bare SPCEs produced the lowest redox peak values, whilst the addition of the cysteamine SAM layer produced the highest redox peak values with the MC-LR/Cysteamine/SPCE layer producing intermediate peak values which is similar to other studies22,36,37.
EIS was also conducted to evaluate the surface functionalization process of the biosensors and the Nyquist plots were fitted with equivalent circuit models using the redox probe solution of 5 mM [Fe(CN)6]3-/4- in 10 mM PBS (Fig. 5). EIS operation parameters include 0.5 mV and 0.25 V for the DC (direct current) and AC (alternating current), respectively, and a frequency range of 0.01 Hz – 100 kHz. The cleaned bare SPCEs showed the highest peak values in all cases indicating the highest barrier to electron transfer22. The bare SPCE Type 2 showed peak values of 1.22 kΩ for acetone cleaning and 0.23 kΩ for ethanol cleaning (Fig. 5(a) and (b)). The bare SPCE Type 4 showed peak values of 0.30 kΩ and 2.45 kΩ after acetone and ethanol cleaning, respectively. As shown in Fig. 5, the cysteamine SAM layer demonstrated the lowest peak resistance, consistent with its stable and conductive properties, which facilitate higher current flow compared to bare SPCE. These findings highlight the critical role of the cysteamine SAM layer in improving electrochemical performance and enabling effective biosensor functionalization. Similar to the CV results, the MC-LR/Cysteamine/SPCE layer showed intermediate peak values for the SPCE types and the cleaning methods which are similar to other studies22,36,37.
Fig. 5.

Nyquist plots for the surface functionalization process of the MC-LR biosensor. (a) SPCE Type 2 with acetone cleaning for 90 min, (b) SPCE Type 2 with ethanol cleaning for 90 min, (c) SPCE Type 4 with acetone cleaning for 90 min, and (d) SPCE Type 4 with ethanol for 90 min. The redox probe solution (50 ml) of 5 mM [Fe(CN)6]3-/4- in 10 mM PBS was used.
Overall, the CV and EIS results show that both SPCE Type 2 and Type 4 after the acetone or ethanol cleaning produced well-functionalized immunosensors that can be used for MC-LR detection. This means that once the commercial bare SPCEs were pre-treated with physicochemical cleaning, the electrodes could be functionalized for the preparation of biosensors.
Calibration curves for MC-LR detection using fabricated biosensors. After the functionalization of the electrode surface with MC-LR and cysteamine, EIS measurements were carried out to characterize the binding between immobilized MC-LR and the anti-MC-LR monoclonal antibody on the biosensor surface. The EIS detection mechanism for MC-LR utilized an inhibitory immunoassay where the interaction between antibodies and MC-LR immobilized on the electrode surface was hindered by the MC-LR in the sample. For the sensor calibration, the sample containing MC-LR, at varying known concentrations, was then mixed with the MC-LR antibody and PBS for 30 min to allow interaction before being deposited onto the sensor. This mixture of MC-LR, anti-MC-LR, and PBS leads to interaction between the MC-LR in the sample and the anti-MC-LR before deposition on the sensor, which already has MC-LR deposited on it. The pre-interaction between MC-LR and anti-MC-LR in the mixture reduces the amount of anti-MC-LR available to interact with the MC-LR on the sensor. Only the excess anti-MC-LR, after the initial interaction, can bind to the MC-LR on the sensor, and this interaction is measured by electrochemical impedance spectroscopy (EIS). This explains why lower concentrations of MC-LR in the sample result in higher peaks on the Nyquist plot. With fewer MC-LR molecules in the sample, more anti-MC-LR antibodies remain available to interact with the MC-LR already deposited on the sensor, leading to more binding reactions with MC-LR on the sensor.
Using SPCE Type 2 and 4 sensors, EIS measurements were taken for varying concentrations of MC-LR from 10–7–10–4 g L−1 to construct a calibration curve, and the resulting Nyquist plots are presented in Fig. 6. The Nyquist plots showed that higher MC-LR concentrations caused a decrease in the electron transfer impedance on the MC-LR biosensor (Fig. 6). Consequently, the peak values (Zpeak) of the Nyquist plot relate to the concentration of antibodies bound on the surface of the electrode, suggesting that the relationship between Zpeakand MC-LR concentrations can be determined by measuring standard serial dilutions of MC-LR mixed with constant antibody concentration22. Nyquist plots of MC-LR biosensors with SPCE Type 2 and 4 SPCEs without cleaning were also constructed for reference purposes (Fig. S2). The comparison of calibration curves between with cleaning and without cleaning showed that cleaning with acetone or ethanol for 90 min produces better calibration curves compared to SPCEs without cleaning (Fig. 7). The biosensors of SPCE Type 2 developed with acetone cleaning for 90 min produced slightly higher slope of 0.236 with R2 value of 0.97 compared to the SPCE Type 4 with a slope of 0.198 with R2 value of 0.98 (Fig. 7). The SPCE Type 2 after cleaning with ethanol for 90 min also produced a higher slope of 0.365 with an R2 value of 0.87 compared to the Type 4 with a slope of 0.138 with R2 value of 0.99 (Fig. 7). For both SPCEs, cleaning with acetone for 90 min produced better sensitivity (i.e., higher slope in the calibration curve) with Zpeak = −0.236 × log ([MC-LR]) + 1.741 with R2 = 0.97 for the SPCE Type 2 and Zpeak = −0.198 × log ([MC-LR]) + 1.318 with R2 = 0.98 for the SPCE Type 4, respectively, where Zpeak is the peak value observed on the Nyquist plot and [MC-LR] is the concentration of MC-LR (ng L−1). From the calibration curves developed for both SPCE Type 2 and 4, the LOD was calculated as 1.07 ng L−1 (Type 2) and 1.12 (Type 4) ng L−1 respectively.
Fig. 6.

Nyquist plots with different MC-LR concentrations. (a) SPCE Type 2 with acetone cleaning for 90 min, (b) SPCE Type 2 with ethanol cleaning for 90 min, (c) SPCE Type 4 with acetone cleaning for 90 min, and (d) SPCE Type 4 with ethanol for 90 min. The redox probe solution (50 ml) of 5 mM [Fe(CN)6]3-/4- in 10 mM PBS was used.
Fig. 7.

Calibration curves for (a) SPCE Type 2 and (b) SPCE Type 4 between with cleaning and without cleaning.
Interestingly, SPCE Type 2 sensors showed a better sensitivity toward MC-LR and lower LOD than Type 4 sensors. This was not expected as increasing the size of the WE should lead to increased binding sites between the MC-LR and anti-MC-LR resulting in higher sensitivity. This means that increasing the size of the working electrode may not be a limiting factor for sensor sensitivity. Other factors such as the working volumes of the various modification solutions should be optimized for the size of the WE to ensure optimized binding and reaction. The smaller area of WE had quite a higher LOD probably due to maximized binding sites appropriate for its size. Therefore, a proposed solution to increase sensor sensitivity for SPCEs with larger WE sizes could be to increase the concentration of the anti-MC-LR as well as the working volumes of the reagents as this could increase the interaction between the MC-LR and anti-MC-LR while reducing dead zones on the WE.
Modification of the WE surface with MoS2 for MC-LR detection. To investigate the effect of different substrates on the MC-LR detection, the SPCE Type 2 was coated with MoS2 after acetone cleaning for 90 min. MoS2 has been found to have a large surface area and hence can increase the chances of binding to biomolecules. Several studies on MC-LR biosensors used MoS2as a part of the surface modification process for sensor development36,37. The MoS2 functionalization of the SPCE followed a similar process in the previous sensor development38. Then, the cysteamine layer was added to form a Cysteamine SAM/MoS2 layer on the WE. The MoS2 was prepared by mixing 2 mg of MoS2 in 50 mL of isopropanol and mixing for 2 – 3 h at 70 °C, while covered with parafilm and aluminum foil, and 5 µg of the MoS2solution was dropped on the WE and allowed to dry in the air for about 5 min under normal room conditions38,39. The coating of the WE with 5 µg MoS2 solution was repeated three times before 18 mM Cysteamine was then dropped on the WE to form Cysteamine SAM/MoS2 layer and with MC-LR and then the Anti-MC-LR. The resulting Anti-MC-LR/MC-LR/Cysteamine/MoS2 /SPCE biosensor was evaluated using EIS, and then a calibration curve was constructed which showed a linear response to MC-LR with well-defined Nyquist plots (Fig. S3) in the range of 10–7 – 10–4 gL−1. LOD was calculated to be 2.03 ng L−1. The results demonstrated that the MoS2 substrate provided an effective coating with cysteamine and subsequent MC-LR immobilization. However, the modification with MoS2 showed no significant improvement in the sensor sensitivity, indicating that the cysteamine-only SAM layer plays an important role in the binding ability to allow the antibody to bind with the MC-LR molecules, and this shows that the main responsive part of the sensor is the antibody.
Application of the MC-LR biosensors in real water samples.The MC-LR biosensor developed using SPCE Type 2 (cleaned using acetone for 90 min) was applied to lake water experiencing HAB obtained from South Korea (Lake A)22. The water sample was filtered using a 0.22 µm filter and the initial MC-LR concentration was measured to be 0.43 µgL−122. Because the MC-LR concentration in the real sample was low to test the biosensor, the water samples were spiked to known MC-LR concentrations of 10–4, 10–5, 10–6, and 10–7 g L−1 to develop the calibration curve for the specific water sample. The MC-LR concentrations in the test samples were validated using the ELISA method (EPA method 546)13. As shown in Fig. 8, the MC-LR biosensor showed good sensitivity toward MC-LR detection with well-defined Zpeak values with different MC-LR concentrations in real water sources. The correlation of the biosensor was determined as Zpeak = −0.1805 × log ([MC-LR]) + 1.913 with R2 = 0.99 and RSD of 1 – 16% (Fig. 8). The LOD of the biosensor for real water application (Lake A) was determined as 0.34 ng L−1 which was well below the WHO guideline value of 1 µg L−1 for drinking water sources40 and the recommended value of 8 µg L−1for recreational purposes set by the USEPA10. The LOD of the developed sensor was comparable to other studies for real water applications (Table 1).
Fig. 8.
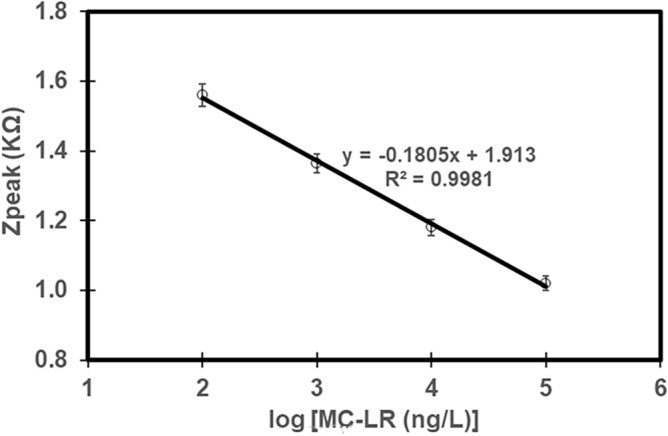
Calibration curve established for Lake A water (SPCE Type 2).
Table 1.
Comparison of LOD of different biosensors for MC-LR detection.
| Type SPE | Surface Functionalization process | Measurement Mode | Working range | Water samples | LOD | Ref |
|---|---|---|---|---|---|---|
| Screen Printed Gold Electrode | Anti-MC-LR/MC-LR/Cysteamine/Au | EIS | 0.1 – 330 μg L−1 | Lake water | 0.57 ng L−1 | 45 |
| Glass Carbon Electrode | HRPa-anti-MC-LR/MC-LR-BSAb/cysteamine-glutaraldehyde/ AuNPsc/GCE | EIS | 0.01 – 100 μg L−1 | Lake water | 4 ng L−1 | 19 |
| SPCE | Anti-MC-LR/MC-LR/Cysteamine/SPCE | EIS | 0.1 – 100 μg L−1 | Lake water | 0.69 ng L−1 | 22 |
| SPCE | Anti-MC-LR/MC-LR/Cysteamine/SPCE | EIS | 0.1 – 100 μg L−1 |
Lake water A (SPCE Type 2) |
0.34 ng L−1 | This Study |
|
Lake water B&Cd (SPCE Type 4) |
3.64 ng L−1 |
aHRP: horseradish peroxidase.
bBSA: bovine serum albumin.
cAuNPs: gold nanoparticles.
dUsing simplified calibration curves.
After confirming the sensor performance with calibration curves, a certain amount of MC-LR stock solution was spiked to the Lake A sample for testing the unknown MC-LR concentration in the lake water using the biosensor. A pre-constructed calibration curve (Fig. 8) was used to determine the applicability of the sensor for real water applications. The concentration of MC-LR in the unknown sample was determined as 32.2 (± 4.1) μg L−1 using the developed biosensor and 35.4 (± 2.2) μg L−1 using the ELISA method. This showed that the biosensor predicted the MC-LR concentration with a recovery of 91.0% (± 12%), hence suitable for real water application.
Development of a simplified calibration curve for real water application. The fabricated biosensor showed good applicability and sensitivity in real water samples (Lake A). However, a notable difference was observed in the calibration curves between milli-Q water (Fig. 7(a)) and real lake water (Fig. 8), particularly in their slopes (i.e., sensitivity). The working mechanism of the sensor involved binding antibodies that do not interact with the MC-LR in the water sample to the MC-LR coated on the working electrode. Consequently, the impedance increases as more antibodies remain in the water sample (i.e., lower MC-LR concentrations), allowing them to bind to the working electrode. However, when the biosensor was applied to real water samples, a decrease in sensitivity (i.e., the reduced slope of the calibration curve) was observed. This suggests that unknown organic compounds in the water may be adsorbed onto the electrode surface, reducing electron transfer efficiency and hindering the interaction between the target molecules (e.g., MC-LR) and the electrode. Thus, it is often advised to develop site-specific calibration curves for different water sources with periodic recalibration to ensure the representativeness of the sensor performance22. However, this process may demand considerable time and labor for frequent recalibration on-site. To address this issue, we introduced a simplified calibration curve approach depending on the water quality of the specific water bodies. First, two water samples were collected from two different lakes in Orlando, Florida, USA (Lake B and C). Tap water was also collected and tested for a reference purpose. The lake water samples were filtered using a 0.22 µm filter to remove any particulate matter. The ELISA confirmed no MC-LR concentrations in the collected water samples and thus MC-LR concentrations were spiked in the water samples for the construction of the calibration curves. pH, DOC, and alkalinity of the water samples were analyzed (Table S2). pH was in the range of 6.9–7.0 for lake water samples and 8.0 for tap water. DOC was in the range of 5.4 – 11.2 mg L−1 for lake water samples, while DOC in the tap water was 2.0 mg L−1. The alkalinity of the tap water sample was relatively high at 60 mg L−1 as CaCO3, while alkalinity in the lake water samples was diverse between 4.3 – 20.8 mg L−1 as CaCO3.
Biosensors for constructing calibration curves were prepared using the SPCE Type 4 after cleaning with acetone for 90 min. As expected, the three different water sources had different calibration curves due to different water quality parameters with the slope ranging from 0.085 – 0.112 with R2 values of 0.72 – 0.96 (Fig. S4). Therefore, we selected comparable water samples (Lake B and Lake C), and a simplified calibration curve was then created with a correlation of Zpeak = −0.1095 × log ([MC-LR]) + 0.92 and R2 = 0.82 (Fig. 9 (a)). Next, a certain amount of MC-LR was spiked to both lake water samples (Lake B and C). Lake water samples with unknown MC-LR concentrations were then determined using the ELISA method and the developed simplified calibration curve was used to also predict the unknown MC-LR concentration in each water source.
Fig. 9.

Simplified calibration curves developed using the SPCE Type 4 for (a) Lake B and Lake C and (b) three different water sources.
The MC-LR concentration in the spiked samples from Lake B was measured at 25.8 µg L−1 using a specific water calibration curve (Fig. S4(b)) and at 25.2 µg L−1 using ELISA kits, achieving a recovery of 103%. When the simplified calibration curve was used (Fig. 9(a)), the MC-LR concentration in Lake B was 18.4 µg L−1 with a recovery of 75% (Table 2). For Lake C, the spiked MC-LR concentration was determined to be 3.9 µg L⁻1 using a specific water calibration curve (Fig. S4(d)) and 4.2 µg L⁻1 using ELISA kits with a recovery rate of 93%. The simplified calibration curve (Fig. 9(a)) estimated the MC-LR concentration in Lake C at 4.7 µg L⁻1 with a recovery rate of 112% (Table 2). It was successful in measuring MC-LR concentrations in two different lake water samples using a simplified calibration curve with a recovery of 75 – 112% with a relative standard deviation (RSD) of 1.0 – 4.4% (Table 2), which is within the acceptable recovery limit of 70 – 120%41. This shows that the simplified calibration curve can measure the MC-LR concentrations in different water sources that have similar water quality criteria without the necessity to use individual calibration curves.
Table 2.
Prediction of MC-LR concentration using a simplified calibration curve for the Lake water sources.
| Water source | MC-LR concentration in spiked samples | ||||
|---|---|---|---|---|---|
| ELISA (µg L−1) | Specific water calibration curvea (µg L−1) | Recovery | Simplified calibration curveb (µg L−1) | Recovery | |
| Lake B | 25.1 (± 2.7) | 25.9 (± 4.7) | 103% (± 8) | 18.9 (± 2.7) | 75% (± 2) |
| Lake C | 4.2 (± 0.6) | 3.9 (± 0.4) | 93% (± 5) | 4.7 (± 0.5) | 112% (± 5) |
Note: aSpecific water calibration curves (Fig. S4).
bSimplified calibration curve for two lake water samples (Fig. 9(a)).
In addition, we evaluated if the simplified calibration curve developed using three different water sources (Lake B, Lake C, and Tap water) works for the sensor application for these water sources. The simplified calibration curves with these water samples showed a relatively good correlation of Zpeak = −0.1013 × log ([MC-LR]) + 0.90 and R2 = 0.88 (Fig. 9(b)). However, the recovery of MC-LR concentration measurement using the simplified calibration curve was 29 – 181% (Table S3) which is not within the acceptable recovery limit of 70 – 120%41. This could be due to the wide variation in water quality of the three water sources. Overall, it is recommended that the simplified calibration curve approach be used for rapid determination of MC-LR concentration in similar categories of water quality (e.g., lake water or tap water).
Cost analysis of the developed MC-LR biosensor. The SPCE is a major component regarding the development of the MC-LR biosensor and contributes to the overall economic design. The SCPE is easily produced on a large scale by different manufacturers and is readily available. The development of the MC-LR biosensor for this study used two different SPCEs obtained at a cost of about $4 per sensor and the total cost of fabricating the MC-LR biosensor was estimated at $8.5 making the MC-LR detection in surface water less costly compared to conventional methods as shown in Table 3. This overall minimal cost of the biosensor compared to ELISA and the LC/MS/MS methods for MC-LR detection makes the MC-LR biosensor a greater potential for MC-LR detection. Certified laboratory analysis for MC-LR detection costs up to $20 per sample for ELISA and $150 for LC/MS/MS according to an EPA report on water treatment optimization for cyanotoxins42. The analysis time for MC-LR detection using biosensors is estimated at 1.5 h which is comparable to ELISA and the LC/MS/MS. This low-cost biosensor and the simplified calibration curve present an opportunity for rapid detection of MC-LR in water sources, for improved public health and safety.
Table 3.
Comparison of the cost of different MC-LR detection methods per sample.
| Method | LOD | Working range | Analytical time | Analysis price | Ref |
|---|---|---|---|---|---|
| ELISA Kit | 0.1 μg L−1 | 0.1 – 2.5 μg L−1 | 2 h | ~ $20/sample | 42 |
| LC/MS/MS | 4.3 ng L−1 | 40 – 400 ng L−1 | 1.5 h | ~ $150/sample | 42 |
| Anti-MC-LR/MC-LR/Cysteamine/SPCE Biosensora | 3.64 ng L−1 | 0.1 – 100 μg L−1 | 1.5 h | ~ $8.5/sample | This Study |
aEither Type 2 or 4 using a simplified calibration curve.
Conclusion
In this study, the antibody-based MC-LR biosensors were successfully developed for the detection of MC-LR using an EIS measurement on the biosensor surface. The evaluation of sensor performance after pretreatment of SPCEs showed that physicochemical cleaning is a necessary step to ensure accurate and precise MC-LR detection. The study successfully fabricated a low-cost Anti-MC-LR/MC-LR/Cysteamine/SPCE biosensor for rapid MC-LR detection in real surface water samples within a working range of 0.1 to 100 μg L−1 with an LOD of 0.34 ng L−1. The study also developed simplified calibration curves using two lake water sources with similar water quality and successfully measured the MC-LR concentration in each lake water sample within an acceptable recovery of 75 – 112%. In particular, the simplified calibration curve approach will allow rapid emergency decision-making by reducing the number of tests and calibrations for MC-LR detection. This approach can therefore be employed as the first line of testing for MC-LR in drinking and recreational water sources. It is expected that the simplified calibration curve approach will help in the advancement of rapid MC-LR detection in real water applications.
Materials and methods
Chemicals and reagents. Cysteamine (Cat. No. M9768) and molybdenum (IV) sulfide (MoS2) (Cat. No. 69860-500G) were purchased from Sigma Aldrich (St. Louis, MO, USA). Reagents purchased from Thermo Fisher Scientific (Waltham, MA, USA) were acetone (99.7%, Cat. No. 180349), ethanol (95% Cat. No. 142797), sodium phosphate monobasic monohydrate (NaH2PO4) (Cat. No. 389872500), sodium phosphate dibasic (Na2HPO4) (Cat. No. 424375000), potassium ferricyanide (Cat. No. 196785000), sulfo-NHS (N-hydroxysulfosuccinimide) (Cat. No. 24510), and N-(3-(dimethylaminopropyl)-Nʹ-ethylcarbodiimide hydrochloride (EDC) (Cat. No. 22980). MC-LR (Cat. No. ALX-350–012-C100) and anti-MC-LR monoclonal antibody (MC10E7, lgG1 type, ALX-804–320-C200) were purchased from Enzo Life (Farmingdale, NY, USA). The Abnova™ MC-LR ELISA kit (Cat. No.89028336) was purchased from Thermo Fisher Scientific (Waltham, MA, USA) and the VersaMax microplate reader (Molecular Devices, San Jose, CA, USA) was used in the MC-LR analysis of the ELISA kits. A 0.01 M phosphate buffer solution (PBS) (pH 7.3) was prepared by mixing solutions of NaH2PO4 and Na2HPO4 in Milli-Q water. The electrolyte solution was prepared by mixing 5 mM [Fe(CN)6]3-/4- in 10 mM PBS solution at pH 7.3.
Cleaning and modification of the SPCE for MC-LR detecting biosensor. Two different types of SPCEs were used for the biosensor fabrication: Type 2 (2 mm in diameter of WE, Cat. No. RRPE1001C, Pine Research Instrumentation Inc., Durham, NC, USA) and Type 4 (4 mm in diameter of WE, Cat No. DRP-C110, Metrohm, Riverview, FL, USA). First, they were cleaned by sonication (Fig. S1 in the supplementary information [SI]). The SPCEs were submerged in a cleaning solution (either acetone or ethanol) to undergo ultrasonication22,43,44. The cleaning by sonication was conducted by filling 50 mL graduated polypropylene centrifuge tubes (Cat. No. 14375150, Thermo Fisher Scientific, Waltham, MA, USA) with approximately 5–10 mL of acetone or ethanol to ensure that the WE is completely submerged. One electrode must be put into one propylene tube, and then covered after which the tubes are placed in a large breaker full of water and sonicated using the probe-type ultrasonic bath (CL-334, No. 2015060673, Thermo Fisher Scientific, Waltham, MA, USA). It was ensured that the tubes did not touch the probe or the beaker to avoid excessive vibration which could destroy the WE. The sonication was conducted at a frequency of 20 kHz at an amplitude of 25% and power of 500 watts for 5 or 90 min. The electrodes were removed and rinsed with 70% isopropanol and Milli-Q water, placed in a petri dish with Kimwipes, and dried with N2 gas to complete the cleaning process.
The surface functionalization of the WE of the biosensor involved initially coating a thoroughly cleaned surface of the carbon WE with a cysteamine self-assembled monolayer (SAM) (Fig. 1). This provided anchoring sites for the MC-LR molecules45. The coating was conducted by dropping 3 μL of 18 mM cysteamine in Milli-Q water onto the 2 mm diameter WE (Type 2) or 6 μL of 18 mM cysteamine onto the 4 mm diameter WE (Type 4), respectively. The sensors were placed in a dark and semi-humid environment for 4 h after which the sensors were rinsed with Milli-Q water and dried with N2 gas. For the immobilization of the MC-LR on the SAM layer of the WE surface, the MC-LR was first activated by mixing equal portions of 10–2 g L−1 of MC-LR, 20 mM sulfo-NHS, and 80 mM EDC by spinning in the centrifuge (Cat. No. 367160, Beckman Coulter Inc., Brea, CA, USA) at room temperature for 30 min at 500 rpm. Next, 1 μL of the activated MC-LR solution was dropped onto the 2 mm diameter WE, Type 2 (or 2 μL was used for the 4 mm WE, Type 4) and allowed to be immobilized on the WE overnight in the refrigerator (4 °C) after which the sensor was rinsed with Milli-Q water and dried with N2. This completed the surface functionalization process and the prepared MC-LR biosensor was stored in the refrigerator before use.
Electrochemical characterization of the biosensor. The cleaning process of the MC-LR biosensor was characterized electrochemically using CV30 using the PalmSens 4 (PalmSens B.V., Houten, Netherlands) in a three-electrode system where the MC-LR biosensor served as the WE, a carbon counter electrode, and an external Ag/AgCl reference electrode (MI-401, Microelectrodes, Inc., Bedford, NH, USA). The CV measurements were taken before and after the electrode cleaning process to determine the changes in current (µA) relative to a linearly cycled potential sweep in the redox solution.
The surface functionalization process of the MC-LR biosensor was characterized electrochemically using EIS and CV measurements using the PalmSens 4. The three-electrode system was also employed. CV and EIS measurements were analyzed for each step of the functionalization process starting with bare SPCE (after cleaning), cysteamine/SPCE surface, and then the MC-LR/cysteamine/SPCE surface. The potential of the DC and AC for the EIS measurement were set to 0.001 V and 0.25 V, respectively, and at a frequency range of 0.01 to 100,000 Hz. For the CV measurements, the t equilibrium was set to 8 s, the E begin was −1.0 V, the E step was 0.01 V, and the scan rate was 50 mV s−1.
Detection of MC-LR concentrations using the biosensor. The monoclonal antibody (anti-MC-LR) (MC10E7, lgG1 type, ALX-804–320-C200, Enzo Life, Farmingdale, NY, USA) was used due to its high sensitivity to MC-LR and exhibits low interferences from humic acid, salts, and surfactants/organic solvents present in solutions22. To construct calibration curves of the developed biosensor, samples containing known concentrations of MC-LR from 10–7 to 10–4 g L−1 were prepared with equal volumes (100 μL) of 10−2 g L−1 Anti-MC-LR and 10 mM PBS (pH 7.6) using the centrifuge at room temperature for 30 min at 500 rpm which allows sufficient time for the antibody to bind to the MC-LR in the sample. 1 μL of the resulting sample was then dropped onto the WE of SPCE Type 2 biosensor (or 2 μL was used for SPCE Type 4) and incubated for an hour at room temperature to allow the available antibody molecules in solution to bind to the MC-LR molecules on the surface of the sensor. The electrode was rinsed with Milli-Q water and then incubated with 0.01 M PBS for a couple of minutes before testing in the redox probe solution of 5 mM [Fe(CN)6]3-/4- in PBS (50 ml) using the PalmSens 4 to obtain EIS graphs. The peak values (Zpeak) for each known MC-LR concentration were obtained to create the calibration curve from which other unknown concentrations can be deduced. The limit of detection (LOD) was calculated using the following equation (Eq. 1)46.
| 1 |
where k is a constant determined to be 3 by the International Union of Pure and Applicable Chemistry (IUPAC), Sb is the standard deviation of blank signals and b is the slope of the calibration curve. The process, including mixing antibodies in the test solution and incubating the sensor took approximately 90 min. The peak values (Zpeak) were obtained from the EIS graph to create the calibration curves. The EIS Nyquist plot curves were fitted to the appropriate circuit model using EIS Spectrum Analyser software (ABC Chemistry).
Applications of the biosensor to real surface water samples. Natural surface water samples were collected from three lake water sources (Lake A, B, and C). Lake A sample was collected from the Daecheong Lake in South Korea during a HAB event22. The sample was pre-treated by ultrasonication using a CO-Z ultrasonic cleaner (PS-10A, AC100-120 V, 60 Hz) for 30 min to lyse the cyanobacteria and then filtered using a glass fiber prefilter (No. APFA04700, MilliporeSigma, Burlington, MA, USA) to remove the larger particles and then a 0.22 μm membrane filter (No. SLGPM33RS, MilliporeSigma, Burlington, MA, USA) was used to remove any remaining particles22. Lake B and C samples were collected from Lake sources in Florida without HAB events. The samples were pretreated by filtering through a 0.22 μm membrane filter before use. The initial MC-LR concentrations in all the lake samples were determined using the ELISA method (EPA method 546)47. The initial concentration of MC-LR in Lake A was 0.43 µgL−1 and that of Lake B and Lake C were below detectable limits. Samples of Lake A, B and C were then spiked with appropriate MC-LR concentrations for the biosensor fabrication to develop calibration curves for the natural water sources. Next, unknown MC-LR concentrations were spiked into the water samples and determined using the developed specific calibration curves for the water sources. The ELISA method (EPA method 546) was used to validate the MC-LR concentrations in the water samples.
The percent recovery (R%) and relative standard deviation (RSD) were used as measures of accuracy for this study48. R% is expressed as a percentage of a measured value relative to the theoretical value or expected value49,50 (Eq. 2).
| 2 |
where R% is the percent recovery, [MC-LR]CURVE is the MC-LR concentration of the sample determined using the calibration curves, and [MC-LR]ELISA is the concentration of the sample determined using the ELISA method. RSD between duplicate measurements for the MC-LR detection was calculated using Eq. 351.
| 3 |
where RSD is the relative standard deviation, the standard deviation is the standard deviation of the duplicate measurements and the mean is the mean of the duplicate measurements. R% exceeding 100% indicates that the measured values for a matrix were higher than the nominal value of the spike, while R% less than 100% means the measured values were lower than the nominal value of the spike52. The acceptable R% range is 70 to 120%41,53, while an acceptable RSD value should not exceed 20%41.
For water quality parameter measurements, pH was measured using the HACH pH probe and the PHC 201 meter (Hach Company, Loveland, CO, USA), while the dissolved organic carbon (DOC) was measured using the Dohrmann Phoenix 8000 UV-Persulfate TOC Analyzer (Tekmar Dohrmann, Mason, OH, USA) (Standard Methods: 5310C). The lake water samples were filtered using the 0.22 µm filter and the level of organic carbon in the filtrate was determined as the DOC levels of the samples. The alkalinity of the water samples was also measured using the double end-point titration method (Standard Methods: 2320 B) using the HACH pH probe and the PHC 201 meter (Hach Company, Loveland, CO, USA) for the pH measurement. Duplicate analyses were conducted for each test.
Supplementary Information
Acknowledgements
This publication was developed under Assistance Agreement No. SU-84056801-0 awarded by the U.S. Environmental Protection Agency to Woo Hyoung Lee at the University of Central Florida. It has not been formally reviewed by the EPA. The views expressed in this document are solely those of the authors and do not necessarily reflect those of the Agency. EPA does not endorse any products or commercial services mentioned in this publication. In addition, this project has been funded wholly or in part by the United States Environmental Protection Agency under assistance agreement 4O-03D10224-0. The contents of this document do not necessarily reflect the views and policies of the Environmental Protection Agency, nor does the EPA endorse trade names or recommend the use of commercial products mentioned in this document. The authors extend their appreciation to Prince Sattam bin Abdulaziz University for funding this research work through the project number (PSAU/2024/R/1446).
Author contributions
S.A-N.: conceptualization, methodology, analysis, writing – original draft, writing – review, editing, and validation, L-N.R.: methodology and analysis, M.A.T.: proofreading, editing, and validation, H.A.N.: writing – review and editing, W.H.L.: conceptualization, methodology, proofreading, editing, writing – review, and validation, All authors participated in writing and review of the paper.
Data availability
All data generated or analyzed during this study is included in this published article and supplementary material.
Competing interests
The authors declare no competing interests.
Footnotes
Publisher’s note
Springer Nature remains neutral with regard to jurisdictional claims in published maps and institutional affiliations.
Supplementary Information
The online version contains supplementary material available at 10.1038/s41598-024-83623-w.
References
- 1.Backer, L., Manassaram-Baptiste, D., LePrell, R. & Bolton, B. Cyanobacteria and algae blooms: review of health and environmental data from the Harmful Algal Bloom-Related Illness Surveillance System (HABISS) 2007–2011. Toxins7, 1048–1064 (2015). [DOI] [PMC free article] [PubMed] [Google Scholar]
- 2.Environmental implications and human health risk. Preece, E. P., Joan Hardy, F., Moore, B. C. & Bryan, M. A review of microcystin detections in Estuarine and Marine waters. Harmful Algae61, 31–45. 10.1016/j.hal.2016.11.006 (2017). [Google Scholar]
- 3.Giannuzzi, L., Sedan, D., Echenique, R. & Andrinolo, D. An acute case of intoxication with cyanobacteria and cyanotoxins in recreational water in Salto Grande Dam. Argentina. Marine Drugs9, 2164–2175 (2011). [DOI] [PMC free article] [PubMed] [Google Scholar]
- 4.Vidal, F. et al. Recreational exposure during algal bloom in Carrasco Beach, Uruguay: A liver failure case report. Toxins9, 267 (2017). [DOI] [PMC free article] [PubMed] [Google Scholar]
- 5.Massey, I. Y. & Yang, F. A mini review on microcystins and bacterial degradation. Toxins12, 268 (2020). [DOI] [PMC free article] [PubMed] [Google Scholar]
- 6.Massey, I. Y. et al. Exposure routes and health effects of microcystins on animals and humans: A mini-review. Toxicon151, 156–162 (2018). [DOI] [PubMed] [Google Scholar]
- 7.McLellan, N. L. & Manderville, R. A. Toxic mechanisms of microcystins in mammals. Toxicology research6, 391–405 (2017). [DOI] [PMC free article] [PubMed] [Google Scholar]
- 8.Baliu-Rodriguez, D. et al. Identification of novel microcystins using high-resolution MS and MS n with python code. Environmental Science & Technology56, 1652–1663 (2022). [DOI] [PubMed] [Google Scholar]
- 9.Arman, T. & Clarke, J. D. Microcystin toxicokinetics, molecular toxicology, and pathophysiology in preclinical rodent models and humans. Toxins13, 537 (2021). [DOI] [PMC free article] [PubMed] [Google Scholar]
- 10.USEPA. Recommended human health recreational ambient water quality criteria or swimming advisories for microcystins and cylindrospermopsin (EPA 822‐R‐19‐001). (2019).
- 11.Park, J., Kim, K. T. & Lee, W. H. Recent advances in information and communications technology (ICT) and sensor technology for monitoring water quality. Water12, 510 (2020). [Google Scholar]
- 12.USGS. Satellite Imagery Used to Measure Algal Bloom Frequency—Steps Toward Understanding Exposure Risk. (2017).
- 13.Zaffiro, A., Rosenblum, L. & Wendelken, S. C. Method 546: Determination of total microcystins and nodularins in drinking water and ambient water by adda enzyme-linked immunosorbent assay. US EPA (United States Environmental Protection Agency), Standards and Risk Management Division: Cincinnati, OH, USA, 1–21 (2016).
- 14.Shoemaker, J., Tettenhorst, D. & De la Cruz, A. Method 544: determination of microcystins and nodularin in drinking water by solid phase extraction and liquid chromatography/tandem mass spectrometry (LC/MS/MS). Washington, DC (2015).
- 15.EPA, U. S. Method 8315A (SW-846): Determination of Carbonyl Compounds by High Performance Liquid Chromatography (HPLC). (1996).
- 16.Pilevar, M., Kim, K. T. & Lee, W. H. Recent advances in biosensors for detecting viruses in water and wastewater. Journal of Hazardous Materials410, 124656 (2021). [DOI] [PubMed] [Google Scholar]
- 17.Alipoori, S. et al. Polymer-Based Devices and Remediation Strategies for Emerging Contaminants in Water. ACS Applied Polymer Materials3, 549–577. 10.1021/acsapm.0c01171 (2021). [Google Scholar]
- 18.Menon, S., Mathew, M. R., Sam, S., Keerthi, K. & Kumar, K. G. Recent advances and challenges in electrochemical biosensors for emerging and re-emerging infectious diseases. Journal of Electroanalytical Chemistry, 114596 (2020). [DOI] [PMC free article] [PubMed]
- 19.Hou, L. et al. An ultrasensitive competitive immunosensor for impedimetric detection of microcystin-LR via antibody-conjugated enzymatic biocatalytic precipitation. Sensors and Actuators B: Chemical233, 63–70. 10.1016/j.snb.2016.04.034 (2016). [Google Scholar]
- 20.Zhang, J. et al. An electrochemical non-enzymatic immunosensor for ultrasensitive detection of microcystin-LR using carbon nanofibers as the matrix. Sensors and Actuators B: Chemical233, 624–632. 10.1016/j.snb.2016.04.145 (2016). [Google Scholar]
- 21.Bilibana, M. P. et al. Electrochemical Aptatoxisensor Responses on Nanocomposites Containing Electro-Deposited Silver Nanoparticles on Poly(Propyleneimine) Dendrimer for the Detection of Microcystin-LR in Freshwater. Sensors16, 10.3390/s16111901 (2016). [DOI] [PMC free article] [PubMed]
- 22.Stoll, S. et al. Cost-effective screen-printed carbon electrode biosensors for rapid detection of microcystin-LR in surface waters for early warning of harmful algal blooms. Environmental Science and Pollution Research, 1–12 (2022). [DOI] [PubMed]
- 23.Taleat, Z., Khoshroo, A. & Mazloum-Ardakani, M. Screen-printed electrodes for biosensing: A review (2008–2013). Microchimica Acta181, 865–891 (2014). [Google Scholar]
- 24.Martín-Yerga, D. et al. Quantitative Raman spectroelectrochemistry using silver screen-printed electrodes. Electrochimica Acta264, 183–190 (2018). [Google Scholar]
- 25.Rajaram, R. & Mathiyarasu, J. The Design and Fabrication of Disposable Sensors: an Overview. (2021).
- 26.Mincu, N.-B. et al. Screen-Printed Electrodes (SPE) for in vitro diagnostic purpose. Diagnostics10, 517 (2020). [DOI] [PMC free article] [PubMed] [Google Scholar]
- 27.Cumba, L. R. et al. Can the mechanical activation (polishing) of screen-printed electrodes enhance their electroanalytical response?. Analyst141, 2791–2799. 10.1039/c6an00167j (2016). [DOI] [PubMed] [Google Scholar]
- 28.Fischer, L. M. et al. Gold cleaning methods for electrochemical detection applications. Microelectron Eng86, 1282–1285. 10.1016/j.mee.2008.11.045 (2009). [Google Scholar]
- 29.Stan, D. et al. What Is the Optimal Method for Cleaning Screen-Printed Electrodes?. Processes10, 723 (2022). [Google Scholar]
- 30.Jacobs, L. C., Peralta-Zamora, P., Campos, F. R. & Pontarolo, R. Photocatalytic degradation of microcystin-LR in aqueous solutions. Chemosphere90, 1552–1557 (2013). [DOI] [PubMed] [Google Scholar]
- 31.Zeck, A., Eikenberg, A., Weller, M. G. & Niessner, R. J. A. C. A. Highly sensitive immunoassay based on a monoclonal antibody specific for [4-arginine] microcystins. 441, 1–13 (2001).
- 32.Lee, J., Arrigan, D. W. & Silvester, D. S. Mechanical polishing as an improved surface treatment for platinum screen-printed electrodes. Sensing and bio-sensing research9, 38–44 (2016). [Google Scholar]
- 33.Shervedani, R. K., Farahbakhsh, A. & Bagherzadeh, M. Functionalization of gold cysteamine self-assembled monolayer with ethylenediaminetetraacetic acid as a novel nanosensor. Analytica Chimica Acta587, 254–262. 10.1016/j.aca.2007.01.053 (2007). [DOI] [PubMed] [Google Scholar]
- 34.Ionescu, R. E. Use of cysteamine and glutaraldehyde chemicals for robust functionalization of substrates with protein biomarkers—an overview on the construction of biosensors with different transductions. Biosensors12, 581 (2022). [DOI] [PMC free article] [PubMed] [Google Scholar]
- 35.Park, J.-A. et al. Adsorption of microcystin-LR on mesoporous carbons and its potential use in drinking water source. Chemosphere177, 15–23 (2017). [DOI] [PubMed] [Google Scholar]
- 36.Liu, X. et al. A highly sensitive electrochemical aptasensor for detection of microcystin-LR based on a dual signal amplification strategy. Analyst144, 1671–1678 (2019). [DOI] [PubMed] [Google Scholar]
- 37.Zhang, Y. et al. A molybdenum disulfide/gold nanorod composite-based electrochemical immunosensor for sensitive and quantitative detection of microcystin-LR in environmental samples. Sensors and Actuators B: Chemical244, 606–615 (2017). [Google Scholar]
- 38.Hwang, J.-H. et al. Recycling urine for bioelectrochemical hydrogen production using a MoS2 nano carbon coated electrode in a microbial electrolysis cell. Journal of power sources527, 231209 (2022). [DOI] [PMC free article] [PubMed] [Google Scholar]
- 39.Saraf, M., Natarajan, K., Saini, A. K. & Mobin, S. M. Small biomolecule sensors based on an innovative MoS 2–rGO heterostructure modified electrode platform: a binder-free approach. Dalton Transactions46, 15848–15858 (2017). [DOI] [PubMed] [Google Scholar]
- 40.WHO. Technical Notes on WASH in Emergencies. Technical note 11: Measuring Chlorine levels in water supplies. (2013).
- 41.USEPA. OCSPP 850.6100: Environmental Chemistry Methods and Associated Independent Laboratory Validation [EPA 712-C-001], <https://www.regulations.gov/document/EPA-HQ-OPPT-2009-0154-0008> (2012).
- 42.USEPA. Water treatment optimization for cyanotoxins (EPA 810-B-16–007). (2016).
- 43.Melo, A. et al. Optimization and characterization of a biosensor assembly for detection of Salmonella Typhimurium. Journal of Solid State Electrochemistry22, 1321–1330 (2018). [Google Scholar]
- 44.Dutta, G., Regoutz, A. & Moschou, D. in Proceedings. 741 (MDPI).
- 45.Dos Santos, M. B. et al. Portable sensing system based on electrochemical impedance spectroscopy for the simultaneous quantification of free and total microcystin-LR in freshwaters. Biosensors and Bioelectronics142, 111550 (2019). [DOI] [PubMed] [Google Scholar]
- 46.Lee, W. H., Wahman, D. G. & Pressman, J. G. Amperometric carbon fiber nitrite microsensor for in situ biofilm monitoring. Sensors and Actuators B: Chemical188, 1263–1269. 10.1016/j.snb.2013.08.058 (2013). [Google Scholar]
- 47.Steven C. Wendelken, P. D. (ed Office of Ground Water and Drinking Water U.S. EPA, Standards and Risk Management Division) (2016).
- 48.Schoenau, E. A. in Current Challenges and Advancements in Residue Analytical Methods 3–16 (ACS Publications, 2019).
- 49.Albareda-Sirvent, M., Merkoçi, A. & Alegret, S. Pesticide determination in tap water and juice samples using disposable amperometric biosensors made using thick-film technology. Analytica Chimica Acta442, 35–44 (2001). [Google Scholar]
- 50.Powell, M. J. & Timperman, A. T. Quantitative analysis of protein recovery from dilute, large volume samples by tangential flow ultrafiltration. Journal of Membrane Science252, 227–236 (2005). [Google Scholar]
- 51.Parsons, H. M., Ekman, D. R., Collette, T. W. & Viant, M. R. Spectral relative standard deviation: a practical benchmark in metabolomics. Analyst134, 478–485 (2009). [DOI] [PubMed] [Google Scholar]
- 52.Fichorova, R. N. et al. Biological and technical variables affecting immunoassay recovery of cytokines from human serum and simulated vaginal fluid: a multicenter study. Analytical chemistry80, 4741–4751 (2008). [DOI] [PMC free article] [PubMed] [Google Scholar]
- 53.Rahman, M. M. et al. Consequences of the matrix effect on recovery of dinotefuran and its metabolites in green tea during tandem mass spectrometry analysis. Food chemistry168, 445–453 (2015). [DOI] [PubMed] [Google Scholar]
Associated Data
This section collects any data citations, data availability statements, or supplementary materials included in this article.
Supplementary Materials
Data Availability Statement
All data generated or analyzed during this study is included in this published article and supplementary material.