Abstract
Iron overload (IO) was considered to be a risk factor for cartilage degradation in knee osteoarthritis (KOA) advancement. However, few drugs were found to improve cartilage degeneration by alleviating multiple cell death induced by the impaired iron level of the knee joints. We aimed to elucidate that Arctiin (ARC) plays a role in managing KOA caused by accumulated iron levels by restoring chondrocyte apoptosis and ferroptosis. Single-cell RNA sequencing analysis was used to discover the disparities in chondrocytes between KOA patients and non-KOA individuals. CCK-8 assay was performed to detect chondrocyte viability. Annexin V-FITC/PI staining determined the cell apoptosis rate. The fluorescence density reflected the iron content, ROS, lipid-ROS, and mitochondrial membrane potential. Q-RTPCR and Western Blotting were used to detect the expression levels of genes and proteins expression. Micro-CT and Safranin O-Fast Green staining were used to detect the phenotype of the knee joints. ARC increased cell viability and inhibited chondrocyte apoptosis. Further, ARC acts as an anti-ferroptosis effect by reducing the intracellular iron, ROS, and lipid-ROS content and restoring mitochondrial damage. Based on the results of scRNA-seq, we found that ARC can play a role by activating AKT/NRF2/HO-1 signaling pathway. In vivo, ARC can significantly improve the severity of KOA caused by IO. ARC alleviates oxidative stress in chondrocytes via the AKT/NRF2/HO-1 signaling pathway, suggesting the potential application of ARC in KOA.
Supplementary Information
The online version contains supplementary material available at 10.1038/s41598-024-83383-7.
Keywords: Herbal medicine, Cartilage degeneration, Iron overload, Apoptosis, Ferroptosis
Subject terms: Cell biology, Molecular biology, Target validation
Introduction
KOA is a prevalent joint disease that deteriorates the daily quality of the elderly life1. KOA is mainly characterized by cartilage degeneration and joint space stenosis2. Risk factors contributing to KOA are complicated3. Currently, accumulating evidence Iron overload is a significant factor in the development of age-related diseases such as KOA and osteoporosis4–6. To explore more about KOA, research should be carried out on the relationship between iron and KOA.
Iron is an essential element for physiological activities but superfluous iron plays a destroyer role7. IO progresses KOA through increasing intra-chondrocytes ROS levels. When the labile iron pool (LIP) of chondrocytes is out of limits, the generation of ROS is stimulated via the Fenton reaction8. Further, ROS accumulation promotes apoptosis, ferroptosis, and mitochondrial damage of chondrocytes, which means IO can deteriorate KOA in a complicated way9,10. Among the downstream mediators of PI3K/AKT, nuclear factor-E2-related factor 2 (NRF2) is a vital transcriptional factor that possesses eliminating ROS potential11. As the transcription factor that targets HO-1, GPX4, and xCT, above all phenotypes can be initiated by NRF212.
Traditional Chinese Medicine (TCM) which lacks severe side effects may be a great remedy for KOA. The efficacy of TCM has been verified for thousands of years13. ARC is a major ingredient of TCM named Fructus Arctii according to the Chinese Pharmacopeia14. ARC mostly belongs to the Asteraceae family and many herbs that contain high levels of ARC are regarded as drugs for inflammatory diseases (i.e., osteoarthritis and rheumatic arthritis)15. Our previous study indicates that ARC plays a significant role in reducing ROS via regulating the NRF2/HO-1 signaling pathway in osteoclasts16. However, few studies focus on ARC suppressing chondrocyte apoptosis and ferroptosis caused by accumulated iron.
Taken together, we hypothesized that ARC can be a potential agent of KOA via inhibiting chondrocyte apoptosis and ferroptosis induced by IO. In this study, ferric ammonium citrate (FAC) was used to increase the intracellular iron content. Additionally, destabilized medial meniscus (DMM) surgery was performed to cause KOA in vivo, and iron-dextrin (ID) was used to induce iron overload in the knee joints. Additionally, we discussed whether ARC can activate NRF2/HO-1 axis by promoting AKT.
Materials and methods
Reagents
ARC (C27H34O11, purity ≥ 98%) was bought from Lemeitian Medicine Co., Ltd (Chengdu, China). Iron dextrin (ID, D8517), Ferric ammonium citrate (FAC, CAT NO.: #F5879), Deferoxamine (DFO, CAT NO.: #D9533), and Ethylenediaminetetraacetic acid (EDTA, CAT NO.: #E8008) were provided by Sigma–Aldrich (Sydney, Australia). RIPA Lysis Buffer (CAT NO.: #P0013B), Tris-buffered Saline Tween (TBST, CAT NO.: #ST673), 10% SDS-PAGE Gel Super Quick Preparation Kit (CAT NO.: #P0690), Reactive Oxygen Species Assay Kit (CAT NO.: #S0033S), BCA protein assay kit (CAT NO.: #P0012S), Enhanced mitochondrial membrane potential assay kit (CAT NO.: #C2003S), GSH and GSSG assay kit (CAT NO.: #S0053) and Annexin V-FITC Apoptosis Detection Kit (CAT NO.: #C1062S) were acquired from Beyotime Biotechnology Company (Shanghai, China). Cell counting kit-8 (CCK-8, CAT NO.: BS350A) and paraformaldehyde (PFA, CAT NO.: BL539A) were bought from Biosharp Science, Inc. (Anhui, China). Dulbecco’s Modified Eagle Medium: Nutrient Mixture F-12 (DMEM/F12, CAT NO.: 11320033), penicillin/streptomycin (P/S, CAT NO.: 15140122), fetal bovine serum (FBS, CAT NO.: 10100147), and C11 BODIPY Lipid Peroxidation Sensor (CAT NO.: D3861) were purchased from Thermo Fisher Scientific (Scoresby, Australia). Primary rabbit antibodies specific for GPX4 (CAT NO.: DF6701) and xCT (CAT NO.: DF12509) were purchased from Affinity Biosciences, Inc. (Cincinnati, OH, USA). Primary antibodies specific for NRF2 (CAT NO.: D1Z9C) and HO-1 (CAT NO.: 70081) were acquired from Cell Signaling Technology (Beverly, MA, USA). COL2A1 (CAT NO.: ab307674), SOX9 (CAT NO.: ab185230) and Goat Anti-Rabbit IgG H&L (CAT NO.: ab150077) were purchased from Abcam (Cambridge, UK). BCL2 (CAT NO.: sc-7382), BAX (CAT NO.: sc-70407), and β-ACTIN (CAT NO.: sc-47778) were obtained from Santa Cruz Biotechnology (San Jose, CA, USA). Secondary antibodies were provided by Bioss (Beijing, China). MK2206 (CAT NO.: HY-108232) was bought from MCE (USA). TritonX-100 (CAT NO.: IT9100) was purchased from Solarbio Life Sciences (Beijing, China).
ScRNA-seq data analysis
We extracted cartilage scRNA-seq data about 3 KOA patients and 3 non-KOA people. Data obtained from GSE220243 were analyzed with Seurat (v2.0.1) package17. Briefly, the Seurat object was generated from digital gene expression matrices. Then we performed analyses of PCA, cell cluster, and umap. Single R package (v2.0.0) was used to annotate cell clusters. Digital gene expression matrices with annotations were analyzed by Monocle (v2.3.6) package. Pseudo-time trajectories of cells and pseudo-time-dependent gene expression changes were analyzed by Monocle (v2.3.6) package. Enrichment analysis of differential expression genes was performed by enrichR (v3.2) package.
Cell Isolation and culture
Briefly, 1-week-old C57BL/6 male mice were sacrificed for the collection of cartilage from both knee joints. First, the cartilage was sectioned into small pieces and subsequently washed five times with PBS18. The specimens were subjected to enzymatic digestion using a 0.25% trypsin-EDTA solution for 30 min, followed by treatment with DMEM/F12 (containing collagenase type II) for a duration of 6 h at 37 °C19. Cells were harvested using a 70 μm strainer. The released chondrocytes were seeded into 25 cm2 cell flasks and cultured in a humidified atmosphere with 5% CO2 at 37 °C. Cells were passaged at a ratio of 1:3 upon reaching 80–90% confluency.
CCK-8 assay
The viability of chondrocytes was detected by CCK-8 assay. Primary chondrocytes were seeded into 96-well plates at a density of 3 × 10³ cells/well. After adherence for 24 h, cells were treated with 500µM FAC, 100µM DFO, and ARC (5, 10, 20, 40µM) for 48 h. At a specific time, CCK-8 solution (10 µl/well) was added to the plates and incubated at 37 °C in a dark environment for a duration of 1 h. The absorbance at 450 nm wavelength was detected by Mutiskan GO plate reader (Thermo Fisher Scientific, Vantaa, Finland). Each group was repeated 3 times.
Measurement of cell apoptosis rate
Chondrocytes were cultured in DMEM/F12 medium supplemented with 10% FBS. Briefly, cells were seeded into a 6-well plate at a concentration of 5 × 10⁵cells/well. Then cells were received with respective treatments which were divided into five groups: the negative control (NC) group, the model (MOD) group, the positive control (PC) group, the low dose group (ARC-L), and the high dose group (ARC-H). 500µM FAC was added to the MOD group. With the presence of 500µM FAC, the PC group was treated with 100µM DFO, while the ARC-L and ARC-H groups were treated with 20µM and 40µM of ARC, respectively. After 48 h, cells were harvested and rinsed with PBS twice. Then Annexin V-FITC was used to label cells at 4 °C for 15 min and then PI was used to label at room temperature for 15 min in the darkness20. The stained cells were analyzed by a FACS LSRFortessa™ flow cytometer (BD Biosciences, Franklin Lakes, NJ). Each group was repeated 3 times.
Evaluation of intracellular iron levels
In order to detect the level of intracellular iron content, cells were labeled with calcein-acetoxymethyl ester (Calcein-AM) assay as described before21. First, cells were seeded into a 24-well plate at a density of 1 × 10⁵ cells/well. Following the mentioned treatment, all groups were incubated for 48 h. Subsequently, 0.5 µM Calcein-AM was introduced into each well and allowed to incubate for 30 min at 37 °C. Calcein fluorescence was recorded at 488 nm emission wavelengths, and fluorescence intensity was measured by a fluorescence microscope (Leica, Wetzlar, Germany). The fluorescence signal of 25–30 single cells was monitored in five separate fields at ×100 magnification and subsequently analyzed using Image J to obtain the mean value. Each group was repeated 3 times.
Evaluation of intracellular ROS and lipid-ROS
The reactive oxygen species assay kit and C11 BODIPY Lipid Peroxidation Sensor were used to determine intracellular ROS and lipid-ROS levels respectively. Primary cells were seeded in 6‑well plates at a density of 3 × 10⁵ cells/well and adhered for 24 h. Then cells were treated as the above description. The chondrocytes were washed three times with serum-free medium (SFM) and subsequently incubated in the dark with either 10 µM dichloro-dihydro-fluorescein diacetate (DCFH-DA) or 5 µM C11 BODIPY for a duration of 20 min. Following rinsing with SFM, cells were analyzed via FACS LSRFortessa™ flow cytometer (BD Biosciences, Franklin Lakes, NJ). Each group was repeated 3 times.
Assessment of mitochondrial membrane potential
JC-1 is a commonly employed fluorescent-labeling probe utilized to detect mitochondrial membrane potential. Under conditions of high mitochondrial membrane potential, JC-1 accumulates within the matrix of mitochondria to form polymers that exhibit red fluorescence22. Cells were seeded in 6‑well plates at a density of 3 × 10⁵ per well and treated according to the aforementioned groupings for a duration of 48 h. Following three washes with SFM, chondrocytes were incubated with JC‑1 staining solution for 30 min at room temperature in the absence of light. After incubation, cells were harvested and subsequently incubated with JC-1 staining solution as previously described. Cells were re‑suspended in 500 µl PBS and the fluorescence intensity was analyzed with FACS LSRFortessa™ flow cytometer (BD Biosciences, Franklin Lakes, NJ). Each group was repeated 3 times.
Determination of glutathione level
The glutathione (GSH) and oxidized glutathione (GSSG) assay kit was utilized to measure the levels of reduced GSH and GSSG, respectively. Briefly, chondrocytes were seeded in 6‑well plates at a density of 5 × 10⁵ cells/well and adhered for 24 hrs. Then cells were treated for 48 hrs and cells were centrifuged at 10000 g for 10 mins. The supernatant was firstly mixed with GSH assay buffer, GSH reductase, and 5,5’-dithio-bis 2-nitrobenzoic acid solution. Upon incubation at 25 °C for 5 mins, NADPH was introduced into the mixture. The resulting solution was subjected to absorbance measurement at a wavelength of 412 nm. The concentration of total glutathione and GSSG was determined using a standard curve, with the GSH level being equivalent to twice the value of total glutathione minus GSSG. Each group was repeated 3 times.
Total RNA isolation and real-time quantitative PCR analysis
Chondrocytes were seeded in 6‑well plates at a concentration of 5 × 10⁵ cells/well. After 24 h adherence, chondrocytes were treated for 24 h. Using TRIzol Reagent, total RNA was extracted and quality was measured by Nanodrop 2000 (Thermo Scientific, Rockford, IL, USA). Reverse transcription was made of 1000 ng of total RNA. The relative expression levels of mRNAs were calculated following the 2−ΔΔCt method, with 18s serving as the housekeeping gene. The primer sequences employed in this analysis can be found in Table 1. Each group and sample was repeated 3 times.
Table 1.
q-RTPCR primer sequence.
| Gene | Forward (5’−3’) | Reverse (5’−3’) |
|---|---|---|
| Bax | AGGATGCGTCCACCAAGAAGCT | TCCGTGTCCACGTCAGCAATCA |
| Bcl2 | CCTGTGGATGACTGAGTACCTG | AGCCAGGAGAAATCAAACAGAGG |
| Gpx4 | CCTCTGCTGCAAGAGCCTCCC | CTTATCCAGGCAGACCATGTGC |
| 18s | TGGTTGCAAAGCTGAAACTTAAAG | AGTCAAATTAAGCCGCAGGC |
Western blotting
To analyze the interacting proteins, chondrocytes were incubated at a density of 5 × 10⁵ cells/well in 6‑well plates. After treating 12 h and 24 h, cell proteins were extracted with 80 µl of RIPA lysis buffer and incubated on ice for a duration of 30 min. The protein concentration was determined using a BCA protein assay kit, after which the proteins were subjected to 10% SDS-PAGE and subsequently underwent electrophoresis. Proteins were then transferred from gels to the PVDF filter membranes. The membranes were washed three times with TBST, and subsequently blocked with 5% skimmed milk for a duration of 1.5 h at room temperature. Primary antibodies (1:1000) were incubated with membranes overnight in a cold room. The next day, the membranes were rinsed with TBST 3 times for 10 min each. Horseradish peroxidase–conjugated secondary antibodies (1:3000) were used to incubate at room temperature for 2 h. Protein bands were visualized using a chemiluminescence HRP substrate and gel imaging system (Bio-Rad, Hercules, CA). The density of each band was subsequently quantified using image J. Each group and sample was repeated 3 times.
Animal grouping and treatment
All experimental protocols and procedures were approved by Laboratory Animal Center, The First Affiliated Hospital of Guangzhou University of Chinese Medicine (Ethic NO. TCMF1-2021029). All methods were performed in accordance with the relevant guidelines and regulations. This research was performed according to the ARRIVE guidelines 2.0 for reporting in vivo experiment23. All mice were retained on an alternating 12 h light/dark cycle in a specific-pathogen-free (SPF) environment with a relative humidity of 55–60% and temperature of 22–25 °C. The 7-week-old male C57BL/6 mice (n = 50, 20 ± 5 g) were provided by the Animal Laboratory Center of Guangzhou University of Chinese Medicine (SCXK (Yue) 2018-0034). All mice were randomly allocated to five groups: negative control (NC) group (n = 10), model (MOD) group (n = 10), positive control (PC) group (n = 10), low dosage of ARC (ARC-L) group (n = 10) and high dosage of ARC (ARC-H) group (n= 10). After adaptively feeding for 1 weeks, mice were injected with ID (500 mg/kg) intraperitoneally once a week for 8 weeks to establish the iron overload mice model24except for the NC group. 2 weeks after the first injection of ID, DMM was performed to build the OA model25. After the surgery, the PC group was administrated DFO intragastrically for 8 weeks. ARC-L and ARC-H groups were also treated with 20 mg/kg and 40 mg/kg of ARC separately for 8 weeks. Mice were euthanatized by 50% CO2 of the chamber volume/min and samples were harvested at 18 weeks old.
Micro-CT scanning
The right lower limbs were fixed in 4% PFA. 24 h later, 4% PFA was changed by 70% ethanol. The Micro-CT equipment utilized in this study was the Skyscan1172 model, manufactured by Bruker in Belgium. The joints were scanned using the following parameters: an 80 kV voltage, a 100µA current, a 0.4-degree rotation step, a 0.5 mm aluminum filter, and a slice thickness of 5 μm26. For the purpose of quantitative analysis, the volume of interest (VOI) selected was the subchondral bone located at the medial tibial plateau27. The CT Analyzer software (Bruker micro-CT, Kontich, Belgium) was employed to evaluate bone volume/tissue volume (BV/TV, %), trabecular number (Tb.N, 1/mm), trabecular spacing (Tb.Sp, mm), and trabecular thickness (Tb.Th, mm). Subchondral bone plate (SBP) thickness of the femur and tibia were analyzed by generating a 3D color map of thickness for the entire SBP28.
Histological staining
Following the scanning procedure, all samples underwent decalcification with 14% EDTA at 37 °C for a duration of 3 weeks, after which they were embedded in paraffin29. Sagittal sections of 5 μm thickness were obtained from the medial compartment of the knee joints using a microtome (Leica biosystems, USA). Subsequent to sectioning, the specimens were subjected to staining with Safranin-O/Fast Green and Perl’s Prussian blue using a previously established protocol. This was done in order to evaluate the extent of cartilage degradation and iron deposition within the joints30,31. The Osteoarthritis Research Society International (OARSI) scoring system was for quantification32. Scoring was carried out by two independent investigators who were blinded to the grouping of the samples.
Immunofluorescence
Paraffin sections were permeated with 0.5% TritonX-100, and incubated with the NRF2 primary antibody at 4 °C overnight. Incubated the secondary antibody for 1 h and DAPI for 5 min at room temperature. The images were captured by fluorescence microscope (Leica, Wetzlar, Germany). Quantitative analysis of NRF2+ cells in each randomly selected field was performed with ImageJ software.
Statistical analysis
All experimental results presented were repeated a minimum of three times. Statistical analyses and data visualization were carried out using GraphPad Prism (8.4.3). The data were analyzed using the one-way ANOVA and student’s t-tests. Results were presented as means ± standard deviation (SD). Statistical significance was set at p-value ≤ 0.05.
Results
Chondrocytes ferroptosis and apoptosis are correlated with KOA
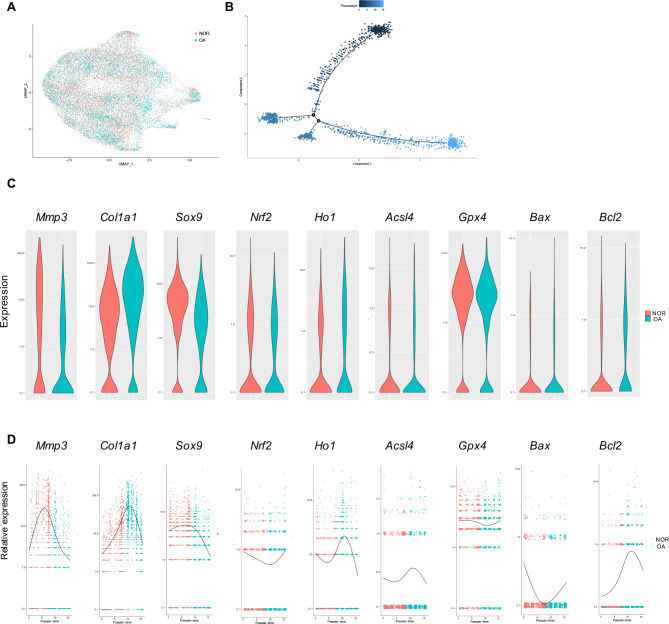
We selected cartilage scRNA-seq to explore the potential mechanism of KOA33. 3 KOA patients’ and 3 non-KOA individual cartilage were harvested to perform scRNA-seq. After normalizing selected data, 25,958 genes from OA and non-OA cartilage were screened (Fig. 1A, B). Then, we performed pseudo-time trajectories of cells and demonstrated that ferroptosis- and apoptosis-related genes were changed in the process of KOA (Fig. 1C, D). Mmp3, Col1a1, and Sox9 were related to the degeneration of cartilage. The general change of these 3 genes expression level was gradually decreased during the process of KOA (Fig. 1C, D). Nrf2 and Ho1 were related to oxidative stress. Both of them were downregulated first, then turned to upregulate in the process of KOA (Fig. 1C, D). Acsl4 and Gpx4 were ferroptosis promoter and inhibitor separately. At the onset of KOA, ACSL4 was increased but Gpx4 was declined (Fig. 1C, D). Bax and Bcl2 were apoptosis promoter and inhibitor separately. At the beginning of KOA, Bax was upregulated but Bcl2 was downregulated (Fig. 1C, D).
Fig. 1.
scRNA-Seq analysis of GSE220243. (A) Visualization of clustering by Uniform Manifold Approximation and Projection (UMAP) plot of healthy and OA articular cartilage samples. (B) Pseudotime analyses in healthy and OA articular cartilage samples. (C) Violin plot of cartilage degeneration-related, ferroptosis-related, and apoptosis-related markers expression levels between healthy and OA articular cartilage samples. (D) Pseudotime analysis of cartilage degeneration-related, ferroptosis-related, and apoptosis-related markers expression levels from healthy cartilage to OA cartilage.
Enrichment analysis of scRNA-seq data
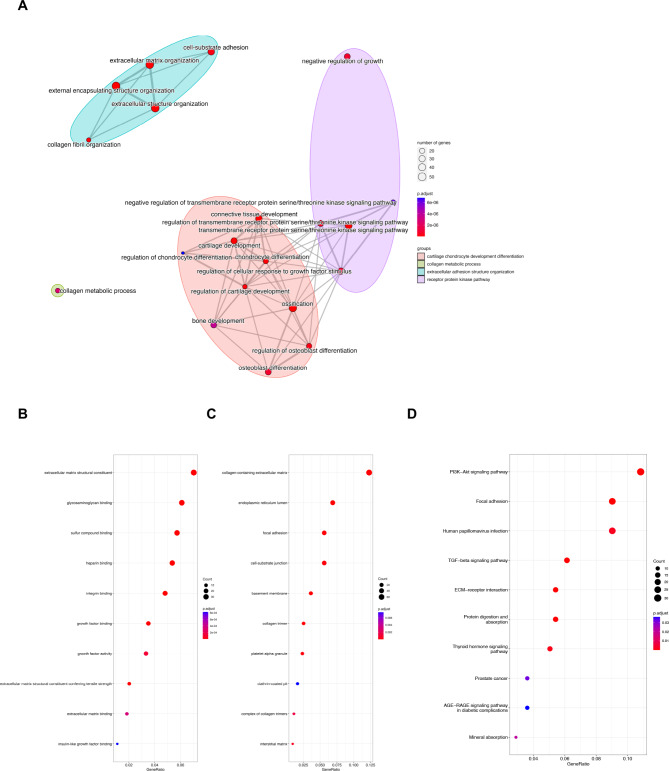
Based on the screening work, 2848 differential expression genes were obtained to perform the enrichment analyses. According to the biological process of gene ontology (GO), we found that genes were mostly enriched in cartilage chondrocyte development differentiation-related processes including cartilage development, regulation of cartilage development, and ossification (Fig. 2A). Results of the molecular function showed that extracellular matrix structural constituent, glycosaminoglycan binding, heparin binding, etc. were related to KOA (Fig. 2B). In part of the cell component, differential expression genes were mainly related to collagen-containing extracellular matrix, endoplasmic reticulum lumen, focal adhesion, and so on Fig. 2C). Outcomes of Kyoto Encyclopedia of Genes and Genomes (KEGG) unveiled that much more differentiation genes enriched in the PI3K/AKT signaling pathway (Fig. 2D)34,35.
Fig. 2.
Enrichment analysis. Dot plot of (A) GO biological processes; (B) GO molecular function; (C) GO cell component and (D) top 10 KEGG pathways.
ARC improves chondrocyte viability
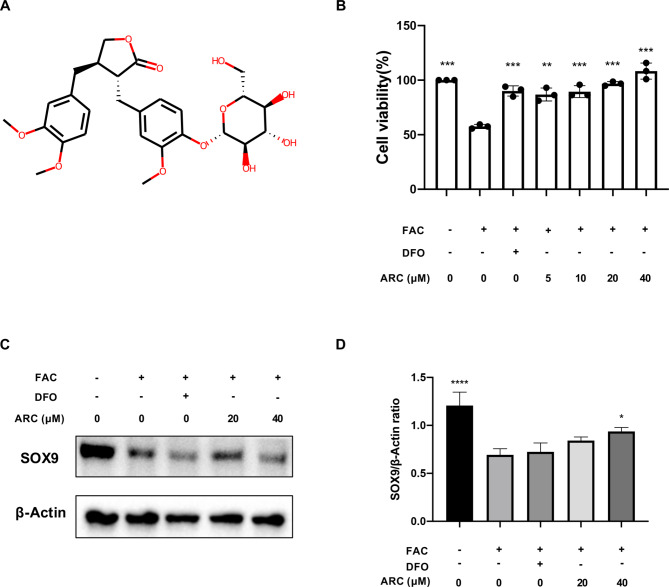
Figure 3A shows the molecular structure of ARC. A CCK-8 assay was conducted to evaluate the potential toxicity of ARC, and our findings indicate no discernible cytotoxic effects on chondrocytes across the range of concentrations studied (Fig. 3B). Based on the results of the CCK-8 assay, 500µM FAC induced a 40% cell death rate. 20µM and 40µM of ARC were identified as the efficient concentration to rescue chondrocytes. Further, we detected the chondrocyte marker which is SOX9. The protein expression showed that SOX9 was decreased by FAC but restored by a high dosage of ARC (Fig. 3C, D).
Fig. 3.
ARC rescues chondrocytes killed by excessive iron in a dose-dependent manner. (A) Molecular structure of ARC. (B) Effect of 500µM FAC, 100µM DFO and indicated concentrations (0, 5, 10, 20, 40µM) ARC on the viability of chondrocytes as measured by CCK-8 assay. (C) Representative western blotting images of SOX9 protein. (D) The ratio of band intensity of SOX9 (D) was normalized by β-actin. (“-” means untreated while “+” means treated. Data were presented as mean ± SD. n = 3 per group. Significant differences between the MOD and other groups were shown as * (p-value < 0.05), and **** (p-value < 0.0001)).
ARC protects chondrocytes from apoptosis by iron overload
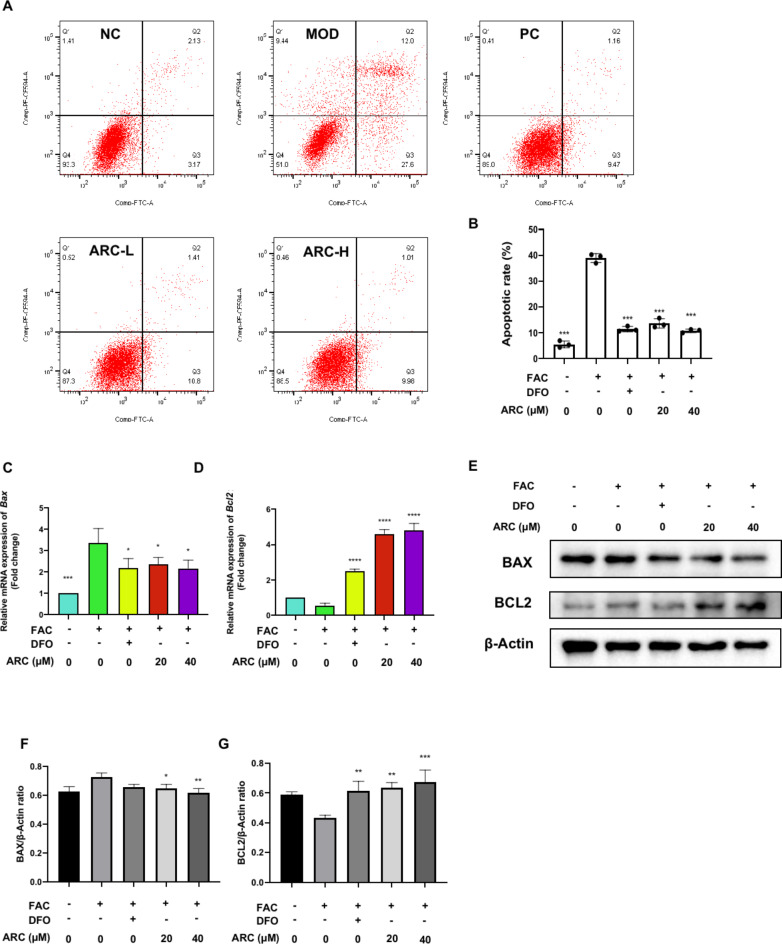
To further evaluate the ARC potential effect on the cell viability of chondrocytes, annexin V-FITC/PI staining was performed. Then, flow cytometric analysis unveiled that non-apoptotic cells reduced from 93.3 to 51.0% after treatment with FAC (Fig. 4A). DFO treatment was able to maintain the percentage of non-apoptotic cells at approximately 89.0% (Fig. 4A). Various concentrations of ARC maintained the non-apoptotic chondrocytes around 87.3–88.5% (Fig. 4A). It means ARC can protect chondrocytes against apoptosis induced by accumulated iron (Fig. 4B). Further, we detected the expression of transcript and protein of BAX and BCL2. Results of qRT-PCR and WB demonstrated that ARC can suppress BAX expression levels in both transcript and protein (Fig. 4C, E, F). The expression levels of BCL2 can increased by ARC after FAC treatment (Fig. 4D, E, G).
Fig. 4.
ARC reduces cell apoptosis rate induced by iron overload. (A) Percentage pro-apoptotic and apoptotic chondrocytes under different treatments including 500µM FAC, 500µM FAC + 100µM DFO, 500µM FAC + 20µM ARC and 500µM FAC + 40µM ARC were examined by annexin V-FITC/PI staining flow cytometry. (B) Bar graph of cell apoptotic rate. (C, D) Relative mRNA expression of Bax and Bcl2. (E) Representative Western Blotting images reflecting the effects of ARC on BAX, and BCL2. (F, G) The ratios of band intensity of BAX (F), and BCL2 (G) were normalized by β-actin. (“-” means untreated while “+” means treated. Data were presented as mean ± SD. n = 3 per group. Significant differences between the MOD and other groups were shown as * (p-value < 0.05), ** (p-value < 0.01), *** (p-value < 0.001), and **** (p-value < 0.0001)).
ARC reduces intracellular labile iron, ROS, lipid-ROS and restores mitochondrial membrane potential of chondrocytes
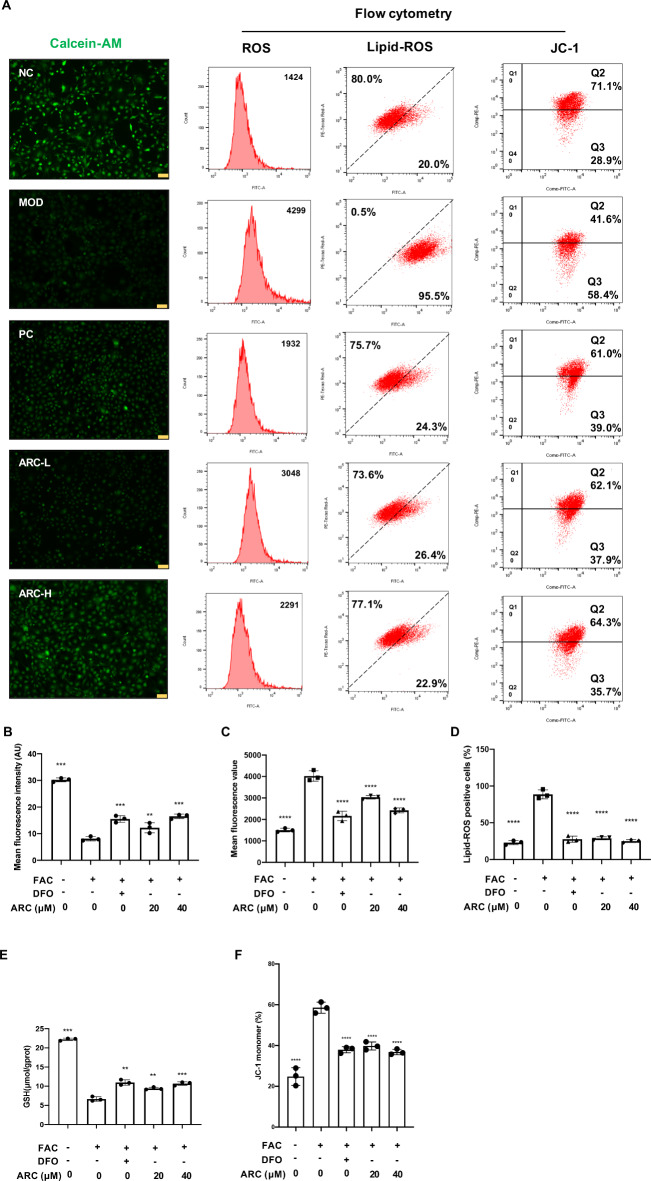
To further confirm the intracellular iron pool, labile iron pool (LIP) was monitored by using the Calcein-AM assay. Compared to normal chondrocytes, the fluorescence intensity detected in FAC-treated chondrocytes was decreased. After treatment with ARC, the fluorescence density was restored in a dose-dependent manner (Fig. 5A, B). According to the flow cytometry, the mean fluorescence of ROS was accumulated from 1424 to 4299 after FAC treatment but ARC decreased ROS levels in a dose-dependent manner and maintained the value around 2291 to 3048 (Fig. 5A, C). Besides, lipid-ROS-positive chondrocytes increased from 20.0 to 95.5% after FAC treatment and various dosages of ARC could decrease lipid-ROS to 26.4% or 22.9% (Fig. 5A, D). Also, the content of GSH influenced by FAC could be improved by DFO and various dosage ARC (Fig. 5E). Additionally, red JC-1 monomers increased from 28.9 to 58.4% after FAC treatment but ARC could maintain red JC-1 monomers around 35.7–37.9% (Fig. 5A, F).
Fig. 5.
ARC reduces intracellular iron, ROS, and lipid-ROS content of chondrocytes and restores mitochondrial damage. (A) Representative Calcein-AM images, flow cytometry images of ROS level, lipid-ROS level, and mitochondrial potential. (B) Mean fluorescence intensity of Calcein-AM evaluated by image J. (C) Bar chart of mean fluorescence of ROS. (D) Bar chart of lipid-ROS positive cells percentage. (E) Bar graph of intracellular GSH contents. (F) Bar chart of JC-1 monomers percentage. (scale bar = 200 μm; “-” means untreated while “+” means treated. Data were presented as mean ± SD. n = 3 per group. Significant differences between the MOD and other groups were shown as ** (p-value < 0.01), *** (p-value < 0.001), and **** (p-value < 0.0001)).
ARC regulates ROS scavenger and ferroptosis-related marker
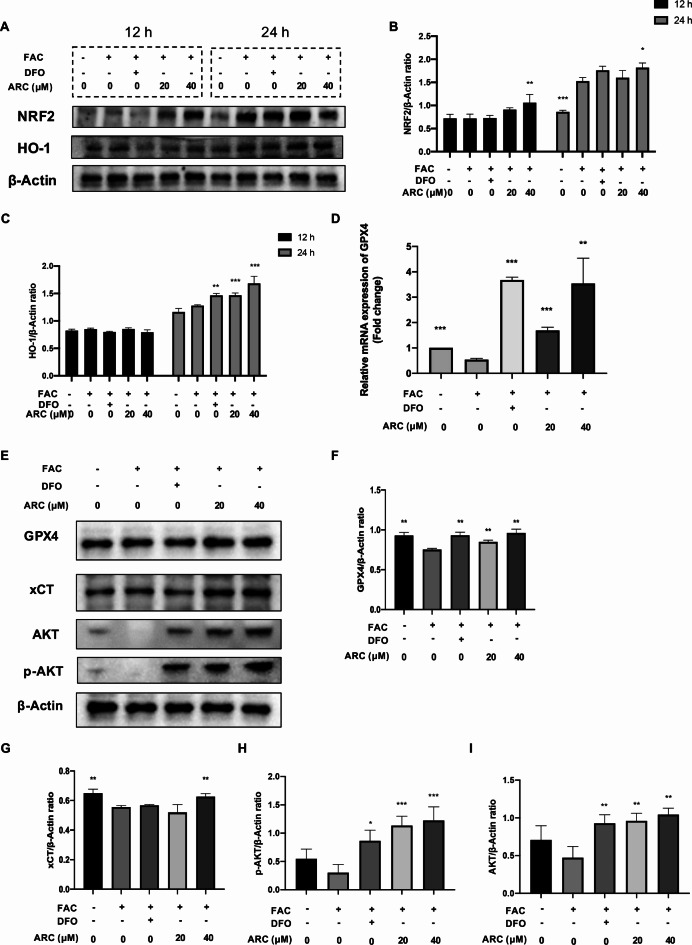
Flow cytometry showed the effect of ARC reducing ROS levels. As the main ROS scavenger, NRF2 was first activated in high-dose ARC after being treated for 12 h and HO-1 maintained a low level after being treated for 12 h (Fig. 6A-C). After being treated for 24 h, NRF2 was activated compared to the control group and HO-1 was significantly promoted in the DFO, and the ARC group compared to the model group (Fig. 6A-C). GPX4 and xCT which were biomarkers of ferroptosis were repaired by ARC (Fig. 6D-G). AKT and p-AKT were suppressed by FAC obviously but rescued by DFO and ARC (Fig. 6E, H, I).
Fig. 6.
ARC regulates NRF2/HO-1 axis and ferroptosis-related markers. (A) Representative Western Blotting images of different time points (12 h and 24 h) reflecting the effects of ARC on NRF2 and HO-1. (B, C) The ratios of band intensity of NRF2 (B) and HO-1 (C) relative to β-Actin. (D) Relative mRNA expression of Gpx4. (E) Representative Western Blotting images reflecting the effects of ARC on GPX4, xCT. (F, G) The ratios of band intensity of GPX4 (F) and xCT (G) relative to β-Actin. (“-” means untreated while “+” means treated. Data were presented as mean ± SD. n = 3 per group. Significant differences between the MOD and other groups were shown as * (p-value < 0.05), ** (p-value < 0.01), and *** (p-value < 0.001)).
ARC protects against chondrocyte degeneration via activating AKT
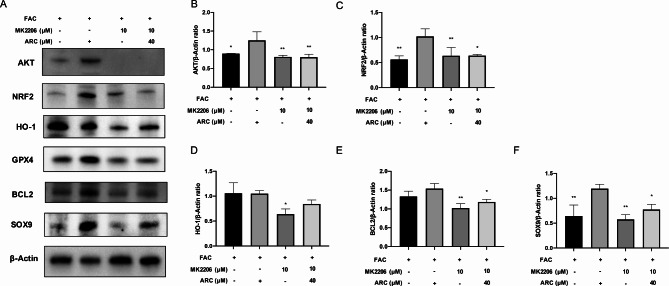
Then, we used MK2206 to block AKT protein expression (Fig. 7A, B). After treating MK2206, the effect of ARC in increasing NRF2, HO-1, GPX4, BCL2, and SOX9 was inhibited (Fig. 7A, C-F).
Fig. 7.
The effect of ARC was inhibited via blocking AKT. (A) Representative Western Blotting images reflecting the effects of 40µM ARC on NRF2, HO-1, GPX4, BCL2, and SOX9 with or without 10µM MK2206 which is AKT inhibitor. (B-F) The ratios of band intensity of AKT (B), NRF2 (C), HO-1 (D), BCL2 (E), and SOX9 (F) to β-Actin.
ARC prevents the progression of KOA in mice model
Based on the results of Perl’s Prussian blue histological staining, excessive iron deposits in the knee joints of MOD group mice, which means we have a well-established animal model (Supplementary Fig. 1). Further, high dosage of ARC decreased iron accumulation of knee joint (Supplementary Fig. 1).
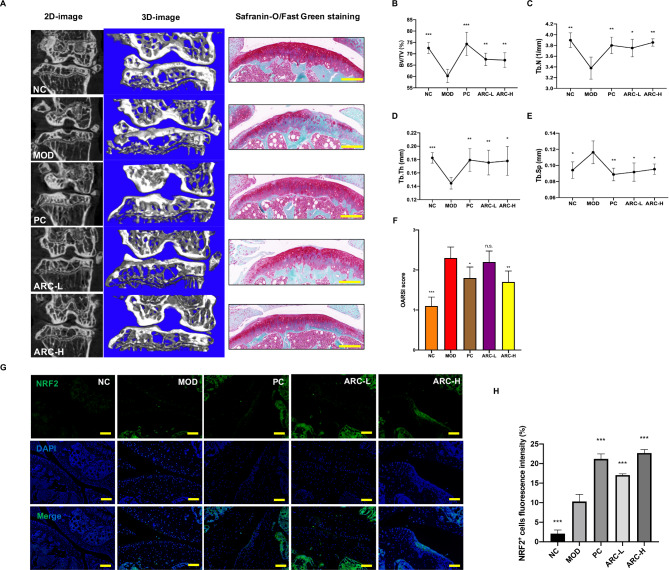
Reconstructed 3D images of the knee joints revealed a reduction in bone mass within the medial tibial plateau of the model group as compared to the NC group (Fig. 8A). Treatment of high dosage ARC can improve the bone volume (Fig. 8A). Specifically, the values of BV/TV, Tb.N, and Tb.Th had a significant decrease in the model group while various dosages of ARC could rescue them (Fig. 8B-D). Tb.Sp was significantly increased in the MOD group compared to the NC group (Fig. 8E). ARC significantly reduced bone trabecula separation (Fig. 8E). The medial tibia SBP thickness declined in the MOD group while restored by DFO and high dosage of ARC tends to increase SBP thickness (Supplementary Fig. 2).
Fig. 8.
ARC reduces the damage to the cartilage induced by iron overload. (A) Representative figures of 2D and 3D reconstruction micro-CT figures of knee joints and decalcified bone stained with Safranin-O/Fast Green (scale bar = 100 μm). Quantitative measurements of subchondral trabecular bone of tibia including BV/TV (B), Tb.N (C), Tb.Th (D) and Tb.Sp (E). (F) OARSI score of Safranin-O/Fast Green staining. (G) Representative figures of NRF2 positive cells in the knee joint (scale bar = 50 μm). (H) Quantitative analyses of NRF2 positive cells per field. (Data were presented as mean ± SD. n = 10 per group. Significant differences between the MOD and other groups were shown as n.s. (p-value > 0.05), * (p-value < 0.05), ** (p-value < 0.01), and *** (p-value < 0.001)).
To assess the potential effectiveness of ARC in mitigating the severity and progression of KOA induced by iron overload, the proteoglycan and structural degeneration of the articular cartilage were evaluated by Safranin O-fast green staining and OARSI score. The MOD group represented early OA-like manifestations including loss of proteoglycan content, and cartilage erosion, compared to the NC group (Fig. 8A). The ARC-L, and ARC-H groups exhibited a degree of proteoglycan retention, as well as reduced cartilage fibrillation and erosion (Fig. 8A). OARSI scores demonstrated that accumulated iron promoted cartilage degeneration but rescued by high dosage of ARC (Fig. 8F). According to immunofluorescence results, NRF2-positive areas of the knee joint were increased by various dosages of ARC (Fig. 8G-H).
Discussion
With the iron that includes Fe2+ and Fe3+accumulating in chondrocytes, the Fenton reaction was over-activated36. The reaction will produce excessive ROS and lipid-ROS and induce oxidative injury37. Accumulated evidence demonstrated that KOA was closely related to oxidative stress38. In our manuscript, we found that ARC has an inhibitory effect on intra-chondrocyte ROS and lipid-ROS induced by FAC. Further, ARC could decline oxidative stress damaging mitochondria. NRF2 was a widely recognized transcription factor that served a crucial role in maintaining redox homeostasis39. NRF2 was related to many kinds of pathological processes including apoptosis and ferroptosis40. With stimulation by excessive iron, NRF2, and HO-1 were activated in 24 h. After treatment of 40 µM ARC, NRF2 was rapidly activated in 12 h which means ARC plays a significant role in promoting NRF2. We found that HO-1 was not changed after being treated by 40 µM ARC for 12 h. This result might be due to ARC promoting HO-1 via activating NRF2. DFO could also increase NRF2 signaling and restore the inflammation level of chondrocytes41. In this study, DFO was selected as the positive control and ARC showed a consistent effect with DFO.
The scRNA-Seq analysis showed that the KOA process was correlated with chondrocyte ferroptosis and apoptosis, which was consistent with our in vitro study. The results of bioinformatics showed that the PI3K/AKT signaling pathway might be the key target of KOA. Martin et al. proved that AKT was the upstream regulator of NRF242. Mitsuishi et al. unveiled that NRF2 with active AKT phosphorylation was the key target to maintaining cell anabolic process43. Then we selected AKT antagonist MK2206 which was a highly potent and selective allosteric AKT inhibitor to test ARC. In our study, ARC played a role in activating NRF2 but MK2206 significantly antagonized the effect of ARC, which indicated that ARC targeted AKT to activate NRF2.
The subchondral bone volume decline was one of the indicators of KOA44. The mice model we built showed low subchondral bone volume which means the IO KOA model was well established. ARC reduced subchondral bone loss in a dose-dependent manner. In our previous study, we found that ARC could inhibit osteoclast differentiation. Safranin-O/Fast Green staining demonstrated that cartilage was lost and the OARSI score increased in the model group. ARC prevented cartilage degeneration in a dose-dependent manner. These results meant that ARC could influence chondrocytes and osteoclasts to alleviate the KOA process.
Some limitations of this study should be noted. The sc-RNA seq data was extracted from KOA patients and non-KOA individuals. Non-KOA individuals might be much younger than KOA patients and non-KOA individuals might have other diseases, which would become the interference factors. However, the results helped us to explore the mechanism of ARC. Secondly, FAC and ID had not been widely known as an oxidative stress incubator. Many studies have identified ID and FAC as causes of iron overload. Geng et al. used 200 μm FAC to establish iron overload in MC3T345. Yao et al. used 100 µM FAC to establish iron overload in chondrocyte46. Tsay et al. found that 100 mg/kg and 1000 mg/kg ID could induce iron overload in mice24. We observed significant change by Calcein-AM assay when we used 500 μm FAC. Then, 500 mg/kg ID was used in mice to ensure the model was established. Besides, we found the iron accumulation by Perl’s Prussian blue staining, which meant the model was well-established. Based on the previous studies and our results, we demonstrated that ID and FAC could be used to establish iron overload model.
Conclusion
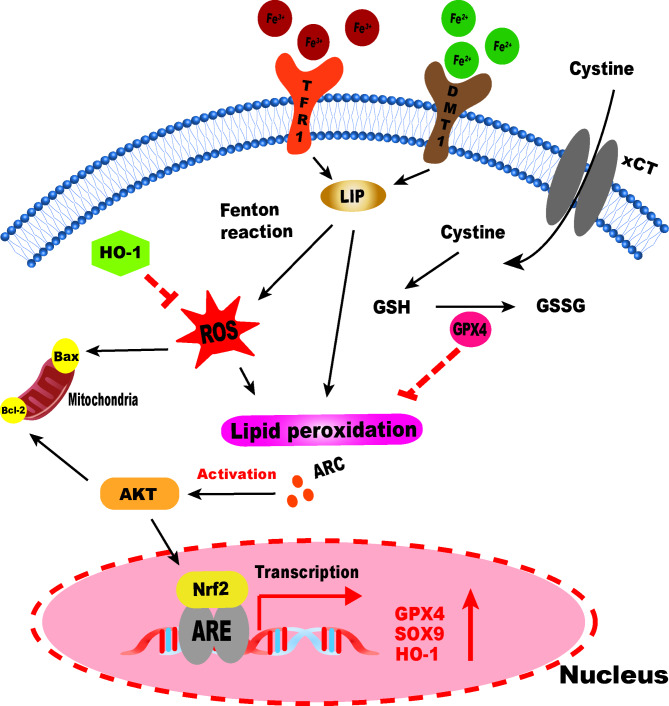
To sum up, we indicated that ARC plays a significant role in the KOA process. Our study demonstrated that ARC could inhibit chondrocytes oxidative stress induced by IO. Also, we found that ARC could inhibit oxidative stress related cell death including apoptosis and ferroptosis via the AKT/NRF2/HO-1 signaling pathway (Fig. 9). In the future, we would focus on the anti-oxidative effect of ARC and study further the mechanism of ARC on KOA.
Fig. 9.
A schematic diagram of ARC inhibiting ferroptosis of chondrocytes via AKT/NRF2/HO-1.
Electronic Supplementary Material
Below is the link to the electronic supplementary material.
Acknowledgements
We acknowledged Kanehisa laboratories for the permission to use the KEGG pathway database.
Abbreviations
- ARC
Arctiin
- BV/TV
bone volume/tissue volume
- CCK-8
Cell counting kit-8
- Calcein-AM
calcein-acetoxymethyl ester
- DCFH-DA
dichloro-dihydro-fluorescein diacetate
- DMM
destabilized medial meniscus
- DMEM/F12
Dulbecco’s Modified Eagle Medium: Nutrient Mixture F-12
- DFO
Deferoxamine
- ECM
extracellular matrix
- EDTA
Ethylenediaminetetraacetic acid
- FAC
ferric ammonium citrate
- FBS
fetal bovine serum
- GSH
glutathione
- ID
iron-dextrin
- IO
Iron overload
- KOA
knee osteoarthritis
- KEGG
Kyoto Encyclopedia of Genes and Genomes
- LIP
labile iron pool
- OARSI
Osteoarthritis Research Society International
- GSSG
oxidized glutathione
- PFA
paraformaldehyde
- P/S
penicillin/streptomycin
- ROS
reactive oxygen species
- scRNA-seq
Single-cell RNA sequencing
- SFM
serum-free medium
- SD
standard deviation
- TBST
Tris-buffered Saline Tween
- TCM
Traditional Chinese Medicine
- NC
the negative control group
- MOD
the model group
- PC
the positive control group
- ARC-L
the low dose group
- ARC-H
the high dose group
- Tb.N
trabecular number
- Tb.Sp
trabecular thickness
- Tb.Th
trabecular thickness
- VOI
volume of interest
- WB
Western Blotting
Author contributions
Z.T.A. and P.C. supervised the whole process. P.C. and H.B.W. acquired the funding. J.Z.Y., D.L.C. and Q.H. wrote the main manuscript text. J.Z.Y. and D.L.C. prepared Figs. 1, 2 and 3. Q.H. and B.H.C. prepared Fig. 4. Z.F.P. and G.Y.Z. prepared Fig. 5. M.L. and S.C.L prepared Fig. 6. J.Z.Y. and D.L.C. prepared Figs. 7, 8 and 9. All authors reviewed the manuscript.
Funding
This research was supported by National Natural Science Foundation of China (NO. 82074462; 82374470), Major research project of Guangzhou University of Chinese Medicine (No. 2021xk53).
Data availability
The datasets extracted and analyzed during the current study are available in the GSE220243 dataset from GEO repository, https://www.ncbi.nlm.nih.gov/geo/query/acc.cgi?acc=GSE220243.
Declarations
Consent for publication
Written informed consent for publication was obtained from all participants.
Competing interests
The authors declare no competing interests.
Institutional Review Board Statement
All animal experiments were approved by the Review Board of The First Affiliated Hospital of Guangzhou University of Chinese Medicine (Ethic NO. TCMF1-2021029).
Footnotes
Publisher’s note
Springer Nature remains neutral with regard to jurisdictional claims in published maps and institutional affiliations.
Junzheng Yang, Delong Chen and Qi He contributed equally.
Contributor Information
Haibin Wang, Email: hipknee@163.com.
Peng Chen, Email: docchen777@gmail.com.
Zhantian An, Email: anzhantian1111@163.com.
References
- 1.Hunter, D. J., Bierma-Zeinstra, S. & Osteoarthritis Lancet393, 1745–1759, doi:10.1016/s0140-6736(19)30417-9 (2019). [DOI] [PubMed] [Google Scholar]
- 2.Brandt, K. D., Radin, E. L., Dieppe, P. A. & van de Putte, L. Yet more evidence that osteoarthritis is not a cartilage disease. Ann. Rheum. Dis.65, 1261–1264. 10.1136/ard.2006.058347 (2006). [DOI] [PMC free article] [PubMed] [Google Scholar]
- 3.Morales-Ivorra, I., Romera-Baures, M., Roman-Viñas, B. & Serra-Majem, L. Osteoarthritis and the Mediterranean Diet: A Systematic Review. Nutrients1010.3390/nu10081030 (2018). [DOI] [PMC free article] [PubMed]
- 4.Xu, J. et al. The emerging role of iron dyshomeostasis in the mitochondrial decay of aging. Mech. Ageing Dev.131, 487–493. 10.1016/j.mad.2010.04.007 (2010). [DOI] [PMC free article] [PubMed] [Google Scholar]
- 5.Zhang, H. et al. Hepcidin-induced reduction in iron content and PGC-1β expression negatively regulates osteoclast differentiation to play a protective role in postmenopausal osteoporosis. Aging (Albany NY). 13, 11296–11314. 10.18632/aging.202817 (2021). [DOI] [PMC free article] [PubMed] [Google Scholar]
- 6.Burton, L. H., Radakovich, L. B., Marolf, A. J. & Santangelo, K. S. Systemic iron overload exacerbates osteoarthritis in the strain 13 guinea pig. Osteoarthr. Cartil.28, 1265–1275. 10.1016/j.joca.2020.06.005 (2020). [DOI] [PMC free article] [PubMed] [Google Scholar]
- 7.Karim, A. et al. Iron Overload Induces Oxidative Stress, Cell Cycle Arrest and Apoptosis in Chondrocytes. Front. Cell. Dev. Biol.10, 821014. 10.3389/fcell.2022.821014 (2022). [DOI] [PMC free article] [PubMed] [Google Scholar]
- 8.Poprac, P. et al. Targeting Free Radicals in Oxidative Stress-Related Human Diseases. Trends Pharmacol. Sci.38, 592–607. 10.1016/j.tips.2017.04.005 (2017). [DOI] [PubMed] [Google Scholar]
- 9.Dixon, S. J. et al. Ferroptosis: an iron-dependent form of nonapoptotic cell death. Cell149, 1060–1072. 10.1016/j.cell.2012.03.042 (2012). [DOI] [PMC free article] [PubMed] [Google Scholar]
- 10.Wang, H., Liu, C., Zhao, Y. & Gao, G. Mitochondria regulation in ferroptosis. Eur. J. Cell. Biol.99, 151058. 10.1016/j.ejcb.2019.151058 (2020). [DOI] [PubMed] [Google Scholar]
- 11.Fu, C. et al. Rehmannioside A improves cognitive impairment and alleviates ferroptosis via activating PI3K/AKT/Nrf2 and SLC7A11/GPX4 signaling pathway after ischemia. J. Ethnopharmacol.289, 115021. 10.1016/j.jep.2022.115021 (2022). [DOI] [PubMed] [Google Scholar]
- 12.Dodson, M., Castro-Portuguez, R. & Zhang, D. D. NRF2 plays a critical role in mitigating lipid peroxidation and ferroptosis. Redox Biol.23, 101107. 10.1016/j.redox.2019.101107 (2019). [DOI] [PMC free article] [PubMed] [Google Scholar]
- 13.Dragos, D. et al. Phytomedicine in Joint Disorders. Nutrients910.3390/nu9010070 (2017). [DOI] [PMC free article] [PubMed]
- 14.Hyam, S. R. et al. Arctigenin ameliorates inflammation in vitro and in vivo by inhibiting the PI3K/AKT pathway and polarizing M1 macrophages to M2-like macrophages. Eur. J. Pharmacol.708, 21–29. 10.1016/j.ejphar.2013.01.014 (2013). [DOI] [PubMed] [Google Scholar]
- 15.Gao, Q., Yang, M. & Zuo, Z. Overview of the anti-inflammatory effects, pharmacokinetic properties and clinical efficacies of arctigenin and arctiin from Arctium lappa L. Acta Pharmacol. Sin. 39, 787–801. 10.1038/aps.2018.32 (2018). [DOI] [PMC free article] [PubMed] [Google Scholar]
- 16.Chen, D. et al. Arctiin abrogates osteoclastogenesis and bone resorption via suppressing RANKL-induced ROS and NFATc1 activation. Pharmacol. Res.159, 104944. 10.1016/j.phrs.2020.104944 (2020). [DOI] [PubMed] [Google Scholar]
- 17.Satija, R., Farrell, J. A., Gennert, D., Schier, A. F. & Regev, A. Spatial reconstruction of single-cell gene expression data. Nat. Biotechnol.33, 495–502. 10.1038/nbt.3192 (2015). [DOI] [PMC free article] [PubMed] [Google Scholar]
- 18.Muhammad, S. A. et al. Optimization of Protocol for Isolation of Chondrocytes from Human Articular Cartilage. Cartilage13, 872s–884s. 10.1177/1947603519876333 (2021). [DOI] [PMC free article] [PubMed] [Google Scholar]
- 19.Gosset, M., Berenbaum, F., Thirion, S. & Jacques, C. Primary culture and phenotyping of murine chondrocytes. Nat. Protoc.3, 1253–1260. 10.1038/nprot.2008.95 (2008). [DOI] [PubMed] [Google Scholar]
- 20.Lakshmanan, I. & Batra, S. K. Protocol for Apoptosis Assay by Flow Cytometry Using Annexin V Staining Method. Bio Protoc.310.21769/bioprotoc.374 (2013). [DOI] [PMC free article] [PubMed]
- 21.Tenopoulou, M., Kurz, T., Doulias, P. T., Galaris, D. & Brunk, U. T. Does the calcein-AM method assay the total cellular ‘labile iron pool’ or only a fraction of it? Biochem. J.403, 261–266. 10.1042/bj20061840 (2007). [DOI] [PMC free article] [PubMed] [Google Scholar]
- 22.Tsai, J. R. et al. Magnolol induces apoptosis via caspase-independent pathways in non-small cell lung cancer cells. Arch. Pharm. Res.37, 548–557. 10.1007/s12272-013-0232-1 (2014). [DOI] [PubMed] [Google Scholar]
- 23.Percie du Sert. The ARRIVE guidelines 2.0: Updated guidelines for reporting animal research. PLoS Biol.18, e3000410. 10.1371/journal.pbio.3000410 (2020). [DOI] [PMC free article] [PubMed] [Google Scholar]
- 24.Tsay, J. et al. Bone loss caused by iron overload in a murine model: importance of oxidative stress. Blood116, 2582–2589. 10.1182/blood-2009-12-260083 (2010). [DOI] [PMC free article] [PubMed] [Google Scholar]
- 25.Ma, H. L. et al. Osteoarthritis severity is sex dependent in a surgical mouse model. Osteoarthr. Cartil.15, 695–700. 10.1016/j.joca.2006.11.005 (2007). [DOI] [PubMed] [Google Scholar]
- 26.Perilli, E. et al. Detecting early bone changes using in vivo micro-CT in ovariectomized, zoledronic acid-treated, and sham-operated rats. Osteoporos. Int.21, 1371–1382. 10.1007/s00198-009-1082-z (2010). [DOI] [PubMed] [Google Scholar]
- 27.Buie, H. R., Campbell, G. M., Klinck, R. J., MacNeil, J. A. & Boyd, S. K. Automatic segmentation of cortical and trabecular compartments based on a dual threshold technique for in vivo micro-CT bone analysis. Bone41, 505–515. 10.1016/j.bone.2007.07.007 (2007). [DOI] [PubMed] [Google Scholar]
- 28.Jia, H. et al. Loading-Induced Reduction in Sclerostin as a Mechanism of Subchondral Bone Plate Sclerosis in Mouse Knee Joints During Late-Stage Osteoarthritis. Arthritis Rheumatol.70, 230–241. 10.1002/art.40351 (2018). [DOI] [PMC free article] [PubMed] [Google Scholar]
- 29.Tamagaki, K. et al. Severe hyperparathyroidism with bone abnormalities and metastatic calcification in rats with adenine-induced uraemia. Nephrol. dialysis transplantation: official publication Eur. Dialysis Transpl. Association - Eur. Ren. Association. 21, 651–659. 10.1093/ndt/gfi273 (2006). [DOI] [PubMed] [Google Scholar]
- 30.Schmitz, N., Laverty, S., Kraus, V. B. & Aigner, T. Basic methods in histopathology of joint tissues. Osteoarthr. Cartil.18 (Suppl 3), 113–116. 10.1016/j.joca.2010.05.026 (2010). [DOI] [PubMed] [Google Scholar]
- 31.Jing, X. et al. Iron Overload Is Associated With Accelerated Progression of Osteoarthritis: The Role of DMT1 Mediated Iron Homeostasis. Front. Cell. Dev. Biol.8, 594509. 10.3389/fcell.2020.594509 (2020). [DOI] [PMC free article] [PubMed] [Google Scholar]
- 32.Glasson, S. S., Chambers, M. G., Van Den Berg, W. B. & Little, C. B. The OARSI histopathology initiative - recommendations for histological assessments of osteoarthritis in the mouse. Osteoarthr. Cartil.18 (Suppl 3), 17–23. 10.1016/j.joca.2010.05.025 (2010). [DOI] [PubMed] [Google Scholar]
- 33.Swahn, H. et al. Senescent cell population with ZEB1 transcription factor as its main regulator promotes osteoarthritis in cartilage and meniscus. Ann. Rheum. Dis.82, 403–415. 10.1136/ard-2022-223227 (2023). [DOI] [PMC free article] [PubMed] [Google Scholar]
- 34.Kanehisa, M. & Goto, S. KEGG: kyoto encyclopedia of genes and genomes. Nucleic Acids Res.28, 27–30. 10.1093/nar/28.1.27 (2000). [DOI] [PMC free article] [PubMed] [Google Scholar]
- 35.Kanehisa, M., Furumichi, M., Sato, Y., Kawashima, M. & Ishiguro-Watanabe, M. KEGG for taxonomy-based analysis of pathways and genomes. Nucleic Acids Res.51, D587–d592. 10.1093/nar/gkac963 (2023). [DOI] [PMC free article] [PubMed] [Google Scholar]
- 36.Scindia Ph, D. Y., Md, L., Swaminathan Md, S. & J. & Iron Homeostasis in Healthy Kidney and its Role in Acute Kidney Injury. Semin Nephrol.39, 76–84. 10.1016/j.semnephrol.2018.10.006 (2019). [DOI] [PubMed] [Google Scholar]
- 37.Brookes, M. J. et al. Modulation of iron transport proteins in human colorectal carcinogenesis. Gut55, 1449–1460. 10.1136/gut.2006.094060 (2006). [DOI] [PMC free article] [PubMed] [Google Scholar]
- 38.Wang, F. S. et al. Irisin Mitigates Oxidative Stress, Chondrocyte Dysfunction and Osteoarthritis Development through Regulating Mitochondrial Integrity and Autophagy. Antioxid. (Basel). 910.3390/antiox9090810 (2020). [DOI] [PMC free article] [PubMed]
- 39.Yamamoto, M., Kensler, T. W. & Motohashi, H. The KEAP1-NRF2 System: a Thiol-Based Sensor-Effector Apparatus for Maintaining Redox Homeostasis. Physiol. Rev.98, 1169–1203. 10.1152/physrev.00023.2017 (2018). [DOI] [PMC free article] [PubMed] [Google Scholar]
- 40.Dodson, M. et al. Modulating NRF2 in Disease: Timing Is Everything. Annu. Rev. Pharmacol. Toxicol.59, 555–575. 10.1146/annurev-pharmtox-010818-021856 (2019). [DOI] [PMC free article] [PubMed] [Google Scholar]
- 41.Guo, Z. et al. Deferoxamine Alleviates Osteoarthritis by Inhibiting Chondrocyte Ferroptosis and Activating the Nrf2 Pathway. Front. Pharmacol.13, 791376. 10.3389/fphar.2022.791376 (2022). [DOI] [PMC free article] [PubMed] [Google Scholar]
- 42.Martin, D. et al. Regulation of heme oxygenase-1 expression through the phosphatidylinositol 3-kinase/Akt pathway and the Nrf2 transcription factor in response to the antioxidant phytochemical carnosol. J. Biol. Chem.279, 8919–8929. 10.1074/jbc.M309660200 (2004). [DOI] [PubMed] [Google Scholar]
- 43.Mitsuishi, Y. et al. Nrf2 redirects glucose and glutamine into anabolic pathways in metabolic reprogramming. Cancer Cell.22, 66–79. 10.1016/j.ccr.2012.05.016 (2012). [DOI] [PubMed] [Google Scholar]
- 44.Hu, W., Chen, Y., Dou, C. & Dong, S. Microenvironment in subchondral bone: predominant regulator for the treatment of osteoarthritis. Ann. Rheum. Dis.80, 413–422. 10.1136/annrheumdis-2020-218089 (2021). [DOI] [PMC free article] [PubMed] [Google Scholar]
- 45.Xia, Y. et al. REPIN1 regulates iron metabolism and osteoblast apoptosis in osteoporosis. Cell. Death Dis.14, 631. 10.1038/s41419-023-06160-w (2023). [DOI] [PMC free article] [PubMed] [Google Scholar]
- 46.Yao, X. et al. Chondrocyte ferroptosis contribute to the progression of osteoarthritis. J. Orthop. Translat. 27, 33–43. 10.1016/j.jot.2020.09.006 (2021). [DOI] [PMC free article] [PubMed] [Google Scholar]
Associated Data
This section collects any data citations, data availability statements, or supplementary materials included in this article.
Supplementary Materials
Data Availability Statement
The datasets extracted and analyzed during the current study are available in the GSE220243 dataset from GEO repository, https://www.ncbi.nlm.nih.gov/geo/query/acc.cgi?acc=GSE220243.


