Abstract
Phosphogypsum is the main industrial solid waste from wet process phosphoric acid production, which has significant potential for environmental sustainability and engineering applications when modified. In order to explore the mechanical properties of modified phosphogypsum (MG) in different loading environments, uniaxial compression tests were conducted at four loading rates: 0.03, 0.06, 0.12, and 0.6 mm/min. The test results show that MG undergoes creeping at the loading rate of 0.03 mm/min, quasi-static loading at 0.12 to 0.6 mm/min, and transition between the two states at 0.06 mm/min. As the loading rate increases, the crack initiation stress  , damage stress
  , and peak strength
  gradually increase, but the increasing amplitude gradually decreases. Under quasi-static loading at 0.12 to 0.6 mm/min,
  and
and  show no significant changes and remain at 0.52 and 0.81, respectively, close to the values of rock materials. As the loading rate increases from creep loading to quasi-static loading, the elastic strain energy increases slowly and steadily, while the total strain energy and dissipative strain energy decrease first and then increase slowly. With the axial stress increasing from 0 to 0.81
 , the principal strain field changes from relatively uniform to a concentration band, which has a very steep angle with the horizontal direction. The research results provide an important theoretical basis for the engineering application of MG as building materials.
Keywords: Modified phosphogypsum, Loading rate, Uniaxial compression, Stress threshold, Energy characteristics
Subject terms: Civil engineering, Structural materials
Introduction
Since industrialized phosphate ore mining in the 19th century, leaching phosphate ore with sulfuric acid has been the most widely used method of phosphoric acid production (wet process phosphoric acid production), and gypsum has been a bulk industrial solid waste discharged from that process1. Statistics show that about 4.5 to 5 t of phosphogypsum is produced per ton of phosphoric acid produced2. As of 2020, the worldwide annual phosphogypsum production has reached about 280 million tons, and about 7 billion tons have accumulated3. Among them, the annual phosphogypsum production in China has reached about 80 million tons, and about 820 million tons have accumulated4. Due to its complex composition and numerous impurities, phosphogypsum utilization is difficult with a low comprehensive utilization rate, and the main treatment method remains open-air stockpiling5. Stockpiled phosphogypsum occupies large tracts of land and harbors soluble phosphorus, soluble fluorine, radioactive elements, trace heavy metals, and other soluble substances6–9, which are often carried away by rainfall, wind, and seepage flow and severely pollute local soil, air, and water, causing incalculable environmental pollution to the local area10–13. Meanwhile, these harmful substances also limit phosphogypsum development and application in various fields14. Therefore, comprehensively treating phosphogypsum pollution and developing new utilizations as a resource is particularly important.
At present, phosphogypsum has been utilized in agriculture, chemistry, ecological and environmental sciences, and building materials. In agriculture, phosphogypsum can be a chemical modifier to mitigate soil degradation and improve soil fertility after neutralizing and removing impurities15. However, the actual phosphogypsum utilization rate is low. In chemistry, preparing ammonium sulfate and potassium sulfate with phosphogypsum waste is now one of the feasible ways to obtain valuable raw materials16,17. Yet, the actual benefits are unsatisfactory due to the high cost and low return. In ecological and environmental sciences, phosphogypsum is widely used as an adsorbent for CO2 sequestration by mineral carbonization and heavy metal removal from wastewater due to its fast carbonization rate, high reactivity, and strong adsorption capacity18–21. Nevertheless, its utilization rate is also low, and the used phosphogypsum adsorbent causes new pollution. In terms of building materials, phosphogypsum, after impurity removal and modification, can replace natural gypsum in construction materials, such as cement, wall panels, highway substrate and pavement materials, plasterboard, foam tiles, and glass ceramics, which can effectively improve the phosphogypsum utilization rate22–25. Phosphogypsum is more readily available and cost-effective than natural gypsum. Therefore, using modified phosphogypsum (MG) after impurity removal and modification in building materials will be the main method in the future, and further research is urgently needed to advance phosphogypsum applications in building materials.
In this regard, Dutt et al.26 conducted uniaxial and undrained triaxial tests on MG under three different curing conditions. The results indicated that the strength, deviatoric stress, tangent modulus, cohesion, and internal friction angle of the material increased with curing time. Xiao et al.27 studied the physical and mechanical properties of MG, including particle size distribution, thermogravimetric analysis, and unconfined compressive strength. Hu et al.28 investigated the water-cement ratio, silica fume dosage, cement dosage, and the hemihydrate phosphogypsum to primary phosphogypsum ratio through a single-factor experimental design. They prepared a new type of phosphogypsum-based concrete that meets the C30 compressive strength grade requirements, achieving a compressive strength of 45.1 MPa after 28 days of curing. Wu et al.29 revealed the influence mechanism of different height-thickness ratios and eccentricities on the failure characteristics and bearing capacity of MG and proposed its bearing capacity calculation method.
Most of the above studies focused on analyzing the deformation and strength characteristics of MG with different mixing ratios. However, as a brittle material similar to concrete and rock, little research has been conducted on the relationship between MG and loading rate. Based on the progressive fracture theory in rock mechanics, this study performs uniaxial compression tests on MG specimens to explore their elastic modulus, stress threshold, and energy characteristics under different loading rates. The findings are of great significance for MG applications in different engineering scenarios.
Test protocol
Specimen mixing and preparation
The waste phosphogypsum from wet process phosphoric acid production is mainly dihydrate phosphogypsum (CaSO4·2H2O), which can be transformed into hemihydrate phosphogypsum (CaSO4·0.5H2O) through high-temperature calcination and dehydration30,31. Chen et al.32 found that the soluble phosphorus in phosphogypsum had the greatest impact on its performance, which could prolong its coagulation, loosen its structure, and reduce its strength. Modifying phosphogypsum by neutralization with quicklime can effectively enhance its strength. According to existing literature26–29, the hemihydrate phosphogypsum was neutralized using quicklime, and the specimens were mixed and poured using hemihydrate phosphogypsum, quicklime, melamine-based water reducer, and water. The specific mixing scheme is shown in Table 1. Since this study adopted the theories and methods in rock mechanics, the uniaxial compression test specimen should be a standard cylinder with a diameter of 50 mm and a height of 100 mm, according to the recommendations of the International Society for Rock Mechanics(ISRM)33.
Table 1.
MG specimen mixing ratio.
| Composition | Hemihydrate phosphogypsum (%) |
Quicklime (%) |
Melamine-based water reducer (%) |
Water (%) |
|---|---|---|---|---|
| Content percentage | 97 | 3 | 1 | 29.1 |
Currently there is limited research on the mechanical properties of MG, and there are almost no normative standards available for reference. In this research MG is mainly applied in engineering materials, so the curing methods are set according to the Standard for Test Methods of Concrete Physical and Mechanical Properties (GB/T 50081 − 2019)34, with curing ages of 1d, 3d, 7d, 28d, 56d or 60d, and ≥ 84d. According to the requirements of Code for Design of Concrete Structures (GB 50010 − 2010)35, under 28-day curing conditions, the standard value and design value of C60 concrete reached 38.5 MPa and 27.5 MPa, respectively, which are comparable to the strength of MG specimens. Based on this, the curing time for MG is determined to be 28d.
Experimental studies on the compressive strength of MG under two curing conditions were conducted: Standard Curing at 20 ± 2℃ with relative humidity above 95%, and Natural Curing at an average daily temperature of 20℃ with 40–50% humidity. Specimens were tested at 3, 7, 14, and 28 days. when the curing time exceeds 14 days, the peak strength of MG specimens under natural curing conditions is higher than that under standard curing conditions. This may be because MG is an air-hardening material. In the early stages of curing, a moist environment can stimulate the reactivity of the materials within MG, thereby increasing the hydration reaction rate and progress of the specimens. In the later stages of curing, the increase in strength of MG mainly relies on moisture evaporation; excessive humidity in the curing environment can hinder the evaporation of internal moisture to some extent. Additionally, in a humid environment, the dissolution of these contact points can result in a reduction in structural strength.
Based on the reasons mentioned above, MG specimens are cured for 28 days under natural room temperature conditions.
The specimen preparation process is as follows:
The required amount of each material is calculated and weighed according to the MG specimen material mixing scheme in Table 1, as shown in Fig. 1a.
The specimen mold is assembled, with its inner walls wiped with a small amount of boiled oil and its outer walls reinforced with adhesive tape, as shown in Fig. 1b.
The hemihydrate phosphogypsum is thoroughly mixed with quicklime, and the melamine-based water reducer and water are added while stirring until a viscous slurry mixture is obtained, which is poured into the mold shown in Fig. 1b, as shown in Fig. 1c.
The cast MG specimens are cured in a cool and dry place for three days before removing the mold, as shown in Fig. 1d. To ensure the strength, the specimens in Fig. 1d are stored in a cool and dry place for 28 days for air drying and curing.
Fig. 1.
MG specimen preparation process: (a) Specimen raw materials; (b) Specimen mold; (c) Specimen pouring; (d) Finished specimen.
Test equipment
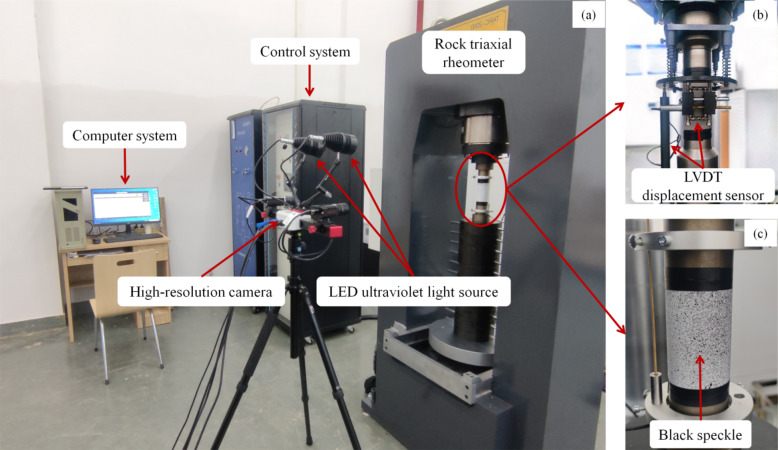
The test system in this study comprised a loading device and a DIC measuring device (Fig. 2a). The loading device was a TARC-2000 rock triaxial rheometer with a load stiffness of up to 10 GN/m, which can provide a maximum axial pressure of 2000 kN, a maximum confining pressure of 70 MPa, and a maximum temperature of 150 °C. Linear Variable Differential Transformer (LVDT) displacement sensors were used to record the axial and radial deformation (Fig. 2b), with a displacement resolution of 0.001 mm and a sampling interval of 0.05 s. The computer recorded the monitoring data in real time during the test and plotted stress-strain curves simultaneously. The DIC measurement device was an RDIC-3D full-field quasi-static strain measurement system, including high-resolution cameras, LED ultraviolet light sources, synchronous triggers, and measurement software. The device acquired data synchronously using two cameras, with a displacement measurement accuracy of 0.01 pixels and a strain measurement accuracy of 20  .
.
Fig. 2.
Test system: (a) Loading device and DIC measuring device; (b) LVDT displacement sensors; (c) Spraying speckle.
Test steps
To ensure that the end surfaces of the MG specimens were smooth and under axial compression, the circular end surfaces were polished before the test. Deformation control was adopted as the loading method for the uniaxial compression test, and 4 loading rates were designed, namely, 0.03 mm/min, 0.06 mm/min, 0.12 mm/min, and 0.6 mm/min. Under each loading rate, 3 MG specimens were tested with displacement sensors to record axial and radial strain for stress threshold measurement and calculation. In addition, the surface of one specimen under the 0.03 mm/min loading rate was sprayed with black speckles (Fig. 2c) to observe the progressive deformation and strain fields using DIC technology.
Test result analysis
Stress-strain curve characteristics
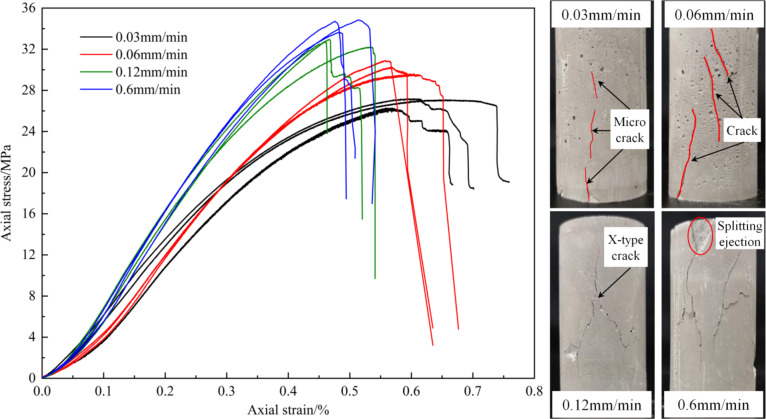
As shown in Fig. 3, the specimen shows obvious creep characteristics at the loading rate of 0.03 mm/min. The straight line section of the stress-strain curve has a slow slope, followed by an obvious and extended plastic yield section with minimal stress changes. The creep strain upon failure is large, and the peak strength is low (about 26 MPa). The fractured specimens showed only small cracks that were difficult to identify, with no clear large cracks. At the loading rates of 0.06 and 0.12 mm/min, the creep characteristics of the specimens gradually disappear, and the straight section of the stress-strain curve shows significant slope increases. Meanwhile, the corresponding strain upon failure decreases while the peak strength increases. After specimen failure, the number and opening of cracks increase significantly, and X-type conjugate cracks appear. At the loading rate of 0.6 mm/min, the straight section of the stress-strain curve shows a further increased slope, and the peak strength shows greater increases. The cracks after failure almost penetrate the specimen and are accompanied by local splitting ejection failure.
Fig. 3.
Stress-strain curves and failure characteristics of MG at different loading rates.
The elastic modulus of the MG is calculated based on the elastic stage of the stress-strain curve, and the results are shown in Fig. 4. As the loading rate increases from 0.03 mm/min to 0.12 mm/min, the average elastic modulus of the MG specimen shows a significant linear increase of 36%. With the loading rate increasing from 0.12 mm/min to 0.6 mm/min, the elastic modulus increases minimally by only 3%. The reason is as follows. At low loading rates, the MG specimen has more time for microcrack expansion and stress redistribution, allowing internal damage and cracks to fully develop during loading, resulting in a lower elastic modulus and peak strength. In contrast, the loading duration is shorter at high loading rates, leading to insufficient development of internal microcracks. As a result, the specimen exhibits greater toughness and brittleness under instantaneous loading, which leads to a higher elastic modulus and peak strength.
Fig. 4.
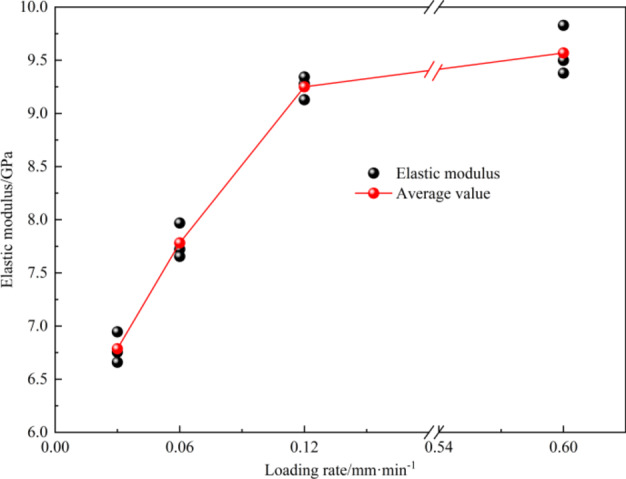
Elastic modulus of MG at different loading rates.
Stress threshold determination method
Martin36 proposed the progressive fracture theory of rock, in which the four stress thresholds, namely, closure stress  , crack initiation stress
  , damage stress
  , and peak strength
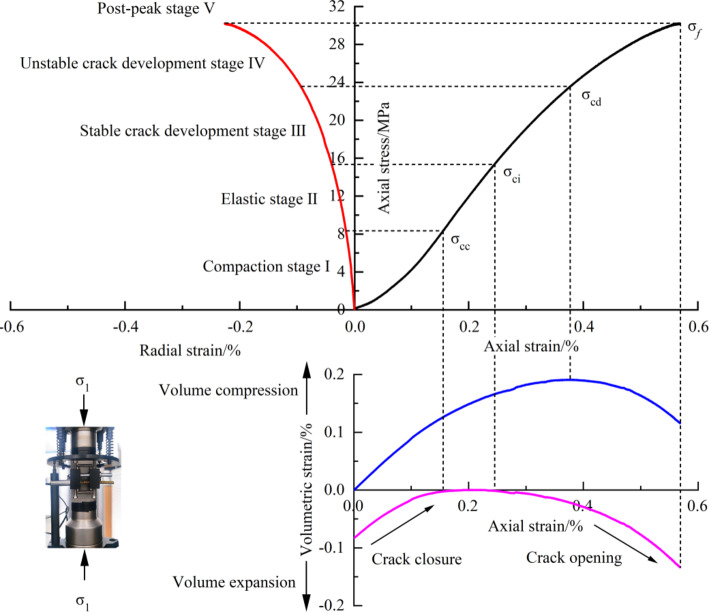
  , divide the deformation and failure of rock under compression into five stages. The stress threshold can help effectively analyze the macro-mechanical characteristics and study the evolution of microscopic cracks, thus revealing the progressive failure characteristics of rock-like materials. This method is used to determine the stress threshold of MG under uniaxial compression conditions. Figure 5 shows a typical stress-strain curve of MG at the uniaxial compression loading rate of 0.06 mm/min, where the stress threshold and the deformation failure stage of MG can be clearly distinguished. The specimen is in the compacting stage (I) at initial loading, during which the internal pores and defects are gradually compressed, the crack volume strain gradually decreases and approaches 0, and the stress threshold is the closure stress
 . After the elastic stage (II), the crack volume strain of the specimen is 0. Once the absolute crack volume strain exceeds 0, the cracks initiate, and the stress corresponding to the crack initiation point is the crack initiation stress
  . At this time, the specimen deformation has entered the stable crack development stage (III).
  can be determined using the crack volume strain-axial stress strain curve.
Fig. 5.
MG uniaxial compression stress-strain curve and stress threshold.
Axial strain and radial strain are recorded using the LVDT sensors during the test, and the volume strain is36:
 |
1 |
where  is the volumetric strain,
  is the axial strain, and
  is the radial strain.
According to the elastic modulus E and Poisson’s ratio ν obtained in the elastic stage, the elastic volume strain during loading is calculated as follows36:
 |
2 |
The crack volume strain of the specimen is the difference between the volume strain and the elastic volume strain of the rock36, that is:
 |
3 |
The stress corresponding to the inflection point of the stress-volume strain curve is the damage stress  , indicating the volume expansion of the specimen. From this moment, the specimen deformation enters into the unstable crack development stage (IV), where a large number of unstable cracks intersect continuously. As the stress reaches the peak strength
  , the specimen fails. At this time, the axial stress-strain curve shows a rapid drop, and the specimen deformation and failure enter the post-peak stage (V).
Effect of loading rate on stress threshold
As shown in Fig. 6,  shows no significant sensitivity to the increased loading rate due to its small value. In contrast, as the loading rate increases from 0.03 to 0.6 mm/min,
  ,
,  , and
, and  increase from 14.67 to 17.26 MPa (an 18% increase), from 21.17 to 28.77 MPa (39%), and from 26.83 to 34.39 MPa (28%), respectively. The reason is as follows. At high loading rates, the shorter loading duration results in insufficient development of internal microcracks. Consequently, the specimen demonstrates increased toughness and brittleness during instantaneous loading, resulting in a higher
  .
.  and
and  also rise with the increase in
  . Considering the stress-strain curve shape at each loading rate in Fig. 3, MG undergoes creeping at the loading rate of 0.03 mm/min (strain rate
  = 5 × 10− 6), quasi-static loading at 0.12 to 0.6 mm/min (
 = 2 × 10⁻⁵ to 1 × 10⁻⁴), and transition between the two states at the loading rate of 0.06 mm/min (
 = 1 × 10⁻⁵). Regardless of the loading rate,
  ,
,  , and
, and  have a significant linear relationship with
  (Fig. 7).
Fig. 6.
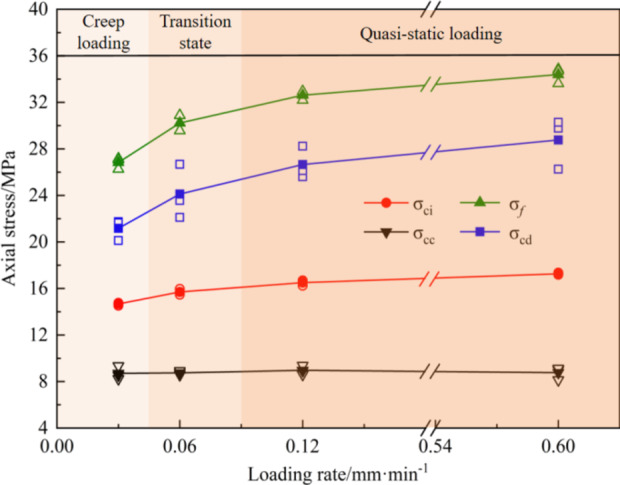
Stress thresholds at different loading rates.
Fig. 7.
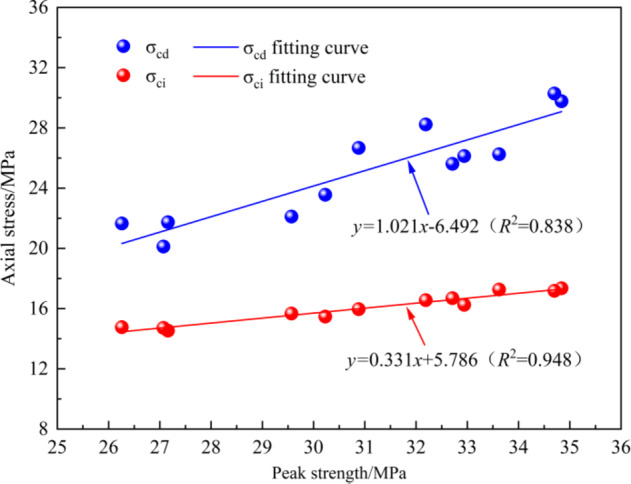
Relationship between stress threshold and peak strength.
Figure 8 shows the ratio of each stress threshold to the peak strength at different loading rates. According to the above analysis, 0.03 mm/min is the loading rate at which the MG undergoes creeping, while 0.12 to 0.6 mm/min is the quasi-static loading rate. Therefore, the ratio of each stress threshold to the peak strength changes significantly with the increase of the strain rate at the loading rate of 0.03 to 0.06 mm/min. This ratio shows no significant change at the loading rate of 0.12 to 0.6 mm/min, and  ,
,  , and
, and  remain at 0.29, 0.52, and 0.81, respectively.
Fig. 8.
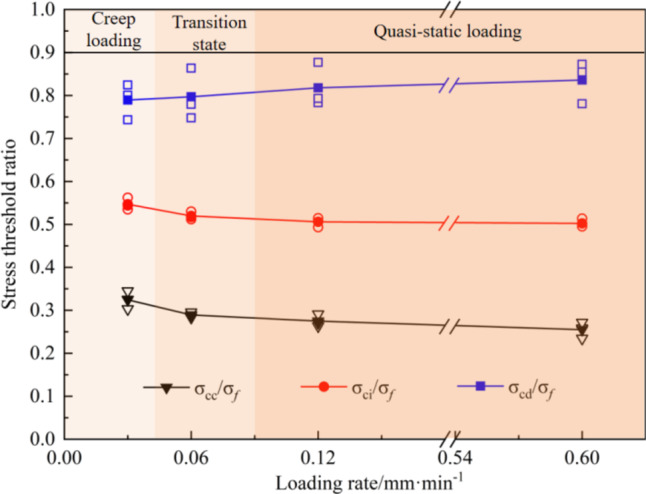
Stress threshold ratios at different loading rates.
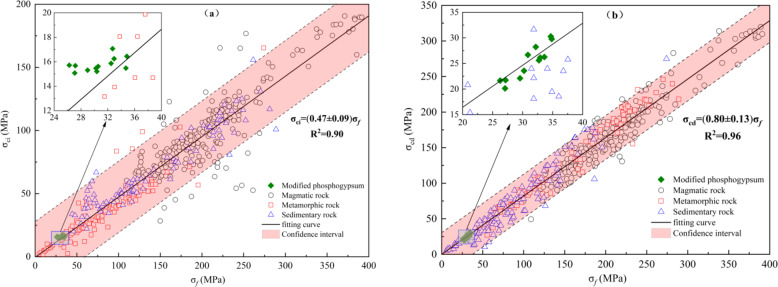
Since MG is a typical rock-like brittle material, the test results of various types of rocks in the literature37 were selected for fitting analysis to compare with the stress threshold ratio of rocks. As shown in Fig. 9, regardless of the rock type and the magnitude of  ,
,  and
and  are concentrated in a narrow range (the dashed line indicates a 95% confidence interval). Under uniaxial compression conditions,
  is approximately 0.47, and
  is approximately 0.8, very close to the results of MG in Fig. 8.
Fig. 9.
Stress threshold ratios of MG and various types of rocks: (a)  ; (b)
; (b) .
.
Energy characteristics
The failure of rock materials is accompanied by energy input, accumulation, dissipation, and release. Assuming that the test process is a closed system with no thermal exchange with the outside world, the work done by the outside world is the total strain energy U generated by the axial stress of the uniaxial compression test according to the first law of thermodynamics38. Then,
 |
4 |
where Ud is the dissipative strain energy, and Ue is the elastic strain energy.
Figure 10 shows the relationship between the dissipative strain energy Ud and the elastic strain energy Ue in the stress-strain curve under uniaxial compression38. The area enclosed by the stress-strain curve before the peak strength and the unloading elastic modulus Eu is the dissipative strain energy Ud, and the area enclosed by the straight line connecting the peak strength and the peak strain and the unloading elastic modulus Eu is the elastic strain energy Ue. Dissipative strain energy is the energy dissipated by the internal damage and plastic deformation of the rock during loading, while elastic strain energy is the energy stored in the rock undergoing elastic deformation during loading.
Fig. 10.
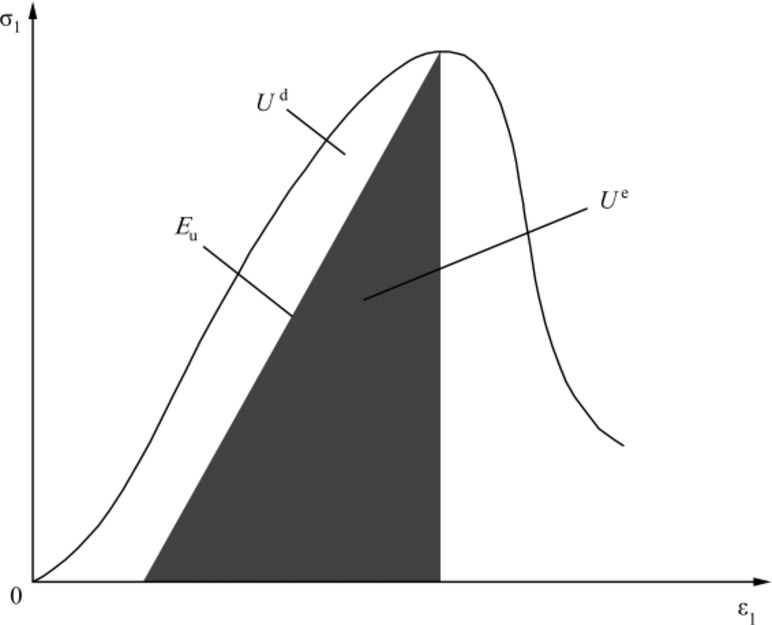
Relationship between dissipative strain energy Ud and elastic strain energy Ue in the stress-strain curve38.
According to Kong et al.39, the total strain energy of the rock in the three-direction stress state can be expressed as:
 |
5 |
where  are the maximum principal stress, intermediate principal stress, and minimum principal stress of the rock material, respectively, and
  are the principal strains corresponding to the three main stresses.
Since there is no confining pressure in the uniaxial compression test, namely, , the total strain energy and elastic strain energy can be expressed as39:
 |
6 |
 |
7 |
For simplicity, the unloading elastic modulus Eu is replaced with the elastic modulus E in the calculation. In order to verify the rationality of this scenario, the uniaxial loading and unloading tests were conducted on MG at a loading rate of 0.06 mm/min. As shown in Fig. 11, the tangents of the elastic modulus E and the unloading elastic modulus Eu are almost parallel. E is calculated as 8.12 GPa, and Eu is 8.79 GPa, which can be considered approximately equal. Thus, E is used instead of Eu for the calculations of releasable elastic strain energy in this section.
Fig. 11.
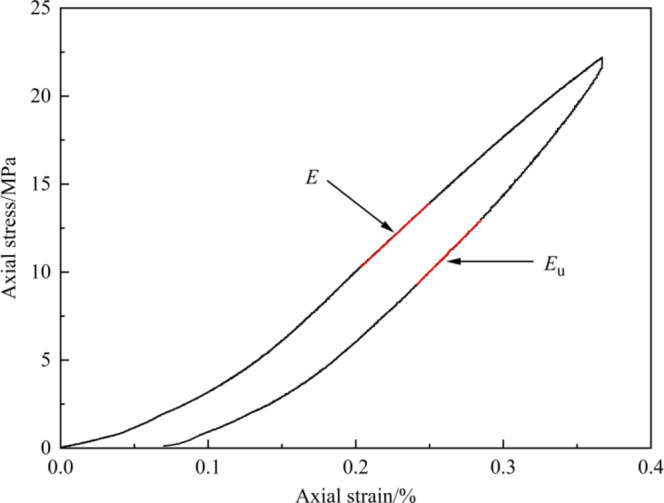
MG loading and unloading curves.
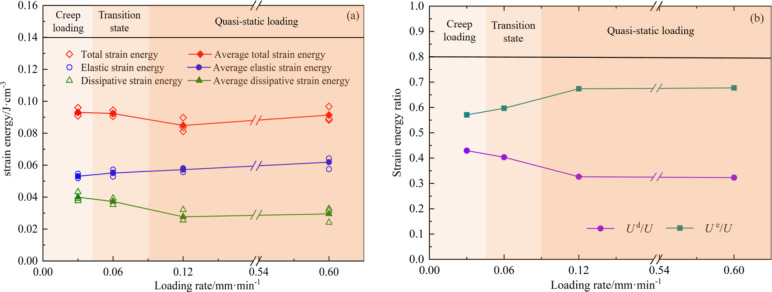
The axial stress at the peak strength point is selected to calculate the strain energy. As shown in Fig. 12a, the elastic strain increases slowly and steadily from 0.053 to 0.062 J/cm3 with the increase of the loading rate. The reason is that under creep loading conditions, the MG specimen shows small elastic deformation but large plastic deformation, leading to low accumulated elastic strain energy. As the loading rate increases, the total strain energy and dissipative strain energy decrease first from 0.093 to 0.040 J/cm3 and then increase slowly to 0.091 and 0.029 J/cm3, respectively. The reason is that the MG specimen undergoes creep loading at the loading rate of 0.03 mm/min, with large plastic deformation in the pre-peak yield section, and the specimen absorbs a lot of energy from the outside world for dissipation during plastic deformation. In contrast, the loading rate of 0.12 mm/min corresponds to the quasi-static loading state, and the plastic deformation of the MG specimen is significantly reduced (Fig. 3), resulting in decreased dissipative strain energy and total strain energy. At the loading rate of 0.6 mm/min, the peak strength of the specimen is further improved, and the total strain energy and dissipative strain energy increase slightly.
Fig. 12.
Strain energy characteristics at different loading rates: (a) Strain energy; (b) Strain energy ratio.
Figure 12b shows the variation trend of the strain energy ratio. At loading rates below 0.12 mm/min, Ue, Ud, and U increase with the increase of the loading rate, showing strong sensitivity. At loading rates above 0.12 mm/min (quasi-static load state loading rates), Ue, Ud, and U stay basically constant as the loading rate changes, showing no obvious sensitivity.
Discussions
Energy-based material damage mechanism analysis
According to thermodynamics principles, material failure is a state of instability caused by energy exchange and internal energy conversion38,39. The strain energy conversion process was analyzed based on the stress-strain curve at a loading rate of 0.06 mm/min, and the results are shown in Fig. 13. According to Sect. 3.2, the MG specimens underwent the compaction stage (I), the elastic stage (II), the stable crack development stage (III), the unstable crack development stage (IV), and the post-peak stage (V) during the uniaxial compression test. In the compaction stage (I) with the original pores and cracks of the MG specimen, the work done by the outside world is converted into the energy that closes the original pores and cracks, and no significant energy change takes place in the specimen. In the elastic stage (II), the work done by the outside world is stored in the form of the elastic strain energy of the MG specimen, and the elastic strain energy begins to increase gradually. There is almost no energy dissipation in this process, and the dissipative strain energy is approximately 0. In the stable crack development stage (III), microcracks form in the MG specimen at point A ( ), and irreversible plastic deformation is produced. The elastic strain energy maintains its growth trend, and dissipative strain energy is generated and gradually increases. In the unstable crack development stage (IV), the growth trend of elastic strain energy remains unchanged, and the growth trend of dissipative strain energy gradually increases. As a result, the microcrack expansion in the MG specimen begins to accelerate, and the work done by the outside world is mainly stored in the MG specimen as elastic strain energy. In the post-peak stage (V), the elastic strain energy stored in the MG specimen is released rapidly at point B (
 ), and its value is significantly reduced, which is the internal cause of the sudden failure of MG specimen.
Fig. 13.
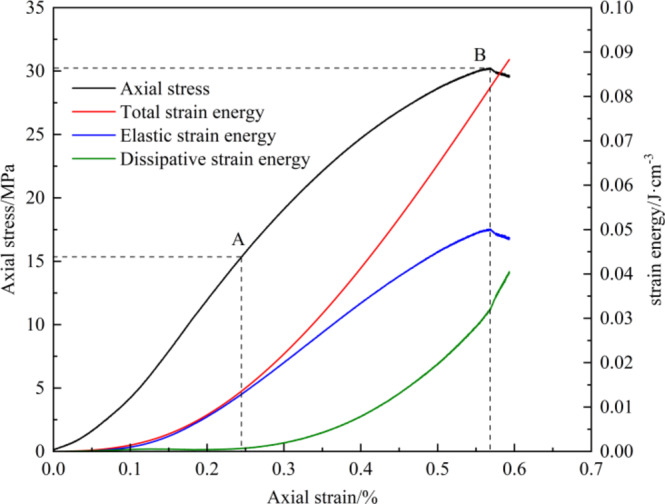
Stress-strain curves and strain energy conversion processes.
Deformation evolution under creep loading
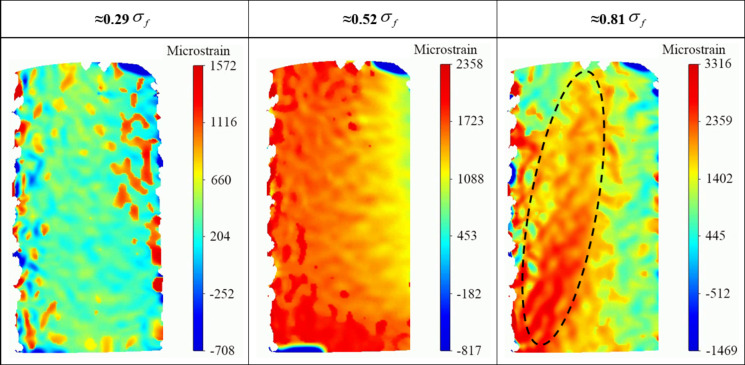
According to Sect. 3.3, the loading rate of 0.03 mm/min is a special value at which MG undergoes creeping, so the DIC technology was utilized to observe the progressive evolution of deformation and strain fields. Figure 14 reflects the principal strain field of stress levels of  (≈ 0.29),
 (≈ 0.52), and
 (≈ 0.81), respectively. It can be observed that the principal strain distribution of the specimen is relatively uniform at the beginning of loading. However, local principal strain concentration intensifies with the increase of axial stress, especially when the axial stress is about 0.81
  , where a strain concentration band is formed on the specimen surface. The angle between the strain concentration band and the horizontal direction is very steep, similar to the failure characteristics (0.03 mm/min) in Fig. 3.
Fig. 14.
The principal strain field of each stress level at a loading rate of 0.03 mm/min.
Conclusions
In order to investigate the mechanical behavior of MG under different loading conditions, uniaxial compression tests were performed on MG specimens in this study. The mechanical properties of MG were discussed under different loading rates, such as elastic modulus, stress threshold, and energy characteristics. The following conclusions were reached:
The variation patterns of the stress-strain curve and stress threshold indicate that under uniaxial compression, MG undergoes creeping at the loading rate of 0.03 mm/min (strain rate
 = 5 × 10− 6), quasi-static loading at 0.12 to 0.6 mm/min (
 = 2 × 10⁻⁵ to 1 × 10⁻⁴), and transition between the two states at the loading rate of 0.06 mm/min (
 = 1 × 10⁻⁵).
As the loading rate increases from 0.03 to 0.6 mm/min, the crack initiation stress
 , damage stress
  , and peak strength
  increase by 18%, 39%, and 28%, respectively. In contrast, the closure stress
  shows no significant sensitivity to the increase in the loading rate due to its small value.
Under the quasi-static loading conditions at 0.12 to 0.6 mm/min,
 and
and  show no significant changes and remain at 0.52 and 0.81, respectively, close to the values of rock materials.
As the loading rate increases from creep loading to quasi-static loading, the elastic deformation of MG gradually increases. As a result, the elastic strain energy increases slowly from 0.053 to 0.062 J/cm3 while the total strain energy and dissipative strain energy first decrease from 0.093 to 0.040 J/cm3, respectively, and then slowly increase to 0.091 and 0.029 J/cm3.
Acknowledgements
This research was funded by Guizhou Provincial Basic Research Program (Natural Science) (No. QKHJC- ZK[2021]YB 288, QKHJC- ZK[2021]YB287).
Author contributions
B.Z.: Writing – original draft, Methodology, Conceptualization. C.X.: Formal analysis, Visualization, Supervision. Q.W.: Writing –review & editing. X.Q.: Data curation. J.W.: Investigation. Z.L.: Resources.
Data availability
The datasets used and/or analyzed during the current study available from the corresponding author on reasonable request.
Declarations
Competing interests
The authors declare no competing interests.
Footnotes
Publisher’s note
Springer Nature remains neutral with regard to jurisdictional claims in published maps and institutional affiliations.
References
- 1.Zhu, G. Y., Yang, Y. R., He, L., Li, H. Q. & Meng, Z. H. Novel synergistic process of impurities extraction and Phophogypsum Crystallization Control in wet-process Phosphoric Acid. ACS Omega8(31), 28122–28132. 10.1021/ACSOMEGA.3C01168 (2023). [DOI] [PMC free article] [PubMed] [Google Scholar]
- 2.R.S, C. M. B., Antonio, G. M., Paloma, P. & Rafael, G. T. Valorization of phosphogypsum in cement-based materials: limits and potential in eco-efficient construction. J. Building Eng.44. 10.1016/J.JOBE.2021.102506 (2021).
- 3.Xiao, Y. D., Jin, H. X., Wang, M. L. & Guo, Y. L. Collaborative utilization status of Red Mud and Phosphogypsum: a review. J. Sustainable Metall.8(4), 1422–1434. 10.1007/S40831-022-00569-X (2022). [Google Scholar]
- 4.Wang, Z. Y., Ma, X. H., Pan, H. Y., Yang, X. D. & Zhang, X. H. Investigating effects of phosphogypsum disposal practices on the environmental performance of phosphate fertilizer production using emergy analysis and carbon emission amounting: a case study from China. J. Clean. Prod.409, 137248. 10.1016/J.JCLEPRO.2023.137248 (2023). [Google Scholar]
- 5.Liu, D. S., Wang, C. Q., Mei, X. D. & Zhang, C. An effective treatment method for phosphogypsum, environmental science and pollution research international. 26(29), 30533–30539. 10.1007/s11356-019-06113-x (2019). [DOI] [PubMed]
- 6.Niang, M., Zobair, E. A., Hadji, M. F. E., Mahmi, W. & Zefti, H. Assessment of natural radioactivity in phosphogypsum in Senegal: a radiological investigation. Iran. J. Sci.48(4), 893–900. 10.1007/S40995-024-01637-5 (2024). [Google Scholar]
- 7.Yassine, E. & Mohammed, B. The chemical behavior of the different impurities present in Phosphogypsum: a review. Phosphorus Sulfur Silicon Relat. Elem.199(2), 129–148. 10.1080/10426507.2023.2281489 (2024). [Google Scholar]
- 8.Ousmane, N., Coumba, T., Alassane, T., Xavier, C. & Mbaye, D. P. Determination of natural radionuclides in industrial phosphogypsum samples from phosphoric acid production in Senegal. Environ. Forensics24, 5–6. 10.1080/15275922.2021.2006362 (2023). [Google Scholar]
- 9.Fotini, N., Maria, S. & Panagiotis, T. Dispersion of radionuclides and heavy metals from phosphogypsum stacks in soil and plants at Northwestern Greece. J. Radioanal. Nucl. Chem.332(10), 4213–4221. 10.1007/S10967-023-09120-Y (2023). [Google Scholar]
- 10.Tayibi, H., Choura, M., López, F. A., Alguacil, F. J. & López-Delgado, A. Environmental impact and management of phosphogypsum. J. Environ. Manage.90(8), 2377–2386. 10.1016/j.jenvman.2009.03.007 (2009). [DOI] [PubMed] [Google Scholar]
- 11.Islam, G. M. S., Chowdhury, F. H., Raihan, M. T., Amit, S. K. S. & Islam, M. R. Effect of Phosphogypsum on the properties of Portland Cement. Procedia Eng.171, 744–751. 10.1016/j.proeng.2017.01.440 (2017). [Google Scholar]
- 12.Pérez-Moreno, S. M., Gázquez, M. J., Pérez-López, R., Vioque, I. & Bolívar, J. P. Assessment of natural radionuclides mobility in a phosphogypsum disposal area. Chemosphere211, 775–783. 10.1016/j.chemosphere.2018.07.193 (2018). [DOI] [PubMed] [Google Scholar]
- 13.Rashad, A. M. Phosphogypsum as a construction material. J. Clean. Prod.166, 732–743. 10.1016/j.jclepro.2017.08.049 (2017). [Google Scholar]
- 14.Tranchida, G., Oliveri, E., Angelone, M., Bellanca, A. & Censi, P. Distribution of rare earth elements in marine sediments from the Strait of Sicily (western Mediterranean Sea): evidence of phosphogypsum waste contamination. Mar. Pollut. Bull.62(1), 182–191. 10.1016/j.marpolbul.2010.11.003 (2011). [DOI] [PubMed] [Google Scholar]
- 15.Efremova, Y. S., Akanova, I. N., Sharkov, A. T. & Yakhkind, I. M. Efficiency of the use of neutralized phosphogypsum, phosphorite processing waste, in agriculture. Environ. Qual. Manage.30(2), 5–11. 10.1002/TQEM.21707 (2020). [Google Scholar]
- 16.Kandil, T. A. H., Cheira, F. M., Gado, S. H., Soliman, H. M. & Akl, M. H. Ammonium sulfate preparation from phosphogypsum waste. J. Radiation Res. Appl. Sci.10(1), 24–33. 10.1016/j.jrras.2016.11.001 (2017). [Google Scholar]
- 17.Hotto, Z. A., Hancharyk, I. I., Navnyko, A. L. & Osipova, E. O. Production of potassium sulphate by conversion of phosphogypsum and potassium carbonate. Proc. Natl. Acad. Sci. Belarus. Chem. Ser.55(4), 483–489. 10.29235/1561-8331-2019-55-4-483-489 (2019). [Google Scholar]
- 18.Ma, Y., Sheng, J. J., Li, T. Y., Yang, C. & Xiao, Q. F. Study on the optimal conditions of ultrasonic strengthening phosphogypsum storage and solidification of CO2. Sustainable Chem. Pharm.33. 10.1016/J.SCP.2023.101091 (2023).
- 19.Jiang, W., Jiang, Y. S., Li, P. Y., Liu, D. Q. & Ren, Y. Z. Reuse of phosphogypsum and phosphorus ore flotation tailings as adsorbent: the adsorption performance and mechanism of phosphate. J. Phys. Chem. Solids17810.1016/J.JPCS.2023.111313 (2023).
- 20.Ren, Z. S., Wang, L., Wang, H., Liu, S. H. & Ren, J. Stabilization and solidification mechanism of pb in phosphogypsum slag-based cementitious materials. Constr. Build. Mater.368. 10.1016/J.CONBUILDMAT.2023.130427 (2023).
- 21.Ma, X. Y., Li, Q., Li, R., Zhang, W. & Sun, X. Y. Removal performance and mechanisms of pb(II) and sb(V) from water by iron-doped phosphogypsum: single and coexisting systems. Environ. Sci. Pollut. Res.29(58), 87413–87425. 10.1007/S11356-022-21862-Y (2022). [DOI] [PubMed] [Google Scholar]
- 22.Li, Y. H., Zeng, X., Lin, Z., Su, J. & Gao, T. Experimental study on phosphate rock modified soil-bentonite as a cut-off wall material. Water Supply22(2), 1676–1690. 10.2166/WS.2021.320 (2022). [Google Scholar]
- 23.Cánovas, C. R., Chapron, S., Arrachart, G. & Pellet-Rostaing, S. Leaching of rare earth elements (REEs) and impurities from phosphogypsum: a preliminary insight for further recovery of critical raw materials. J. Clean. Prod.219, 225–235. 10.1016/j.jclepro.2019.02.104 (2019). [Google Scholar]
- 24.Maria, P. & Georgios, G. Potential uses of phosphogypsum: a review. J. Environ. Sci. Health Part. A. 57(9), 11–18. 10.1080/10934529.2022.2105632 (2022). [Google Scholar]
- 25.Miao, J. Y., Wang, X. H., Liu, G., Bai, S. W. & Daigger, G. T. Smoothing the Phosphorus Resource stress under the Socioeconomic Development in China. Environ. Sci. Technol.10.1021/ACS.EST.3C08301 (2024). [DOI] [PubMed] [Google Scholar]
- 26.Dutta, R. K., Khatri, V. N. & Panwar, V. Strength characteristics of fly ash stabilized with lime and modified with phosphogypsum. J. Building Eng.14, 32–40. 10.1016/j.jobe.2017.09.010 (2017). [Google Scholar]
- 27.Xiao, L. N., Zhang, J. M. & Luo, Y. Innovative approach to enhancing phosphogypsum mechanical properties and stabilizing/solidifying contaminants. Sustainable Chem. Pharm.41, 101712–101712. 10.1016/J.SCP.2024.101712 (2024). [Google Scholar]
- 28.Hu, N. G., Kong, D. W. & Wang, L. L. Experimental design, mechanical performance and mechanism analysis of C30 phosphogypsum-based concrete. Constr. Build. Mater.443, 137673–137673. 10.1016/J.CONBUILDMAT.2024.137673 (2024). [Google Scholar]
- 29.Wu, Q., Zhang, H. G., Jia, X. F. & Long, Q. J. Optimizing compressive capacity: a comprehensive study on cast-in-situ phosphogypsum walls with varied high-thickness ratios and eccentricity distances. Case Stud. Constr. Mater.20, e03025. 10.1016/J.CSCM.2024.E03025 (2024). [Google Scholar]
- 30.Zhou, J., Sheng, Z. M., Li, T. T., Shu, Z. & Chen, Y. Preparation of hardened tiles from waste phosphogypsum by a new intermittent pressing hydration. Ceram. Int.42(6), 7237–7245. 10.1016/j.ceramint.2016.01.117 (2016). [Google Scholar]
- 31.Ma, B. G., Lu, W. D., Su, Y., Li, Y. B. & Gao, C. Synthesis of α-hemihydrate gypsum from cleaner phosphogypsum. J. Clean. Prod.195, 396–405. 10.1016/j.jclepro.2018.05.228 (2018). [Google Scholar]
- 32.Chen, X. M., Liu, Y. Z., Wu, Q. H., Ding, Y. & Wang, Q. Y. Study on physical and chemical characteristics of β-hemihydrate phosphogypsum. Case Stud. Constr. Mater.17. 10.1016/J.CSCM.2022.E01461 (2022).
- 33.International Society for Rock Mechanics Suggested methods for determining tensile strength of rock materials. Int. J. Rock. Mech. Min. Sci. Geomech. Abstracts15(3), 99–103. 10.1016/0148-9062(78)90003-7 (1978). [Google Scholar]
- 34.Ministry of Housing and Urban-Rural Development of the People’s Republic of China. State Administration for Market Regulation. GB/T 50081 – 2019, Test Methods of Concrete Physical and Mechanical Properties (China Architecture and Building, 2019).
- 35.Ministry of Housing and Urban-Rural Development of the People’s Republic of China. General Administration of Quality Supervision, Inspection and Quarantine of the People’s Republic of China. GB 50010 – 2010, Code for Design of Concrete Structures (China Architecture and Building, 2010).
- 36.Martin, C. D. & Chandler, N. A. The progressive fracture of Lac Du Bonnet granite. Int. J. Rock. Mech. Min. Sci. Geomech. Abstracts31(6). 10.1016/0148-9062(94)90005-1 (1994).
- 37.Peng, J., Rong, G. & Jiang, M. Y. Variability of crack initiation and crack damage for various rock types. Arab. J. Geosci.11(11), 1–10. 10.1007/s12517-018-3618-z (2018). [Google Scholar]
- 38.Tian, X. Y., Zhao, F. J., Wang, W. J., Chen, B. & Ma, Y. J. Study on energy evolution and fractal characteristics of sandstone with different fracture dip angles under uniaxial compression. Sci. Rep.14(1), 10464–10464. 10.1038/S41598-024-60902-0 (2024). [DOI] [PMC free article] [PubMed] [Google Scholar]
- 39.Kong, L. W., Xie, H. P., Gao, C. & Li, C. B. Experimental and theoretical research on the anisotropic deformation and energy evolution characteristics of shale under uniaxial cyclic loading and unloading. Int. J. Geomech.22(11). 10.1061/(ASCE)GM.1943-5622.0002590 (2022).
Associated Data
This section collects any data citations, data availability statements, or supplementary materials included in this article.
Data Availability Statement
The datasets used and/or analyzed during the current study available from the corresponding author on reasonable request.


