

Abstract
The network layer plays a crucial role in blockchain systems, enabling essential functions such as message broadcasting and data synchronization. Enhancing data transmission structures and methods at this layer is key to improving scalability and addressing performance limitations. Currently, the uneven distribution of neighboring node lists and the lack of awareness of underlying linkages in coverage networks hinder the efficiency and comprehensiveness of information transmission. To tackle these challenges, this study introduces a dual-layer transmission model, FPSblo-EP, which divides the blockchain P2P network into two layers: the regular node layer and the tagged node layer. In the initial stage, network nodes are treated as points in a point cloud, and farthest point sampling is applied to the P2P network nodes. During this process, geographic distances between nodes serve as input parameters, while node degrees are used as point weights. Tagged nodes can then provide efficient and stable inter-group routing for regular nodes, creating a hierarchical transmission architecture. This model improves both transmission performance and scalability in blockchain overlay networks. Experimental results show that FPSblo-EP reduces message coverage latency by 22%, redundancy by 26%, and the network stretch coefficient by 28%, demonstrating superior load-balancing capabilities and enhanced network reliability.
Subject terms: Computer science, Information technology
Introduction
Blockchain is an innovative distributed technology1,2. It acts as a decentralized, communal database, ensuring secure, transparent, and tamper-proof storage and transmission of information3. It achieves this without intermediaries through peer-to-peer overlay networks, cryptography, and consensus algorithms4,5. Previously, distributed systems relying on classical consensus algorithms encountered numerous limitations in open network settings6,7. However, blockchain systems, exemplified by Bitcoin8, marry loose consistency assumptions with leader election schemes. This enables them to achieve Byzantine consensus in open and decentralized network environments, opening up broader developmental prospects for distributed systems9,10.
As on-chain data volume and peer nodes grow, blockchain systems face performance bottlenecks in transaction processing, leading to longer confirmation times11,12. Transaction processing speed must improve to meet user demand, as delays drive up costs and diminish user experience. This bottleneck primarily stems from blockchain’s decentralized design philosophy13, which hinges on two essential conditions: First, transaction and block information must swiftly and reliably propagate to most network participants11. Second, participants receiving this information must promptly package transactions or conduct verification to ensure system consistency14. The transmission performance of the blockchain network significantly impacts the former condition.
To address the performance bottlenecks in blockchain systems, current research on scalable technologies primarily concentrates on two key areas15. Firstly, on-chain solutions16,17 aims to enhance the design of blockchain systems directly. Secondly, off-chain solutions18 to improve blockchain performance indirectly. Meanwhile, research on the scalability of blockchain also includes network layer solutions19. The blockchain network layer is relatively independent and relatively decoupled from other functions, making network layer technology an effective means that can enhance the efficiency of blockchain and avoid causing new problems to the greatest extent possible20.
This work aims to optimize the transmission structure and methods of the layered blockchain P2P network to reduce network single-point failures and enhance network topology awareness. A geographically aware layered transmission topology structure called FPSblo-EP is proposed to achieve this. This model reduces the transmission latency, and transmission redundancy and improves the scalability of the blockchain network system.
The structure of this paper is organized as follows. In the “Related Work” section, we introduce and analyze representative existing research proposals for blockchain network layer scalability and describe their advantages and disadvantages. Section “Overview of FPSblo-EP” and Section “Design of FPSblo-EP” introduces the system design of the FPSblo-EP node management model. Section “Execution and Evaluation” analyzes and discusses the transmission performance of the FPSblo-EP model. Section “Conclusions” summarizes this paper and outlines future work.
Related work
The blockchain network layer, located at the base of the blockchain hierarchy, uses a peer-to-peer (P2P) overlay to transmit transactions or blocks. This layer operates independently of others, enabling scalability solutions that enhance system efficiency while minimizing compatibility, security, and acceptance issues. These solutions focus on optimizing information dissemination and P2P network topologies to improve block and transaction propagation, reducing latency and bandwidth consumption.
A hierarchical structure in a network involves nodes with varying capabilities, organized into levels. Some nodes act as higher-level management nodes, while others connect to them, facilitating node organization and layered control. This structure improves transmission efficiency, often at the cost of decentralization. Hierarchical designs can be broadly categorized into two types: one that enhances transmission protocols through simple node heterogeneity, and another that actively divides the network into layers using clustering or other methods, requiring more complex protocol improvements.
Regarding hierarchical transmission protocol improvements, Aoki et al.21 and Santiago et al.22 utilized a scoring algorithm based on propagation delay to select neighboring nodes in the network. Nodes with higher scores are prioritized for selection, and after receiving ten blocks, each node updates its list of neighboring nodes. By optimizing neighbor node selection, block propagation time is shortened, but it may lead to excessive clustering of message transmission, resulting in congestion. Huang et al.23 utilized the iTracker method from P4P to provide routing services for nodes in the blockchain network. When a node initiates a communication request, the initiating node’s iTracker connects to the iTracker responsible for the destination cluster, returning the node with the shortest propagation time to the initiating node, thereby reducing the overhead caused by topology management and improving bandwidth utilization. Like other technologies employing clustering methods, it can also increase transaction throughput. However, if congestion within clusters is not alleviated, it may reduce performance when used on a large scale. Berendea et al.24 and Shaleva et al.25 improved the gossip algorithm of the Hyperledger framework and Neo blockchain by using IP multicast at the application layer instead of round-robin transmissions, respectively, to reduce their bandwidth usage, increase the probability of all peers obtaining the data in the same transmission rounds, and improve the network transmission rate, but in large-scale applications, this approach may cause bandwidth efficiency to decrease due to repeated transmissions; Harmony26 incorporates the QUIC (quick UDP internet connection)27 technology into the blockchain network layer transmission protocol, which reduces the number of times the underlying packets are exchanged during transmission and improves the data transmission efficiency; Erlay28 extends the bitcoin gossip protocol and optimizes the transaction relay protocol to reduce the overall bandwidth consumption; Nexus29 designs addressing protocols to bridge nodes inside and outside of NAT30, and adopts IP multicast31 technology to achieve broadcasting of the underlying packets on the blockchain network, reducing transmission redundancy.
Regarding hierarchical transmission structure improvements, M. Fadhil32 and Hao et al.33 proposed a geographical-based clustering network topology model called LBC (Locality-Based Clustering) and BlockP2P. The idea is to cluster nodes based on their geographical locations in the blockchain and designate some nodes as cluster head nodes responsible for routing between clusters. This technique reduces the network’s diameter, thereby reducing propagation delay. However, in their approach, intra-cluster communication adopts a star-shaped topology or relies on a single cluster head node, resulting in decreased transmission efficiency within clusters and vulnerability to reduced inter-cluster transmission efficiency due to single-point failure issues as the network scales up. Baniata et al.34 employed dedicated servers to generate P2P topologies and assign neighbors to each peer. This method provides a flexible network management approach, allowing real-time adjustment of topology structure. The topology generation utilizes both clustering and random neighbor selection. Unlike other clustering-based methods, it introduces constraints to limit intra-cluster congestion. Li et al.35 proposed a Mesh-and-spoke blockchain network topology model called MANDALA, which designs the network as a dual-layer structure comprising core and regular network layers. Tasks are divided by hierarchy, enhancing message processing efficiency, and an isolation mechanism is designed to ensure the security of the core layer. He et al.36 introduced a history list for recording transmitted nodes so that when a node receives a block it does not send it to a neighboring node that is already on the list, aiming to minimize duplicate transmissions caused by the gossip protocol, although this method is effective in reducing bandwidth wasted on duplicate data, it was only tested on a network containing nine nodes, if the network receives a large number of transactions, this method may not scale well with the increase in the number of peer nodes; Yu et al.37 used a similar method to He et al., with the difference that the method also records the transmission path of the block through the network and uses a distributed hash table (DHT) in the P2P network, which reduces the bandwidth wastage due to duplicate data and also scales well with peer-to-peer networks as it is still applicable in case of larger network size; Vu et al.38 used INV messages and GETDATA responses in Bitcoin to compute the probability, which will affect which neighbors are likely to receive the new block. The ratio of sends to receipts constitutes the probability that is used to determine which neighbor gets the new block. The method does not significantly improve transaction throughput, but reduces duplicate transmission of messages; KADCAST39 proposes an efficient block propagation method based on the Kademlia overlay network architecture, which achieves efficient broadcasting with adjustable overhead and uses forward error correction (FEC) to improve reliability while maintaining a lightweight architecture. By using KADCAST, nodes in a blockchain network can more effectively discover and connect, which can significantly reduce the latency and bandwidth requirements of the network. KADCAST is a structured transmission network that builds a broadcast tree. In this network, each node is assigned a unique identifier called a node ID. Nodes broadcast messages they receive with an attached transmission scope to peer nodes within the receiving scope. As shown in Fig. 1, if a node with ID 1111 (local node) initiates a broadcast, it partitions the entire network into four ranges: 1110, 110X, 10XX, and 0XXX. Node 1111 then selects a specific number of peer nodes in each range as its neighboring nodes and forwards the data. Subsequently, the receiving nodes repeat the above process, dividing the receiving scope and forwarding the data.
Fig. 1.
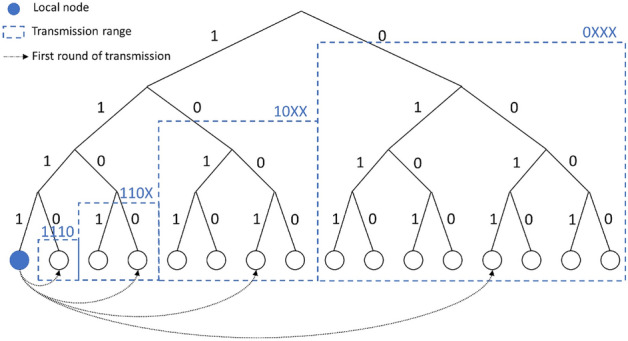
An example of the KADCAST broadcast.
Overview of FPSblo-EP
Furthest point sampling
The farthest point sampling algorithm (FPS) is a commonly used sampling method in point cloud image processing. When dealing with point cloud data, selecting a representative and relatively small subset from a large set of points is often necessary to reduce computational complexity and improve algorithm efficiency. As shown in Fig. 2, the FPS algorithm achieves efficient point cloud sampling through the following steps:
Initialization: Randomly select a point from the point cloud data as the initial point and add it to the sampling set.
Iterative selection: From the already selected set of points, choose the point farthest from the current set of points and add it to the sampling set.
Update distances: Update the distance information of all points to the current sampling set to ensure that the farthest point can be selected in the next iteration.
Iteration termination: Repeat the iterative selection process until the desired number of sampling points is reached or other stopping conditions are met.
Fig. 2.

Steps of the farthest point sampling algorithm.
The FPSblo-EP algorithm introduced in this paper likens nodes in the blockchain network to points in a point cloud. By incorporating network parameters during the selection of tagged nodes, the algorithm aims to sample representative nodes from the network without altering its original architecture, thus establishing a more efficient transmission method.
Topology definition
We define the node identities or rules involved in the FPSblo-EP model as follows:
NodeID_new. The node identifier is improved to represent the binary relationship between the cluster set flag to which the node belongs and the original node identifier < ClusterNum, NodeID > . NodeID remains the 256-bit digest of information generated by hashing the public key in the node’s key pair, with the first 160 bits taken.
Local Node. Nodes in the network with broadcasting requirements are referred to as local nodes.
Start node. The starting input parameter for the FPSblo-EP sampling algorithm initiates the iterative algorithm of the farthest sampling from the starting point. The selection of the starting point dramatically affects the results of the FPSblo-EP sampling.
Sampled node. After running the FPSblo-EP sampling algorithm from the start node, a set of nodes is obtained, called the sampled node-set.
Tagged node. The final set of tagged nodes is obtained after further filtering the nodes in the set based on their microscopic and macroscopic characteristics. The connection relationship between the tagged node-set and the tagged nodes forms the tagged layer in the model.
Regular node. Nodes in the model with no notable roles or functions are responsible only for transmitting, receiving, and forwarding messages in the blockchain transmission network. The connection relationship between regular nodes forms the regular layer in the model.
FPSblo-EP is a geography-based, layered transmission network structure that introduces a distributed sampling forwarding layer, built on top of a structured routing system using the farthest point sampling algorithm. In this network, nodes self-organize into several clusters through minimal information exchange.
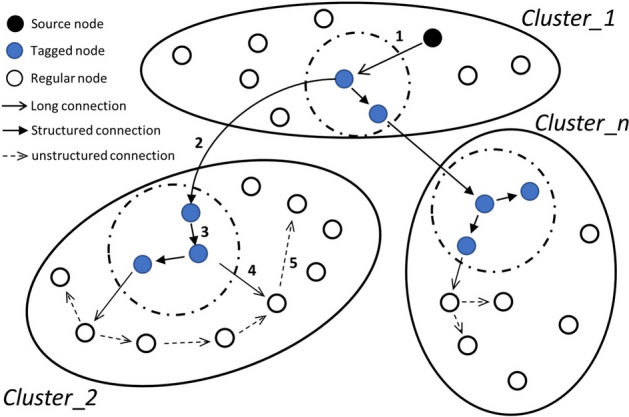
Figure 3 illustrates the generation of the FPSblo-EP double layer transmission model. First, we use the farthest point sampling algorithm (FPS) to generate the set of target nodes. The sampling process utilizes the geographical distance between nodes as input parameters and the node degree as point weight, resulting in a proportion of representative nodes. Then, divides the blockchain P2P network into regular and tagged node layers. These representative nodes selected by step 1 are assigned to the upper-layer tagged node layer within a dual-layered structure, enabling a sparse representation of the blockchain network based on geographical distribution. Other nodes are classified as regular nodes and allocated to the regular node layer, based on geographical location, multiple groups are formed, allowing tagged nodes to provide efficient and stable inter-group routing for ordinary nodes, thus forming a hierarchical transmission architecture. Subsequently, data transmission begins, which includes in-cluster transmission, export selection, inter-cluster transmission, and load balancing. The workflow of this model is shown in (Fig. 4).
Fig. 3.

Schematic of the FPSblo-EP transmission model.
Fig. 4.

Workflow chart of FPSblo-EP model.
Generation of clusters
As shown in Fig. 5, the double-layer transmission structure consists of tagged nodes and regular nodes. The key idea behind this structure is to separately cluster nodes in both the tagged and regular layers. Nodes in the tagged layer use structured transmission methods, which enhance the efficiency of inter-cluster routing and help mitigate single-point failures caused by tagged node failures. Since the majority of nodes in the network reside in the regular layer, an unstructured transmission approach is employed to support the flexible joining and exiting of nodes.
Fig. 5.

Double layer transport structure for the FPSblo-EP model.
Cluster generation in the tagged layer
This article utilizes the K-means algorithm for the physical location-based clustering of nodes in the tagged layer. K-means is a simple and efficient algorithm used for clustering, aiming to partition data points into a predetermined number of clusters. It iteratively optimizes the centroids of each cluster to minimize the distance between data points and their respective cluster centers. Its advantages include simplicity, scalability, and widespread image segmentation and text mining applications. However, K-means is sensitive to initial centroids, assumes clusters are convex, requires specifying the number of clusters in advance, and is sensitive to noise and outliers. FPSblo-EP first samples nodes in the network, which aids K-means clustering in the following ways:
Reduce computational cost: Two key parameters affect the efficiency of the K-means algorithm, namely the number of clusters k and the sample size N. By selecting a small subset of representative points, the input sample data volume is reduced, thereby reducing the computational cost while maintaining the same target clustering quantity.
Minimize the impact of noise: By selecting more representative points, the stability of clustering can be improved, helping to reduce the influence of noise in the data on the K-means algorithm.
Preserve important structural information: FPSblo-EP can preserve important structural information of the original node distribution. This helps ensure that crucial features in the data are not overlooked during the clustering process.
Cluster generation in the regular layer
Coarse partitioning
Newly added nodes apply to seed nodes for the current cluster ID existing in the network and their corresponding tagged node IDs. The new nodes determine their rough positions based on the latitude and longitude corresponding to their IP addresses.
Fine partitioning
Nodes send access requests to tagged nodes of the two closest clusters regarding physical distance and rank the results based on round-trip time (RTT). Based on the ranking, the cluster to which the node belongs is determined, and a request to join the cluster is sent to the tagged node of that cluster.
Theoretical analyses
The primary goal of topological awareness is to ensure that the sampled graph reflects key characteristics of the actual network, with geographic location being a crucial factor. In the previous chapters, FPSblo-EP’s use of the farthest point sampling algorithm was described, which selects a small set of nodes and optimizes them into tagged nodes. While this reduces the number of nodes and lowers processing costs, it also coarsens the network, potentially leading to collapse. Therefore, the representativeness of the tagged nodes selected by FPSblo-EP is critical. This can be evaluated in two ways: (1) Whether the tagged nodes accurately represent the geographic locations of the original network, and (2) Whether the logical structure of the original network is maintained despite the reduced node count.
Effectiveness of positional distribution
Unlike the progressive sampling approach, the FPS algorithm does not employ a method of uniform sampling applied repeatedly at different resolutions. Instead, it adopts a strategy of adding sampling points one by one. The critical issue is how each sampling point should be placed. If the objective is to achieve good reconstruction, the following sampling position should minimize the expected overall reconstruction error. Eldar40 employs a standard random model41, treating the image as a sample function of a continuous two-dimensional random process, which is generally stationary, with correlations decaying exponentially with distance:
 |
1 |
For the task of image interpolation, selecting the optimal linear estimator (OLE), the mean squared error (MSE) after interpolation with N samples depends on the sample positions  , i.e.:
 |
2 |
where
 |
3 |
 |
4 |
Therefore, the optimal sampling strategy after N-1 point samples is to choose the N-th sample point to minimize Formula (2). The expected MSE does not depend on the value of the N-th sample but only on its position. Since the statistical properties of the image are constant in space, the expected sample distribution is uniform. The selection of these sample positions needs to consider the characteristics of different regions in the image to ensure a more accurate estimation of the overall image.
Minimizing Formula (2) has no analytical solution, so let us first consider its one-dimensional form. Let  , be an exponentially correlated one-dimensional random signal, and let
  be a set of samples of this signal. An essential characteristic of the exponential correlation model is that the optimal linear estimator
  is invariant to “blocked” sample points. Therefore, the expected reconstruction error of the segment between adjacent sample points
  (denoted as
  ) depends only on its length
  Applying Formula (2) to this particular case yields:
 |
5 |
Therefore, an additional sampling point only affects the reconstruction error of the segment containing it. Adding  at a distance of
  from
from  reduces the error to:
 |
6 |
When  , the function is minimized, which implies that
  should be positioned at the midpoint of the unsampled segment. The overall reduction in reconstruction error is a function of the segment length
  :
:
 |
7 |
 is a decreasing function. Therefore, in the one-dimensional case, the optimal sampling strategy is to sample the image at the midpoint of the most extended unsampled segment, which is the farthest from the current sampling set. In the case of a one-dimensional signal, a two-dimensional signal is flattened row by row or column by column and projected into one-dimensional space. Extending this conclusion to the two-dimensional problem yields a feasible strategy: given the current sampling set
  of the image
  (defined over the region A), the next target sampling point should be collected at point
  , which is farthest from
  , i.e.:
 |
8 |
This strategy minimizes the expected reconstruction error by selecting the next sampling point, given a starting point and sampling scale. The resulting subset represents the original image’s distance distribution characteristics. For different starting points and the same sampling scale, the sampled elements may differ, but they all capture the original data with similar intensity, leading to similar distance distributions. To verify this, a simulation was conducted on a 360 × 180 plane with randomly distributed nodes. For various sampling ratios (1–100%), 2*100*100 random start point samplings were performed. The distribution of distances from each node to the image’s center was analyzed, as shown in (Fig. 6). Additionally, mean squared errors for the sampled images with different starting points and sampling intensities were calculated (Fig. 7). Results show that when the sampling rate exceeds 0.2, the mean squared error significantly improves.
Fig. 6.

Comparison of dispersion of sampling results with different starting points selected at different sampling efforts.
Fig. 7.
Mean squared error statistics of the sampling results for different starting points at different sampling intensities.
Effectiveness of the degree distribution
The algorithm effectively represents the geographical sparsity of nodes in the original network. However, in a widely distributed and heterogeneous blockchain P2P network, more than focusing on the geographical properties of nodes is required. It is necessary to simultaneously consider the capabilities of nodes after being sampled by this model to ensure that the sampled nodes match the original network in terms of node capabilities.
In blockchain P2P networks, node capabilities involve multiple aspects such as computing power, storage capacity, transaction processing speed, etc. In network theory, the degree of a node refers to the number of edges directly connected to that node. In blockchain or P2P networks, node degree can also indicate its importance in the network topology, especially regarding communication between nodes, consensus, or information dissemination. In robust P2P networks that operate stably over the long term, higher-level nodes typically have better bandwidth conditions and higher computing, storage, and processing capabilities. Therefore, in this section, node degree is chosen as the criterion for measuring node capability.
A simulation experiment was designed to verify the effectiveness of the sampling algorithm of the FPSblo-EP model in sampling sets’ degrees. In P2P networks, although communication is directional, bidirectional communication can occur once a connection is established between nodes. Therefore, the network can be considered as an undirected graph.
In the undirected graph  , with a node scale set to n = 10000 and physical coordinates following a random distribution, the node degree k follows a power-law distribution, i.e.,
  , where the power-law exponent λ = 2. Additionally, while preserving the power-law distribution, a certain number of nodes were set to have a degree of k = 64. Figure 8a shows the distribution of node degrees in the network.
Fig. 8.

Nodal degree distribution validity experiment: (a) Distribution of nodal degrees; (b) Kernel density distribution of node degrees for different sampling efforts.
Using the FPSblo-EP model’s sampling algorithm on the sample node set with different sampling intensities (1, 5, 10, 20, 30, 50, 80%) and comparing it with the kernel density estimation of the original node set, the comparison results are shown in (Fig. 8b). The graph shows that when the sampling intensity is less than 20%, the sampled node set exhibits significant deviations from the original graph’s distribution probability in terms of node degrees.
Design of FPSblo-EP
FPSblo-EP adopts a cluster-based hierarchical transmission model. Structured transmission based on distributed hash tables is performed between the upper-level tagged node layer, aiding rapid resource localization between clusters. The lower-level ordinary layer employs unstructured flooding transmission, offering greater flexibility. Deterministic distribution is utilized between upper-level tagged nodes and lower-level ordinary nodes. Figure 9 illustrates the data distribution process.
Fig. 9.
Data distribution for the FPSblo-EP model.
Intra-cluster message distribution
Figure 9 shows that if the message source and destination belong to the same cluster, the message itself is transmitted directly through unstructured flooding. Simultaneously, the message digest is sent to the tagged node connected to the source node, and the number of digest transmissions is checked. The purpose is to reduce redundant transmissions and prepare for inter-cluster forwarding. The following is the specific algorithm process, with the main functionalities including: a) collection of message digests within the cluster by tagged nodes; b) transmission of messages within the cluster by ordinary nodes; c) preparation for forwarding at the tagged layer of tagged nodes.
Message export option
In current designs of cluster-based hierarchical transmission structures, most models assign a management node (also called a cluster head node) to each cluster. This requires the management node to have superior host performance and network bandwidth, which raises the threshold for becoming a manager and increases the risk of a single-point failure. In contrast, FPSblo-EP adopts a management model with multiple tagged nodes per cluster, reducing these requirements and mitigating risks. However, this approach also introduces new challenges, such as the issue of selecting an export node when multiple management nodes are present.
As shown in Fig. 10, two tagged nodes, MN_1 and MN_2, are present within cluster Cluster_i. When a regular node, NM_i, receives a message destined for outside the cluster, it relies on the tagged nodes for forwarding. The decision of which tagged node to choose depends on the load. If traffic within the cluster remains high for too long, congestion may occur, reducing system throughput. The goal is to ensure smooth links and quick message forwarding from the nearest available exit, reducing load on the cluster’s links. Regular nodes maintain a routing table for tagged nodes, which includes the distance (link delay) to each tagged node. Although distance can be measured in different ways, we use link delay as it reflects actual communication latency. The table is sorted by link delay, and when sending a message, the regular node selects the closest, non-overloaded tagged node. Additional routing tables increase resource consumption, and we analyze the associated memory and communication overheads below.
Fig. 10.

Export selection for data transmission in cluster nodes.
Memory overhead
The memory overhead for each ordinary node in the FPS-EP model is determined by the size of the routing table that records information about tagged nodes. Table 1 shows the routing table information for normal nodes to record tagged nodes. Each routing entry includes fields such as ID, IP address, port, distance, load status, timestamp, and connection status. A single ordinary node’s routing table will require approximately 40 bytes per tagged node. Normal nodes within each cluster only need to record information about the tagged nodes within this cluster and the maximum number of tagged nodes within a single cluster is 10. As a result, for a single regular node, the maximum total memory usage generated by adding a new routing table is 400 bytes.
Table 1.
Routing table information for normal nodes to record tagged nodes.
| Field | Type | Size | Description |
|---|---|---|---|
| ID | 160-bit int | 20 bytes | Unique identifier for the node |
| IP_address | IPv4 | 4 bytes | Network address of the node |
| port | 16-bit int | 2 bytes | Port number |
| dis | Float | 4 bytes | Distance information (link delay) |
| LD | Byte | 1 byte | Load status |
| usage | Byte | 4 bytes | CPU usage: 1 byte; Bandwidth usage: 1 byte; Number of connections: 2 bytes |
| stamp | Byte | 4 bytes | Timestamp of the last update |
| Sta | bit | 1 bit | Connection status (0: offline, 1: online) |
| Res | bit | 7 bits | future extensibility |
Communication overhead
In terms of communication overhead, each ordinary node must interact with the tagged nodes to query their load status periodically. This involves sending request-response messages, with each interaction consuming  are 34 bytes (request ID: 20 bytes, response dis/LD/usage/stamp/Sta: 14 bytes). The frequency of routing table update requests for the model is
  , and the number of entries per update
  should be equal to the number of tagged nodes. Therefore, the communication overhead per hour
  . As mentioned above, there is an upper limit of 10 tagged nodes within a cluster, so the upper limit of
  is about 489.6 Kb/h. This minimal overhead is manageable.
In this model, regular nodes utilize a request-response mechanism to obtain status information about tagged nodes, including load conditions and connection details. Ordinary nodes send query requests to tagged nodes based on their needs rather than relying on periodic updates. Upon receiving a request, tagged nodes respond with entries from the routing table that include detailed information about their load status and other relevant metrics. This approach ensures that ordinary nodes only update their routing tables when necessary, thereby avoiding unnecessary communication overhead.
Calculations indicate that this routing table update mechanism, based on a request-response model, is resource-efficient and maintains communication overhead within an acceptable range.
Node joining and leaving
Joining of regular nodes
When a new node joins the network as a regular node, factors such as network topology, geographical location, and connection quality should be considered to optimize its position in the network. The following are the specific steps:
Step 1: Request network structure information: When a new node joins the network, it first requests seed nodes to obtain the cluster IDs existing in the current network and their corresponding tagged node IDs.
Step 2: Determine rough location: The new node determines its geographical location by utilizing the latitude and longitude information corresponding to the IP address.
Step 3: Send cluster access requests and measure RTT: The new node sends access requests to the tagged nodes of the two closest clusters and measures the average round-trip time (RTT) between these two tagged nodes during communication.
Step 4: Sort and determine cluster membership: The new node can intelligently determine its cluster membership by sorting the measurement results.
Step 5: Send join regular cluster request to selected cluster: Based on the sorting results, the new node requests to join the corresponding regular cluster of the cluster with the best connection quality.
Joining of tagged nodes
Actively Requesting to Join as a Tagged Node: This often occurs in robust networks after clustering into tagged and regular layers. Upon receiving this request, the tagged node will act as a leader and initiate a vote among all tagged nodes. If the vote passes, the application succeeds, and the node joins the tagged node cluster with a new identity. If the vote fails, the application is unsuccessful, and the node joins the regular cluster as a regular node.
The voting process follows a structured approach inspired by the Raft consensus algorithm. The steps are as follows:
Step 1. Request initiation: The regular node sends a join request to the tagged node it is directly connected to in the cluster.
Step 2. Leader designation: The tagged node that received the request acts as the leader and coordinates the voting process among other tagged nodes in the cluster.
Step 3. Vote broadcast: The leader broadcasts the join request to all other tagged nodes in the cluster.
Step 4. Evaluation and voting: Each tagged node evaluates the request based on specific criteria (outlined below), and then casts a “yes” or “no” vote.
Step 5. Majority decision: If a majority of tagged nodes vote “yes” within a specified time frame (e.g., 1000ms), the regular node is accepted into the tagged node group.
Each tagged node computes an overall score (TS) using this weighted formula:  .
.
Node stability (NS)
This score (0–10) is based on the node’s historical performance, such as uptime and reliability, with a weight of 35%. The node itself records its uptime.
Computational resources (CR)
This score (0–10) is based on the CPU, memory, and storage capacity of the new node, with a weight of 30%. The regular node reports its hardware nominal data in the join request.
Bandwidth (BW)
This score (0–10) reflects the upload and download bandwidth of the node, with a weight of 25%. Tagged nodes actively measure the bandwidth to the regular node at the time of the evaluation.
Load balancing (LB)
If the current cluster is heavily loaded, new tagged nodes are more desirable. This score (0–10) accounts for that, with a weight of 10%. LB is used to represent the current load of the tagged node that is evaluating a regular node.
When a regular node sends a join request to become a tagged node, it includes information such as NS, CR, and BW in the request message. The tagged node can then assess these parameters to compute the Tagging Score (TS) for the new node.
If the node’s total score TS ≥ 6, the tagged node casts a “Yes” vote.
If there is only one tagged node in the cluster, it independently evaluates the new node using the same scoring system. If the total score TS ≥ 6, it approves the request. If TS < 6, the new node joins as a regular node.
Passively becoming a tagged node: This situation often occurs in the early stages of network construction. When a new node joins the network and fails to find a suitable tagged node based on its IP address in steps 1 and 2 or experiences an RTT timeout in step 3, the node passively joins the network as a tagged node. It then informs the seed nodes of its information, obtains a list of other tagged nodes, and updates its routing table to complete the joining process.
Node failure
The message transmission between regular nodes in the regular layer is based on an unstructured approach, lacking explicit structure and routing tables. Therefore, the method of handling node exits is relatively flexible. For nodes that actively exit or experience long-term timeouts, their neighboring nodes will consider the node as failed and remove it from the routing table during the next update.
The tagged nodes are responsible for maintaining inter-cluster connections and managing regular nodes within their own cluster. Therefore, the failure of a tagged node can significantly impact network communication routing. From the perspective of the tagged node layer, the layer adopts a multi-scale structured management model. The model introduces a k-bucket periodic refresh mechanism, allowing nodes to update their neighbor lists and replace failed nodes promptly. On the other hand, from the perspective of the regular node layer, if there are multiple tagged nodes in a regular cluster, the failure of a single tagged node does not significantly impact message forwarding. Message forwarding can still be achieved through redundant paths the remaining tagged nodes form. In most cases, these redundant paths are sufficient to ensure regular communication. In rare cases, if only one tagged node in a regular cluster fails or multiple tagged nodes fail, the 'inter-cluster cooperation’ mechanism will be triggered. Regular layer nodes can request to join neighboring clusters to continue message forwarding. This 'inter-cluster cooperation’ strategy helps maintain the stability of the entire network and ensures effective message delivery even in exceptional circumstances.
Cluster splitting and merging
Since clusters at the tagged node layer are mainly derived from node selection and partitioning by the FPSblo-EP algorithm, their scale is controllable, and they do not actively undergo cluster splitting and merging operations. However, they may be passively affected by the clusters of regular nodes they manage, leading to splitting and merging. Therefore, the focus is on discussing the cluster splitting and merging of the regular node layer, which typically involves more nodes.
Cluster splitting and merging are carried out to meet the system’s load-balancing requirements. Hence, in this design, the triggering conditions for cluster splitting and merging at the regular node layer are the load conditions of the corresponding tagged node and the number of nodes within the cluster.
Step 1: Setting thresholds. Thresholds are divided into time (
 ) and load thresholds (
 ).
).Step 2: Monitoring load status. Real-time monitoring of the load status of each tagged node within a unified cluster. The amount of tasks received by a node is denoted as
 , and its processing capacity is denoted as
  . Let
. Let  . If
. If  persists for more than
  , the node is considered overloaded; if
  persists for more than
  , the node is considered underloaded.
Step 3: Determining splitting or merging. Evaluating the load status of the tagged node cluster. Overloaded tagged nodes can initiate a vote within the tagged node cluster. If the vote passes, proceed to Step 4. Underloaded nodes can also initiate a similar operation. If the vote passes, proceed to Step 5.
Step 4: Splitting operation. Selecting a tagged node within the tagged node cluster as the tagged node for the new neighboring cluster and assigning a new cluster identifier. The original regular node cluster is evenly divided into two sub-clusters.
Step 5: Merging operation. Sending requests for load status to single or multiple tagged node clusters physically nearby. If underloaded clusters are found, merge them into a new cluster.
Regarding the threshold for determining whether a tagged node is overloaded or not. We use a dynamic in-degree adjustment strategy to measure the load state of the tagged nodes. In this model,  as the capacity that the node is willing to devote or able to process queries of node i, and
  is determined based on the node’s CPU occupancy. And
  is the number of messages that the node receives and forwards to its neighbors over time T. The value of
  is used to measure the load of the node, which should be close to 1 for full load. In this paper, we set
  and
and  , which are used as thresholds for evaluating the load.
It is important to note that the number of clusters in the first layer is a hyperparameter and cannot be split. Sub-clusters are formed from the original parent cluster in cases with too many nodes. The first three digits of the cluster identifier indicate the root cluster, and the following four digits indicate the sub-cluster. When a cluster is split, the root cluster identifier remains unchanged, and two new sub-clusters are created with new identifiers. The tagged nodes from the original cluster are evenly distributed to the two new clusters to become the initial tagged nodes of the new clusters.
Execution and evaluation
Experimental setup
Platform configuration
We performed our experiments on a computer with dual eight-core Intel Xeon E5-2670 2.60 GHz CPUs, 64 GB of DRAM, 1 TB SSD storage, running on Ubuntu 18.04 LTS as the operating system.
Architecture
We built a prototype system of FPSblo using the NS-3 simulation tool, version 3.34, for performance evaluation. Table 2 provides detailed configurations of the prototype system. The system contains 6000 blockchain nodes with IP addresses from the Bitnodes42 dataset, which allows for accurate calculation of latitude and longitude information for each node and ensures the accuracy and repeatability of the simulation. The Bitnodes dataset contains information about the blockchain nodes, as shown in (Table 3).
Table 2.
Parameter configuration of the FPSblo-EP prototype system.
| Parameters | Value |
|---|---|
| Number of nodes | 6000 |
| Node distribution | Geo-located power law distribution |
| Average degrees | 32 |
| power-law index | 2 |
| Initial number of clusters | 10 |
| Data packet size | 10kb, 2048kb |
Table 3.
Sample node information for bitnodes.
| IP address | 124.156.198.253:8333 | 51.140.241.158:8333 | 35.200.71.247:8333 |
|---|---|---|---|
| Protocol versions | 70016 | 70016 | 70015 |
| User agents | /Satoshi:25.0.0/ | /Satoshi:26.0.0/ | /Satoshi:0.20.1/ |
| Block height | 811934 | 811935 | 811935 |
| City | Singapore | Cardiff | Tokyo |
| Country code | SG | GB | JP |
| Latitude | 1.2868 | 51.4866 | 35.6893 |
| Longitude | 103.8503 | −3.1549 | 139.6899 |
| Time zone | Asia/Singapore | Europe/London | Asia/Tokyo |
| ASN | AS132203 | AS8075 | AS396982 |
| Network operators | Tencent building | MICROSOFT | GOOGLE-CLOUD |
Network environment
The distribution configuration is based on the Bitnodes dataset, which covers multiple regions including Europe, North America, South Asia, Africa, Oceania, and China, and the nodes are categorized into 10 clusters, with regular nodes within the clusters using unstructured connections, and tagged nodes between the clusters using DHT structured links; The delay configuration is based on the iPlane43 dataset so that it can accurately reflect the network performance between different geographical regions, as shown in (Table 4). In addition, we set the intra-region link delay to 150 ms to simulate the common delay situation in real networks and provide a more realistic simulation environment; The bandwidth configuration data is taken from the Speedtest.net44 dataset to ensure that the bandwidth differences between nodes in reality are reflected in the simulations. The key algorithms related to this model have been uploaded to GitHub. The repository can be accessed at https://github.com/topstart/FPSblo-EP.
Table 4.
Sample intercluster delay of bitnodes.
| Source | Target | Target IP | RTT_MAX (ms) | RTT_MIN (ms) | RTT_AVG (ms) |
|---|---|---|---|---|---|
| SA | EU | 116.202.226.159 | 114.327 | 112.071 | 112.361 |
| OC | EU | 95.217.9.184 | 288.565 | 285.808 | 286.112 |
| AF | NA | 209.133.220.74 | 229.612 | 224.499 | 224.666 |
| OC | NA | 76.169.91.52 | 250.333 | 155.385 | 166.406 |
| CN | NA | 104.200.25.118 | 242.404 | 238.972 | 239.137 |
| AS | CN | 47.108.51.51 | 129.864 | 129.136 | 129.302 |
| AF | CN | 47.75.201.114 | 281.635 | 280.426 | 280.519 |
| SA | CN | 122.51.104.28 | 374.968 | 347.831 | 371.638 |
Efficiency of message coverage
Broadcast Convergence Delay. To be on fairness, the transmission degrees of the FPSblo-EP and KADCAST models were set to be the same, at 16. In FPSblo-EP, the proportion of neighboring node types can be configured and denoted as FPSblo-EP (Nmu_Mn, Num_Cn). Figure 11 shows the average time taken for FPSblo-EP(0, 16), FPSblo-EP(8, 8), FPSblo-EP(16, 0), and KADCAST to achieve network coverage from 0 to 1. Analyzing the coverage delay under different models or modes when the coverage rate reaches 0.9, FPSblo-EP(0, 16) has the shortest delay, approximately 1677ms; KADCAST has the most extended delay, approximately 2941ms; FPSblo-EP(8, 8) and FPSblo-EP(8, 8) have delays of approximately 2455ms and 2819ms, respectively. Compared to KADCAST, they reduce by approximately 45.0, 16.5, and 4.1%.
Fig. 11.

Comparison of average coverage delay.
The reduction in coverage delay is mainly attributed to FPSblo-EP’s physically location-aware hierarchical transmission structure. In FPSblo-EP(0, 16) mode, the source node does not initially forward the message to tagged nodes but relies on flooding transmission, gradually spreading from within the cluster to the outside. This highlights the advantage of flooding transmission in message dissemination and introduces a significant amount of redundancy. In FPSblo-EP(16, 0) mode, the source node first sends the message through tagged nodes to the tagged node layer using a distributed hash table method for transmission. Initially, its effect was similar to that of KADCAST mode, and due to the smaller number of nodes in the tagged node layer, the initial coverage efficiency could be better than that of KADCAST. However, as the message spreads to other clusters, it resumes flooding transmission. Therefore, the coverage rate increases rapidly in the mid-term, reaching a 0.9 coverage rate ahead of KADCAST.
Transmission redundancy
Taking the example of reaching 1000 nodes within a single cluster, a box plot statistical analysis of the number of messages received and forwarded by each node after a single network-wide broadcast is shown in (Fig. 12).
Fig. 12.

Comparison of transmission redundancy.
From the analysis in the previous section, it is evident that in FPSblo-EP(0, 16) mode, nodes prioritize forwarding within the cluster using flooding when receiving messages. Although the model employs a method of marking transmission paths to reduce duplicate transmissions, this only reduces redundancy originating from the same tree root. Therefore, the redundancy level remains relatively high when using this method. As the proportion of regular nodes in the forwarding neighbor selection within the cluster decreases, the redundancy also decreases. When using FPSblo-EP(16, 0) for message forwarding, the transmission redundancy is already lower than that of the KADCAST model. As analyzed in the previous section, the coverage delay of this mode is lower than that of KADCAST but still higher than the highest delay among FPSblo-EP models.
Load balancing
Figure 12 also reflects the load-balancing situation of the two models. The graph shows that the upper and lower quartiles of the message reception quantity box plot for KADCAST are 9 and 3, respectively, with an upper whisker length of 9. In contrast, for FPSblo-EP, regardless of the three modes, the box plots and the lengths of the upper and lower whiskers are shorter, indicating a more concentrated load distribution. Taking FPSblo-EP (0, 16) mode as an example, the upper and lower quartiles of the box plot are 13 and 9, respectively, with the upper whisker length only being 1. As analyzed in the previous section, the high transmission redundancy in this mode results in a higher load. However, compared to KADCAST, FPSblo-EP(16, 0) has a narrower box plot of load quantity and does not exhibit long upper or lower whiskers, indicating a more balanced load distribution. Similar box plot shapes are observed for other configurations of FPSblo-EP transmission. This indicates that FPSblo-EP transmission models maintain a relatively good load-balancing state under various configurations.
Additionally, dynamic experimental testing was conducted. The number of tagged nodes (Num_Mn) within a cluster was set to 2, denoted as Mn-1 and Mn-2. Initially, Node 1 was responsible for receiving messages from regular nodes within the cluster. The number of regular nodes (Num_Cn) increased linearly from 500 to 1500, with a single task packet size of 512 bytes, and the arrival rate of tasks (α) increased linearly from 1000 to 5000 per second. The average response time of Mn-1 and Mn-2 was recorded, and the results are shown in Fig. 13. Mn-1 was already overloaded in the graph, but the number of nodes within the cluster had not yet reached the threshold for triggering cluster splitting. Therefore, the regular nodes within the cluster switched the message outlet to Mn-2. It was not until time T2, when the conditions were met that cluster splitting was triggered, and the response times of Mn-1 and Mn-2 returned to normal.
Fig. 13.

Effectiveness of inter-cluster load balancing policy for FPSblo-EP model.
Scalability
This experiment validates the scalability of the network by measuring the network stretch factor under different network scales. The stretch factor represents the relationship between the actual transmission distance between nodes and the shortest distance. The experiment analyzes the Round-Trip Time (RTT) as a distance indicator, which can be used to measure the degree of topological matching in the network. The graph compares average hops, RTT, and stretch factors between FPSblo-EP and KADCAST under different node scales.
FPSblo-EP uses a two-layer transport structure, where a smaller number of tagged nodes form a tagged layer with structured connections, and a larger number of regular nodes form a regular layer with unstructured connections, without a strict topology, resulting in lower maintenance overhead and strong robustness. The KADCAST model, which is the subject of our experimental comparison, is fully structured, and thus our model does not add extra overhead compared to it for the same network size.
In Fig. 14, the grey bars compare the average hops between KADCAST and FPSblo-EP in the logical topology. It can be observed that the average hops in FPSblo-EP are higher than KADCAST by approximately 12.2%. This is attributed to FPSblo-EP’s dual-layer transmission structure, which often leads to more forwarding hops due to deeper transmission hierarchy divisions. However, an increase in hops does not necessarily imply an increase in communication latency. The purple bars in Fig. 13 show that comparing average RTT in different node scales between the two models indicates that FPSblo-EP reduces the average RTT in the logical layer by 27.6% compared to KADCAST. Therefore, FPSblo-EP models exhibit better stretch factors under different configuration modes, with a mean value of 1.26, indicating superior awareness of physical topology compared to the KADCAST model.
Fig. 14.
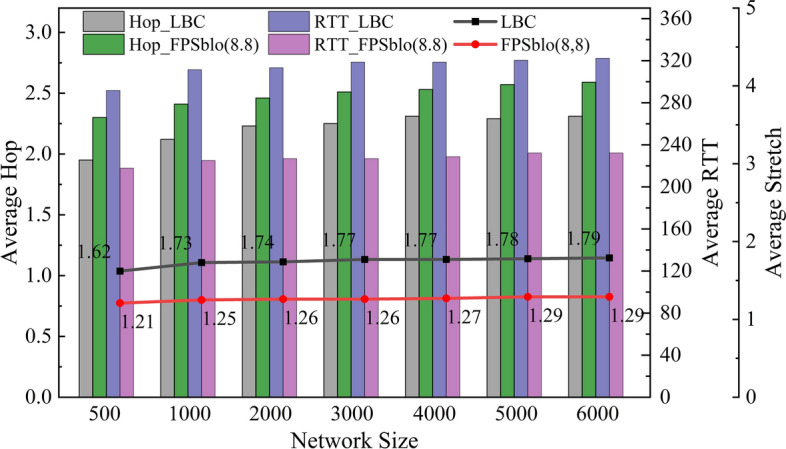
Comparison of query hop count, query latency and stretch factor.
Reliability
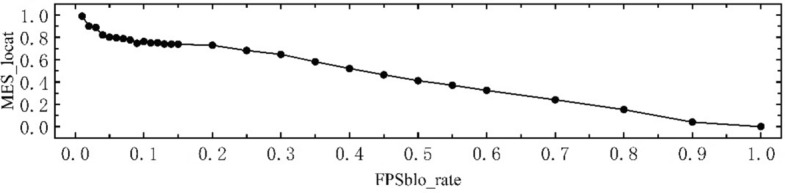
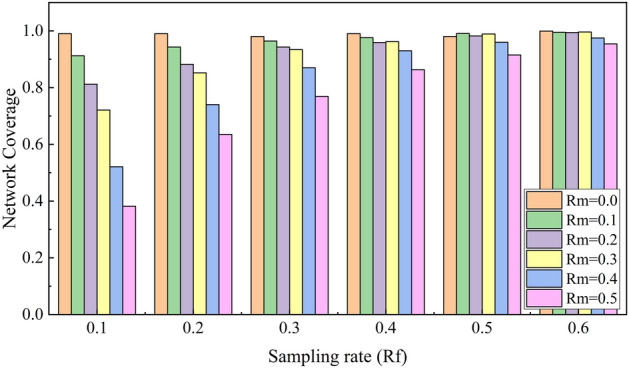
In the reliability experiments, we configured several nodes so that they would not forward messages upon receiving them, simulating dropout and packet loss behavior. This quantity, denoted as Rm, represents a proportion of the total number of nodes in the network. Additionally, we configured different levels of FPSblo-EP sampling rates, denoted as Rf. The relationship between these two factors is illustrated in (Fig. 15). Due to the convergence of FPSblo-EP transmission, when the network is not always stable for all nodes, the final network coverage rate can still approach 1. As the proportion of dropout nodes increases, the network coverage rate decreases. However, when the FPSblo-EP sampling rate exceeds 0.3, and the proportion of nodes with transmission failure is less than 0.3, the network information coverage rate can still reach 0.9. This is attributed to the effective further dissemination of information by the FPSblo-EP model in the early stages, enhancing the system’s reliability.
Fig. 15.
Relationship between FPSblo-EP node forwarding failure rate and sampling rate.
Conclusions
This study aims to enhance the transmission performance, i.e., scalability, of blockchain P2P networks by designing a hierarchical transmission model. Firstly, the distribution of network nodes and connectivity in existing blockchains is examined, explaining the scale-free nature of current blockchain networks. Subsequently, a hierarchical transmission topology structure called FPSblo-EP, based on geographic location awareness, is proposed. This model utilizes the FPS algorithm to sample nodes’ geographical locations and degrees as different dimensions to obtain tagged nodes and regular nodes. Further clustering is performed from top to bottom based on geographical location, addressing the topological mismatch issue in blockchain P2P networks. Moreover, the FPSblo-EP algorithm employs a sparse representation before clustering, reducing the resource consumption associated with traditional clustering. Experimental analysis is then conducted, showing that compared to the KADCAST model, FPSblo-EP reduces coverage delay by approximately 22%, redundancy by around 26%, and network stretch factor by 28%. It exhibits better load balancing capabilities and maintains network reliability.
Author contributions
The authors confirm contribution to the paper as follows: study conception and design: Longle Cheng, He Zhao; data collection: Xiru Li, Munan Yuan; analysis and interpretation of results: Longle Cheng, Wansh Pan; draft manuscript preparation: Longle Cheng; project administration: Haibo Tan, Xiaofeng Li. All authors reviewed the results and approved the final version of the manuscript.
Funding
This present research work was supported by the National Key R&D Program of China (No. 2021YFB2700800).
Data availability
The data used to support the findings of this study are included within the article.
Declarations
Competing interests
The authors declare no competing interests.
Footnotes
Publisher’s note
Springer Nature remains neutral with regard to jurisdictional claims in published maps and institutional affiliations.
Contributor Information
Haibo Tan, Email: hbtan@hfcas.ac.cn.
Munan Yuan, Email: mnyuan@hfcas.ac.cn.
References
- 1.Choi, T. M., Kumar, S., Yue, X. & Chan, H. L. Disruptive technologies and operations management in the industry 4.0 era and beyond. Prod. Oper. Manag.31, 9–31 (2022). [Google Scholar]
- 2.Dowling, M. Is non-fungible token pricing driven by cryptocurrencies?. Finance Res. Lett.44, 102097 (2022). [Google Scholar]
- 3.Feng, C. et al. Blockchain-based cross-domain authentication for intelligent 5g-enabled internet of drones. IEEE Internet Things J.9, 6224–6238 (2021). [Google Scholar]
- 4.Karim, S., Lucey, B. M., Naeem, M. A. & Uddin, G. S. Examining the interrelatedness of NFTs, DeFi tokens and cryptocurrencies. Finance Res. Lett.47, 102696 (2022). [Google Scholar]
- 5.Leng, J., Zhou, M., Zhao, J. L., Huang, Y. & Bian, Y. Blockchain security: A survey of techniques and research directions. IEEE Trans. Serv. Comput.15, 2490–2510 (2020). [Google Scholar]
- 6.Wang, P., Mou, S., Lian, J. & Ren, W. Solving a system of linear equations: From centralized to distributed algorithms. Annu. Rev. Control.47, 306–322 (2019). [Google Scholar]
- 7.Amirkhani, A. & Barshooi, A. H. Consensus in multi-agent systems: a review. Artif. Intell. Rev.55, 3897–3935 (2022). [Google Scholar]
- 8.Zheng, Y. & Liu, Q. A review of distributed optimization: Problems, models and algorithms. Neurocomputing483, 446–459 (2022). [Google Scholar]
- 9.Li, T., Wang, H., He, D. & Yu, J. Blockchain-based privacy-preserving and rewarding private data sharing for IoT. IEEE Internet Things J.9, 15138–15149 (2022). [Google Scholar]
- 10.Deepa, N. et al. A survey on blockchain for big data: Approaches, opportunities, and future directions. Futur. Gener. Comput. Syst.131, 209–226 (2022). [Google Scholar]
- 11.Sanka, A. I. & Cheung, R. C. A systematic review of blockchain scalability: Issues, solutions, analysis and future research. J. Netw. Comput. Appl.195, 103232 (2021). [Google Scholar]
- 12.Le, T. V. & Hsu, C. L. A systematic literature review of blockchain technology: Security properties, applications and challenges. J. Internet Technol.22, 789–802 (2021). [Google Scholar]
- 13.Abd Ali, S. M., Yusoff, M. N. & Hasan, H. F. Redactable blockchain: Comprehensive review, mechanisms, challenges, open issues and future research directions. Futur. Internet15, 35 (2023). [Google Scholar]
- 14.Ucbas, Y., Eleyan, A., Hammoudeh, M. & Alohaly, M. Performance and scalability analysis of ethereum and hyperledger fabric. IEEE Access11, 67156–67157 (2023). [Google Scholar]
- 15.Croman, K. et al. On scaling decentralized blockchains: (a position paper). In International conference on financial cryptography and data security, 106–125 (2016).
- 16.Alshahrani, H. et al. Sustainability in blockchain: A systematic literature review on scalability and power consumption issues. Energies16, 1510 (2023). [Google Scholar]
- 17.Kalajdjieski, J., Raikwar, M., Arsov, N., Velinov, G. & Gligoroski, D. Databases fit for blockchain technology: A complete overview. Blockchain. Res. Appl.4, 100116 (2023). [Google Scholar]
- 18.Aldoubaee, A., Hassan, N. H. & Rahim, F. A. A systematic review on blockchain scalability. Int. J. Adv. Comput. Sci. Appl.10.14569/IJACSA.2023.0140981 (2023). [Google Scholar]
- 19.Decker, C. & Wattenhofer, R. Information propagation in the bitcoin network. In IEEE P2P 2013 Proceedings, 1–10 (2013).
- 20.Donet Donet, J. A., Pérez-Sola, C. & Herrera-Joancomartí, J. The bitcoin p2p network. In International conference on financial cryptography and data security, 87–102 (2014).
- 21.Aoki, Y. & Shudo, K. Proximity neighbor selection in blockchain networks. In 2019 IEEE International Conference on Blockchain, 52–58 (2019).
- 22.Santiago, C. & Lee, C. Accelerating message propagation in blockchain networks. In 2020 International Conference on Information and Communication Technology Convergence (ICTC), 157–160 (2020).
- 23.Huang, J., Tan, L., Mao, S. & Yu, K. Blockchain network propagation mechanism based on p4p architecture. Secur. Commun. Netw.2021, 1–12 (2021). [Google Scholar]
- 24.Berendea N, Mercier H, Onica E, et al. Fair and Efficient Gossip in Hyperledger Fabric, In 40th IEEE International Conference on Distributed Computing Systems (ICDCS), 190–200 (2020).
- 25.Shaleva A, & Korkhov V. Evaluation of the Neo P2P Blockchain Network Protocol Efficiency, In 21st International Conference on Computational Science and Its Applications (ICCSA), 56–71 (2021).
- 26.Team H. Harmony Technical Whitepaper Version 2.0. (2019).
- 27.Gratzer F, Gallenmüller S, Scheitle Q. Quic-quick udp internet connections. Future Internet and Innovative Internet Technologies and Mobile Communications, (2016).
- 28.Luu, L. et al. A secure sharding protocol for open blockchains. In Proceedings of the 2016 ACM SIGSAC Conference on Computer and Communications Security, 17–30 (Association for Computing Machinery, Vienna, Austria, 2016).
- 29.Karp H, Melbardis R. Nexus Mutual: A peer-to-peer discretionary mutual on the Ethereum blockchain. Whitepaper https://nexusmutual.io/assets/docs/nmx_white_paperv2_3. pdf. (2017).
- 30.Egevang K, Francis P. The IP network address translator (NAT), (1994).
- 31.Zahoor, K. et al. Multicast at edge: An edge network architecture for service-less crowdsourced live video multicast. IEEE Access9, 59508–59526 (2021). [Google Scholar]
- 32.Fadhil, M., Owenson, G. & Adda, M. Locality based approach to improve propagation delay on the bitcoin peer-to-peer network. In 2017 IFIP/IEEE Symposium on Integrated Network and Service Management (IM), 556–559 (2017).
- 33.Hao, W. et al. Blockp2p: Enabling fast blockchain broadcast with scalable peer-to-peer network topology. In Green, Pervasive, and Cloud Computing: 14th International Conference, GPC 2019, May 26–28, 2019, Proceedings 14, 223–237 (2019).
- 34.Baniata, H., Anaqreh, A. & Kertesz, A. Dons: Dynamic optimized neighbor selection for smart blockchain networks. Futur. Gener. Comput. Syst.130, 75–90 (2022). [Google Scholar]
- 35.Li, J. et al. Mandala: A scalable blockchain model with mesh-and-spoke network and h-pbft consensus algorithm. Peer-to-Peer Netw. Appl.16, 226–244 (2023). [Google Scholar]
- 36.He X, Cui Y, Jiang Y, et al. An Improved Gossip Algorithm Based on Semi-Distributed Blockchain Network. In International Conference on Cyber-Enabled Distributed Computing and Knowledge Discovery (CyberC), 24–27 (2019).
- 37.Yu, B. et al. A scalable blockchain network model with transmission paths and neighbor node subareas. Computing104(10), 2253–2277 (2022). [Google Scholar]
- 38.Huy V, Tewari H. An efficient peer-to-peer Bitcoin protocol with probabilistic flooding. (2019).
- 39.Rohrer E, Tschorsch F, Assoc Comp M. KADCAST: A Structured Approach to Broadcast in Blockchain Networks, In 1st ACM Conference on Advances in Financial Technologies (AFT), 199–213 (2019).
- 40.Eldar, Y., Lindenbaum, M., Porat, M. & Zeevi, Y. Y. The farthest point strategy for progressive image sampling. IEEE Trans. Image Proc.6, 1305–1315 (1997). [DOI] [PubMed] [Google Scholar]
- 41.Natrevali, A. & Haskell, B. Digital pictures: Representation and compression (Plenum Press, 1988). [Google Scholar]
- 42.Bitnodes. (accessed 2 February 2018); http://bitnodes.io
- 43.Madhyastha, H. V. et al. iplane: An information plane for distributed services. In Proc. 7th symposium on Operating systems design and implementation, 367–380 (2006).
- 44.Speedtest. (accessed 23 January 2020); https://www.speedtest.net/global-index
Associated Data
This section collects any data citations, data availability statements, or supplementary materials included in this article.
Data Availability Statement
The data used to support the findings of this study are included within the article.