

Abstract
Despite seemingly inexorable imminent risks of food insecurity that hang over the world, especially in developing countries like Pakistan where traditional agricultural methods are being followed, there still are opportunities created by technology that can help us steer clear of food crisis threats in upcoming years. At present, the agricultural sector worldwide is rapidly pacing towards technology-driven Precision Agriculture (PA) approaches for enhancing crop protection and boosting productivity. Literature highlights the limitations of traditional approaches such as chances of human error in recognizing and counting pests, and require trained labor. Against such a backdrop, this paper proposes a smart IoT-based pest detection platform for integrated pest management, and monitoring crop field conditions that are of crucial help to farmers in real field environments. The proposed system comprises a physical prototype of a smart insect trap equipped with embedded computing to detect and classify pests. To this aim, a dataset was created featuring images of oriental fruit flies captured under varying illumination conditions in guava orchards. The size of the dataset is 1000+ images categorized into two groups: (1) fruit fly and (2) not fruit fly and a convolutional neural network (CNN) classifier was trained based on the following features: (1) Haralick features (2) Histogram of oriented gradients (3) Hu moments and (4) Color histogram. The system achieved a recall value of 86.2% for real test images with Mean Average Precision (mAP) of 97.3%. Additionally, the proposed model has been compared with numerous machine learning (ML) and deep learning (DL) based models to verify the efficacy of the proposed model. The comparative results indicated that the best performance was achieved by the proposed model with the highest accuracy, precision, recall, F1-score, specificity, and FNR with values of 97.5%, 92.82%, 98.92%, 95.00%, 95.90%, and 5.88% respectively.
Keywords: Internet of Things, Smart insect trap, Machine learning, Deep learning
Subject terms: Engineering, Electrical and electronic engineering
Introduction
If agricultural pests or insects are not properly controlled, they can spread like a plague. Farmers, cities, and eventually nations suffer significant loss and destruction as a result of destroying everything from gardens to entire fields, orchards, and standing crops1. To combat these harmful and destructive pests and protect crops from any potential harm, an Integrated Pest Management Program (IPMP) is used. Pests that are not monitored and controlled can harm both the economy and agriculture2.
The first impression that comes to mind when pests in agriculture are discussed, is that of fields or crops destroyed by weeds, insects, or rats. However, some bugs are also harmful to human health because they spread allergens that irritate those people who have delicate medical conditions3,4. Contrarily, mosquitoes, who thrive in stagnant water and are the cause of dengue disease, harm human health in addition to crops when they are not properly monitored and managed. Pests directly prey on endemic animals, harming plants and upsetting the balance of the ecosystem by reducing or eradicating their prey5. A loss in water quality, an increase in soil erosion and land degradation, and the eradication of native plants that give food and shelter to local species or those that are indigenous to the area are all consequences of pests affecting the habitat of creatures and natural resources6,7.
The locust swarm reached its pinnacle in the Punjab region of Pakistan in the past couple of years, which contributed to the loss of crops and ultimately the destruction of the economy. Many crops have been severely harmed by the swarm, resulting in financial losses, and individuals have been impacted by having less food8,9. Therefore, a swarm of insects could completely undo a season’s worth of planting and meticulous nurturing, resulting in drastic monetary losses.
However, the need for smart traps is increasing in a way that they prove their efficacy in reducing destructive and unpredictable conditions for fields. Smart traps can reduce the dependency of farmers on pesticides that are harmful to human health and the environment10,11. It has now become feasible to remotely monitor, report, and even treat insects and pests of all types in any location in the globe, thanks to the development of key technologies of the fourth industrial revolution, such as Artificial Intelligence (AI), Internet of Things (IoT), 5G/6G, and embedded cyber-physical systems12,13.
This research work focuses on the oriental fruit fly (Bactrocera dorsalis) which is found in at least 65 countries of the World with a widespread presence in Pakistan, India, and Sri Lanka. The pest is highly invasive and has a high reproductive rate. This pest also can disperse rapidly and target a broad range of fruits14,15. If not properly managed, this pest can have serious environmental and economic implications. The best possible way to monitor fruit flies is through secured data collection, analysis, and reporting throughout the year16-18. Precision Agriculture for pest management requires constant monitoring of the target pest population as well as continuous evaluation of environmental conditions like temperature and humidity19. Currently, pests are monitored by trapping them in pheromone-based glue traps which are available commercially and can draw insects even when they are present in extremely low numbers as shown in Fig 1. Here, each insect can be observed by the farmer to determine whether it is a codling moth using routine in-field inspections or even low-tech wireless cameras. This procedure is not as intelligent as an IoT solution might be6. Also, this approach is prone to certain innate limitations such as (1) chance of human error in recognizing and counting pests, (2) requirement of trained labor, and (3) inefficiency (oftentimes the traps are observed too late). Therefore, this paper proposes and develops a cost-effective pest management solution that can be deployed in a field to detect and recognize pests. The developed system achieves accuracy as high as 97.50% to detect, recognize, and count pests by utilizing ML and DL algorithms. The proposed pest management solution also provides a secure end-to-end communication system for safe and secure communication of information.
Fig. 1.
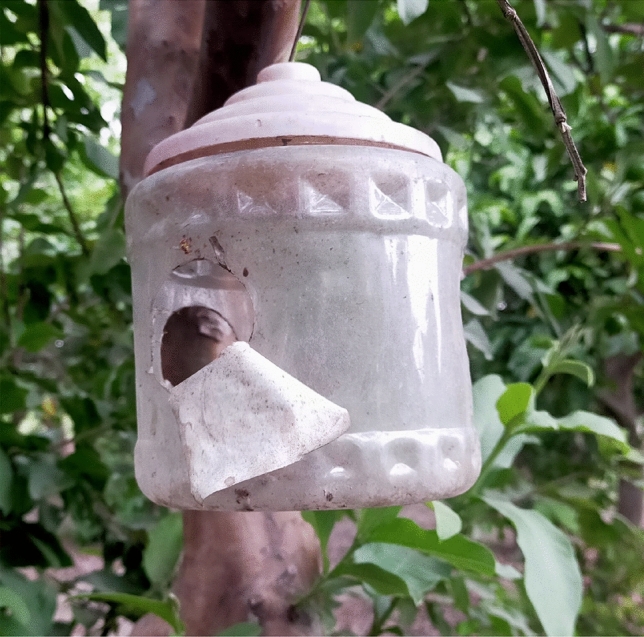
Traditional pests trap where pests are monitored by trapping them in pheromone-based glue traps and include manual scouting.
There are several factors and facts that have resulted in motivating this research work. These can be summarized as follows:
The growing interest expressed by existing agricultural companies, government departments, and agencies in developing systems for secure tele-farming to be deployed at a large scale. These systems shall be autonomous AI based systems.
The lack of existence of publicly available well-structured pests-related datasets for the research community to benefit from, such dataset could serve as a basis to develop ML models to promptly detect, localize, categorize, and treat pests.
From the literature, it has been reported that the existence of such data records is available only in traces. Therefore, there is a need for the collection and analysis of data in real-time to ensure that best practices are executed and control measures are taken promptly.
The development of a secure IoT enabled smart trap will increase awareness about Pakistan’s most deadly pests’ population trends. Farmers and other stakeholders would benefit from having a better understanding of the types of pests that are active during certain seasons and certain regions of the country.
The contributions of this paper are summarized as follows:
Comprehensive review of the recent and most relevant work related to pests management and the application of ML techniques in the area of Precision Agriculture.
The design of a low-cost smart IoT-based pest detection platform for integrated pest management and monitoring crop field conditions, such platforms are helpful to farmers in a real field environment for the optimization of inputs and treatments.
Pests related dataset creation for the wide research community to benefit from.
The development of a ML model for pests management, such model is trained on the collected dataset, the proposed system is expected to analyze and classify pests in a real-time fashion to increase the efficiency of the actions taken by farmers and authorities.
Experimental analysis and comparative study of the proposed model.
In contrast to existing available work that depends on static traps or limited ML models and often lack structured pest datasets, this paper integrates IoT-enabled pest detection system and advanced CNN and You Only Look Once version 8 (YOLOv8) models, by significantly improving pest detection accuracy in real field conditions. In addition to addressing the scarcity of structured pest datasets, the proposed solution also offers farmers a scalable, cost-effective solution that enhances pest management techniques and helps in more efficient use of agricultural inputs. Furthermore, this research work is notable for its creation of a publicly accessible dataset that will facilitate further research and advancements in the precision agriculture sector.
The structure of this paper is as follows. Section Literature review provides a literature review that addresses the previous works done for the same purpose and how successful these works were in achieving their goals and results. We will focus on how our work is different from the work previously done. Section Materials and methods presents the research methodology which explains the theoretical tools and algorithms developed to achieve the research objectives. Section Results presents the results obtained and also discusses their significance, accuracy, and performance. Section Conclusion concludes the paper and highlights possible future extensions and directions based on the work presented.
Literature review
This section illustrates the related literature on pest management, PA, IoT, and ML. Also, the state-of-the-art frameworks, as well as mechanisms for developing a framework for the smart trap, and various techniques for the communication of information are discussed.
In20, the authors suggest how smart traps using visual imaging are becoming popular and the need for them is growing day by day. These traps are now available commercially and many companies are making intelligent traps with increasing efficiency. The authors have summarized the work of many researchers to obtain insights about pests’ details, how in old times farmers used to handle the pests’ destruction, and how smart traps were developed with the passage of time. The authors also addressed the question of whether mobile traps work best or stationary traps for insects, but could not conclude the findings related to the conjecture due to cost restrictions for trap mobility in fields. Through simulations, authors showed that a single trap moving in a circular orbit gave a high capture rate with the trap speed. Hence, the main purpose of the paper was to help in designing and developing an advanced smart trap that could be helpful for companies designing traps, and also for the workers working in pest management. By reviewing all the details of traps i.e., weather conditions, crop load, cost of the project, and information on pests, the trap developing companies can make decisions easily to develop a trap that can catch, count, and forward alarms efficiently. The authors, by concluding this paper, deduce that with different possible ways, the traps could be so smart that they could help us get food supplies that are less harmful and low-priced.
In21, the authors discussed mimicking human learning and memory patterns for maintaining better performance on new and old tasks, owing to the human ability to accumulate knowledge and alleviate forgetting. The authors proposed an Artificial Neural Network (ANN) based continual classification method via memory storage and retrieval, with two benefits that are: Fewer data requirements and higher flexibility. These benefits are obtained by combining CNN and Generative Adversarial Network (GAN). For fewer data, the metric learning model based on CNN reduces data by minimizing image difficulty and annotation, which was helpful in classification and pattern recognition. The other benefit of high flexibility is achieved by a combination of CNN and GAN models, which are explained in detail in22-24. The extraction of important data from old tasks and the generation of abstracted images as a memory for future tasks was achieved by GAN. So, the modified continual model (pest and plant classification), solved the forgetting problem and achieved good performance and high efficacy. The authors assured that the proposed method could be helpful in different fields and applications starting from agricultural areas to more departments developing more intelligent devices like robots, and smart traps for fruit picking and identifying diseases and pests respectively25. The study’s primary limitations are the instability and training complexity of the GAN component, in contrast to the more stable and straightforward implementation of the CNN model. The GAN’s instability and training challenges may compromise the model’s overall performance.
In26,27, the authors presented DeepPest, a cascaded convolutional neural network architecture as an approach for the detection of small objects. DeepPest is a two-stage mobile vision technique that uses extensive multi-species pest data for automatic in-field pest recognition and detection. In the first stage, a context-aware attention network is built with multi-scale information for purpose of primary crop category classification. In the second stage, a multi-projected pest detection architecture is trained using these crop-categorized images to increase the effectiveness of in-field pest detection using super-resolved feature extraction. While this method accurately detects small pests, it may not work as well with larger size pests due to the limited impact of contextual information. In28, the authors presented crop pest recognition method by using several deep convolutional neural networks for accurately identifying ten common species of crop pests. The main contributions were a validated crop pest dataset that is shared, a fine-tuned GoogLeNet model proposed for better pest classification in agricultural contexts, and a 6.22% performance improvement over the state-of-the-art method.
The authors in29 used a three-model approach to recognize and categorize insects. The first one was an invariant local feature model that was extracted using the Hessian-Affain detector. The second approach was a global feature model, which makes use of k-means clustering and an Euclidian distance metric to determine the hue value of each point to two clusters. The third involved a hierarchical combination with two levels, with the first level being the selection of the best performance classifier for global features. When a threshold value for classification probability was found, the samples moved on to the second level, where the highest performing classifier for local characteristics was chosen. The outcomes are based on the third method, which achieved a maximum accuracy of 96.9% in the first level using Normal Densities Based Linear Classification and Nearest Mean Classifier for the second level, with 71.3% accuracy. Together, these methods produced a 96.9% correct classification rate on lab-acquired images. Applying the same third method in the field conditions yielded a 65.5% correctly classified accuracy. This research work identified white fly insects found in adhesive-surfaced traps30. The image was first converted to gray scale and then the Sobel edge detector filter was applied to extract the image’s magnitude gradient. After that, a binary image was created using the Otsu algorithm. To remove isolated spots from the image, a 3  3 median filter was applied to the whole image. The segmented objects’ area, center of mass, eccentricity, and solidity were extracted at the end of the segmentation process. These features were used to group the objects into clusters, one of which was made up of features that represent white flies. The average accuracy was 97%.
In31, the goal was to identify white flies and aphids in adhesive traps as well. The samples used were 21  21 pixel images that fall into three categories: background images of the trap (that do not include any insects), aphid images, and white fly images. Three different feature extraction techniques i.e., colors, Gabor filters, and Pyramidal Histogram of Gradients (PHOG) were employed in the identification process. The final classification was done with Support Vector Machine (SVM), using Radial Basis Function kernel (RBF) for PHOG and color features, while linear kernel for Gabor filters. As a result, 91.8% of aphids and 98.5% of white flies were detected. In contrast to the research works cited29,30, the proposed model does not rely on the explicit feature extraction from the image processing. Instead, it utilizes the entire image to identify the flies. This approach not only simplifies the model but also enhances its adaptability to different kinds of insects. In32,33, an IoT-enabled pest detection and classification model employing YOLOv3 is presented. The CNN Long Short-Term Memory Networks (CNLSTM) classifier receives the images after they have been extracted by CNN. In addition, hyper parameter optimization is done using the Adaptive Honey Badger Algorithm (AHBA) model.
In34, the authors presented a novel approach for the identification of two species of fruit flies (Ceratitis capitata and Grapholita molesta) which could be helpful for the monitoring of insect populations in the intelligent traps in the fields. A digital image processing technique was used to detect the pests and for the classification of these pests into the right class, ANN was used. Different CNN architectures were used, with various configurations for the training purpose on the dataset of images captured in the fields. In this paper, the highest precision of 93.55% and 91.28% for the classification of the fruit flies Ceratitis capitata and Grapholita molesta, respectively and the lower time required for the classification was achieved by ResNet18 and SqueezeNet.
The same topic has also been studied in many other references. Table 1 captures a brief summary of most recent work related to pest detection in terms of model description and reported performance results.
Table 1.
Literature review
| References | Description | Model applied technique | Top performance |
|---|---|---|---|
| Kasinathan et al.35 | High classification rates of pest detection in Machine Learning techniques compared to traditional pest detection techniques. IP102 datasets used a pest detection algorithm that consists of foreground extraction and contour identification to detect pests | Convolutional Neural Network (CNN) | For 9 and 24 class insects the Maximum classification rate of 90% and 91.5% was achieved |
| Albanese et al.36 | Research focus was autonomous detection of pest infestation in orchard fruits. Regular pest detection and enhanced embedded low-power sensing system and neural accelerator capture and process the image in pheromone-based traps | Deep Neural Network (DNN) | Pest infestation detection task was automated for unlimited time and no farmer intervention was required |
| Suto et al.37 | Described the identification, detection, and counting of insects in agricultural pest management. A microcontroller board OpenMV Cam H7 which easily implicated the application using machine vision in real and embedded system-based insect trap | Deep Learning Based Insect Counting Algorithm | Pests counting and spraying methods were accurately scheduled |
| Chen et al.38 | A detecting drone used to take the image of the pest and recognize T, papillosa in the orchard tree and its position through YOLOv which was built on NVIDIA Jetson TX2 and embedded system | Tiny-YOLOv3 neural network model | Drone sprayed the pesticides on the exactly desired spots |
| Thenmozhi et al.39 | Focused on the classification of crop insects using machine vision and knowledge-based techniques. Features like texture, color, shape, histogram of oriented gradients (HOG), and global image descriptor (GIST) were used in the classification of pests. A 10-fold cross-validation test was conducted to achieve a better classification and identification of insects | Base classifiers (Naive Bayes, support vector machine and K-nearest-neighbor) and ensemble classifiers (random forest, bagging, and XGBoost) | Classification accuracy improved in the combination of texture, color, shape, HOG, and GIST features |
| Xiao et al.40 | Developed a pest identification network that combines deep learning and hyper spectral imaging technology for accurate pest control, paper discussed the limitations of traditional algorithms by utilizing one-dimensional convolution and attention mechanism to extract spectral features efficiently | Deep learning | Experimental results showed maximum suitability and accuracy for pest identification compared to other methods |
| Markovic et al.41 | Monitored and predicted the presence of pest insects using cameras and sensor devices. Machine Learning models predicted the presence of pests which was based on temperature, humidity, and weather | ML algorithms | The affected detection accuracy was 86.3% and false detection percentage was 11% |
Proposed system architecture
Considering the smart trap network, our proposed system architecture is as shown in Fig. 2. The proposed system architecture consists of pheromones, a Raspberry Pi, a Pi camera, a DC fan (to clean the trap when required), and an led bulb (as an illumination source) present inside a smart trap. Pheromones are insect attractants and are in liquid form chemicals (in the present case 85% methyl eugenol, 10% sugar, and 5% DDVP). They are mixed and dispensed on cotton to serve as a male sex attractant. The range of fragrance of pheromones is 500m and depends on the direction of the wind. After being attracted to the smell of that pheromone, the insects get stuck with the sticky surface so that the Pi camera automatically takes pictures of the insects, and stores them on raspberry pi (local storage). So, in order to analyze the images captured and to detect the pest fruit flies, the machine learning technique of convolutional neural network is applied. The performance of the proposed system is evaluated on the basis of CNN and YOLOv8 to determine which one performs the best. Here the cloud server (Firebase storage) stores the pest’s images and also counts their numbers inside the image. The number count of pests will then be sent to the real-time database (Firebase database) along with the date and time the image was taken. The smart trap is waterproof to protect it from the sun and rain. A 4G USB dongle is installed in the smart trap for transmission of the pest’s image and other calculated data to a cloud server. A solar panel provides power to all devices. As a result, the proposed system monitors and captures the pests efficiently. Also, the synthetic version of pheromones plays an active part in collecting pests towards the trap and also effectively traps the pests for control.
Fig. 2.

Intelligent smart trap architecture consists of pheromones, a Raspberry Pi, a Pi camera, a DC fan, and an LED bulb present inside a smart trap for monitoring and capturing the pests.
The complete system is shown in Fig. 3, which performs Machine Learning-based categorization at the edge device and transmits the findings to the stakeholders via the cloud, i.e., the Google Firebase real-time database.
Fig. 3.
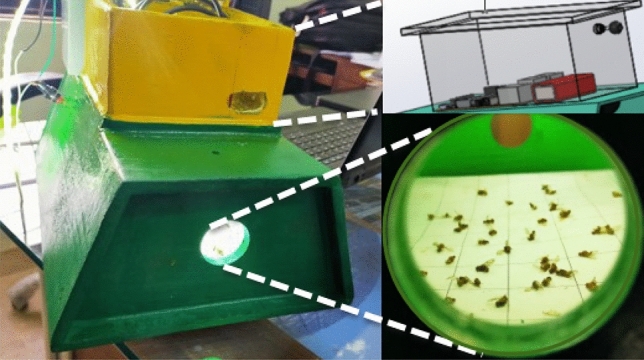
Intelligent smart trap system which performs Machine Learning-based pest detection at edge device and transmits findings to stakeholders via the cloud and includes a solar-powered IoT-enabled smart insect trap.
Materials and methods
In this section, the proposed methodology is discussed in detail. The system architecture consists of the following modules; Data acquisition, Image processing, Data augmentation, and Feature extraction. The overall flowchart of the proposed system is as shown in Fig. 4 in which the first phase, the dataset of pests is created. The second phase is the feature extraction of the pest dataset by using a Machine Learning algorithm while the third step is about the classification of pests.
Fig. 4.

Workflow diagram of the proposed system consisting of data collection phase, feature extraction phase, and classification phase.
Data acquisition
Data acquisition is the most difficult yet very important task in computer vision applications. This task becomes more tedious, challenging, and high-cost when the domain is agricultural and is done in a real field environment. The reason behind this difficulty is lighting issues and other environmental factors through DL algorithms that deal with such tasks very nicely. Data in the form of images are collected in two ways, one is by manually placing the fruit flies in the trap and the second is for the field experiments where we have attached the food attraction in the trap and then captured the images of fruit flies for further processing. So, the monitoring system collects the data through installed cameras from time to time, and the captured images are transferred for further processing42.
In this paper, a dataset was created that consisted of images of fruit flies captured in Pakistan in guava orchards of Peshawar, Khyber Pakhtunkhwa ( 00’ 29” N,
  34’ 43” E). The pest dataset contains the RGB images which are captured with a smartphone Samsung Galaxy A32 camera whose resolution is high for the task at hand. The dataset was taken from different positions with different angles. Also, the images were taken at various day timings and different lighting conditions using digital color cameras. The images in the dataset were categorized into (1) fruit fly and (2) not fruit fly. The sample images from the aforementioned dataset are shown in Fig. 5 which shows the vast variations of images taken at a height of 2-3 feet. Also, the dataset contains two types of pests including fruit flies and not fruit flies. The collected dataset is balanced, it contains 1000 images having 500 images in each class respectively, and then trained by a ML algorithm after the image pre-processing step. After the analysis of images from the Raspberry Pi camera, pest detection occurs easily at an early stage. However, due to the balanced dataset, the evaluation metrics i.e., precision and other metrics are much more informative, accurate, and valid.
Fig. 5.

Acquired images of fruit flies with different orientations and gestures from the aforementioned dataset.
Image processing
Captured data is mostly in raw form, so there is an imminent need for image pre-processing which requires image normalization, enhancement techniques, alignment, cropping, scaling and resizing, noise removal, conversion to binary or gray-scale, contrast, sharpness enhancement, etc. These processes help in improving the raw images for image identification. Thus, image processing techniques help here in achieving finer information and point-of-interest objects. For more image data, automatic methods are suitable and faster too. Whereas, for a single image, the manual method works and is more precise but is slower than the automatic method. The automatic method is considered in this research work.
Image pre-processing for pest identification is taken as where image segmentation algorithms are used to segment the target object from the complex background and to decrease the impact of complicated background on the overall accuracy. In the case of CNN models, the speed of training and overall performance are affected by noises from natural images easily and may not capture important features of the image. Therefore, to minimize such issues, data pre-processing techniques are needed. In this paper, two pre-processing techniques are used to eliminate the complicated background of the image. Additionally, a pre-processing technique of cropping is applied since there is no noise in the background of the image due to a plain white trap.
Data augmentation
Since deep learning is taken in this paper, so there is a need for a large dataset. Therefore, a data augmentation process is used to create a larger dataset. In the context of our research, due to adverse weather conditions, it is often difficult to capture diverse images of pests. Therefore, due to the shortage of images in the dataset, our main focus is to improve the dataset by using the data augmentation process. Data augmentation could be offline and online. The offline augmentation can be applied on small datasets directly, while the methods included in such a process usually are rotation, translation, flipping, and other corresponding changes. Augmentation for large datasets is usually achieved online. In this paper, since the dataset volume was not massive, therefore, offline augmentation is used as it is more suitable in the given context. There are numerous advantages of data augmentation, e.g., better generalization is possible for CNN models. Just by adding noise to data, the robustness of the model can be improved. In this paper, we have generated data mostly by flipping and rotating. In the dataset, there were a total of 900 images, each class consisting of 450 images respectively, later 100 more images were added in the dataset with 50 images of each class. This means that 10% images were increased to improve the dataset. Also, data augmentation is used after the preprocessing step in order to gain higher precision and accuracy with the best detection results. Moreover, it helps in the identification of different ’fruit fly’ and ’not fruit fly’ pests with motion at different angles.
Feature extraction
This system contains an identification process and pattern training process for test images. The preprocess and extraction modules are accessible for both the training and recognition process. Features extracted in the feature extraction process from training images are used to build a model of the classification process.
By choosing features ”by hand”, the issue of working directly on the high-dimensional data of image pixels is avoided. Low-level feature computation (low-dimensional data) aids in extracting the image’s underlying information. However, choosing features is not straightforward, so a justification for the features selected is given next.
Texture features
In computer vision, shape and geometry of objects present in images are described by features. In order for ML algorithms to recognize the objects, these features must be described mathematically. Fruit flies have distinct shapes, textures, and colors. In this work, second-order statistical texture features have been used, commonly used as Haralick features which are calculated from a Gray Level Co-occurrence Matrix (GLCM). This matrix holds the number of pairs of pixels having similar neighboring gray levels in the image. These counts are then converted into a joint probability distribution. From these probabilities, a variety of numeric features are extracted to quantify the texture characteristics of the regions of interest in the image. For fruit fly detection, the following Haralick features were used:
Features that measure variation: angular second moment (Energy), contrast, correlation.
Features that measure difference: sum of squares (variance), inverse difference moment (homogeneity), sum average, sum variance, entropy, different variance.
Features that measure entropy i.e., uncertainty: entropy, sum entropy, difference entropy.
Features that measure other information: information measure of correction I and II, and maximal correlation coefficient.
In addition to Haralick features, the Histogram of Oriented Gradients (HOG) was also used for classification. Examples of oriented gradients are shown in Fig. 6 which counts the instances of gradient orientation within a specific area of an image.
Fig. 6.

Oriented gradients sample for enhanced pest identification by counting the instances of gradient orientation within a specific area of an image.
Shape features
Statistical features to analyze the shape of a region of interest in an image are translation, rotation and scale invariant geometric features such as center of gravity and central moments. Once the shape feature vectors are computed, the ML algorithm can recognize each shape by clustering a multi-dimensional feature space into one of the classes on which the algorithm has been trained. For fruit flies, the shape feature vectors (set of invariants) are independent of position, scale, size, and orientation and, therefore, present themselves as the evident choice when deciding which features to use for classification.
Color features
Bactrocera dorsalis and similar flies have prominent colors. They mostly have black thorax with yellow dark markings. Color moments, therefore, are an advantageous choice that provides distinctive features to detect fruit flies. These color moments represent the probability distribution of image intensities characterized by moments such as mean, variance, and skewness.
In this paper, a total of nine color moments are used in the RGB color space.
Classification algorithm
An effective object detection and classification algorithm found in the literature is the CNN. It is a special type of ANN, which is used for object and image recognition and classification. The CNN architecture consists of two layers: the feature extraction layer, which extracts local features by connecting each neuron’s input to the local receptive fields of the preceding layer. The network’s compute layers are divided into a number of feature maps, which make up the other layer known as the feature map layer. Numerous characteristics of CNN include adaptability, a straightforward structure, and fewer training parameters.
A general architecture of a CNN which is an artificial deep neural network is shown in Fig 7. CNNs are preferred over conventional Machine Learning algorithms primarily because they do not require manual feature selection. For this reason, a deep learning-based object classifier, YOLOv8 was selected as a comparable model. By applying a single neural network to the entire image, YOLO can predict bounding boxes, their probabilities, and the class of the relevant object as well as divide the image into regions. These bounding boxes are weighted based on the anticipated probabilities to only draw attention to the detections with the highest scores. Finally, the combined score of both predictions is calculated (bounding box and object class).
Fig. 7.

Architecture overview of a convolutional neural network for pest detection consists of two layers i.e., the feature extraction layer and classification layer.
Implementation and results
This section explains the experimental setup, and evaluation metrics that are used to check the performance of the proposed system, and concludes with an evaluation of the results of the proposed system.
Experimental setup
For the implementation of the proposed work, a Raspberry Pi 4 (Model B with 4 GB RAM) running the Raspbian Stretch Linux operating system was configured with a Python virtual environment in Python 3. The vision system additionally contained a Raspberry Pi camera and an Intel Movidius Neural Compute Stick (NCS) Vision Processing Unit (VPU). The Raspberry Pi camera module version 2.0 contains a physical sensor of 3.6 by 2.76 millimeters, an 8-megapixel Sony IMX219 sensor, a resolution of 3280 by 2464, and a frame rate of 60 frames per second (at 1080p).
Evaluation metrics
The performance of the proposed system may be evaluated using the following parameters: Precision  , Recall
  , F1-score
  , Specificity
  , and False Negative Ratio (FNR)
  . Meanwhile,
  ,
,  ,
,  ,
,  and
and  are computed as follows:
 |
1 |
 |
2 |
 |
3 |
 |
4 |
 |
5 |
where each element in the above equations can be defined as follow:
True Positive (TP): indicating that both the actual and predicted values are positive.
False Positive (FP): indicating that the actual value is negative, but the model predicted positive.
False Negative (FN): indicating that the actual value is positive, but the model predicted negative.
True Negative (TN): indicating that both the actual and predicted values are negative.
Average Precision (AP) is the sum of the curve areas enclosed by precision and recall, which reflects the average accuracy of the model detection target. Mean Average Precision (mAP) is the average value of the AP of the target to be classified and is calculated as:
 |
6 |
Experimental results
The experiment was carried out on the pests dataset using the train test split validation method to conduct a detailed performance evaluation of the ML algorithms. The pests dataset contained a total of 1000 images whereas each category had 500 images that were used to train different ML models for the detection and classification tasks. For validation and testing, 150 and 50 images respectively were used for each class.
Within the field of DL, particularly in context of statistical classification, the confusion matrix is a specific table format that makes it possible to visualize an algorithm’s performance. It includes different metrics i.e., true positive, true negative, false positive, and false negative etc. Therefore, the performance of the CNN classifier in the form of a confusion matrix during training and its comparison with YOLOv8, leveraging the transfer learning approach has been shown in Figs. 8 and 9, respectively. Here the rows represent the true class and columns represent the predicted class of the detection model. From Figs. 8 and 9, it is clear that a precision of 92.82% and recall of 98.92% has been achieved during training for fruit flies. Similarly, for YOLOv8, these values are 100% and 97.2%. These are significant numbers if individual fruit fly images are used for prediction.
Fig. 8.

Confusion matrix for CNN classifier during training by achieving 97.8% and 97.87% of accuracy respectively for fruit fly and non-fruit fly.
Fig. 9.

Confusion matrix for YOLOv8 during training by achieving 94% of accuracy for fruit fly detection.
For YOLOv8 results, the precision-vs-recall curve is as shown in Fig. 10. From the figure, it is clear that the acquired mAP is 95.1%, which is a frequently used performance indicator for CNNs and also the average of all precisions. Figure 11 shows the detection results. The obtained results are reasonably satisfactory and are the best that was possible to obtain in a complicated environment, where low-quality cluttered data was obtained in real natural conditions.
Fig. 10.

Precision vs Recall (YOLOv8 performance curve) showing that the acquired mean average precision (mAP) is 95.1%, which is a frequently used performance indicator for CNNs and also the average of all precisions.
Fig. 11.

Detection and counting result achieved with YOLOv8.
Comparison with baseline ML algorithms
In this section, the performance of our proposed model was evaluated by comparing it against numerous traditional ML algorithms, including Support Vector Machine (SVM), Naïve Bayes (NB), K-Nearest Neighbor (K-NN), Logistic Regression (LG), and Random Forest (RF). The results for the proposed model and numerous selected traditional ML algorithms are presented in Table 2 in terms of Precision, Recall, and Accuracy. Table 2 illustrates that the proposed model significantly outperformed the rest of the algorithms in terms of accuracy, precision and recall. As expected, the proposed model achieves overall above 97.50% accuracy on the chosen dataset.
Table 2.
Performance evaluation comparison of the proposed model with traditional ML algorithms.
| Classifier | Precision (%) | Recall (%) | Overall accuracy (%) |
|---|---|---|---|
| Convolutional Neural Network (CNN) | 92.82 | 98.92 | 97.50 |
| Support Vector Machine (SVM) | 90.8 | 91.9 | 92.00 |
| Naïve Bayes (NB) | 65.0 | 59.6 | 57.10 |
| K-Nearest Neighbor (K-NN) | 73.5 | 70.7 | 68.45 |
| Logistics Regression (LG) | 88.5 | 84.8 | 87.00 |
| Random Forest (RF) | 82.6 | 79.0 | 79.27 |
Convolutional Neural Network (CNN) is the focus of this research.
Comparison with contemporary algorithms
Furthermore, the performance of our proposed model was also evaluated by comparing it with various contemporary algorithms based on DL models i.e., Wang et al.43, Yue et al.44, Li et al.45, Chen et al.46, and Kathole et al.47. Performance results of these models are shown in Table 3. Though the experiments’ setups were different, but it is worth noting that our proposed CNN based model did achieve the best accuracy performance in terms of detecting pets, which was 97.50%.
Table 3.
Pest detection performance comparison with the state-of-the-art deep learning models.
| Measures | Wang et al. 43 | Yue et al. 44 | Li et al. 45 | Chen et al. 46 | Kathole et al. 47 | Proposed model |
|---|---|---|---|---|---|---|
| Accuracy | 74.00 | 79.45 | 77.99 | 79.45 | 88.89 | 97.50 |
| Precision | 74.13 | 79.53 | 78.07 | 79.48 | 88.93 | 92.82 |
| Recall | 73.87 | 79.42 | 77.95 | 79.50 | 88.88 | 98.92 |
| F1-score | 74.00 | 79.48 | 78.01 | 79.49 | 88.90 | 95.00 |
| Specificity | 74.13 | 79.48 | 78.03 | 79.40 | 88.89 | 95.90 |
| FNR | 26.12 | 20.57 | 22.04 | 20.49 | 11.11 | 5.88 |
Similarly, the Receiver Operating Characteristic (ROC) curve depicts how well the model performs other models, showing the balance between correctly identifying true positives and incorrectly identifying false positives at various decision points. In this paper, an impressive Area Under the Curve (AUC) value of 0.97 was achieved, indicating strong discriminatory power and superior predictive capability as shown in Fig. 12. This high AUC value highlights the effectiveness of the model in distinguishing between positive and negative instances. Also for the fly category, the precision is 0.92, meaning when the model predicts an object as a fly, it is correct 92% of the times. The recall is 0.98, indicating that the model can catch 98% of actual fly instances. The F1-score for this category is 0.95. Similarly, for the non-fly category the values for precision, recall, and F1 scores are 0.99, 0.97, and 0.98 respectively as shown in Fig 13.
Fig. 12.

ROC curve having AUC value of 0.97 indicating strong discriminatory power and excellent predictive capability.
Fig. 13.

Precision, recall, and F1-score performance measurement for fly and not fly category.
Discussion
Experimental results reveal that the proposed CNN based model provides the best accuracy performance in terms of detecting pests based on the chosen dataset. Firstly, the proposed model was compared with five traditional baseline ML algorithms i.e., SVM, NB, KNN, LG, and RF. The results show that the proposed model surpass the baseline models exhibiting highest accuracy, precision and recall. In addition, we compared proposed model with various DL models, which provide excellent accuracy of 97.50%. The proposed model provides the best possible results for the given application under the given conditions, where low-quality cluttered data is obtained in real natural environment.
Nonetheless, our research has certain limitations that affect how the results are interpreted. The dataset is balanced but there is significant room for enhancement, which can further strengthen the model’s robustness and generalization, which is arguably constrained at the moment despite the use of data augmentation techniques. Further, cluttered data quality issues, natural conditions along with suboptimal lighting conditions may hinder detection accuracy. As a result, we look forward to expanding the dataset to include a wider variety of pest species and diverse environmental conditions to make the model more versatile across different agricultural contexts. This is the primary focus of our future research findings.
Conclusion
In this paper, traditional low-cost pheromone traps were automated using techniques from ML and IoT. Fruit flies that were trapped in pheromone traps were used to develop detection models using modern deep learning based CNN and compared with the transfer learning approach of YOLOv8. The CNN-based Machine Learning classifier with the shape (Hu moments), texture (Haralick features and HOGs), and color histogram achieved above 90% accuracy in detecting fruit flies. The algorithm, however, could not maintain accuracy while counting detected pests in a cluttered image. These findings demonstrated that pheromone-based pest control systems can effectively use deep learning-based object detectors such as YOLOv8. The user can remotely monitor the number of pests inside the orchard and take preventative measures to protect the orchard by uploading the data to the real-time cloud database from where it can be supplied to the mobile app and website.
Due to the small size of the pests, which results in a very narrow region of interest, suboptimal lighting conditions, and various camera specifications, YOLOv8 performed robustly enough for the given task. Despite all these limitations, the mAP value of 97.3% was achieved for detecting fruit flies in real orchards. The architecture was optimized to perform over a resource-limited single-board computer i.e., Raspberry Pi 4. Furthermore, the proposed model has been contrasted with numerous ML and DL based models to verify the efficacy of the proposed model. The comparative analysis showed that the proposed model outperformed others, by achieving the highest accuracy, precision, recall, F1-score, specificity, and FNR with values of 97.5%, 92.82%, 98.92%, 95.00%, 95.90%, and 5.88% respectively. The paper will be expanded in the future to benchmark further deep learning architectures. One possible improvement is to use CNNs for feature extraction and SVM for classification. Additionally, the traps will be placed widely to provide forecast pest maps for a particular field or area. Overall, this research work makes a significant contribution to the field of smart agriculture by designing cost effective systems and deploying accurate and efficient AI powered image analysis models for the automatic detection of pets in plants. Such system aims to improve agricultural practices and eventually allow for early detection/intervention and better management of pest-related issues.
Acknowledgements
The authors acknowledge the support from grant number PCC-Grant-202234 from the PMU Cyber security Center, Prince Mohammad Bin Fahd University, Kingdom Saudi Arabia. This work is also partially supported by the National Science Centre of Poland Grant 2020/37/B/ST7/01448, and by the Icelandic Research Fund Grant 2410297.
Author contributions
Conceptualization, S.A and S.N.K.M and W.U.K and S.K; methodology, S.A and S.N.K.M and G.B.B and W.U.K and A.A.F; formal analysis, S.N.K.M and G.B.B and A.A.F and S.K; data management, S.A and W.U.K; writing—original draft, S.A and S.N.K.M and W.U.K; project administration, S.N.K.M and G.B.B and S.K and A.A.F and S.K; funding acquisition, G.B.B and S.K. All authors have read and agreed to the published version of the manuscript.
Data availability
The datasets used and/or analyzed during the current study are available from the corresponding author upon reasonable request.
Declarations
Competing interests
The authors declare no competing interests.
Footnotes
Publisher’s note
Springer Nature remains neutral with regard to jurisdictional claims in published maps and institutional affiliations.
Salman Ahmed, Safdar Nawaz Khan Marwat, Ghassen Ben Brahim, Waseem Ullah Khan, Shahid Khan, Ala Al-Fuqaha and Slawomir Koziel contributed equally to this work.
References
- 1.Mansour, M. et al. Internet of Things: A comprehensive overview on protocols, architectures, technologies, simulation tools, and future directions. Energies16(8), 3465. 10.3390/en16083465 (2023). [Google Scholar]
- 2.Chouhan, S. S., Singh, U. P., Sharma, U. & Jain, S. Classification of different plant species using deep learning and machine learning algorithms. Wirel. Pers. Commun.136, 2275–2298. 10.1007/s11277-024-11374-y (2024). [Google Scholar]
- 3.Vangala, A., Das, K. A., Kumar, N. & Alazab, M. Smart secure sensing for IoT based agriculture: Blockchain perspective. IEEE Sens. J.21(16), 17591–17607. 10.1109/JSEN.2020.3012294 (2021). [Google Scholar]
- 4.Alyahya, S., Khan, W. U., Ahmed, S., Marwat, S. N. K. & Habib, S. Cyber secure framework for smart agriculture: Robust and tamper resistant authentication scheme for IoT devices. Electronics11(6), 963. 10.3390/electronics11060963 (2022). [Google Scholar]
- 5.Senapaty, M. K., Ray, A. & Padhy, N. IoT-enabled soil nutrient analysis and crop recommendation model for precision agriculture. Computers12(3), 61. 10.3390/computers12030061 (2023). [Google Scholar]
- 6.Yulita, N. I., Rambe, R. F. M., Sholahuddin, A. & Prabuwono, A. S. A convolutional neural network algorithm for pest detection using GoogleNet. AgriEngineering5(4), 2366–2380. 10.3390/agriengineering5040145 (2023). [Google Scholar]
- 7.Subahi, A. F. & Bouazza, K. E. An intelligent IoT based system design for controlling and monitoring greenhouse temperature. IEEE Access8, 125488–125500. 10.1109/ACCESS.2020.3007955 (2020). [Google Scholar]
- 8.Patle, K. S., Saini, R., Kumar, A. & Palaparthy, V. S. Field evaluation of smart sensor system for plant disease prediction using LSTM network. IEEE Sens. J.22(4), 3715–3725. 10.1109/JSEN.2021.3139988 (2022). [Google Scholar]
- 9.Yang, X. et al. A survey on smart agriculture: Development modes, technologies, and security and privacy challenges. IEEE/CAA J. Autom. Sin.8(2), 273–302. 10.1109/JAS.2020.1003536 (2021). [Google Scholar]
- 10.Chouhan, S. S., Singh, U. P., & Jain, S. Introduction to computer vision and drone technology—applications of computer vision and drone technology in agriculture 4.0. Springer, 1-5, 10.1007/978-981-99-8684-2 (2024). [DOI]
- 11.Sarwar, A. et al. Enhanced anomaly detection system for IoT based on improved dynamic SBPSO. Sensors22(13), 4926. 10.3390/s22134926 (2022). [DOI] [PMC free article] [PubMed] [Google Scholar]
- 12.Khan, W. U., Marwat, S. N. K., & Ahmed, S. Cyber secure framework for smart containers based on novel hybrid DTLS protocol. Comput. Syst. Sci. Eng., 43(3), 1297-1313. 10.32604/csse.2022.024018 (2022).
- 13.Sarwar, A., Hasan, S., Khan, W. U., Ahmed, S., & Marwat, S. N. K. Design of an advance intrusion detection system for IoT networks. In: 2nd International Conference on Artificial Intelligence (ICAI), 46-51. 10.32604/csse.2022.024018 (2022).
- 14.Akhter, R. & Sofi, S. A. Precision agriculture using IoT data analytics and machine learning. J. King Saud Univ. Comput. Inf. Sci.34(8), 5602–5618. 10.1016/j.jksuci.2021.05.013 (2022). [Google Scholar]
- 15.Nguyen, T. N., Lee, S., Nguyen-Xuan, H. & Lee, J. A novel analysis prediction approach for geometrically nonlinear problems using group method of data handling. Comput. Methods Appl. Mech. Eng.354, 506–526. 10.1016/j.cma.2019.05.052 (2019). [Google Scholar]
- 16.Kumar, R. et al. Hybrid approach of cotton disease detection for enhanced crop health and yield. IEEE Access1, 11. 10.1109/ACCESS.2024.3419906 (2024). [Google Scholar]
- 17.Brunelli, D., Albanese, A., D’Acunto, D. & Nardello, M. Energy neutral machine learning based IoT device for pest detection in precision agriculture. IEEE Internet Things Magaz.2(4), 10–13. 10.1109/IOTM.0001.1900037 (2019). [Google Scholar]
- 18.Chouhan, S. S., Singh, U. P., Sharma, U. & Jain, S. Leaf disease segmentation and classification of Jatropha Curcas L. and Pongamia Pinnata L. biofuel plants using computer vision based approaches. Measurement171, 108796. 10.1016/j.measurement.2020.108796 (2021). [Google Scholar]
- 19.Khajuria, R., Sunanda, D., Singh, S. A survey of existing leaf disease techniques using artificial neural network. Int. J. Comput. Trends Technol., 59(1), 52-62. 10.14445/22312803/IJCTT-V59P109 (2018).
- 20.Atalla, S. et al. IoT-enabled precision agriculture: Developing an ecosystem for optimized crop management. Information14(4), 205. 10.3390/info14040205 (2023). [Google Scholar]
- 21.Li, Y. & Chao, X. Ann-based continual classification in agriculture. Agriculture10(5), 178. 10.3390/agriculture10050178 (2020). [Google Scholar]
- 22.Hahn, F., Valle, S., Rendón, R., Oyorzabal, O. & Astudillo, A. Mango fruit fly trap detection using different wireless communications. Agronomy13(7), 1736. 10.3390/agronomy13071736 (2023). [Google Scholar]
- 23.Tian, E., Li, Z., Huang, W. & Ma, H. Distributed and parallel simulation methods for pest control and crop monitoring with IoT assistance. Acta Agric. Scand. Sect. B Soil Plant Sci.71(9), 884–898. 10.1080/09064710.2021.1955959 (2021). [Google Scholar]
- 24.Dang, L. M., Piran, M. J., Han, D., Min, K. & Moon, H. A survey on internet of things and cloud computing for healthcare. Electronics8(7), 768. 10.3390/electronics8070768 (2019). [Google Scholar]
- 25.Lengai, G. M. W., Muthomi, J. W. & Mbega, E. R. Phytochemical activity and role of botanical pesticides in pest management for sustainable agricultural crop production. Sci. Afr.7, e00239. 10.1016/j.sciaf.2019.e00239 (2020). [Google Scholar]
- 26.Wang, F., Wang, R., Xie, C., Yang, P. & Liu, L. Fusing multi-scale context-aware information representation for automatic in-field pest detection and recognition. Comput. Electron. Agric.169, 105222. 10.1016/j.compag.2020.105222 (2020). [Google Scholar]
- 27.Wang, Q. J. et al. Pest24: A large-scale very small object data set of agricultural pests for multi-target detection. Comput. Electron. Agric.175, 105585. 10.1016/j.compag.2020.105585 (2020). [Google Scholar]
- 28.Li, Y., Wang, H., Dang, L. M., Sadeghi-Niaraki, A. & Moon, H. Crop pest recognition in natural scenes using convolutional neural networks. Comput. Electron. Agric.169, 105174. 10.1016/j.compag.2019.105174 (2020). [Google Scholar]
- 29.Salamut, C., Kohnert, I., Landwehr, N., Pflanz, M., Schirrmann, M., Zare, M. Deep learning object detection for image analysis of cherry fruit fly (Rhagoletis cerasi L.) on yellow sticky traps. Gesunde Pflanzen, 75, 37-48, 10.1007/s10343-022-00794-0 (2023).
- 30.Yang, Z. K., Li, W. Y., Li, M., Yang, X. T. Automatic greenhouse pest recognition based on multiple color space features. Int. J .Agric. Biol. Eng., 14(2), 188–195, 10.25165/j.ijabe.20211402.5098 (2021). [DOI]
- 31.Yihao, W., Chunjiang, Z., Daming, D. & Kun, W. Real-time monitoring of insects based on laser remote sensing. Ecol. Indicat.151, 110302. 10.1016/j.ecolind.2023.110302 (2023). [Google Scholar]
- 32.Kathole, A. B., Vhatkar, K. N., Kumbhare, S., Katti, J. & Kimbahune, V. V. IoT-based smart agriculture for onion plant disease management: A comprehensive approach. Int. J. Intell. Syst. Appl. Eng.12(3), 472–476 (2024). [Google Scholar]
- 33.Kathole, A. B., Katti, J., Ubale, S. A., Vhatkar, K. N., Jadhav, D., & Kimbahune, V. V. IoT approach for ensuring safety in smart cities for energy saving. J. Electr. Syst., 20(2), 418–423. 10.52783/jes.1337 [DOI]
- 34.Martins, V. A. M., Freitas, L. C., De Aguiar, M. S., De Brisolara, L. B., & Ferreira, P. R. Deep learning applied to the identification of fruit fly in intelligent traps. Brazilian Symposium on Computing Systems Engineering (SBESC), 1-8, 10.1109/SBESC49506.2019.9046088 (2019).
- 35.Kasinathan, T., Singaraju, D. & Uyyala, S. R. Insect classification and detection in field crops using modern machine learning techniques. Inf. Process. Agric.8(3), 446–457. 10.1016/j.inpa.2020.09.006 (2021). [Google Scholar]
- 36.Albanese, A., Nardello, M. & Brunelli, D. Automated pest detection with DNN on the edge for precision agriculture. IEEE J. Emerg. Sel. Topics Circuits Syst.11(3), 458–467. 10.1109/JETCAS.2021.3101740 (2021). [Google Scholar]
- 37.Suto, J. Embedded system-based sticky paper trap with deep learning based insect-counting algorithm. Electronics10(15), 1754. 10.3390/electronics10151754 (2021). [Google Scholar]
- 38.Chen, C. J. et al. Identification of fruit tree pests with deep learning on embedded drone to achieve accurate pesticide spraying. IEEE Access9, 21986–21997. 10.1109/ACCESS.2021.3056082 (2021). [Google Scholar]
- 39.Thenmozhi, K. & Uyyala, S. R. Machine learning ensemble with image processing for pest identification and classification in field crops. Neural Comput. Appl.33, 7491–7504. 10.1007/s00521-020-05497-z (2021). [Google Scholar]
- 40.Xiao, Z. et al. Pest identification via hyperspectral image and deep learning. Signal Image Video Process.16, 873–880. 10.1007/s11760-021-02029-7 (2022). [Google Scholar]
- 41.Markovic, D. et al. Prediction of pest insect appearance using sensors and machine learning. Sensors21(14), 4846. 10.3390/s21144846 (2021). [DOI] [PMC free article] [PubMed] [Google Scholar]
- 42.Olakunle, E., Rahman, T. A., Orikumhi, I., Leow, C. Y. & Hindia, M. N. An overview of Internet of Things (IoT) and data analytics in agriculture: Benefits and challenges. IEEE Internet Things J.5(5), 3758–3773. 10.1109/JIOT.2018.2844296 (2018). [Google Scholar]
- 43.Wang, F. et al. Convolutional neural network based automatic pest monitoring system using hand-held mobile image analysis towards on-site-specific wild environment. Comput. Electron. Agric.187, 106268. 10.1016/j.compag.2021.106268 (2021). [Google Scholar]
- 44.Yue, Y. et al. Deep recursive super resolution network with Laplacian pyramid for better agricultural pest surveillance and detection. Comput. Electron. Agric.150, 26–32. 10.1016/j.compag.2018.04.004 (2018). [Google Scholar]
- 45.Li, W. et al. Field detection of tiny pestsfrom sticky trap images using deep learning in agricultural greenhouse. Comput. Electron. Agric.183, 106048. 10.1016/j.compag.2021.106048 (2021). [Google Scholar]
- 46.Chen, C. J., Huang, Y. Y., Li, Y. S., Chang, C. Y. & Huang, Y. M. An IoT based smart agricultural system for pests detection. IEEE Access8, 180750. 10.1109/ACCESS.2020.3024891 (2020). [Google Scholar]
- 47.Kathole, A. B., Vhatkar, K. N. & Patil, S. D. IoT-enabled pest identification and classification with new meta-heuristic-based deep learning framework. Cybern. Syst.55(2), 380–408. 10.1080/01969722.2022.2122001 (2024). [Google Scholar]
Associated Data
This section collects any data citations, data availability statements, or supplementary materials included in this article.
Data Availability Statement
The datasets used and/or analyzed during the current study are available from the corresponding author upon reasonable request.