

Abstract
Background
Solitary thyroid nodules present a challenge in differentiating between benign and malignant conditions using ultrasound (US). Arrival time parameter imaging (At-PI) following contrast-enhanced ultrasound (CEUS) can effectively visualize the vascular architectural patterns of the nodules, providing valuable diagnostic information. This study aimed to explore the application value of At-PI in differentiating thyroid nodules, specifically focusing on a sample of 127 cases.
Material/Methods
From October 2020 to December 2023, 127 thyroid nodules from 108 patients who underwent ultrasound and CEUS examinations at the General Hospital of Northern Theater Command were reviewed. Pathological outcomes served as the criterion standard, categorizing the nodules into a benign group (44 cases) and a malignant group (83 cases). At-PI was employed to analyze the CEUS videos, allowing for a comparison of parameters between the 2 groups. Additionally, the diagnostic performance of 2 quantitative parameters was assessed using receiver operating characteristic (ROC) curves.
Results
After conducting the chi-square test, the differences between the 2 groups regarding enhancement time, perfusion pattern, and perfusion defect were found to be statistically significant (P<0.05). There was a significant difference between the 2 groups over the time span (ΔT) (P<0.05). The areas under the curve (AUCs) for ΔT4-3 and ΔT6-5 were 0.715 (95% CI: 0.624–0.805) and 0.763 (95% CI: 0.676–0.851).
Conclusions
At-PI can offer more effective parameters for differentiating thyroid nodules. Additionally, some of these parameters exhibit notable diagnostic performance in the detection of thyroid cancer.
Keywords: Contrast Media, Diagnostic Equipment, Thyroid Nodule
Introduction
Thyroid cancer, originating from the follicular or parafollicular epithelial cells of the thyroid gland, is the most common malignant tumor in the neck. According to the GLOBOCAN2020 database by the WHO International Agency for Research on Cancer, thyroid cancer ranks ninth in global cancer incidence and is most prevalent among individuals under 40 years old [1,2]. Ultrasound plays a crucial role in assessing the malignant risk of thyroid nodules by examining various characteristics such as number, location, size, and blood supply. It is considered the most advanced method currently available due to its high resolution, real-time imaging, and non-invasive nature [3]. The preferred imaging modality for evaluating benign and malignant thyroid nodules is ultrasound [4]. The increased global use of thyroid ultrasound has led to a higher detection rate of this tumor in recent years. While the prognosis for most thyroid cancers is favorable, some patients experience anxiety upon detection of suspicious nodules, potentially resulting in over-diagnosis and unnecessary treatments. Therefore, accurate differential diagnosis between benign and malignant thyroid nodules is essential in guiding patients toward appropriate treatment strategies. The accuracy of conventional ultrasound (US) in diagnosing benign and malignant thyroid nodules can be as low as 80.2% due to overlapping features [5]. Ultrasound-guided fine-needle aspiration (FNA) is currently the most accurate and cost-effective method for evaluating the nature of thyroid nodules. The application of FNA in thyroid treatment is limited by factors such as operator experience, sampling route, and invasiveness [6]. The uncertainty associated with the application of FNA in identifying thyroid malignant tumors can be as high as 30% [7]. FNA is not widely performed in many countries, leading to a reliance on ultrasound reports or other clinical examinations for reference in developing treatment plans [8,9]. In recent years, contrast-enhanced ultrasound (CEUS) technology has rapidly developed and become widely used. CEUS involves injecting an ultrasound contrast agent into peripheral veins to visualize the microcirculatory perfusion of solid organs and dynamically observe nodules in real time, including tiny nourishing blood vessels. Different vascular patterns in benign and malignant thyroid nodules result in distinct CEUS manifestations, making it a valuable tool for sonographers in distinguishing between these 2 types of nodules [5].
Arrival time parametric imaging (At-PI) of CEUS involves color-coding and imaging based on the arrival time of contrast agent after injection. Qualitative parameters like nodule perfusion pattern are assessed by analyzing the color distribution and measuring the arrival time of points of interest, along with other quantitative parameters [10]. This technique has been utilized in various organ diseases research, including superficial lymph nodes, liver, and breast, aiding in identifying lesion perfusion patterns, enhancing diagnostic accuracy, reducing subjectivity in conclusions, and offering a more objective basis for disease differential diagnosis [10–12]. Despite its widespread use in other organ studies, At-PI has not been applied in thyroid research globally. This study aimed to evaluate the utility of At-PI in differentiating benign and malignant thyroid nodules through color-coded imaging of qualitative and quantitative parameters, with the goal of providing valuable insights for precise clinical diagnosis of thyroid nodules and serving as a reference for future research. Therefore, this study aimed to compare At-PI in CEUS in the differential diagnosis of 127 thyroid nodules.
Material and Methods
Ethics
Institutional review board approval was obtained from the Ethics Committee of the General Hospital of Northern Theater Command for this retrospective study, and informed consent was waived.
Research Design
This was a retrospective study. Between December 2023 and February 2023, a total of 127 thyroid nodules from 108 patients were recruited at the General Hospital of Northern Theater Command in this study. Pathological outcomes served as the criterion standard, categorizing the nodules into a benign group (44 cases) and a malignant group (83 cases).
Inclusion Criteria
1. Nodules classified into 4 or higher nodules based on US; 2. Nodules accompanied by comprehensive clinical data, results from US examinations, and findings from CEUS; 3. Nodules that have been definitively confirmed through surgical intervention or needle biopsy; 4. Category 3 nodules located in the same lobe of the thyroid gland as category 4 or higher nodules, while simultaneously meeting the inclusion criteria of points 2 and 3.
Exclusion Criteria
1. Patients who have not undergone surgery or puncture to confirm the pathology; 2. Cases where there is no surrounding normal tissue available for comparison; 3. A documented history of neck trauma or surgery; 4. A history of malignant tumors unrelated to the thyroid, as well as patients presenting with cachexia; 5. Instances where the CEUS image quality was poor (evidenced by significant shaking), preventing the plotting of arrival time parameter imaging. Ultimately, the study included a total of 127 thyroid nodules from 108 patients.
Inspection Method
The GE Logiq E20(GE Medical Systems Ultrasound - Primary Care Diagnostics, LLC, Wauwatosa, USA) ultrasonic diagnostic instrument was used, with a ML6–15 (4.0~13.0MHz) linear array probe for ultrasonography and a L2–9 (5~7.5MHz) linear array probe for contrast-enhanced ultrasonography (CEUS), along with the contrast agent SonoVue® from Bracco, Italy. The patient was positioned supine with the neck extended and fully exposed. Ultrasonography was used to gather information on the location, size measurement, and blood flow of the thyroid nodule, while also scanning the cervical lymph nodes. A microbubble suspension was prepared by mixing 5 ml of 0.9% sodium chloride solution with SonoVue® and shaking thoroughly. This suspension must be used within 6 hours, with an interval of >30 minutes between contrast studies. The CEUS examination was performed by a doctor to display the target results. A complete view of the nodule and surrounding normal thyroid parenchyma was taken, with the probe held still and the patient instructed to avoid swallowing. CEUS double-frame contrast imaging was utilized. A 0.8-ml microbubble suspension was injected through the cubital vein, followed by flushing the tube with 5 ml of 0.9% sodium chloride solution. The timer was started and the dynamic CEUS video of the entire process was stored in real time for 120 seconds. All examinations were conducted by senior physicians with attending or above professional titles and more than 10 years of CEUS experience.
Arrival Time Parametric Imaging Analysis
The Parametric Image software was utilized to conduct At-PI (Arrival time Parametric Imaging, version R1.5.2, GE) imaging on the video for obtaining color-coded images. To ensure optimal color-coding presentation of target nodules, a dynamic color-coding method based on varying perfusion imaging times was implemented. This approach involved formulating independent At-PI color codes for different perfusion imaging time intervals, adjusting the duration of each color to prevent overly brief or prolonged representation of perfusion times in a single color. This strategy aimed to facilitate accurate judgment of perfusion patterns. By defining time zero as the start of the intravenous bolus injection of the contrast agent, the arrival time of the contrast agent in the thyroid nodule is calculated sequentially, resulting in an automatic overlay on the US image. This study employed different colors to represent varying arrival times, as illustrated in Figure 1.
Figure 1.
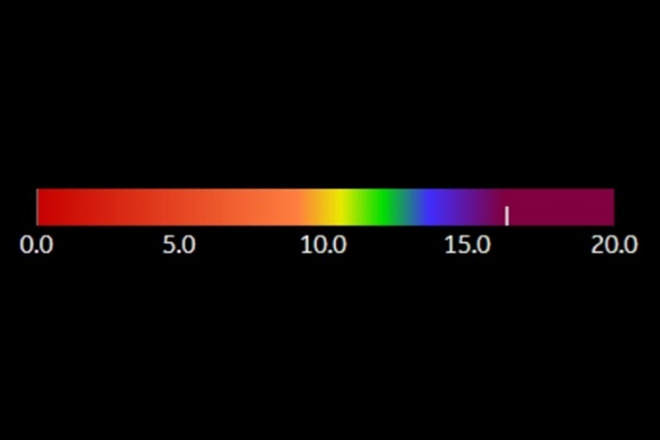
Color-coded bar used by At-PI. The At-PI time color scale indicates time in seconds, with a progression from red to purple through intermediate colors such as orange, yellow, green, and blue. As time passes, the contrast agent shifts from orange to purple in a sequential manner.
Image Analysis and Diagnostic Criteria
The US examination of thyroid nodules was assessed and classified according to the “2020 Chinese Guidelines for Malignant Risk Stratification of Thyroid Nodules by Ultrasound (C-TIRADS),” which were issued by the Ultrasound Society of the Chinese Medical Association in 2020 [13]. Image analysis was conducted by 2 or more attending physicians, each with over 10 years of experience in angiography. These physicians were blinded to the pathological results and collaboratively reviewed the At-PI imaging software video. In instances of disagreement, a consensus was achieved through joint discussion prior to documenting the analysis results.
The qualitative indicators of At-PI analysis of thyroid target nodules included enhancement timing, categorized by the order in which the contrast agent reaches the nodule and surrounding normal thyroid tissue as earlier, synchronous, or later than adjacent normal tissue; Perfusion mode, based on the sequence of contrast agent perfusion in the nodule, divided into centripetal, centrifugal, and diffuse types (Figure 2); Early annular enhancement, referring to the early appearance of enhanced edge of peritumoral tissue, further classified as acyclic or annular (Figure 3); Perfusion defect assessment, distinguishing between presence or absence of perfusion defects in CEUS and At-PI perfusion areas (Figure 4).
Figure 2.

Schematic diagram illustrating the three perfusion modes of At-PI in thyroid nodules. The left image depicts the US image in the double-image condition, while the right image illustrates the At-PI image. The white arrow indicates the target nodule. (A) The US reveals a solid hypoechoic lesion in the right lobe of the thyroid gland, characterized by irregular edges, a regular shape, and uniform echogenicity. This nodule is classified as C-TIRADS category 4b. The At-PI demonstrates a centripetal perfusion pattern, with yellow and green hues on the periphery (indicating earlier arrival) and purple in the center (indicating late arrival). (B) The US shows a solid hypoechoic lesion in the left lobe of the thyroid gland with well-defined boundaries and a regular shape; however, the echogenicity is uneven, and this nodule is categorized as C-TIRADS 4a. The At-PI reveals a centrifugal perfusion pattern, featuring orange and yellow colors in the center (indicating earlier arrival) and purple at the periphery (indicating later arrival). (C) The US displays a solid hypoechoic lesion in the right lobe of the thyroid gland with poorly defined boundaries and indistinct edges. The aspect ratio is greater than 1, and this nodule is classified as C-TIRADS category 4c. The At-PI indicates a diffuse perfusion pattern. Figure was generated using PowerPoint version 2016 (Microsoft Corporation, Washington, USA).
Figure 3.
(A–C) Schematic diagram illustrating early ring enhancement of At-PI in thyroid nodules. A thyroid nodule was identified in the right lobe of a 48-year-old woman. The left image displays the US in double condition, the middle image presents the At-PI image and the right image illustrates the pathological image. The white arrow indicates the target nodule. The US revealed hypoechoic nodules with an irregular shape, unclear edges, uniform echogenicity, and an aspect ratio greater than 1. These nodules were classified as C-TIRADS category 4b. The At-PI image demonstrates a centripetal perfusion pattern, characterized by early enhancement of the tissue surrounding the nodule, which is color-coded in orange. Notably, there is clear early ring enhancement observed on the At-PI image at 10 seconds. Figure was produced using PowerPoint version 2016 (Microsoft Corporation, Washington, USA).
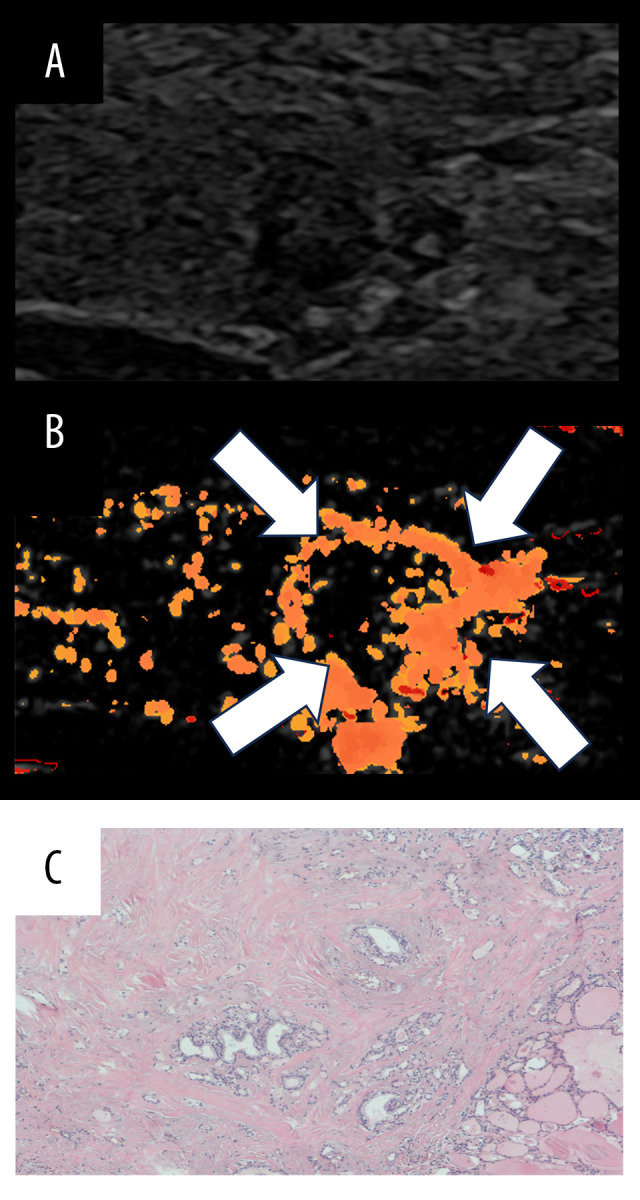
Figure 4.

Schematic diagram illustrating a perfusion defect of At-PI in thyroid nodules. The left image depicts the US image in the double-image condition, the right image represents the At-PI image. The white arrow indicates the area of filling defect. (A) The US image reveals a solid hypoechoic lesion in the right lobe of the thyroid gland, characterized by clear borders, a regular shape, and uneven echoes. There are thick and strong echoes present within the lesion, accompanied by attenuation in the posterior region. The nodules are classified as C-TIRADS category 4a. The At-PI image shows a perfusion defect, which, when compared to the US image, highlights the presence of thick calcification and a significant sound shadow behind it. The pathology indicates nodular goiter with calcification and fibrosis. (B) The US image again shows the solid right lobe of the thyroid gland, where the hypoechoic lesions exhibit clear borders, irregular shapes, and uneven echoes. The nodules are classified as C-TIRADS category 4b. The At-PI image displays a combination of local abundant perfusion and defect, with the maximum diameter of the lesion measuring approximately 3.23 cm; the pathology is consistent with papillary thyroid carcinoma (PTC). Figure was created using PowerPoint version 2016 (Microsoft Corporation, Washington, USA).
We started the At-PI software in GE Logiq E20, watched the At-PI video, positioned the point of interest in the target nodule, automatically determined the arrival time of the contrast agent, and recorded the time as T. The study defined the intersection of the long and short axes of the thyroid nodule as the center point, the area from the center point to the midpoint of the peritumoral line as the central area, and the remaining area as the peripheral area. The same method was used to calculate the arrival time of the contrast agent in the peripheral area of the target nodule and the arrival time in the surrounding normal thyroid tissue at the same depth. The quantitative parameters set included: (1) T1: the earliest arrival time of the contrast agent; (2) T2: the latest arrival time of the contrast agent; (3) T3: the time when the contrast agent reached the central area of the lesion; (4) T4: the time when the contrast agent reached the peripheral area of the lesion; (5) T5: the time taken for the contrast agent to reach the lesion area; (6) T6: the time taken for the contrast agent to reach the surrounding normal thyroid tissue at the same depth as the lesion. The relative parameters were calculated based on (1)–(6): (7)ΔT2-1=T2-T1, representing the span between the latest and earliest arrival time of the contrast agent in the lesion; (8)ΔT4-3= T4-T3, representing the time span (absolute value) from the periphery to the central area or vice versa; (9) ΔT6-5=T6-T5, indicating the time span (absolute value) for the contrast agent to reach the lesion and the surrounding thyroid tissue at the same depth. Each parameter in (1)–(6) was measured at 4 points and averaged.
Statistical Analysis
SPSS 27.0 software was utilized for data analysis. Measurement data with normal distribution and homogeneous variances were presented as mean±standard deviation (x±s). The comparison between groups was conducted using a 2 independent samples t test for numerical data and Pearson chi-square test or Fisher’s exact probability method for categorical data. The area under the curve (AUC) values, sensitivity, and specificity of ΔT4-3 and ΔT6-5 were calculated. The McNemar chi-square test was employed to compare the diagnostic effects of the 2 time differences. Receiver operating characteristic (ROC) curves were constructed, the area under the curve (AUC) was calculated, and the Youden index was applied to identify optimal cutoff values for each parameter to assess diagnostic performance of the At-PI parameters. The confidence interval for the area under the ROC curve was estimated at the 95% confidence level. A significance level of P<0.05 was used to determine statistical significance.
Results
General Information About Patients and Nodules
The study included a total of 108 patients, comprising 71 males and 37 females, with ages ranging from 22 to 67 years and an average age of 42.7±10.7 years. A total of 127 thyroid nodules were examined, with 12 confirmed through needle biopsy and 115 through surgical resection. Of these, 83 were malignant nodules with sizes ranging from 2.7 to 31.3 mm and an average size of 8.7±5.3 mm, including 82 papillary thyroid carcinomas and 1 follicular thyroid carcinoma. A total of 44 benign nodules were identified, with sizes ranging from 4.5 to 20.61 mm and an average size of 10.9±5.8 mm. This group included 37 nodular goiters, 3 thyroid adenomas, 3 cases of Hashimoto’s thyroiditis, and 1 case of granulomatous thyroiditis. Notably, significant differences were observed in the C-TIRADS classification (Table 1).
Table 1.
Patient clinical data and C-TIRADS category.
| Patient clinical data | Benign (n=44) | Malignant (n=83) | P value |
|---|---|---|---|
| Sex | 0.007 | ||
| Male | 23 | 48 | |
| Female | 22 | 15 | |
| Age (y) | 46.1±11.2 | 40.2±10.2 | 0.010 |
| Size (mm) | 10.9±5.8 | 8.7±5.3 | 0.280 |
| Location | 0.799 | ||
| Left | 18 | 39 | |
| Right | 24 | 41 | |
| Isthmus | 2 | 3 | |
| Pathological materials | 0.014 | ||
| Cytologic | 8 | 4 | |
| Histologic result | 36 | 79 | |
| C-TIRADS | <0.001 | ||
| 3 | 19 | 4 | |
| 4a | 13 | 8 | |
| 4b | 8 | 41 | |
| 4c | 3 | 25 | |
| 5 | 1 | 5 |
Comparison of Intergroup Parameters of At-PI in Benign and Malignant Thyroid Nodules
The study found statistically significant differences (Table 2) in enhancement time, perfusion pattern, and perfusion defect between the benign and malignant groups (P<0.05). Malignant nodules typically exhibited delayed enhancement compared to surrounding normal thyroid tissue (61/83, 73.5%), displayed centripetal perfusion (54/83, 65.1%), and frequently had no perfusion defects (66/83, 79.5%). On the other hand, benign nodules mostly showed synchronous enhancement with the surrounding thyroid tissue (24/44, 54.5%), had diffuse perfusion patterns (29/44, 65.9%), and often presented with perfusion defects (24/44, 54.5%).
Table 2.
Comparison of intergroup qualitative parameters of At-PI in thyroid nodules.
| Benign (n=44) | Malignant (n=83) | χ2/F | P | ||
|---|---|---|---|---|---|
| Enhancement time | Earlier | 3 (6.8%) | 17 (20.5%) | 38.746 | <0.001 |
| Later | 17 (38.6%) | 61 (73.5%) | |||
| Synchronous | 24 (54.5%) | 5 (6.0%) | |||
| Perfusion mode | Centripetal | 14 (31.8%) | 54 (65.1%) | 38.071# | <0.001 |
| Centrifugal | 1 (2.3%) | 18 (21.7%) | |||
| Diffuse types | 29 (65.9%) | 11 (13.3%) | |||
| Early annular enhancement | Presence | 6 (13.6%) | 24 (54.5%) | 3.233 | 0.072 |
| Absence | 38 (86.4%) | 20 (45.5%) | |||
| Perfusion defect assessment | Presence | 23 (27.7%) | 17 (20.5%) | 15.263 | <0.001 |
| Absence | 60 (72.3%) | 66 (79.5%) |
Fisher’s precision probability test.
The time difference ΔT4-3 was found to be greater in the malignant group compared to the benign group (1.136±1.868 s >0.076±1.671 s), with a statistically significant difference (P<0.05). This suggests that the contrast agent in malignant thyroid nodules tends to reach the central area later than the peripheral area. Similarly, ΔT6-5 in the malignant group was also greater than in the benign group (2.182±1.965 s >0.320±1.706 s), with a statistically significant difference (P<0.05). Further details can be seen in Table 3, indicating that the contrast agent in malignant thyroid nodules often takes longer to reach the lesion compared to the surrounding thyroid tissue at the same depth. No significant differences were observed in the remaining parameters between the 2 groups.
Table 3.
Comparison of intergroup quantitative parameters of At-PI in thyroid nodules. T1: the earliest arrival time of the contrast agent; T2: the latest arrival time of the contrast agent; T3: the time when the contrast agent reached the central area of the lesion; T4: the time when the contrast agent reached the peripheral area of the lesion; T5: the time taken for the contrast agent to reach the lesion area;T6: the time taken for the contrast agent to reach the surrounding normal thyroid tissue at the same depth as the lesion. ΔT2-1=T2-T1; ΔT4-3=T4-T3; ΔT6-5=T6-T5.
| Benign (n=44) | Malignant (n=83) | t | P | |
|---|---|---|---|---|
| T1 | 10.730±2.803 | 11.108±2.265 | −0.765 | 0.446 |
| T2 | 16.622±5.413 | 16.956±4.633 | −0.336 | 0.737 |
| ΔT2-1 | 5.892±3.598 | 5.847±3.209 | 0.067 | 0.947 |
| T3 | 13.548±3.832 | 14.393±3.663 | −1.217 | 0.226 |
| T4 | 13.471±3.495 | 13.256±3.095 | 0.357 | 0.722 |
| ΔT4-3 | 0.076±1.671 | 1.136±1.868 | −3.153 | 0.002 |
| T5 | 12.950±3.488 | 14.049±3.00 | −1.852 | 0.066 |
| T6 | 12.039±2.473 | 12.109±1.885 | −0.178 | 0.859 |
| ΔT6-5 | 0.320±1.706 | 2.182±1.965 | −5.31 | <0.001 |
Analysis of Diagnostic Efficacy of the Time Span (ΔT) in the Diagnosis of Thyroid Cancer
By analyzing the ROC curve, it was determined that the areas under the curve for ΔT4-3 and ΔT6-5 were 0.715 (95% CI: 0.624–0.805) and 0.763 (95% CI: 0.676–0.851), respectively. The Youden index for each parameter was calculated to determine the cutoff value – a cutoff value of 1.075 s for ΔT4-3 resulted in a sensitivity of 54.2% and a specificity of 84.1%; while a cutoff value of 0.739 s for ΔT6-5 led to a sensitivity of 80.7% and a specificity of 80.7%. The overall accuracy was found to be 68.2%, as shown in Figure 5.
Figure 5.
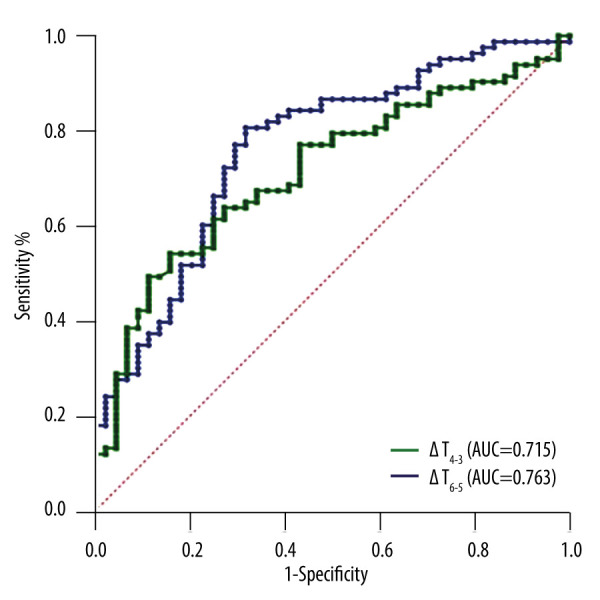
ROC curves for ΔT4-3 (the time span from the periphery to the central area or vice versa) and ΔT6-5 (the time span [absolute value] for the contrast agent to reach the lesion and the surrounding thyroid tissue at the same depth). The Figure was produced using MedCalc version 11.4.2.0 (MedCalc Software, Ostend, Belgium).
Discussion
As a cutting-edge imaging technology, CEUS can provide real-time visualization of microcirculatory perfusion within lesions, enhancing the detection of microvessels and complementing the morphological information obtained through traditional US imaging [14]. The use of CEUS in thyroid diseases has sparked interest in achieving accurate diagnoses through quantitative analysis of perfusion characteristics. Both domestic and foreign studies on CEUS applications in thyroid nodules highlight key malignant perfusion characteristics such as ‘slow progression’, ‘heterogeneous low enhancement’, ‘peripheral to central enhancement’, ‘extrathyroidal invasion’, and ‘peripheral irregular ring enhancement’ [15–17]. The use of arrival time-parametric imaging (At-PI) allows for intuitive assessment of enhancement patterns and timing, as well as quantitative analysis of parameters like arrival time differences in different areas. This technology is also referred to as ‘arrival time parametric imaging (CEUS-PAT)’, ‘color parametric imaging (CPI)’, and ‘arrival time imaging (ATI)’ [10,18,19]. Despite its potential, the literature contains few reports on use of At-PI for assessment of thyroid nodules.
The inflow phase process of CEUS of thyroid nodules is rapid and displays a single color. In small nodules, it can be challenging for the human eye to capture the arterial phase perfusion characteristics, potentially leading to the oversight of crucial diagnostic information. This technology heavily relies on the operator’s subjective judgment, resulting in limited diagnostic efficacy. At-PI technology offers qualitative and quantitative parameters to aid sonographers in diagnosing perfusion characteristics that may be hard to discern visually, reducing discrepancies between different operators in CEUS mode analysis and thereby enhancing the objectivity and confidence of diagnosis. Research by Wakui et al has demonstrated that At-PI excels in detecting the spoke pattern of focal nodular hyperplasia of the liver <3 cm, suggesting its superiority in assessing the enhancement pattern of smaller lesions [20]. Consequently, we conducted a pioneering study using At-PI to enhance the diagnostic accuracy of benign and malignant thyroid tumors.
In this study, At-PI was employed to compare the qualitative characteristics of 127 thyroid nodules. The results indicated that malignant nodules typically exhibit multiple enhancement patterns that occur later than in the surrounding thyroid gland, exhibit centripetal enhancement, and lack perfusion defects, aligning with the conclusions of previous studies.
The normal thyroid gland is characterized by a rich blood supply, with the arterial phase demonstrating rapid and uniform enhancement. The blood perfusion of thyroid nodules is influenced by the quantity, structure, and distribution of blood vessels. We observed that 65.1% of the At-PI enhancement patterns in malignant nodules were centripetal, while 65.9% of benign nodules displayed diffuse patterns. Furthermore, the difference in perfusion defects between benign and malignant nodules as assessed by At-PI was statistically significant (P<0.001). A comparison with US and CEUS revealed that benign nodules frequently exhibit perfusion defects. In cystic-solid nodules, the area that appears on CEUS after the absorption of cyst fluid typically shows no enhancement, along with coarse calcification and significant sound shadowing, which aligns with established guidelines regarding benign characteristics [13]. Currently, scholars assert that PTCs are predominantly tumors characterized by insufficient blood supply, with internal neovascularization often being underdeveloped. The infiltrative growth of the tumor compresses the vasa vasorum, leading to varying degrees of collapse or destruction. Consequently, CEUS enhancement is often delayed compared to the surrounding thyroid tissue, consistent with the findings of this study. The results corroborate previous research [21]; Jin et al suggest that blood vessels in the central regions of malignant lesions are relatively sparse, while those in the peripheral regions are denser, resulting in most malignant nodules exhibiting centripetal enhancement on CEUS [22]. The At-PI results of this study confirm the low efficacy of microvessels in the central area of malignant thyroid nodules. This finding may be attributed to the presence of dense interstitial fibrosis in cancerous tissues, which reduces the density of microvessels within the nodules, often resulting in a relatively low number of central blood vessels. In contrast, the distribution of blood vessels surrounding benign nodules is more regular, characterized by fewer damaged vessels, and there is no significant difference in the blood vessel distribution compared to the surrounding thyroid tissue. Consequently, benign nodules often exhibit diffuse enhancement, aligning with the results reported by Fan et al [23]. The At-PI technology effectively marks the areas where the contrast agent reaches with color, while areas without color marking indicate a lack of perfusion. The display of perfusion defects using At-PI observation is simpler and more intuitive than that of CEUS. Through At-PI, the vascular distribution of tumors can be assessed objectively, enabling researchers to select target areas for further study and analysis. This methodology warrants consideration by other researchers in the field for future investigations [24,25].
In the At-PI quantitative parameter analysis, relative parameters obtained from the differences of At-PI parameters are set in addition to directly measuring the parameters. This approach largely eliminates factors related to the individual’s baseline status, such as cardiac function or overall thyroid perfusion levels affected by diffuse thyroid diseases like hyperthyroidism, hypothyroidism, or Hashimoto’s thyroiditis. The quantitative parameter results of At-PI indicate that the difference in ΔT4-3 was higher in the malignant group compared to the benign group (1.136±1.868s >0.076±1.671 s), and ΔT6-5 was also higher in the malignant group than the benign group (2.182±1.965 s >0.320±1.706). These findings suggest that the contrast agent takes longer to reach the central area of malignant thyroid nodules compared to the periphery, indicating centripetal enhancement. Additionally, the contrast agent takes longer to reach the lesion compared to the surrounding thyroid tissue at the same depth, indicating late enhancement. These results align with the qualitative characteristics observed in this study using At-PI. Qualitative features are easily discernible on At-PI images, but for contentious lesions that are small or challenging to differentiate visually, specific parameters can be employed to quantify perfusion characteristics. The receiver operating characteristic curve (ROC) analysis revealed that the areas under the curve for ΔT4-3 and ΔT6-5 were 0.715 and 0.763, respectively. Using 1.075 s as the cutoff value, ΔT4-3 exhibited a sensitivity of 54.2% and specificity of 84.1%, while ΔT6-5, with a cutoff value of 0.739 s, showed a sensitivity of 80.7% and specificity of 68.2%. We believe that both ΔT4-3 and ΔT6-5 exhibit diagnostic potential for thyroid cancer. In addition to generating a parametric imaging color map to visualize the differences in arrival time on a two-dimensional section, At-PI’s relative parameter ΔT serves as an objective metric for distinguishing between benign and malignant thyroid nodules, demonstrating promising research prospects and application value. This approach is fundamentally analogous to previous research that utilized ΔT to assess the nature of lymph nodes [12].
This study demonstrates that the At-PI feature manifests as an enhanced edge of peritumoral tissue, with early and color-coded enhancement. Additionally, foreign researchers have noted that malignant lesions frequently exhibit irregular peripheral annular enhancement [26–28]. However, there is currently a limited body of research addressing this feature. The extent of early annular enhancement often corresponds with or slightly exceeds the nodule boundary. This phenomenon may be associated with the outward invasive growth of tumor tissue, which stimulates reactive proliferation of the surrounding thyroid tissue, thereby increasing the density of adjacent new blood vessels and enhancing blood flow velocity. Consequently, this results in an increase in microcirculatory blood perfusion. On CEUS, this is observed as an irregular high-enhancement ring with an enlarged border. In At-PI images, it is evident that the peritumoral tissue enhances earlier than the thyroid tissue located in and around the nodule at the same depth during the arterial phase.
This study has several limitations. (1) It was a retrospective study, which introduces potential biases in the data, and the sample size was small, as it is a single-center prospective study, and some thyroid nodules exhibit rare pathological types. (2) The exclusion of these cases may limit the applicability of the study’s results to a broader patient population. Future research should aim to more accurately analyze the qualitative characteristics and quantitative parameters of At-PI for identifying thyroid nodules through larger-sample studies. Such diagnostic advancements could provide a more objective visual reference for clinical practice. (3) The study population comprised a higher number of men than women, which contrasts with previous studies. This discrepancy may be attributed to the fact that our hospital is a military facility, where most surgical patients are men, leading to an inevitable bias. (4) The images obtained through At-PI only depict the blood perfusion pattern during the inflow phase of the arterial phase, thus preventing analysis of the outflow phase. A comprehensive evaluation of the full-time phase of CEUS is necessary in clinical practice. (5) The At-PI software’s mid-arrival time is its sole quantitative parameter, and it does not facilitate the analysis of enhancement intensity. Consequently, it is not advisable to base differential diagnoses solely on the quantitative parameters provided by At-PI.
Conclusions
At-PI can offer more effective parameters for differentiating between benign and malignant thyroid nodules. Several of these parameters have demonstrated diagnostic efficacy in the detection of thyroid cancer. Additionally, At-PI enhances the visualization of ring enhancement in certain thyroid nodules.
Acknowledgements
Throughout the writing of this dissertation, I have received a great deal of support and assistance. I would first like to thank my supervisor, Zhuang-Jin, whose expertise was invaluable in formulating the research questions and methodology. Your insightful feedback pushed me to sharpen my thinking and brought my work to a higher level. I would particularly like to acknowledge my teammates, Qian-qing Feng, Yue-Li, Xin-Yu and Xiao-ni Su for their wonderful collaboration and patient support. Finally, I would like to thank my parents and husband for their wise counsel and sympathetic ear. You are always there for me.
Abbreviations
- C-TIRADS
Chinese Thyroid Imaging Reporting and Data System
- CEUS
contrast-enhanced ultrasound
- FNA
fine-needle aspiration
- AUC
area under the curve
- At-PI
arrival time parameter imaging
- ROC
Receiver Operating Characteristic
- US
ultrasound
- PTC
papillary thyroid carcinoma
- CEUS-PAT
arrival time parametric imaging
- CPI
color parametric imaging
- ATI
arrival time imaging
Footnotes
Conflict of interest: None declared
Declaration of Figures’ Authenticity: All figures submitted have been created by the authors, who confirm that the images are original with no duplication and have not been previously published in whole or in part.
Financial support: This study has received funding by the Science and Technology Program of Shenyang (grant number 20-205-4-058)
References
- 1.Boucai L, Zafereo M, Cabanillas ME. Thyroid cancer: A review. JAMA. 2024;331(5):425–35. doi: 10.1001/jama.2023.26348. [DOI] [PubMed] [Google Scholar]
- 2.Siegel RL, Miller KD, Wagle NS, Jemal A. Cancer statistics, 2023. Cancer J Clin. 2023;73(1):17–48. doi: 10.3322/caac.21763. [DOI] [PubMed] [Google Scholar]
- 3.Brandenstein M, Wiesinger I, Künzel J, et al. Multiparametric sonographic imaging of thyroid lesions: Chances of B-mode, elastography and CEUS in relation to preoperative histopathology. Cancers (Basel) 2022;14(19):4745. doi: 10.3390/cancers14194745. [DOI] [PMC free article] [PubMed] [Google Scholar]
- 4.Chen DW, Lang BHH, McLeod DSA, et al. Thyroid cancer. Lancet. 2023;401(10387):1531–44. doi: 10.1016/S0140-6736(23)00020-X. [DOI] [PubMed] [Google Scholar]
- 5.Jin Z, Zhu Y, Lei Y, et al. Clinical application of C-TIRADS category and contrast-enhanced ultrasound in differential diagnosis of solid thyroid nodules measuring ≥1 cm. Med Sci Monit. 2022;28:e936368. doi: 10.12659/MSM.936368. [DOI] [PMC free article] [PubMed] [Google Scholar]
- 6.Haugen BR, Alexander EK, Bible KC, et al. 2015 American Thyroid Association management guidelines for adult patients with thyroid nodules and differentiated thyroid cancer: The American Thyroid Association Guidelines Task Force on Thyroid Nodules and Differentiated Thyroid Cancer. Thyroid. 2016;26(1):1–133. doi: 10.1089/thy.2015.0020. [DOI] [PMC free article] [PubMed] [Google Scholar]
- 7.Antonia TD, Maria LI, Ancuta-Augustina GG. Preoperative evaluation of thyroid nodules – diagnosis and management strategies. Pathol Res Pract. 2023;246:154516. doi: 10.1016/j.prp.2023.154516. [DOI] [PubMed] [Google Scholar]
- 8.Trimboli P, Castellana M, Virili C, et al. Performance of contrast-enhanced ultrasound (CEUS) in assessing thyroid nodules: A systematic review and meta-analysis using histological standard of reference. Radiol Med. 2020;125(4):406–15. doi: 10.1007/s11547-019-01129-2. [DOI] [PubMed] [Google Scholar]
- 9.Yi D, Fan L, Zhu J, et al. The diagnostic value of a nomogram based on multimodal ultrasonography for thyroid-nodule differentiation: A multicenter study. Front Oncol. 2022;12:970758. doi: 10.3389/fonc.2022.970758. [DOI] [PMC free article] [PubMed] [Google Scholar]
- 10.Lupuşoru R, Sporea I, Raţiu I, et al. Contrast-enhanced ultrasonography with arrival time parametric imaging as a non-invasive diagnostic tool for liver cirrhosis. Diagnostics (Basel) 2022;12(12):3013. doi: 10.3390/diagnostics12123013. [DOI] [PMC free article] [PubMed] [Google Scholar]
- 11.Noro A, Nakamura T, Hirai T, et al. Impact of parametric imaging on contrast-enhanced ultrasound of breast cancer. J Med Ultrason (2001) 2016;43(2):227–35. doi: 10.1007/s10396-015-0692-7. [DOI] [PubMed] [Google Scholar]
- 12.Yin SS, Cui QL, Fan ZH, et al. Diagnostic value of arrival time parametric imaging using contrast-enhanced ultrasonography in superficial enlarged lymph nodes. J Ultrasound Med. 2019;38(5):1287–98. doi: 10.1002/jum.14809. [DOI] [PubMed] [Google Scholar]
- 13.Zhou J, Yin L, Wei X, et al. 2020 Chinese guidelines for ultrasound malignancy risk stratification of thyroid nodules: The C-TIRADS. Endocrine. 2020;70(2):256–79. doi: 10.1007/s12020-020-02441-y. [DOI] [PubMed] [Google Scholar]
- 14.Lu J, Zhou P, Jin C, Xu L, et al. Diagnostic value of contrast-enhanced ultrasonography with sonovue in the differentiation of benign and malignant breast lesions: A meta-analysis. Technol Cancer Res Treat. 2020;19:1533033820971583. doi: 10.1177/1533033820971583. [DOI] [PMC free article] [PubMed] [Google Scholar]
- 15.Ruan J, Xu X, Cai Y, et al. A practical CEUS thyroid reporting system for thyroid nodules. Radiology. 2022;305(1):149–59. doi: 10.1148/radiol.212319. [DOI] [PubMed] [Google Scholar]
- 16.Wang Y, Nie F, Wang G, et al. Value of combining clinical factors, conventional ultrasound, and contrast-enhanced ultrasound features in preoperative prediction of central lymph node metastases of different sized papillary thyroid carcinomas. Cancer Manag Res. 2021;13:3403–15. doi: 10.2147/CMAR.S299157. [DOI] [PMC free article] [PubMed] [Google Scholar]
- 17.Jin ZQ, Yu HZ, Mo CJ, Su RQ. Clinical study of the prediction of malignancy in thyroid nodules: Modified score versus 2017 American College of Radiology’s thyroid imaging reporting and data system ultrasound lexicon. Ultrasound Med Biol. 2019;45(7):1627–37. doi: 10.1016/j.ultrasmedbio.2019.03.014. [DOI] [PubMed] [Google Scholar]
- 18.Wu XF, Bai XM, Yang W, et al. Differentiation of atypical hepatic hemangioma from liver metastases: Diagnostic performance of a novel type of color contrast enhanced ultrasound. World J Gastroenterol. 2020;26(9):960–72. doi: 10.3748/wjg.v26.i9.960. [DOI] [PMC free article] [PubMed] [Google Scholar]
- 19.Sugimoto K, Moriyasu F, Kamiyama N, et al. Parametric imaging of contrast ultrasound for the evaluation of neovascularization in liver tumors. Hepatol Res. 2007;37(6):464–72. doi: 10.1111/j.1872-034X.2007.00060.x. [DOI] [PubMed] [Google Scholar]
- 20.Wakui N, Takayama R, Kamiyama N, et al. Arrival time parametric imaging using Sonazoid-enhanced ultrasonography is useful for the detection of spoke-wheel patterns of focal nodular hyperplasia smaller than 3 cm. Exp Ther Med. 2013;5(6):1551–54. doi: 10.3892/etm.2013.1048. [DOI] [PMC free article] [PubMed] [Google Scholar]
- 21.Xu Y, Qi X, Zhao X, et al. Clinical diagnostic value of contrast-enhanced ultrasound and TI-RADS classification for benign and malignant thyroid tumors: One comparative cohort study. Medicine (Baltimore) 2019;98(4):e14051. doi: 10.1097/MD.0000000000014051. [DOI] [PMC free article] [PubMed] [Google Scholar]
- 22.Jin Z, Zhu Y, Xie F, et al. Contrast agent retention features in contrast-enhanced ultrasound: diagnostic performance for the prediction of papillary thyroid carcinoma. Clin Imaging. 2021;80:131–38. doi: 10.1016/j.clinimag.2021.06.030. [DOI] [PubMed] [Google Scholar]
- 23.Fan J, Tao L, Zhan W, et al. Diagnostic value of qualitative and quantitative parameters of contrast-enhanced ultrasound for differentiating differentiated thyroid carcinomas from benign nodules. Front Endocrinol (Lausanne) 2024;14:1240615. doi: 10.3389/fendo.2023.1240615. [DOI] [PMC free article] [PubMed] [Google Scholar]
- 24.Sugimoto K, Moriyasu F, Kamiyama N, et al. Correlation between parametric imaging using contrast ultrasound and the histological differentiation of hepatocellular carcinoma. Hepatol Res. 2008;38(3):273–80. doi: 10.1111/j.1872-034X.2007.00259.x. [DOI] [PubMed] [Google Scholar]
- 25.Watanabe M, Shiozawa K, Takahashi M, et al. Parametric imaging using contrast-enhanced ultrasound with Sonazoid for hepatocellular carcinoma. J Med Ultrason (2001) 2010;37(2):81–86. doi: 10.1007/s10396-009-0254-y. [DOI] [PubMed] [Google Scholar]
- 26.Luo W, Yang X, Yuan J, et al. Evaluation of characteristics of thyroid nodules on contrast-enhanced ultrasonography: A retrospective analysis of 252 cases. Med Ultrason. 2020;22(2):164–70. doi: 10.11152/mu-2252. [DOI] [PubMed] [Google Scholar]
- 27.Zhu T, Chen J, Zhou Z, et al. Differentiation of thyroid nodules (C-TIRADS 4) by combining contrast-enhanced ultrasound diagnosis model with chinese thyroid imaging reporting and data system. Front Oncol. 2022;12:840819. doi: 10.3389/fonc.2022.840819. [DOI] [PMC free article] [PubMed] [Google Scholar]
- 28.Radzina M, Ratniece M, et al. Performance of contrast-enhanced ultrasound in thyroid nodules: review of current state and future perspectives. Cancers (Basel) 2021;13(21):5469. doi: 10.3390/cancers13215469. [DOI] [PMC free article] [PubMed] [Google Scholar]