

Abstract
Indices of cardiac structure and function, such as left ventricular (LV) mass and ejection fraction, have been associated with risk of incident heart failure (HF), but the clinical relevance of data-driven grouping of a comprehensive set of cardiac parameters is unclear. In Multi-Ethnic Study of Atherosclerosis participants, latent class analysis was applied in the sample stratified by gender to define phenogroups on the basis of cardiovascular magnetic resonance imaging parameters of right ventricular and LV structure and function at baseline. Cox proportional hazard models in gender-stratified analyses were used to assess the association between phenogroup membership and risk of HF subtypes adjusting for potential confounders. In the 4,204 participants (mean age 61 ± 10 years, 53% women), the mean follow-up time was 14 ± 4 years for men and 15 ± 4 years for women. For both genders, 4 distinct phenogroups were identified: (1) ideal cardiac mechanics; (2) higher output/hypertrophied LV; (3) impaired ejection fraction/dilated LV; and (4) higher output/hyperdynamic (LV). Men in phenogroups 4 (hazard ratio [HR] 2.91, 95% confidence interval [CI] 1.60 to 5.31, p = 0.0005), 3 (HR 3.52, 95% CI 1.90 to 6.53, p <0.0001), and 2 (HR 3.49, 95% CI 1.94 to 6.28, p <0.0001) had higher rates of incident HF than did men in phenogroup 1, in fully adjusted models. No significant associations were found between phenogroup membership and incident HF in women. In conclusion, phenogroup membership based on cardiac structure and function in men was significantly associated with incident HF. Integration of cardiac magnetic resonance imaging variables may help identify differential risk for HF in men.
Heart failure (HF) is an important cause of cardiovascular morbidity and mortality worldwide.1 In the United States, approximately 6.2 million subjects are affected by HF, and this figure is expected to increase to more than 8 million by the year 2030.2 Gender differences exist in adverse cardiac remodeling and presentation of HF, with women more likely than men to develop HF with preserved ejection fraction (HFpEF).3 As such, focusing on gender-specific prevention strategies for HF by identifying subclinical phenotypes in men and women is critical. Although evidence suggests that specific cardiac parameters of structure and function are associated with incident HF,4–7 most analyses have focused on individual metrics or grouped parameters by physiologic relevance to cardiac mechanics or structure.6 In recent times, the use of latent class analysis techniques has enabled researchers to cluster subjects into discrete subgroups by maximizing intragroup similarities and intergroup differences in several demographic, physiologic, and biologic features.8,9 Phenogrouping has been used to identify subgroups within HFpEF,8,10 but data are limited for upstream categorization of risk for incident HF and across HF subtypes—any HF, HFpEF, and HF with reduced ejection fraction (HFrEF). This study aimed to identify gender-specific phenogroups in participants in the MESA (Multi-Ethnic Study of Atherosclerosis) on the basis of cardiac magnetic resonance imaging (cMRI) parameters and to examine risk of incident HF across subtypes (any HF, HFrEF, HFpEF) in different phenogroups.
Methods
Participants were part of the MESA, which is a multicenter longitudinal study designed to investigate the risk factors for, and implications of, subclinical cardiovascular disease (CVD).11 The details of the study have been described previously.11,12 Briefly, between July 2000 and August 2002, 6,814 subjects (aged between 45 and 84 years) from 4 different self-described racial/ethnic backgrounds were recruited from 6 US communities in North Carolina, New York, Maryland, Illinois, Minnesota, and California. Participants with clinical CVD, current atrial fibrillation, and those who were actively being treated for cancer were excluded. Participants who had undergone any cardiovascular procedure, were pregnant, weighed more than 136 kg, or had any serious medical conditions that prevented long-term follow-up were also excluded.
Of the 6,814 MESA participants, 5,098 underwent cMRI at the baseline examination. Of the 5,098 cMRI scans, 5,004 showed interpretable left ventricular (LV) measures.12 The MESA-Right Ventricle study was an ancillary study that selected 4,634 scans from MESA and analyzed 4,204 that had interpretable right ventricular (RV) morphology (Supplementary Figure 1).12 The study protocol was approved by the institutional review boards of the institutions involved. All participants provided informed consent.
Participants underwent cMRI on 1.5-T magnetic resonance imaging scanners (Avanto and Espree, Siemens Medical Systems; Signa LX, GE Healthcare, Little Chalfont, United Kingdom).11,13 The details of the cMRI protocol have previously been described.13,14 Long-axis cine images were obtained from 2-chamber and 4-chamber views, using electrocardiogram-gated fast gradient-echo pulse sequence. Short-axis images were recorded at end-diastole and were used for the assessment of LV mass. LV thickness, RV diameter, and tricuspid annular plane systolic excursion were measured by 4-chamber gradient-echo pulse magnetic resonance imaging. LV end-diastolic and end-systolic volumes were calculated using Simpson’s rule (the summation of areas on each separate slice multiplied by the sum of slice thickness and image gap). LV mass was determined using the sum of the myocardial area times slice thickness plus image gap at the end of diastole, multiplied by the specific density of the myocardium (1.05 g/ml). The papillary muscles were included in the measurement of LV end-diastolic and end-systolic volumes but excluded from the measurement of LV mass. LV stroke volume was defined as the difference between the LV end-diastolic volume and LV end-systolic volume. LV ejection fraction was calculated by dividing the LV stroke volume by the LV end-diastolic volume, multiplied by 100. Cardiac output was calculated by multiplying the LV stroke volume by the heart rate.13 RV end-diastolic volume, end-systolic volume, stroke volume, and ejection fraction were determined using the same formulas as for the LV.12 RV mass was calculated as the difference between end-diastolic epicardial and endocardial volumes multiplied by the specific density of the myocardium.12
The primary outcome of interest in this study was incident HF. HFpEF and HFrEF were analyzed as secondary end points. Participants have been followed for ≥14 years with in-person and telephone encounters every 9 to 12 months.11,15 In MESA, HF was classified as definite, probable, or absent. Probable HF was defined on the basis of symptomatic diagnosis by a physician for a patient receiving medical treatment for HF. In addition to the criteria required for probable HF, definite HF diagnosis required additional evidence of pulmonary edema/congestion by chest X-ray examination and/or dilated ventricle or poor LV function by echocardiography or ventriculography or evidence of LV diastolic dysfunction. Two physicians reviewed and adjudicated all records for HF diagnosis.15 For our analyses, participants with definite or probable HF were classified as having incident HF consistent with previous analyses in MESA.7 In addition, on the basis of echocardiographic findings at the time of HF diagnosis, we classified participants who had definite or probable HF with ejection fraction ≥50% or <50% as HFpEF and HFrEF, respectively.
Covariate information was ascertained at the baseline visit. Information about age, gender, race/ethnicity, cigarette smoking, and educational status was obtained through self-report. Smoking status was categorized as current, former, or never smoker. Resting blood pressure was measured 3 times, and the average of the last 2 readings was used in analyses of blood pressure.11 Hypertension was defined as average blood pressure measurements of ≥140 systolic or ≥90 mm Hg diastolic, or report of antihypertensive medication usage or self-report of hypertension based on accepted definitions at the time of the baseline encounter.16 Blood was drawn after a 12-hour fast, for the measurement of fasting blood glucose. Diabetes was defined as fasting glucose ≥126 mg/100 ml or report of hypoglycemic agent usage, or self-report of diabetes.17 Body mass index (BMI) was calculated as weight in kilograms divided by the square of height in meters.18
Because of physiologic differences in cardiac structure by gender, all analyses were stratified by gender a priori. Latent class analysis was then used to define clusters or phenogroups on the basis of baseline measurements of multiple cMRI parameters of LV and RV structure and function. Participants were clustered on the basis of 15 cMRI variables, including LV cardiac output, LV wall thickness, LV end-diastolic mass, LV end-diastolic volume, LV endsystolic volume, LV stroke volume, LV ejection fraction, RV diameter, RV end-diastolic volume, RV end-systolic volume, RV stroke volume, RV cardiac output, RV ejection fraction, RV end-diastolic mass, and tricuspid annular plane systolic excursion. For the latent class analysis, the SAS procedure “proc lca” was used to cluster participants into phenogroups based on similarities and differences in 15 cMRI variables. Two response categories were created to represent the number of response categories of the cMRI variables by dichotomizing cMRI variables at the median. To determine the optimal number of phenogroups, the latent class analysis was started with consideration of 2 groups (or clusters); groups were subsequently added to the model, 1 group at a time, considering up to 7 phenogroups. The optimal number of clusters or phenogroups was determined on the basis of statistical criteria: Akaike’s Information Criterion, Bayesian Information Criterion, and visual inspection.
Baseline characteristics were compared among the different phenogroups, using generalized linear models for continuous variables and chi-square tests for categorical variables. Histograms were used to compare the baseline distribution of 4 cMRI variables included in the latent class analysis in men and women separately. Overlay histograms were also used to compare the ejection fraction at baseline and at the time of HF diagnosis in men and women.
Kaplan–Meier survival analysis was used to compare incident HF across phenogroups as the primary outcome and HF subtypes (HFpEF, and HFrEF) as the secondary outcome. Cox proportional hazard models were used to assess the association between phenogroup membership and risk of incident HF (and HF subtypes), using phenogroup 1 as the reference group. Complete case analyses were used in the Cox proportional models. Model 1 was unadjusted. Model 2 was adjusted for age, race, education, BMI, hypertension, diabetes, and cigarette smoking. All statistical analyses were performed using SAS statistical software (version 9.4, SAS Institute, Cary, North Carolina) and R statistical software (version 4.1.0, The R Foundation for Statistical Computing, Vienna, Austria). Statistical significance was defined as p <0.05.
Results
In 4,204 participants included, the mean age was 61 ± 10 years, and 53% were women. The mean follow-up time was 14 ± 4 years for men and 15 ± 4 years for women. The distribution of cMRI variables at baseline was skewed for men and women (Supplementary Figures 2 and 3), with higher RV ejection fraction and RV end-diastolic volume in women than in men. The ejection fraction at baseline and at the time of HF diagnosis was also higher in women than in men (Supplementary Figure 4). In men and women separately, 4 distinct phenogroups were identified on the basis of Akaike’s Information Criterion, Bayesian Information Criterion, and visual inspection. The 4 phenogroups were described as (1) ideal cardiac mechanics; (2) higher output/hypertrophied LV; (3) impaired EF/dilated LV; and (4) higher output/hyperdynamic (LV). In both men and women, participants in phenogroups 2, 3, and 4 were younger and had higher BMI and lower heart rate than did participants in phenogroup 1 (Table 1). Of the 4,204 participants, 4,180 (99%), 4,067 (97%), and 4,039 (96%) had all covariate data for incident HF, HFrEF, and HFpEF, respectively, and were included in the complete case analyses.
Table 1.
Baseline characteristics of MESA participants by sex and phenogroup
| Men, n = 1995 | |||||
|---|---|---|---|---|---|
|
| |||||
| Variable | Phenogroup 1 (ideal cardiac mechanics) (n = 589) | Phenogroup 2 (higher output/ hypertrophied LV) (n = 673) | Phenogroup 3 (impaired EF/ dilated LV) (n = 359) | Phenogroup 4 (higher output/ hyperdynamic LV) (n = 374) | p-Value |
|
| |||||
| Age (years) | 64.9 (10.0) | 58.3 (9.5) | 60.3 (9.4) | 63.0 (9.7) | <.0001 |
| Ethnicity | |||||
| White | 188 (31.9%) | 304 (45.2%) | 146 (40.7%) | 131 (35.0%) | <.0001 |
| Chinese American | 145 (24.6%) | 29 (4.3%) | 32 (8.9%) | 47 (12.6%) | |
| Black | 140 (23.8%) | 186 (27.6%) | 89 (24.8%) | 88 (23.5%) | |
| Hispanic | 116 (19.7%) | 154 (22.9%) | 92 (25.6%) | 108 (28.9%) | |
| BMI (kg/m2) | 25.8 (3.9) | 28.9 (4.0) | 27.8 (3.9) | 27.4 (3.9) | <.0001 |
| Smoking status | |||||
| Never | 260 (44.3%) | 275 (40.9%) | 146 (40.9%) | 156 (41.7%) | 0.87 |
| Former | 251 (42.8%) | 299 (44.5%) | 156 (43.7%) | 167 (44.7%) | |
| Current | 76 (13.0%) | 98 (14.6%) | 55 (15.4%) | 51 (13.6%) | |
| Educational status | |||||
| Less than high school | 107 (18.2%) | 68 (10.1%) | 49 (13.7%) | 83 (22.2%) | <.0001 |
| High school or more | 480 (81.8%) | 604 (89.9%) | 308 (86.3%) | 291 (77.8%) | |
| Diabetes mellitus | 82 (13.9%) | 85 (12.6%) | 50 (13.9%) | 50 (13.4%) | 0.90 |
| Hypertension | 271 (46.0%) | 284 (42.2%) | 132 (36.8%) | 196 (52.4%) | 0.0002 |
| Heart rate (beats/min) | 63.9 (10.0) | 59.1 (9.1) | 62.2 (9.7) | 61.5 (9.5) | <.0001 |
| Systolic blood pressure (mmHg) | 124.8 (18.3) | 124.6 (18.8) | 121.9 (17.8) | 129.4 (20.2) | <.0001 |
| Fasting blood glucose (mg/dl) | 100.2 (29.9) | 96.2 (27.0) | 101.4 (36.4) | 100.1 (33.4) | 0.03 |
|
| |||||
| Women, N= 2209 | |||||
|
| |||||
| Variable | Phenogroup 1 (ideal cardiac mechanics) (n = 653) | Phenogroup 2 (higher output/ hypertrophied LV) (n = 679) | Phenogroup 3 (impaired EF/ dilated LV) (n = 429) | Phenogroup 4 (higher output/ hyperdynamic LV) (n = 448) | p-Value |
|
| |||||
| Age (years) | 65.2 (10.0) | 57.6 (8.9) | 61.4 (10.2) | 61.9 (9.8) | <.0001 |
| Ethnicity | |||||
| White | 261 (40.0%) | 256 (37.7%) | 176 (41.0%) | 183 (40.9%) | <.0001 |
| Chinese American | 140 (21.4%) | 35 (5.2%) | 51 (11.9%) | 43 (9.6%) | |
| Black | 127 (19.5%) | 247 (36.4%) | 113 (26.3%) | 122 (27.2%) | |
| Hispanic | 125 (19.1%) | 141 (20.8%) | 89 (20.8%) | 100 (22.3%) | |
| BMI (kg/m2) | 25.6 (4.6) | 31.0 (5.9) | 27.4 (4.7) | 28.5 (5.3) | <.0001 |
| Smoking status | |||||
| Never | 430 (66.2%) | 388 (57.3%) | 247 (57.7%) | 265 (59.4%) | 0.002 |
| Former | 167 (25.7%) | 207 (30.6%) | 116 (27.1%) | 133 (29.8%) | |
| Current | 53 (8.2%) | 82 (12.1%) | 65 (15.2%) | 48 (10.8%) | |
| Educational status | |||||
| Less than high school | 146 (22.5%) | 85 (12.6%) | 62 (14.5%) | 82 (18.4%) | <.0001 |
| High school or more | 504 (77.5%) | 592 (87.4%) | 366 (85.5%) | 364 (81.6%) | |
| Diabetes mellitus | 73 (11.2%) | 87 (12.8%) | 44 (10.2%) | 47 (10.5%) | 0.51 |
| Hypertension | 302 (46.3%) | 320 (47.1%) | 175 (40.8%) | 240 (53.6%) | 0.002 |
| Heart rate (beats/min) | 65.5 (9.2) | 63.2 (9.0) | 64.1 (8.9) | 62.6 (9.0) | <.0001 |
| Systolic blood pressure (mmHg) | 127.2 (23.0) | 124.5 (22.0) | 123.2 (22.2) | 128.5 (23.5) | 0.0009 |
| Fasting blood glucose (mg/dl) | 94.5 (27.3) | 94.5 (26.7) | 91.3 (24.2) | 93.6 (26.1) | 0.18 |
BMI = body mass index.
Continuous variables are presented as mean (standard deviation); categorical variables are presented as number (percentage).
In men, participants in phenogroups 2, 3, and 4 had higher cardiac output, higher LV and RV end-diastolic mass, and higher LV and RV stroke volume than did participants in phenogroup 1 (Table 2). A similar pattern was seen in the comparison of differences in baseline cMRI characteristics among phenogroups in women (Table 2).
Table 2.
Baseline measures of cardiac structure and function of MESA participants by sex and phenogroup
| Men, N = 1995 | |||||
|---|---|---|---|---|---|
|
| |||||
| Variable | Phenogroup 1 (ideal cardiac mechanics) n = 589 | Phenogroup 2 (higher output/ hypertrophied LV) n = 673 | Phenogroup 3 (impaired EF/ dilated LV) n = 359 | Phenogroup 4 (higher output/ hyperdynamic LV) n = 374 | p-Value |
|
| |||||
| Cardiac output (L/min) | 4.9 (1.1) | 6.9 (1.4) | 5.4 (1.1) | 6.4 (1.4) | <.0001 |
| Mean LV wall thickness, End-diastole (mm) | 10.1 (1.9) | 10.2 (1.6) | 10.5 (1.8) | 9.9 (1.9) | <.0001 |
| LV end-diastolic mass (g) | 118.9 (19.9) | 155.0 (25.2) | 141.4 (23.7) | 135.6 (23.2) | <.0001 |
| LV end-diastolic volume (mL) | 111.9 (17.1) | 171.2 (23.9) | 139.7 (19.6) | 138.9 (17.5) | <.0001 |
| LV end-systolic volume (mL) | 44.7 (10.7) | 65.7 (16.6) | 60.4 (15.1) | 49.5 (10.8) | <.0001 |
| LV ejection fraction (%) | 60.1 (6.1) | 61.9 (5.7) | 57.0 (6.3) | 64.5 (5.6) | <.0001 |
| LV stroke volume (mL) | 67.2 (11.7) | 105.5 (14.6) | 79.2 (11.5) | 89.5 (12.8) | <.0001 |
| RV diameter (mm) | 40.9 (5.2) | 47.8 (5.3) | 45.0 (5.4) | 44.2 (4.9) | <.0001 |
| RV end-diastolic volume (mL) | 110.2 (14.5) | 170.5 (21.1) | 143.8 (15.2) | 132.9 (13.1) | <.0001 |
| RV end-systolic volume (mL) | 34.8 (8.3) | 55.2 (12.6) | 53.9 (9.5) | 34.4 (5.6) | <.0001 |
| RV stroke volume (mL) | 75.4 (11.1) | 115.3 (15.8) | 89.9 (11.8) | 98.4 (10.6) | <.0001 |
| RV cardiac output (L/min) | 4.9 (1.2) | 6.8 (1.8) | 5.7 (1.3) | 6.3 (1.5) | <.0001 |
| RV ejection fraction (%) | 68.5 (5.9) | 67.7 (5.3) | 62.5 (5.0) | 74.1 (3.3) | <.0001 |
| RV end-diastolic mass (g) | 19.0 (2.3) | 27.0 (3.6) | 23.5 (2.8) | 22.0 (2.7) | <.0001 |
| Tricuspid annular plane systolic excursion (mm) | 16.6 (5.8) | 17.5 (4.9) | 16.7 (4.3) | 16.9 (4.7) | 0.18 |
|
| |||||
| Women, n = 2209 | |||||
|
| |||||
| Phenogroup 1 (ideal cardiac mechanics) n = 653 | Phenogroup 2 (higher output/ hypertrophied LV) n = 679 | Phenogroup 3 (impaired EF/ dilated LV) n = 429 | Phenogroup 4 (higher output/ hyperdynamic LV) n = 448 | p-Value | |
|
| |||||
| Cardiac output (L/min) | 4.7 (1.0) | 6.3 (1.4) | 4.9 (1.0) | 5.8 (1.2) | <.0001 |
| Mean LV wall thickness, end-diastole (mm) | 8.4 (1.5) | 8.7 (1.5) | 8.7 (1.7) | 8.6 (1.5) | <.0001 |
| LV end-diastolic mass (g) | 91.6 (15.1) | 118.4 (20.2) | 101.7 (17.2) | 107.6 (18.3) | <.0001 |
| LV end-diastolic volume (mL) | 95.4 (11.8) | 139.4 (19.4) | 110.1 (15.4) | 122.4 (15.2) | <.0001 |
| LV end-systolic volume (mL) | 34.9 (6.1) | 50.0 (10.6) | 43.2 (9.8) | 41.9 (9.6) | <.0001 |
| LV ejection fraction (%) | 63.2 (5.2) | 64.2 (5.0) | 60.8 (6.2) | 65.9 (5.4) | <.0001 |
| LV stroke volume (mL) | 60.4 (9.5) | 89.4 (13.9) | 66.9 (11.2) | 80.5 (11.1) | <.0001 |
| RV diameter (mm) | 37.7 (4.7) | 43.0 (4.7) | 39.8 (4.7) | 40.4 (4.6) | <.0001 |
| RV end-diastolic volume (mL) | 85.6 (10.9) | 134.0 (17.7) | 104.2 (11.2) | 110.4 (12.2) | <.0001 |
| RV end-systolic volume (mL) | 21.5 (4.7) | 40.0 (8.7) | 35.2 (6.3) | 24.1 (3.8) | <.0001 |
| RV stroke volume (mL) | 64.1 (8.9) | 94.0 (13.5) | 69.0 (8.7) | 86.3 (10.8) | <.0001 |
| RV cardiac output (L/min) | 4.4 (1.1) | 6.1 (1.5) | 4.4 (1.1) | 5.6 (1.4) | <.0001 |
| RV ejection fraction (%) | 74.9 (4.7) | 70.2 (4.6) | 66.2 (4.6) | 78.1 (3.0) | <.0001 |
| RV end-diastolic mass (g) | 15.9 (2.1) | 22.6 (3.1) | 18.8 (2.4) | 19.3 (2.3) | <.0001 |
| Tricuspid annular plane systolic excursion (mm) | 16.3 (4.9) | 16.6 (4.8) | 16.3 (4.0) | 17.4 (6.1) | 0.10 |
BMI = body mass index; LV = left ventricular; RV = right ventricular.
Continuous variables are presented as mean (standard deviation); categorical variables are presented as number (percentage).
In men and women, incident HF occurred in 124 and 93, respectively. For men, the rates of incident HF were 17 of 124 (14%) for phenogroup 1, 48 of 124 (39%) for phenogroup 2, 29 of 124 (23%) for phenogroup 3, and 30 of 124 (24%) for phenogroup 4 (log-rank p = 0.002; Figure 1). The rates of incident HF in women were 33 of 93 (35%), 25 of 93 (27%), 16 of 93 (17%), and 19 of 93 (20%) for phenogroups 1, 2, 3, and 4, respectively (log-rank p = 0.49; Figure 2). In men, participants in phenogroup 4 (hazard ratio [HR] 2.91, 95% confidence interval [CI] 1.60 to 5.31, p = 0.0005), phenogroup 3 (HR 3.52, 95% CI 1.90 to 6.53, p <0.0001), and phenogroup 2 (HR 3.49, 95% CI 1.94 to 6.28, p <0.0001) each had greater hazards of HF than did participants in phenogroup 1, adjusting for age, race, education status, BMI, hypertension status, diabetes status, and cigarette smoking. In women, no significant associations were found for the association between phenogroup membership and incident HF in fully adjusted models (Table 3).
Figure 1.

Kaplan–Meier curves for incident heart failure for men.
Figure 2.
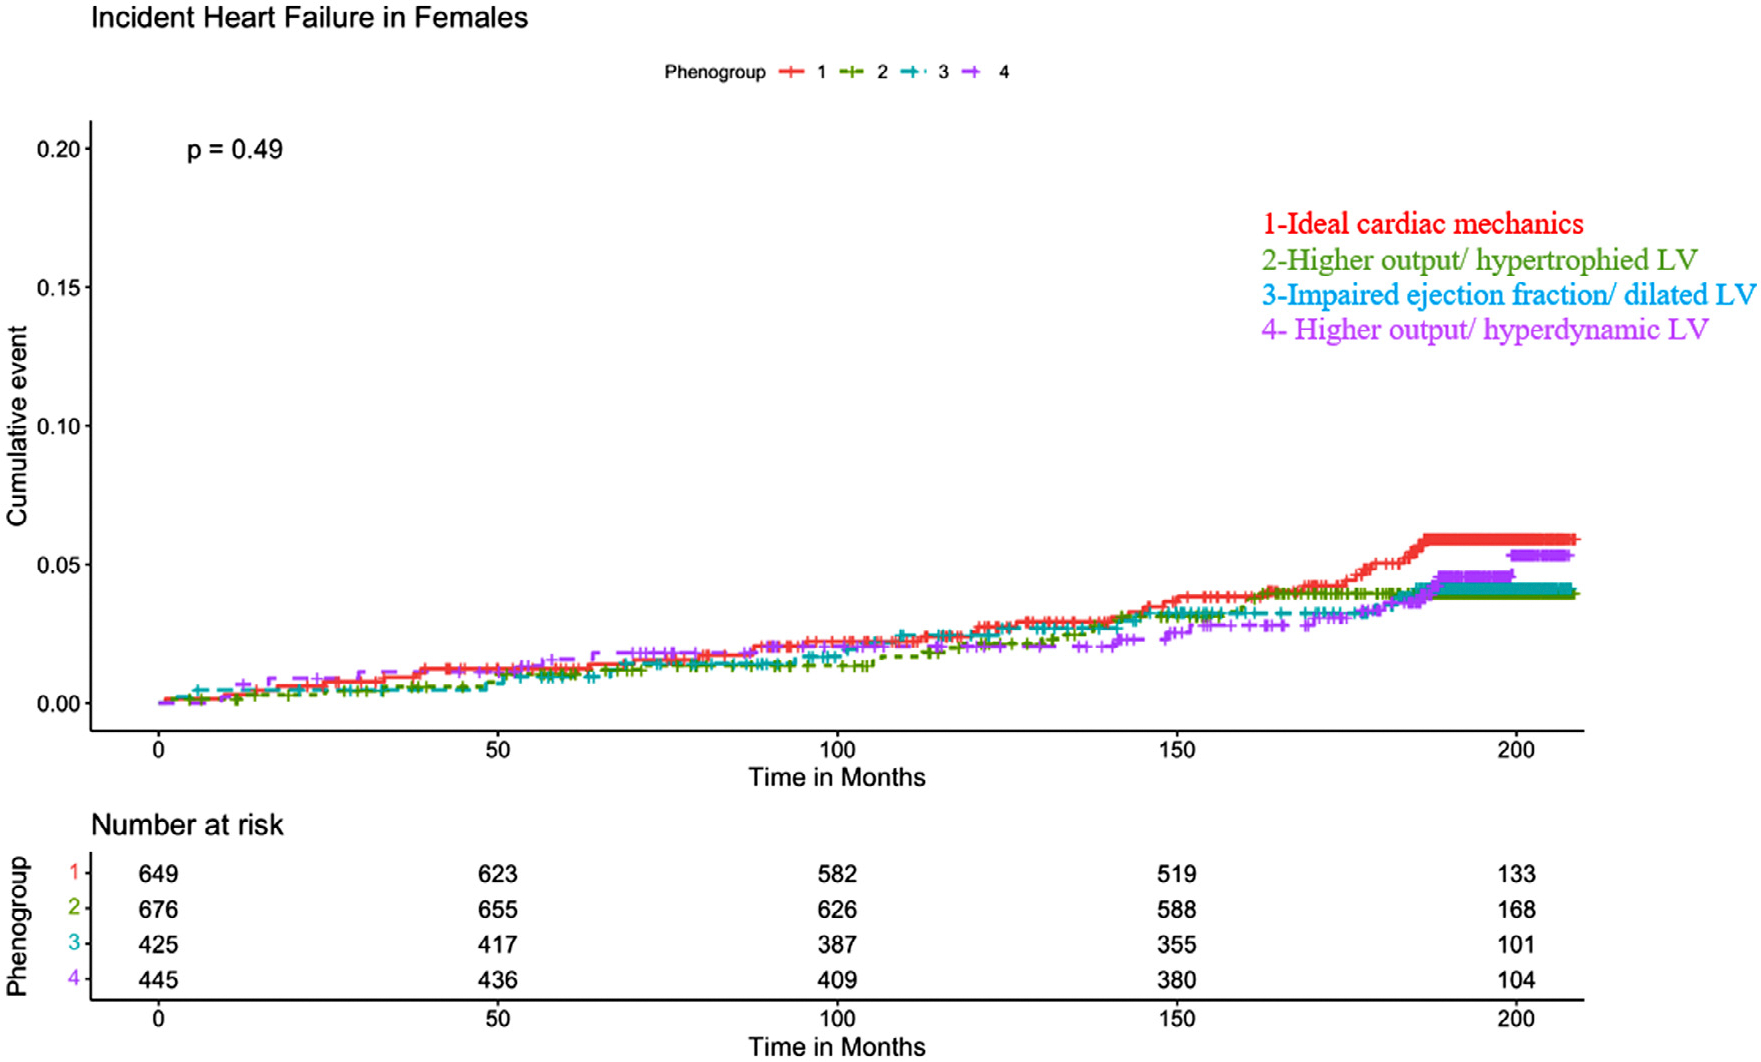
Kaplan–Meier curves for incident heart failure for women.
Table 3.
Cox proportional hazard models for incident heart failure
| Men, n = 1985 | |||||
|---|---|---|---|---|---|
|
| |||||
| Model 1* |
Model 2 |
||||
| HR (95% CI) | p-Value | HR (95% CI) | p-Value | ||
|
| |||||
| Phenogroup 1 (ideal cardiac mechanics) | Referent | - | Referent | - | |
| Phenogroup 2 (higher output/hypertrophied LV) | 2.36 (1.36, 4.10) | 0.002 | 3.49 (1.94, 6.28) | <.0001 | |
| Phenogroup 3 (impaired EF/dilated LV) | 2.72 (1.49, 4.94) | 0.001 | 3.52 (1.90, 6.53) | <.0001 | |
| Phenogroup 4 (higher output/hyperdynamic LV) | 2.82 (1.56, 5.12) | 0.0006 | 2.91 (1.60, 5.31) | 0.0005 | |
|
| |||||
| Women, n = 2195 | |||||
|
| |||||
| Phenogroup 1 (ideal cardiac mechanics) | Referent | - | Referent | ———- | |
| Phenogroup 2 (higher output/ hypertrophied LV) | 0.69 (0.41, 1.15) | 0.16 | 0.98 (0.53, 1.77) | 0.94 | |
| Phenogroup 3 (impaired EF/dilated LV) | 0.71 (0.39, 1.30) | 0.27 | 0.85 (0.46, 1.56) | 0.60 | |
| Phenogroup 4 (higher output/hyperdynamic LV) | 0.80 (0.45, 1.41) | 0.44 | 0.79 (0.44, 1.43) | 0.44 | |
95% CI = 95% confidence interval; HR = hazards ratio.
Model 1 — unadjusted.
Model 2 — adjusted for age, race, education, body mass index, diabetes, hypertension, and cigarette smoking.
In analyses of the association between phenogroup membership and HFpEF in both men and women, no significant associations were found after adjusting for covariates of interest (Supplementary Table 1). For HFrEF in men, after adjusting for demographic and clinical covariates of interest, the HRs were 4.94 (95% CI 2.09 to 11.65, p = 0.0003), 5.04 (95% CI 2.06 to 12.29, p = 0.0004), and 3.30 (95% CI 1.34 to 8.11, p = 0.01) for phenogroups 2, 3, and 4, respectively (Supplementary Table 2). No significant associations were found between phenogroup membership and HFrEF in a fully adjusted model in women (Supplementary Table 2).
Discussion
In this large, multiethnic cohort of participants free of CVD at baseline, we identified 4 distinct phenogroups, or clusters of subjects with similar features of LV and RV structure and function based on 15 cMRI variables, in men and women separately. In men, the different phenogroups identified had significantly different risks for incident HF. No significant associations were found between phenogroup membership and incident HF in women. With the latest classification emphasizing a pre-HF stage,19 phenogrouping may allow early identification of patients at high risk, for precision prevention.
This analysis in patients at risk for HF based on cMRI extends previous studies that applied latent class analysis in patients with prevalent HF.8,20 For example, using latent class analysis, Cohen et al identified 3 distinct phenogroups based on multiple demographic and clinical characteristics.8 In another study, Kao et al used latent class analysis to cluster 4,113 patients with HFpEF on the basis of 11 demographic and clinical variables.20 The 6 phenogroups identified had different risks for mortality and cardiovascular hospitalization.20 Phenogroup membership has been used to identify characteristics of responders to cardiac resynchronization therapy in HF21 and spironolactone in HFpEF.8 Furthermore, some studies found significant associations between phenogroup classes and adverse outcomes such as sudden death or death from HF, all-cause mortality, all-cause hospitalization, and HF hospitalization.22–24 Other statistical methods have also been used for phenogroup identification.10,22–25 In a study of 397 patients with HFpEF, Shah et al used unbiased hierarchical cluster analysis and penalized model-based clustering to identify 3 distinct phenogroups that differed in clinical characteristics, cardiac structure and function, and outcomes.10 No previous studies have used latent class analysis to cluster subjects free of CVD at baseline and on the basis of cMRI variables of structure and function.
Gender differences in HF outcomes in response to HF treatment have also been reported.26,27 In the present study, the association between phenogroup membership and incident HF differed by gender and was not significantly associated with HF in women. Furthermore, although previous studies showed that women were more likely to develop HFpEF than were men,3 this study indicates that women generally have higher EF before the development of HF, which may explain the higher risk of HFpEF in women. Differences in incident HF may be related to distinct pathobiologic processes that lead to HF in women after menopause who are more likely to experience HFpEF, as observed by the distribution of EF at the time of HF. Furthermore, because estrogen inhibits the renin-angiotensin system and cardiac fibroblast collagen synthesis in women,28 lower estrogen levels during menopause render women’s hearts more prone to harm and may account for the later development of CVD among women.29 It is also possible that co-morbidities such as diabetes, obesity, or hormonal factors and not intrinsic cardiac changes are associated with greater risk of HF in women. In addition, future studies are needed to examine the association of cardiac risk factor phenogroup membership with other HF subtypes such as HF with improved ejection fraction and HF with midrange ejection fraction because these represent distinct HF subtypes with distinct prognosis.
The strengths of this study include the large multiethnic cohort from multiple centers and high-quality cMRI variables used in developing phenogroups. There are some limitations to this study. First, the study was observational, and no causal inferences can be made. Second, although latent class analysis is an innovative approach that allows participants to be clustered on the basis of probability for data presentation and interpretation, participants do not belong to 1 group. Third, the phenogroups identified represent statistical associations and may not necessarily reflect pathophysiology, nor are they intended to serve as risk prediction models. However, the groups identified were consistent with patterns of cardiac remodeling observed in middle age to older adulthood, as has been shown previously.30 Fourth, because the primary objective of the study was to identify cMRI phenogroups, competing events such as deaths and incident myocardial infarction were not considered in the Cox proportional models. It is possible that lack of competing events in the models may have affected the results.
In summary, phenogroup membership based on cardiac parameters in midlife-to-older adulthood in men was significantly associated with incident HF. These findings suggest that integration of cardiac structure and function variable before clinical symptoms may help identify those men at increased risk for HF, in addition to clinical characteristics and biomarkers.
Supplementary Material
Acknowledgment
The authors thank the other investigators, the staff, and the participants of the MESA study for their valuable contributions.
This study was funded by the American Heart Association, Chicago, Illinois (SFRN grant number: 18SFRN339700097). The Multi-Ethnic Study of Atherosclerosis study was supported by contracts 75N92020D00001, 75N92020D00005, 75N92020D00002, 75N92020D00003, 75N92020D000 06, 75N92020D00004, 75N92020D00007, N01-HC-95165, N01-HC-95166, N01-HC-95167, N01-HC-95168, and N01-HC-95169 from the National Heart, Lung, and Blood Institute, Bethesda, Maryland, by grants UL1-TR-000040, UL1-TR-001079, UL1-TR-001881, and UL1-TR-001420 from the National Center for Advancing Translational Sciences, Bethesda, Maryland, and by grant DK 063491 from the National Institutes of Health, Bethesda, Maryland.
Disclosures
Dr. Shah received research funding: National Institutes of Health R01 HL107577, R01 HL127028, R01 HL140731, R01 HL149423, American Heart Association #16SFRN28780016, #15CVGPSD27260148 Actelion, AstraZeneca, Corvia, Novartis, Pfizer; Consulting/advisory board/steering committee: Actelion, AstraZeneca, Amgen, Aria, Axon, Bayer, BMS, Boehringer-Ingelheim, Cardiora, Coridea, CVRx, Cyclerion, Cytokinetics, Eisai, Imara, Ionis, Keyto, Lilly, Merck, MyoKardia, Novartis, Novo Nordisk, Pfizer, Prothena, Regeneron, Sanofi, Shifamed, Tenax, and United Therapeutics. The remaining authors have no conflicts of interest to declare.
Footnotes
Ethics approval and consent to participate
The study protocol was approved by the institutional review boards of the institutions involved. All participants provided informed consent.
Consent for publication
All authors read and approved the final manuscript.
Supplementary materials
Supplementary material associated with this article can be found in the online version at https://doi.org/10.1016/j.amjcard.2022.10.003.
Availability of data and materials
The datasets generated and analyzed for the present study are available upon reasonable request [https://www.mesa-nhlbi.org/]
References
- 1.Mosterd A, Hoes AW. Clinical epidemiology of heart failure. Heart 2007;9:1137–1146. [DOI] [PMC free article] [PubMed] [Google Scholar]
- 2.Benjamin EJ, Muntner P, Alonso A. Bittencourt MS, Callaway CW, Carson AP, Chamberlain AM, Chang AR, Cheng S, Das SR, Delling FN, Djousse L, Elkind MSV, Ferguson JF, Fornage M, Jordan LC, Khan SS, Kissela BM, Knutson KL, Kwan TW, Lackland DT, Lewis TT, Lichtman JH, Longenecker CT, Loop MS, Lutsey PL, Martin SS, Matsushita K, Moran AE, Mussolino ME, O’Flaherty M, Pandey A, Perak AM, Rosamond WD, Roth GA, Sampson UKA, Satou GM, Schroeder EB, Shah SH, Spartano NL, Stokes A, Tirschwell DL, Tsao CW, Turakhia MP, VanWagner LB, Wilkins JT, Wong SS, Virani SS, American Heart Association Council on Epidemiology and Prevention Statistics Committee and Stroke Statistics Subcommittee. Heart disease and stroke Statistics-2019 update: a report from the American Heart Association. Circulation 2019;139:e56–e528. [DOI] [PubMed] [Google Scholar]
- 3.Lala A, Tayal U, Hamo CE, Youmans Q, Al-Khatib SM, Bozkurt B, Davis MB, Januzzi J, Mentz R, Sauer A, Walsh MN, Yancy C, Gulati M. Sex differences in heart failure. J Card Fail 2022;28:477–498. [DOI] [PubMed] [Google Scholar]
- 4.Yang H, Negishi K, Otahal P, Marwick TH. Clinical prediction of incident heart failure risk: a systematic review and meta-analysis. Open Hear 2015;2:e000222. [DOI] [PMC free article] [PubMed] [Google Scholar]
- 5.Stevens SM, Farzaneh-Far R, Na B, Whooley MA, Schiller NB. Development of an echocardiographic risk-stratification index to predict heart failure in patients with stable coronary artery disease: The heart and soul study. JACC Cardiovasc Imaging 2009;2:11–20. [DOI] [PMC free article] [PubMed] [Google Scholar]
- 6.Echouffo-Tcheugui JB, Greene SJ, Papadimitriou L, Zannad F, Yancy CW, Gheorghiade M, Butler J. Population risk prediction models for incident heart failure: a systematic review. Circ Heart Fail 2015;8:438–447. [DOI] [PubMed] [Google Scholar]
- 7.Chahal H, Bluemke DA, Wu CO, McClelland R, Liu K, Shea SJ, Burke G, Balfour P, Herrington D, Shi PB, Post W, Olson J, Watson KE, Folsom AR, Lima JAC. Heart failure risk prediction in the Multi-Ethnic Study of Atherosclerosis. Heart 2015;101:58–64. [DOI] [PMC free article] [PubMed] [Google Scholar]
- 8.Cohen JB, Schrauben SJ, Zhao L, Basso MD, Cvijic ME, Li Z, Yarde M, Wang Z, Bhattacharya PT, Chirinos DA, Prenner S, Zamani P, Seiffert DA, Car BD, Gordon DA, Margulies K, Cappola T, Chirinos JA. Clinical phenogroups in heart failure with preserved ejection fraction: detailed phenotypes, prognosis, and response to spironolactone. JACC Heart Fail 2020;8:172–184. [DOI] [PMC free article] [PubMed] [Google Scholar]
- 9.Nylund KL, Asparouhov T, Muthen BO. Deciding on the number of classes in latent class analysis and growth mixture modeling: a Monte Carlo simulation study. Struct Equ Model 2007;14(4):535–569. [Google Scholar]
- 10.Shah SJ, Katz DH, Selvaraj S, Burke MA, Yancy CW, Gheorghiade M, Bonow RO, Huang CC, Deo RC. Phenomapping for novel classification of heart failure with preserved ejection fraction. Circulation 2015;131:269–279. [DOI] [PMC free article] [PubMed] [Google Scholar]
- 11.Bild DE, Bluemke DA, Burke GL, Detrano R, Diez Roux AV, Folsom AR, Greenland P, Jacob DR, Kronmal R, Liu K, Nelson JC, O’Leary D, Saad MF, Shea S, Szklo M, Tracy RP. Multi-Ethnic Study of Atherosclerosis: objectives and design. Am J Epidemiol 2002;156:871–881. [DOI] [PubMed] [Google Scholar]
- 12.Kawut SM, Lima JAC, Barr RG, Chahal H, Jain A, Tandri H, Praestgaard A, Bagiella E, Kizer JR, Johnson WC, Kronmal RA, Bluemke DA. Sex and race differences in right ventricular structure and function: the multi-ethnic study of atherosclerosis-right ventricle study. Circulation 2011;123:2542–2551. [DOI] [PMC free article] [PubMed] [Google Scholar]
- 13.Natori S, Lai S, Finn JP, Gomes AS, Hundley WG, Jerosch-Herold M, Pearson G, Sinha S, Arai A, Lima JAC, Bluemke DA. Cardiovascular function in multi-ethnic study of atherosclerosis: normal values by age, sex, and ethnicity. AJR Am J Roentgenol 2006;186(suppl 2):S357–S365. [DOI] [PubMed] [Google Scholar]
- 14.Tandri H, Daya SK, Nasir K, Bomma C, Lima JAC, Calkins H, Bluemke DA. Normal reference values for the adult right ventricle by magnetic resonance imaging. Am J Cardiol 2006;98:1660–1664. [DOI] [PubMed] [Google Scholar]
- 15.Ambale-Venkatesh B, Yoneyama K, Sharma RK, Ohyama Y, Wu CO, Burke GL, Shea S, Gomes AS, Young AA, Bluemke DA, Lima JAC. Left ventricular shape predicts different types of cardiovascular events in the general population. Heart 2017;103:499–507. [DOI] [PubMed] [Google Scholar]
- 16.Whelton PK, Carey RM, Aronow WS. Casey DE Jr, Collins KJ, Dennison Himmelfarb C, DePalma SM, Gidding S, Jamerson KA, Jones DW, MacLaughlin EJ, Muntner P, Ovbiagele B, Smith SC Jr, Spencer CC, Stafford RS, Taler SJ, Thomas RJ, Williams KA Sr, Williamson JD, Wright JT Jr. 2017 ACC/AHA/AAPA/ABC/ACPM/AGS/APhA/ASH/ASPC/NMA/PCNA guideline for the prevention, detection, evaluation, and management of high blood pressure in adults: executive summary: a report of the American College of Cardiology/American Heart Association Task Force on Clinical Practice guidelines [published correction appears in Hypertension 2018;71:e136–e139] [published correction appears in Hypertension 2018;72:e33]. Hypertension 2017;71(6):1269–1324.29133354 [Google Scholar]
- 17.Garvey WT, Mechanick JI, Brett EM, Garber AJ, Hurley DL, Jastreboff AM, Nadolsky K, Pessah-Pollack R, Plodkowski R. Reviewers of the AACE/ACE Obesity Clinical Practice Guidelines. American Association of Clinical Endocrinologists and American college of endocrinology comprehensive clinical practice guidelines for medical care of patients with obesity. Endocr Pract 2016;22(suppl 3):1–203. [DOI] [PubMed] [Google Scholar]
- 18.Rao VN, Zhao D, Allison MA, Guallar E, Sharma K, Criqui MH, Cushman M, Blumenthal RS, Michos ED. Adiposity and incident heart failure and its subtypes: MESA (multi-ethnic study of atherosclerosis). JACC Heart Fail 2018;6:999–1007. [DOI] [PMC free article] [PubMed] [Google Scholar]
- 19.Bozkurt B, Coats AJ, Tsutsui H, Abdelhamid M, Adamopoulos S, Albert N, Anker SD, Atherton J, Böhm M, Butler J, Drazner MH, Felker GM, Filippatos G, Fonarow GC, Fiuzat M, Gomez-Mesa JE, Heidenreich P, Imamura T, Januzzi J, Jankowska EA, Khazanie P, Kinugawa K, Lam CSP, Matsue Y, Metra M, Ohtani T, Francesco Piepoli M, Ponikowski P, Rosano GMC, Sakata Y, SeferoviĆ P, Star ling RC, Teerlink JR, Vardeny O, Yamamoto K, Yancy C, Zhang J, Zieroth S. Universal definition and classification of heart failure, Heart Failure Association of the European Society of Cardiology. J Card Fail 2021;27:387–413. [Google Scholar]
- 20.Kao DP, Lewsey JD, Anand IS, Massie BM, Zile MR, Carson PE, McKelvie RS, Komajda M, McMurray JJ, Lindenfeld JA. Characterization of subgroups of heart failure patients with preserved ejection fraction with possible implications for prognosis and treatment response. Eur J Heart Fail 2015;17:925–935. [DOI] [PMC free article] [PubMed] [Google Scholar]
- 21.Cikes M, Sanchez-Martinez S, Claggett B, Duchateau N, Piella G, Butakoff C, Pouleur AC, Knappe D, Biering-Sørensen T, Kutyifa V, Moss A, Stein K, Solomon SD, Bijnens B. Machine learning-based phenogrouping in heart failure to identify responders to cardiac resynchronization therapy. Eur J Heart Fail 2019;21:74–85. [DOI] [PubMed] [Google Scholar]
- 22.Gu J, Pan JA, Lin H, Zhang JF, Wang CQ. Characteristics, prognosis and treatment response in distinct phenogroups of heart failure with preserved ejection fraction. Int J Cardiol 2021;323:148–154. [DOI] [PubMed] [Google Scholar]
- 23.Segar MW, Patel KV, Ayers C, Basit M, Tang WHW, Willett D, Berry J, Grodin JL, Pandey A. Phenomapping of patients with heart failure with preserved ejection fraction using machine learning-based unsupervised cluster analysis. Eur J Heart Fail 2020;22:148–158. [DOI] [PubMed] [Google Scholar]
- 24.Harada D, Asanoi H, Noto T, Takagawa J. Different pathophysiology and outcomes of heart failure With preserved ejection fraction stratified by K-means clustering. Front Cardiovasc Med 2020;7:607760. [DOI] [PMC free article] [PubMed] [Google Scholar]
- 25.Mishra RK, Tison GH, Fang Q, Scherzer R, Whooley MA, Schiller NB. Association of machine learning–derived Phenogroupings of echocardiographic variables with heart failure in stable coronary artery disease: the heart and soul study. J Am Soc Echocardiogr 2020;33:322–331.e1. [DOI] [PMC free article] [PubMed] [Google Scholar]
- 26.Merrill M, Sweitzer NK, Lindenfeld JA, Kao DP. Sex differences in outcomes and responses to spironolactone in heart failure with preserved ejection fraction: a secondary analysis of TOPCAT trial. JACC Heart Fail 2019;7(3):228–238. [DOI] [PMC free article] [PubMed] [Google Scholar]
- 27.McMurray JJV, Jackson AM, Lam CSP, Redfield MM, Anand IS, Ge J, Lefkowitz MP, Maggioni AP, Martinez F, Packer M, Pfeffer MA, Pieske B, Rizkala AR, Sabarwal SV, Shah AM, Shah SJ, Shi VC, Van Veldhuisen DJ, Zannad F, Zile MR, Cikes M, Goncalvesova E, Katova T, Kosztin A, Lelonek M, Sweitzer N, Vardeny O, Claggett B, Jhund PS, Solomon SD. Effects of Sacubitril-Valsartan Versus valsartan in women compared with men with heart failure and preserved ejection fraction: insights from Paragon-HF. Circulation 2020;141(5):338–351. [DOI] [PubMed] [Google Scholar]
- 28.Gerdts E, Regitz-Zagrosek V. Sex differences in cardiometabolic disorders. Nat Med 2019;25:1657–1666. [DOI] [PubMed] [Google Scholar]
- 29.Smaardijk VR, Lodder P, Kop WJ, van Gennep B, Maas AHEM, Mommersteeg PMC. Sex- and gender-stratified risks of psychological factors for incident ischemic heart disease: systematic review and meta-analysis. J Am Heart Assoc 2019;8:e010859. [DOI] [PMC free article] [PubMed] [Google Scholar]
- 30.Perak AM, Khan SS, Colangelo LA, Gidding SS, Armstrong AC, Lewis CE, Reis JP, Schreiner PJ, Sidney S, Lima JAC, DM LloydJones. Age-related development of cardiac remodeling and dysfunction in Young black and white adults: the coronary artery risk development in Young adults study. J Am Soc Echocardiogr 2021;34:388–400. [DOI] [PMC free article] [PubMed] [Google Scholar]
Associated Data
This section collects any data citations, data availability statements, or supplementary materials included in this article.
Supplementary Materials
Data Availability Statement
The datasets generated and analyzed for the present study are available upon reasonable request [https://www.mesa-nhlbi.org/]