Abstract
This study evaluated the potential for conversion of Class B to Class A biosolids with respect to salmonellae and fecal coliforms during solar drying in concrete lined drying beds. Anaerobically (8% solids) and aerobically (2% solids) digested Class B biosolids were pumped into field-scale drying beds, and microbial populations and environmental conditions were monitored. Numbers of fecal coliforms and salmonellae decreased as temperature and rate of desiccation increased. After 3 to 4 weeks, Class A requirements were achieved in both biosolids for the pathogens and the indicators. However, following rainfall events, significant increase in numbers was observed for both fecal coliforms and salmonellae. In laboratory studies, regrowth of fecal coliforms was observed in both biosolids and biosolid-amended soil, but the regrowth of salmonellae observed in the concrete-lined drying beds did not occur. These laboratory studies demonstrated that pathogens decreased in numbers when soil was amended with biosolids. Based on serotyping, the increased numbers of salmonellae seen in the concrete lined drying beds following rainfall events was most likely due to recolonization due to contamination from fecal matter introduced by animals and not from regrowth of salmonellae indigenous to biosolids. Overall, we conclude that the use of concrete-lined beds created a situation in which moisture added as rainfall accumulated in the beds, promoting the growth of fecal coliforms and salmonellae added from external sources.
Biosolids, or the organic semisolid byproduct of wastewater treatment, are often used as a soil amendment in areas such as parks, agricultural fields, and even in home gardens. Due to the presence of odors and the potential for pathogenic microorganisms, toxins, and metals in biosolids, there is an ongoing debate regarding the safety of land application (20). The United States Environmental Protection Agency (EPA) regulates the use of biosolids, and before being land applied, treatment of biosolids must occur in order to achieve standards set by the 40 CFR Part 503 Biosolids Rule. Established by the EPA in 1993, the Part 503 rule set criteria for levels of metals, pathogens, and also vector attractants, which are safe to humans and other animals when biosolids are used beneficially for land application (19). Class B biosolids are often land applied and may contain detectable levels of pathogens, but through treatment, pathogens can be reduced to achieve Class A status. Regulations concerning pathogenic concentrations in biosolids are shown in Table 1 (21).
TABLE 1.
Part 503 pathogen density limits adapted from U.S. EPA, 2000
| Pathogen or indicator and class | Standard density limit (dry wt) |
|---|---|
| Class A | |
| Salmonellae | <3 MPN/4 g total solids or |
| Fecal coliforms | <1,000 MPN/gram and |
| Enteric viruses | <1 PFU/4 g total solids and |
| Viable helminth ova | <1 PFU/4 g total solids |
| Class B | |
| Fecal coliform density | <2,000,000 MPN/g total solids |
There are several methods for reducing pathogen levels in biosolids prior to land application, including the use of solar drying beds and composting. Treatments, such as the use of solar drying beds, should reduce water content and remove pathogens, but there is growing concern that pathogens may survive these processes in low numbers and subsequently regrow to hazardous levels when exposed to favorable environmental conditions. Many laboratory studies have been conducted in the past, focusing on survival and potential growth of inoculated organisms in sterile and nonsterile biosolids and compost (2, 10, 15, 18, 27). Regrowth of inoculated salmonellae in sterile biosolids is commonly documented, but few studies have documented survival and regrowth of indigenous pathogens in biosolids after levels have decreased below levels of detection (8, 11, 14, 16). Due to limited available data regarding regrowth of salmonellae in biosolids used for land application, there are conflicting views on this topic. Some studies have shown that regrowth does occur, while other studies have shown that regrowth does not occur (28). These differences are most likely due to whether indigenous salmonellae are studied or whether biosolids are reseeded with salmonellae (28).
The present study was performed in order to determine the potential use of solar drying beds for the conversion of Class B biosolids to Class A biosolids. In field experiments, biosolids were added to solar drying beds, and the survival of fecal coliforms and salmonellae was monitored during the summer, fall, and winter months in Arizona. Following solar drying, both fecal coliforms and Salmonella levels decreased below those necessary to achieve Class A status. However, increased numbers of both fecal coliforms and pathogens after rainfall events was documented, where the concentrations of both organisms increased to levels exceeding the initial levels detected at the beginning of the study. Laboratory studies were then conducted in order to further characterize the potential regrowth of these microorganisms in biosolids and biosolid-amended soil under controlled conditions. In these studies, the regrowth potential of indicator microorganisms and pathogens in biosolids and biosolid-amended soils was evaluated after desiccation and subsequent rewetting.
MATERIALS AND METHODS
Solar drying bed field studies. (i) Biosolids and drying beds.
Mesophilically anaerobically digested biosolids and aerobically digested Class B biosolids were used in this study. Anaerobically digested biosolids were obtained from the Ina Road Wastewater Treatment Plant in Tucson, AZ, with an initial percent solids of 7.4% (dry weight). Aerobically digested biosolids were obtained from the Avra Valley Wastewater Treatment Plant located in Tucson, AZ, with an initial percent solids of 1.2% (dry weight). Approximately 19,000 liters of each of the biosolids was added to two separate drying beds with dimensions of 15 m by 3 m, located at the Avra Valley Wastewater Treatment Plant. When biosolids were initially added to the beds, the depth of biosolids was approximately 2 feet at the deepest point of the bed. The drying beds were concrete lined and were sloped so that liquid biosolids congregated in the deepest portion of the beds. The drying beds did not allow for drainage, therefore following rainfall events water ponded in the beds. Air temperature and rainfall were monitored with a weather station located adjacent to the beds. Samples were assayed for 23 weeks from 9 June 2003 to 19 November 2003 for the Avra Valley biosolids and for 30 weeks from 9 June 2003 to 6 January 2004 for the Ina Road biosolids.
(ii) Sampling.
Two samples were taken from both biosolid beds each week, one from the north end and one from the south end, and were analyzed for fecal coliforms. Each sample was the result of composite sampling in which three subsamples were mixed together to create the one sample from each end of the bed. The composite sample was thoroughly mixed prior to sample analysis and moisture content determination. After 8 weeks, these samples were also analyzed for heterotrophic plate counts (HPC). Further composite samples (1 liter total), created by mixing the north and south samples, were analyzed weekly for salmonellae and twice for Ascaris spp. and enteroviruses. When wet, the biosolids samples were removed from the beds using a sterile scoop and were emptied into sterile 1-liter jars. After the biosolids were dry, samples were removed using ethanol-sterilized trowels and were stored in sterile plastic bags. Samples were stored on ice and were immediately taken to the laboratory for analysis.
Biosolid-amended soil laboratory studies. (i) Soil and biosolids.
Pima clay loam soil was collected from the University of Arizona Marana Experiment Station located in Marana, AZ. Biosolids used for these experiments were Ina Road anaerobically digested Class B biosolids. Two microcosm studies were performed for these experiments, with the second trial being modified slightly, based on the results of the first trial. For trial one, the moisture content of the soil was 5% (dry weight), background HPC levels for the soil were 4.6 × 10⁷ CFU per dry g, and the biosolids had an initial percent solids of 9.5% (dry weight). For trial two, the soil had been stored at 4°C for 3 months and had an initial moisture content of 4.8% (dry weight). Background HPC levels for the soil were 5.6 × 10⁷ CFU per dry g, while background coliforms and E. coli levels were 3.9 × 10² most probable numbers (MPN) per g and below detection, respectively. The biosolids tested had an initial percent solids of 7.7% (dry weight). For both studies, background levels of salmonellae in the soil were also measured and were undetected.
(ii) Microcosm studies.
The microcosm studies were repeated twice, with trial two being modified slightly based on the results of trial one. Class B biosolids were added to 100 g (dry weight) soil, in 500-ml sterile Nalgene mason jars, in a 1:10 ratio on a dry weight basis. For control samples, 500 to 600 ml of pure biosolids (no soil) was added to 800-ml jars. The samples were incubated in the dark at 30°C, and three replicate jars were assayed for salmonellae and HPC bacteria once a week for 8 weeks in trial one and for 7 weeks in trial two. Microcosm samples were not mixed during the incubation phase of the study; however, at each sampling event, the contents of the jar were mixed to provide uniform moisture content of the sample. For trial two, a weekly assay for coliforms and Escherichia coli was also performed. After the samples had dried, resulting in either undetectable or low levels of salmonellae, samples were rewet during week 5 for trial one and week 3 for trial two. In trial one, samples were rewet to approximately 60% moisture, with the same amount of water being added to the control (biosolids but no soil) samples. Samples were tested one week after rewetting to determine whether regrowth had occurred. For trial two, samples were rewet to approximately 80% moisture, and the control biosolid samples were brought to the original 8% solids (dry weight). Samples were processed 5 days after rewetting to determine whether or not regrowth had occurred.
Analyses of biosolids and biosolid-amended soil. (i) Percent solids and moisture contents.
Percent solids of the biosolids and moisture contents of the biosolid amended soils were determined by drying four 10-g wet samples at 102°C for 24 h. An average of the four replicates was determined and was used to calculate the percent solids and moisture contents on a dry weight basis.
(ii) Fecal coliforms.
Samples from the field study were assayed for fecal coliforms using a five-tube “most probable number” (MPN) method adapted from EPA Standard Method 9221 (1). Ten grams of the biosolids was added to 90 ml of buffered peptone water (Difco Co., Detroit, MI) and was placed on a shaker for 10 min. Appropriate dilutions were obtained through serial diluting, and 1 ml of each dilution was added to five tubes containing 10 ml of Lauryl Tryptose Broth (Difco Co., Detroit, MI) and fermentation tubes. Tubes were incubated for 24 to 48 h in a circulating water bath at 35°C and were monitored for gas production. After 48 h, 0.1 ml of all positive samples was added to tubes containing 10 ml of EC broth (Difco Co., Detroit, MI) and fermentation tubes. Tubes were then incubated at 44.5°C for 24 h, when they were scored positive or negative for gas production. Positive samples in the EC broth indicated the presence of fecal coliforms. Numbers of fecal coliforms were calculated using published MPN tables.
(iii) Coliforms and E. coli.
For trial two of the biosolid amended soil laboratory studies, coliforms and E. coli were assayed using the Colisure system (IDEXX Laboratories, Inc., Westbrook, ME). Ten grams of sample was added to 90 ml of saline water and placed on a shaker for 10 min. Serial dilutions were prepared and mixed with the Colilert substrate and 100 ml of sterile water. The Quantitray was utilized in order to obtain the most probable number (MPN) of organisms in the original sample, and all assays were performed according to the manufacturer's directions.
(iv) Heterotrophic plate counts.
HPC bacteria were detected using a spread plate technique on R2A agar (Difco Co., Detroit, MI). Plates of the appropriate dilutions were incubated at 27°C for 7 to 10 days before bacterial colonies were counted, and CFU per dry gram was determined.
(v) Salmonellae.
Salmonellae were detected using a 5-tube MPN method in the field studies and a 3-tube MPN method for the amended soil laboratory experiments, both adapted from EPA Standard Method 9260 (1). Typically, 10 g, 1 g, and 0.1 g weights of soil sample were used for the procedure. However, when bacterial numbers were low, 100 g, 10 g, and 1 g were used in order to obtain a definitive number of organisms present in each of the samples. Pre-enrichment of these samples was performed in a circulating water bath at 35°C for 24 h using buffered peptone water (Difco Co., Detroit, MI). Pre-enrichment enhanced survival for all organisms in the sample, including salmonellae. This was followed by an enrichment step for the selection of salmonellae. For the enrichment, tubes containing 10 ml of Rappaport-Vassiliadis R10 Broth (Difco Co., Detroit, MI) with sodium novobiocin (40 μg/ml) were inoculated with 0.1 ml of the pre-enriched samples. After 24 h in a circulating water bath at 43°C, a loopful of the enrichment was streaked onto Hektoen Enteric (HE) agar (Difco Co., Detroit, MI). Presumptive positive colonies were confirmed using Triple Sugar Iron agar and Lysine Iron agar (Difco Co., Detroit, MI) slants. Further confirmation of all positive colonies was performed using a Salmonella Latex Test, and assays were performed according to manufacturer's directions (Oxoid Limited, Basingstoke, Hampshire, England). Selected positive samples were also serotyped and confirmed using API 20E biochemical tests (BioMériuex, Inc., Durham, NC). Salmonella serotyping was performed by the National Veterinary Services Laboratories (Ames, Iowa).
(vi) Enterovirus and Ascaris spp.
During the field studies, composite samples from each bed were taken immediately after biosolids were placed in the beds (9 June 2003) and again after 8 weeks (21 July 2003). Each 1-liter composite sample was analyzed for enteroviruses (ASTMD4994-89) and Ascaris spp. (EPA/625/R-92/013) (22). Briefly, viruses were desorbed from the solids by physiochemical means using beef extract and concentrated by organic flocculation. Decontamination was accomplished by filtration. Concentrates were subsequently assayed for viruses via cell culture. Helminth ova were removed from the solids via physical agitation of the biosolids and subsequently floated using Mg2SO4 (specific gravity, 1.2 g ml−1). Subsequently, concentrates were visualized using light microscopy.
RESULTS
Field studies.
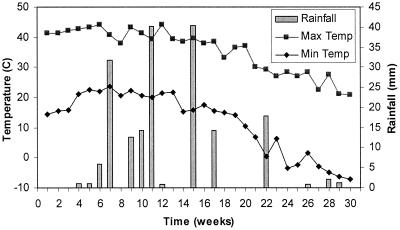
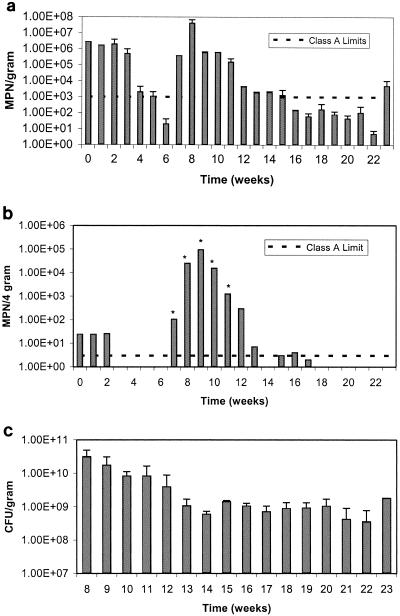
Figure 1 shows the temperature and rainfall data for the duration of the field study. Temperature is shown as the maximum and minimum recorded values for each week of the study. In the field, Salmonella numbers in the aerobically digested Avra Valley biosolids closely mimicked the number of the fecal coliforms throughout the study. Figure 2a shows the results for the fecal coliforms in the Avra Valley biosolids, while Fig. 2b shows results for salmonellae. Salmonellae and fecal coliforms were within Class A levels after 3 and 5 weeks, respectively. Fecal coliforms survived longer than salmonellae during the first 6 weeks of the study when air temperatures in Tucson exceeded 40°C. Salmonella concentrations were below Class A levels when the percent solids of the biosolids was only 17%, whereas fecal coliforms did not decrease to Class A levels until the biosolids were fairly dry (92% solids). Ultimately, Class A regulation levels for fecal coliforms (<1,000 MPN per g) were achieved during weeks 5, 6, and 16 through 22, while Class A regulation levels for salmonellae (<3 MPN per 4 dry g) were achieved during weeks 3 through 6, 14, and 18 through 23. Increased numbers of both organisms were seen during week 7, when the biosolids still had an average percent solids of 91%. Rainfall increased after week 7, and the percent solids of the samples decreased to 3.5%. At this time, a large amount of standing water was present in the concrete-lined bed, which caused the biosolids to become completely saturated. During the next several weeks when moisture levels were high, fecal coliforms and salmonellae grew to levels exceeding the initial concentrations seen at the onset of the study and in excess of Class A standards. Due to the unexpected large increase in Salmonella numbers during week 7 through 12, all dilutions assayed were positive, so the Salmonella numbers presented in Fig. 2b may represent values lower than actual Salmonella numbers that were present. Concentrations for both pathogens and indicators remained elevated for the next several weeks and only began to decrease as the concrete beds slowly started drying. Class A levels were again achieved for salmonellae on week 18, at which time none were detected. Fecal coliform numbers were within Class A levels on week 16 but were still detected throughout the remainder of the study. Unlike salmonellae, a second increase in numbers of fecal coliforms was seen during week 23 after another rainfall event.
FIG. 1.
Temperature (Temp) and rainfall data during the field study. Max, maximum; Min, minimum.
FIG. 2.
a. Survival of fecal coliforms in Avra Valley aerobically digested biosolids. Data points represent the average of the north and south samples with standard deviations. b. Survival of salmonellae in Avra Valley aerobically digested biosolids. Asterisks indicate the minimum number at which all dilutions are positive. c. Heterotrophic plate counts in Avra Valley biosolids. Data points represent an average of the north and south samples with standard deviations. Time 0 = June 9, 2003.
After 8 weeks of following potential regrowth events, HPC bacteria were assayed to evaluate biotic competition (Fig. 2c). After rainfall, HPCs reached levels of 2 × 10¹⁰ CFU per dry g and decreased during the next few weeks until stabilizing around 109 CFU per dry g for the remainder of the experiment. There was little change in the concentrations even following rainfall later in the study. Along with the choice of fecal coliforms or salmonellae, enterovirus and viable helminth ova need to be <1 PFU per 4 dry g and <1 per 4 dry g, respectively, in order to be considered Class A (Table 1). In the aerobically digested Avra Valley biosolids, the initial enterovirus concentration was 7.0 PFU per 4 dry g and no Ascaris spp. were found. Samples were also analyzed 7 weeks into the study, and neither Ascaris spp. nor enteroviruses were detected.
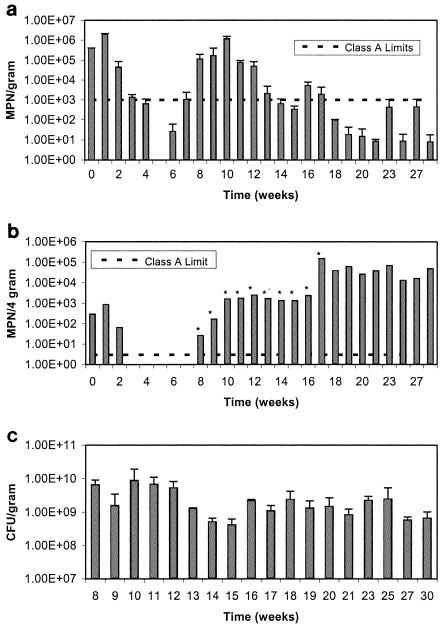
Figure 3a shows the results for fecal coliforms, and Fig. 3b shows the results for salmonellae in the anaerobically digested Ina Road biosolids. During the initial week of drying, both salmonellae and fecal coliform concentrations increased slightly above the initial concentrations. Salmonella levels subsequently decreased to Class A standards within 3 weeks, when the percent solids was 19%. In contrast, fecal coliforms were at Class A standards within 5 weeks, when the percent solids was 31%. As was seen in the Avra Valley biosolids, fecal coliforms survived longer than salmonellae. Class A regulation levels were met during weeks 4 through 6 and again during weeks 14, 15, and 18 through 30 for fecal coliforms. In contrast, Class A levels for salmonellae were only met during weeks 3 through 7. Population increases that occurred in the Ina Road biosolids were different than that which occurred in the Avra Valley biosolids. Three separate growth events occurred for fecal coliforms on weeks 7, 16, and 23. In the first two growth events, Class A levels were exceeded, whereas during the third growth event (week 23), the levels were not exceeded. HPC counts also increased slightly during these same regrowth events, but levels were already fairly high at 108 or 109 CFU per dry g and remained this way throughout the experiment (Fig. 3c). For salmonellae, only one growth event was seen during week 8. However, levels remained elevated above Class A levels for the duration of the study. At one point, levels of salmonellae were known to be at a minimum of 105 MPN per dry g and only decreased during the last weeks of the experiment. The increase in Salmonella levels from week 16 to 17 may or may not be due to a growth event, similar to that seen for fecal coliforms in week 16. In an attempt to obtain a definitive number of salmonellae present in the sample, higher dilutions of the sample were assayed on week 17, but all dilutions still remained positive. Selected Salmonella isolates from both the Avra Valley and Ina Road biosolids were serotyped, and the results are shown in Table 2. Multiple serotypes were found in the Ina Road isolates. For Avra Valley, the serotypes found at time zero were different than those identified later in the study. The implications of this are discussed later. Class A levels for enterovirus and viable helminth ova were also met throughout the study, as both organisms were never detected.
FIG. 3.
a. Survival of fecal coliforms in Ina Road anaerobically digested biosolids. Data points represent an average of the north and south samples with standard deviations. b. Survival of salmonellae in Ina Road anaerobically digested biosolids. Asterisks indicate the minimum number at which all dilutions are positive. c. Heterotrophic plate counts in Ina Road biosolids. Data points represent an average of the north and south samples with standard deviations. Time 0 = June 9, 2003.
TABLE 2.
Salmonella enterica serotypes from biosolid field samples
| Week | Avra Valley | Ina Road |
|---|---|---|
| 0 | Oranienburg | Multiplea |
| Gaminara | Multiple | |
| Oranienburg | Multiple | |
| Oranienburg | Multiple | |
| 8 | Anatum | Montevideo |
| Montevideo | Montevideo | |
| Montevideo | Montevideo | |
| Montevideo | Multiple | |
| Multiple | Multiple | |
| 16 | Anatum | Multiple |
| Montevideo | Multiple | |
| Anatum | Multiple | |
| Montevideo | Multiple | |
| Anatum | Multiple |
Multiple, more than one serotype in the sample.
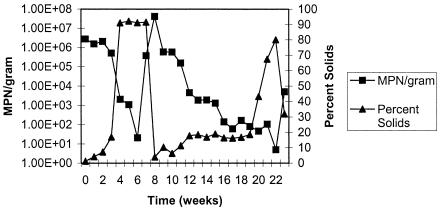
An important relationship was seen for all of the organisms in both biosolid samples. It was observed that as percent solids increased as the biosolids were drying out, the MPN per dry g for all organisms decreased and vice versa. Figure 4 shows the relationship between percent solids and the number of fecal coliforms found in the sample. This same relationship was seen for both salmonellae and fecal coliforms in both types of biosolids (data not shown).
FIG. 4.
Concentrations of fecal coliforms in Avra Valley biosolids versus percent solids.
Biosolid-amended soil laboratory experiments.
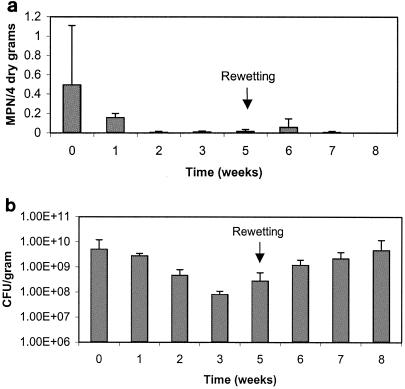
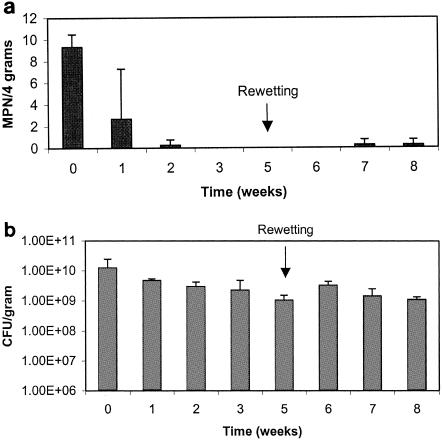
Figures 5a and 6a show trial one results for salmonellae found in the biosolid-amended soil and the biosolids control, respectively. HPC bacteria results for the biosolid-amended soil and biosolids control are shown in Fig. 5b and 6b, respectively. Initial Salmonella levels were fairly low and decreased to lower or undetectable levels within 2 weeks in both the amended soil treatment and the biosolids control. After rewetting during week 5, only negligible growth of salmonellae was seen, and HPC bacteria only increased slightly. HPC levels were already elevated at 108 or 109 CFU per dry g, probably limiting the potential for a large increase. During the first trial, the soils were brought to 60% moisture; however, the samples were once again very dry (8% moisture content) by the time sampling occurred 1 week later. Therefore, if growth did occur, it was only transitory.
FIG. 5.
a. Survival of salmonellae in biosolid-amended soil trial one. Data points represent an average of three replicates with standard deviations. b. Heterotrophic plate counts in biosolid amended soil trial one. Data points represent an average of three replicates with standard deviations.
FIG. 6.
a. Survival of salmonellae in biosolids control (no soil) trial one. Data points represent an average of three replicates with standard deviations. b. Heterotrophic plate counts in biosolids control (no soil) trial one. Data points represent an average of three replicates with standard deviations.
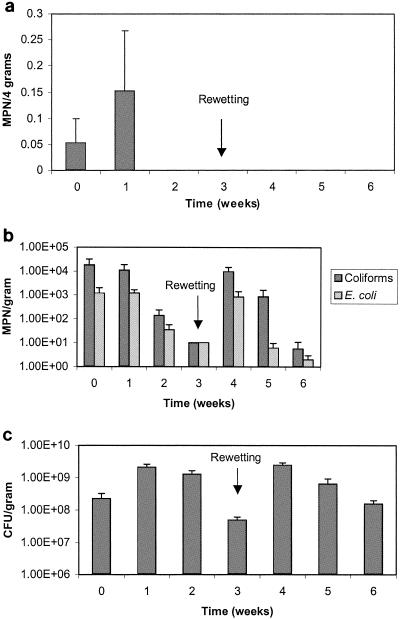
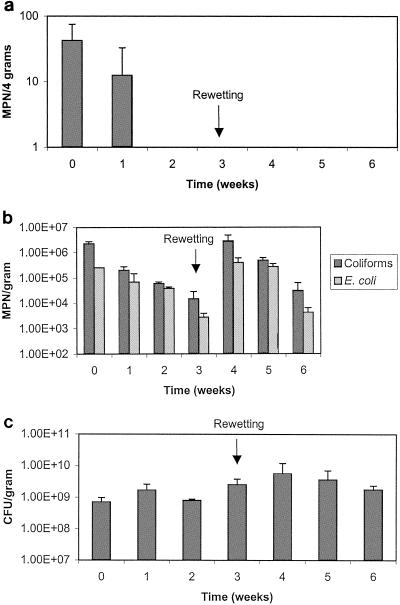
For trial two, additional assays were added for the detection of coliforms and E. coli. As was seen in the first trial, in biosolid-amended soil or biosolids, salmonellae were not detected after the first 2 weeks of drying (Fig. 7a and 8a), while HPC populations remained fairly constant at 108 or 109 CFU per dry g for both treatments (Fig. 7c and 8c). Within 3 weeks, coliforms and E. coli both decreased to 101 MPN per dry g in the biosolid-amended soil (Fig. 7b), while coliform and E. coli concentrations decreased to levels of 104 and 103 MPN per dry g in the biosolids control, respectively (Fig. 8b). Rewetting occurred during week 3, and the amended soil was brought to 80% moisture while the biosolids were brought up to the original moisture of 92%. Samples were also processed 4 days after rewetting, before the samples had a chance to again dry out. As in trial one, growth of salmonellae did not occur, while fecal coliforms were able to regrow to levels equal to or exceeding initial concentrations found in the samples. Although indicator concentrations increased to high levels after rewetting, concentrations subsequently decreased 2 or 3 logs due to desiccation as samples began to dry out again. Growth of HPC bacteria was also seen following rewetting, increasing slightly before beginning to decrease, also likely due to desiccation.
FIG. 7.
a. Survival of salmonellae in biosolid-amended soil trial two. Data points represent an average of three replicates with standard deviations. b. Survival of indicator microorganisms in biosolid-amended soil trial two. Data points represent an average of three replicates with standard deviations. c. Heterotrophic plate counts in biosolid-amended soil trial two. Data points represent an average of three replicates with standard deviations.
FIG. 8.
a. Survival of salmonellae in biosolids control (no soil) trial two. Data points represent an average of three replicates with standard deviations. b. Survival of indicator microorganisms in biosolids control (no soil) trial two. Data points represent an average of three replicates with standard deviations. c. Heterotrophic plate counts in biosolids control (no soil) trial two.
DISCUSSION
The survival and potential regrowth of enteric bacteria in biosolids and biosolid-amended soil is an important issue with regards to land application. In order to understand the issue of regrowth, it is necessary to distinguish between the terms “regrowth” and “recolonization.” Regrowth can be defined as an increase in viable numbers of an indigenous microbial population following a previous decline in viable numbers. In contrast, recolonization can be defined as the reintroduction of bacteria to a substrate (biosolids) followed by growth. Reintroduction of pathogens to biosolids in the field could occur by animal fecal contamination. Likewise, in composted biosolids a “hot spot” on the periphery of a windrow could subsequently reintroduce pathogens to heat-treated biosolids following the turning and mixing of the windrow. In addition, we speculate that a threshold number of pathogens is necessary for regrowth, particularly in the presence of other indigenous microbes that provide biotic competition.
Almost all previous research has indicated that Salmonella and indicator bacteria numbers in biosolids decrease over time whether or not moisture is limiting (24). Most experiments addressing regrowth show growth of inoculated salmonellae in sterilized biosolids (27), which does not necessarily give an accurate picture of what occurs in a real field situation during land application. In addition, we would refer to seeded studies as recolonization. Only a limited number of field and laboratory studies have evaluated survival and potential regrowth of indigenous pathogens and indicators in biosolids and biosolid-amended soil.
A major concern in our field studies is the demonstration of how Salmonella numbers increased. The levels of indigenous salmonellae were very low before an increase in numbers was observed following rainfall events, but it is possible that there were favorable conditions in the drying beds which allowed for the regrowth of the indigenous salmonellae. However, this situation does not seem likely, as in most cases salmonellae do not survive as well as fecal coliforms. In addition, other studies have also shown that fecal coliforms outcompete salmonellae (12). Therefore, numbers of viable salmonellae were likely less than the threshold for true “regrowth,” since they were nondetectable prior to the rainfall event. The increase in Salmonella numbers may have been due to recolonization due to contamination from bird feces, as this has been documented with regard to finished compost and biosolids (3, 19, 12). At the Avra Valley site, many birds were present, and their presence on site at the beds was evident by bird feet prints seen in the biosolids. The birds seemed to frequent the site more often when water was present in the biosolids, and this could have been a source of the contamination and recolonization of the salmonellae and fecal coliforms. There is evidence that Salmonella isolates have commonly been found in birds (4, 13). It is believed that in our field studies, salmonellae were most likely due to recolonization by birds present at the Avra Valley site. Subsequently, salmonellae were likely able to recolonize to very high levels due to high moisture content because of the lack of drainage in the concrete basins and the simultaneous inoculation of salmonellae and fecal coliforms from the bird feces (12). The hypothesis of contamination by birds can be examined through analysis of the Salmonella serotypes found in the samples (Table 2). For the Avra Valley samples, serotypes found in the initial samples differed from the serotypes detected after regrowth during week 8. The Ina Road samples are inconclusive due to the fact that it was only determined that multiple serotypes were found in the samples. Due to the differences in Salmonella serotypes found initially and after rainfall, the theory of reinoculation and subsequent recolonization of salmonellae due to contamination is supported.
The importance of the rate of desiccation on survival of organisms was seen with fecal coliforms in the field experiments. Death of the fecal coliforms was fairly rapid during the first 6 weeks, when temperatures were high and humidity was low, causing the beds to dry fairly quickly. Class A levels were achieved quickly during this time. The rate of die off was much slower during the second drying cycle when lower temperatures and higher humidity were present, resulting in a lower rate of desiccation. Laboratory studies were performed in order to further understand the increase in Salmonella numbers that was seen in the field. In these laboratory studies, unlike in the field, reinoculation of salmonellae from bird feces was not possible. From the evidence obtained from the laboratory studies, it does not seem that regrowth of indigenous salmonellae is a concern. Salmonellae were not able to survive and regrow in biosolids alone or in a soil environment, even when conditions of moisture and temperature were favorable for growth. Experiments were also done in fine-textured soil, which has been shown to provide more protection for organisms than coarse-textured soils (14), and the Salmonella organisms still could not survive or regrow in this environment. The death of salmonellae in this environment may be due to the presence of high levels of coliforms in the biosolids or indigenous soil organisms which survived and regrew biosolids and biosolid-amended soil. In addition, surviving numbers of salmonellae may have been beneath the threshold necessary to initiate regrowth after rewetting, especially in the soil treatments where the concentration of salmonellae was diluted. As previously stated, growth in the drying beds probably occurred from animal activity reinoculating the biosolids. In addition, the high moisture (ponding of water) may have fostered the redistribution of this surface contamination or other “hot spots” of organisms contained throughout the biosolids. Rainfall events may have also allowed for the deposition of nutrients such as nitrogen into the drying bed. In the laboratory studies, these environmental factors were not present.
With regard to indicators, Van Donsel et al. (22) found a seasonal variation between the survival of fecal coliforms and fecal streptococci and believed that the advantages of using either as an indicator must be evaluated. Researchers have also found evidence of the presence of fecal streptococci without the presence of fecal coliforms in environmental samples (5) while also documenting the closer relationship of fecal coliforms to the survival of salmonellae (6). Sidhu et al. (17) stated that testing for indicators alone could not ensure the safety of compost and that limited conflicting information on the use of indicators exists. In some research, indicators were found to be more susceptible to treatment than salmonellae (7), whereas other research showed good correlations between salmonellae and indicators present in biosolids and compost (9, 26). Finally, Winfield and Groisman (25) summarized in a review that, due to the differing survival rates of salmonellae and E. coli, fecal coliforms may not be the best indicator for Salmonella contamination.
In the field studies with Ina Road biosolids, Salmonella levels were extremely high at times when fecal coliform levels were below Class A biosolid target levels. There is a choice of either examining samples for fecal coliforms or salmonellae when determining Class A status of a sample. If salmonellae had not been measured, the biosolids may have been assumed to reach Class A levels based on fecal coliform levels, when in reality the Salmonella levels were high and the biosolids were clearly not of Class A status. This represents an example where monitoring for indicators would have resulted in a false-negative result with respect to the presence of salmonellae. However, it is important to recognize that drying beds are not a Class A-approved process. It also demonstrated that the use of concrete drying beds will allow for the collection and retention of moisture from rainfall events, allowing either regrowth or reinoculation of salmonellae and fecal coliforms from other sources. In the biosolid laboratory studies, it was shown that fecal coliforms after wetting regrew to levels that exceeded Class A standards, whereas regrowth of salmonellae was not detected. Hence, as in the field studies, the presence of indicator organisms did not always correlate with Salmonella levels. The fact that indicators were able to regrow is probably due to the increased number of surviving coliforms (higher than the threshold necessary for regrowth).
More field and laboratory studies still need to be done to further document pathogen survival in biosolids during drying operations and biosolid-amended soil. Conditions observed in the field are complicated, and the reasons for the decline or increase in Salmonella numbers in the environment are not fully understood. Although it seems that regrowth of indigenous salmonellae may not be an issue when biosolids are dried using inclined solar drying beds or are applied to soil, recolonization or reinoculation of Class A material from bird or animal wastes needs to be monitored carefully. Therefore, storage of Class A biosolids prior to land application must be done in a manner that precludes contamination.
Acknowledgments
This work was supported by The University of Arizona, National Science Foundation Water Quality Center.
Special thanks to Susan O'Shaugnessy at the University of Arizona for her assistance with the design and recording of environmental data in field study. Thanks also to the personnel at the Avra Valley and Ina Road Wastewater Treatment facilities.
REFERENCES
- 1.American Public Health Association. 1998. Standard methods for the examination of water and wastewater, 20th ed. American Public Health Association, Washington, D.C.
- 2.Brandon, J. R., W. D. Burge, and N. K. Enkiri. 1977. Inactivation by ionizing radiation of Salmonella enteritidis serotype montevideo grown in composted sewage sludge. Appl. Environ. Microbiol. 33:1011-1012. [DOI] [PMC free article] [PubMed] [Google Scholar]
- 3.Burge, W. D., N. K. Enkiri, and D. Hussong. 1987. Salmonella regrowth in compost as influenced by substrate (Salmonella regrowth in compost). Microb. Ecol. 14:243-253. [DOI] [PubMed] [Google Scholar]
- 4.Ferns, P. N., and G. P. Mudge. 2000. Abundance, diet, and Salmonella contamination of gulls feeding at sewage outfalls. Water Res. 34:2653-2660. [Google Scholar]
- 5.Geldreich, E. E., B. A. Kenner, and P. W. Kabler. 1964. Occurrence of coliforms, fecal coliforms, and streptococci on vegetation and insects. Appl. Microbiol. 12:63-69. [DOI] [PMC free article] [PubMed] [Google Scholar]
- 6.Geldreich, E. E., and N. A. Clarke. 1966. Bacterial pollution indicators in the intestinal tract of freshwater fish. Appl. Microbiol. 14:429-437. [DOI] [PMC free article] [PubMed] [Google Scholar]
- 7.Gibbs, R. A., and G. E. Ho. 1993. Health risks from pathogens in untreated wastewater sludge: implications for Australian sludge management guidelines. Water 20:17-22. [Google Scholar]
- 8.Gibbs, R. A., C. J. Hu, G. E. Ho, and I. Unkovich. 1997. Regrowth of faecal coliforms and Salmonellae in stored biosolids and soil amended with biosolids. Water Sci. Technol. 35:269-275. [Google Scholar]
- 9.Gibbs, R., C. J. Hu, G. E. Ho, I. Unkovich, and P. Phillips. 1994. Die-off of human pathogens in stored wastewater sludge and sludge applied to land. UWRAA Research Project no. [55-51 (91/58)]. Urban Water Research Association of Australia, Melbourne, Australia.
- 10.Hussong, D., W. D. Burge, and N. K. Enkiri. 1985. Occurrence, growth, and suppression of Salmonellae in composted sewage sludge. Appl. Environ. Microbiol. 50:887-893. [DOI] [PMC free article] [PubMed] [Google Scholar]
- 11.Lang, N. L., S. R. Smith, D. M. Bellett-Travers, E. B. Pike, and C. L. Rowlands. 2003. Decay of Escherichi coli in soil following the application of biosolids to agricultural land. Water Environ. Management J. 17:23-28. [Google Scholar]
- 12.Millner, P. D., K. E. Powers, N. K. Enkiri, and W. D. Burge. 1987. Microbially mediated growth suppression and death of Salmonella in composted sewage sludge. Microb. Ecol. 14:225-265. [DOI] [PubMed] [Google Scholar]
- 13.Monaghan, P., C. B. Shedden, K. Ensor, C. R. Fricker, and R. W. A. Girdwood. 1985. Salmonella carriage by herring gulls in the Clyde area of Scotland in relation to their feeding ecology. J. Appl. Ecol. 22:669-680. [Google Scholar]
- 14.Pepper, I. L., K. L. Josephson, R. L. Bailey, M. D. Burr, and C. P. Gerba. 1993. Survival of indicator organisms in Sonoran Desert soil amended with sewage sludge. J. Environ. Sci. Health A 28:1287-1302. [Google Scholar]
- 15.Pietronave, S., L. Fracchia, and M. G. Martinotti. 2002. Researchers analyze how microorganisms suppress pathogen regrowth. BioCycle 43:57-60. [Google Scholar]
- 16.Russ, C. F., and W. A. Yanko. 1981. Factors affecting salmonellae repopulation in composted sludges. Appl. Environ. Microbiol. 41:597-602. [DOI] [PMC free article] [PubMed] [Google Scholar]
- 17.Sidhu, J., R. A. Gibbs, G. E. Ho, and I. Unkovich. 1999. Selection of Salmonella typhimurium as an indicator for pathogen regrowth potential in composted biosolids. Lett. Appl. Microbiol. 29:303-307. [DOI] [PubMed] [Google Scholar]
- 18.Sidhu, J., R. A. Gibbs, G. E. Ho, and I. Unkovich. 2001. The role of indigenous microorganisms in suppression of Salmonella regrowth in composted biosolids. Water Res. 35:913-920. [DOI] [PubMed] [Google Scholar]
- 19.U.S. Environmental Protection Agency. 1994. A plain English guide to the EPA part 503 biosolids rule. EPA/832/R-93-003, Office of Wastewater Management (4204), United States Environmental Protection Agency, Washington, D.C.
- 20.U.S. Environmental Protection Agency. 1999. Biosolids generation, use, and disposal in the United States. EPA 530-R-99-099, Office of Solid Waste, United States Environmental Protection Agency, Washington, D.C.
- 21.U.S. Environmental Protection Agency. 2000. A guide to field storage of biosolids and the organic by-products used in agriculture and for soil resource management. EPA/832-B-00-007, Office of Wastewater Management, United States Environmental Protection Agency, Washington, D.C.
- 22.U.S. Environmental Protection Agency. 2003. Control of pathogens and vector attraction in sewage sludge. EPA/625/R-92/013, United States Environmental Protection Agency, Washington, D.C.
- 23.Van Donsel, D. J., E. E. Geldreich, and N. A. Clarke. 1967. Seasonal variations in survival of indicator bacteria in soil and their contribution to storm-water pollution. Appl. Microbiol. 15:1362-1370. [DOI] [PMC free article] [PubMed] [Google Scholar]
- 24.Ward, R. L., J. G. Yeager, and C. S. Ashley. 1981. Response of bacteria in wastewater sludge to moisture loss by evaporation and effect of moisture content on bacterial inactivation by ionizing radiation. Appl. Environ. Microbiol. 41:1123-1227. [DOI] [PMC free article] [PubMed] [Google Scholar]
- 25.Winfield, M. D., and E. A. Groisman. 2003. Role of nonhost environments in the lifestyles of Salmonella and Escherichia coli. Appl. Environ. Microbiol. 69:3687-3694. [DOI] [PMC free article] [PubMed] [Google Scholar]
- 26.Yanko, W. A. 1988. Occurrence of pathogens in distribution and marketing municipal sludge. EPA/600/1-37/014, United States Environmental Protection Agency, Washington, D.C.
- 27.Yeager, J. G., and R. L. Ward. 1981. Effects of moisture content on long-term survival and regrowth of bacteria in wastewater sludge. Appl. Environ. Microbiol. 41:1117-1122. [DOI] [PMC free article] [PubMed] [Google Scholar]
- 28.Zaleski, K. J., K. L. Josephson, C. P. Gerba, and I. L. Pepper. 2005. Survival, growth, and regrowth of enteric indicator and pathogenic bacteria in biosolids, compost, soil, and land applied biosolids. J. Residuals Sci. Technol. 2:49-63. [Google Scholar]


