Abstract
Most chemistry and biology occurs in solution, in which conformational dynamics and complexation underlie behaviour and function. Single-molecule techniques1 are uniquely suited to resolving molecular diversity and new label-free approaches are reshaping the power of single-molecule measurements. A label-free single-molecule method2–16 capable of revealing details of molecular conformation in solution17,18 would allow a new microscopic perspective of unprecedented detail. Here we use the enhanced light–molecule interactions in high-finesse fibre-based Fabry–Pérot microcavities19–21 to detect individual biomolecules as small as 1.2 kDa, a ten-amino-acid peptide, with signal-to-noise ratios (SNRs) >100, even as the molecules are unlabelled and freely diffusing in solution. Our method delivers 2D intensity and temporal profiles, enabling the distinction of subpopulations in mixed samples. Notably, we observe a linear relationship between passage time and molecular radius, unlocking the potential to gather crucial information about diffusion and solution-phase conformation. Furthermore, mixtures of biomolecule isomers of the same molecular weight and composition but different conformation can also be resolved. Detection is based on the creation of a new molecular velocity filter window and a dynamic thermal priming mechanism that make use of the interplay between optical and thermal dynamics22,23 and Pound–Drever–Hall (PDH) cavity locking24 to reveal molecular motion even while suppressing environmental noise. New in vitro ways of revealing molecular conformation, diversity and dynamics can find broad potential for applications in the life and chemical sciences.
Tools to measure properties of individual molecules1, including in heterogeneous solutions, have become cornerstones of modern molecular and biomolecular research. Nearly all single-molecule approaches use extrinsic labels and although these labels provide important contrast and specificity25, label-free approaches that avoid arduous dye-labelling procedures that may perturb the native functionality of biomolecules26–28 are an increasingly desirable alternative. Most single-molecule approaches, including all current label-free methods, also rely on interaction with surfaces. Although the presence of a surface may be benign for many applications (such as molecular detection and mass determination), for others, the measurement may bias detection towards subpopulations in mixed samples, disrupt native molecular interactions and alter dynamics and conformation relative to the solution-phase properties18,29,30 (Supplementary Information). Here we report a label-free single-molecule technique that enables detection of small solution-phase biomolecules (down to 1.2 kDa) with unprecedented SNR and allows for resolution of their diffusion behaviour.
Many label-free single-molecule experiments emphasize molecular detection, in which the presence of a single copy of a specific molecule is perceived, typically by means of a surface-bound, selective, tight binder, such as an antibody. Other approaches emphasize molecular property assaying and extract information about the molecule, such as location, mass or spectroscopic profile. Property assays are typically incapable of unambiguously identifying the molecule but can be applied generally, whereas molecular detectors can provide selective identification but only for a small subset of chosen molecules.
The range of label-free single-molecule technologies has grown substantially, particularly across two modalities: interference-based and optical-microcavity-enhanced techniques. Interferometric measurements, which generally rely on interference between elastically scattered light and a local oscillator, can operate as molecular detectors2,3 or property assays capable of quantitatively determining the position4–6 and mass7 of single molecules. Dielectric optical microcavities provide enhanced light–matter interactions owing to high quality factor (Q) and low mode volume (V) (refs. 8,9,31). Microcavities have most commonly been applied as molecular detectors, in which plasmonic enhancement10–12, optomechanical coupling13 or a combination of frequency-locking and computational noise suppression14 have enabled single-molecule detection through the reactive sensing mechanism32, such that the molecule introduces a shift in the resonance frequency. Selectivity is provided by a surface-supported binder molecule, although the microcavity is sensitive to the presence of molecules even without this step. Microcavities can also be used as single-particle property assays providing details on size and shape33,34 or spectral information on electronic35, plasmonic36 or vibrational properties37 and dynamics38. However, these approaches require target molecules to be confined or surface-immobilized to allow signal integration and background subtraction, be bound by a surface-supported selective binder or require interaction with a surface to couple to evanescent modes18,29. Open-access Fabry–Pérot microcavities can mitigate these concerns by operating in solution19 but have not reached the single-molecule label-free regime. Advances include successful single-nanoparticle optical trapping in plano-concave cavities39 and the recent demonstration of high-finesse fibre Fabry–Pérot cavities (FFPCs)20 as highly effective sensors for detecting individual diffusing solution-phase silica nanoparticles21. By monitoring frequency shift, formation of higher-order spatial modes, and changes in transmission intensity, the nanoparticle position was tracked and diffusion information was calculated21. Here we take advantage of the open-access geometry of FFPCs to achieve sensing of single, freely diffusing small biomolecules. Our platform uses passive mechanical stabilization of FFPCs40, a new dynamic thermal priming mechanism, and active resonance frequency stabilization as a previously unknown form of molecular velocity filtering, to achieve detection of a ten-amino-acid, 1.2-kDa solution-phase single protein with SNR of up to 123. This observation is achieved in the absence of external surface-based signal multipliers such as plasmonic enhancement and is the highest SNR reported for label-free single-molecule sensing by a substantial margin. Most importantly, the method operates without interaction with surfaces, allowing label-free interrogation of solution-phase molecules and evaluation of molecular diffusion profiles, a carrier of key information on conformation and binding41.
The FFPC was assembled from two single-mode optical fibres with concave laser-ablated end facets (Supplementary Fig. 1), which were subsequently coated with high-reflectivity dielectric layers20 (Supplementary Information). The fibre mirrors were aligned and affixed laterally within a cut fused silica ferrule (Fig. 1a,b) to increase the passive mechanical stability40. Optical modes were examined with static-frequency lasers over 660–760 nm while monitoring reflection and transmission (Fig. 1a). The mirror separation was about 20 μm (Fig. 1b), leading to Q factors of roughly 2 × 10⁶ and mode volumes of approximately 80 μm3 (ref. 20). Continuous examination of a single resonant mode was achieved by means of PDH frequency-locking24,42, in which the cavity length was actively stabilized to a single frequency of the pump laser (Fig. 1a). The input power into the cavity was about 5 μW, resulting in a circulating power of 5.5 mW. We demonstrate the ability to detect single label-free molecules by introducing samples of varying mass (66–1.2 kDa) and radius (2.80–0.75 nm) into the FFPC. Protein samples were prepared at pM concentrations such that the mean occupancy of the optical mode volume was much lower than one molecule. Intensity traces show high-amplitude, correlated signals, manifesting as a negative peak in transmission and a positive peak in reflection from transient interactions between single diffusing protein molecules and the locked cavity mode (Fig. 2a), resulting in very high SNRs of up to 123 for the ten-amino-acid peptide Myc-tag (Extended Data Fig. 1). Confirmation that signals originated from single-molecule diffusion was achieved by showing water background measurements before introduction of protein and after removal, during which no signal was observed (Supplementary Fig. 2), demonstrating that detected events increased linearly with protein concentration (Extended Data Fig. 2), and seeing Poisson statistics in arrival times (Extended Data Fig. 3). Without relying on plasmonic enhancement mechanisms10–12,43, surface proximity3,10–14,43, or the consequent conformational or chemical change of a surface-supported docking molecule11,14, we demonstrate SNRs up to 42-fold higher than existing label-free biomolecule sensing techniques for molecules of comparable molecular weight3,10–14 (Supplementary Fig. 4). Our approach also achieves a mass limit of detection around 25-fold smaller than that of direct mass photometry7 and, when compared with mass photometry with machine learning, achieves a roughly 8-fold smaller limit of detection while offering approximately 70 times higher SNR (ref. 44). Although the data presented here are in pure water, proteins also give strong single-molecule signals in their more native phosphate-buffered saline (PBS; Extended Data Fig. 4).
Fig. 1 |. Measurement apparatus and resonance scan.
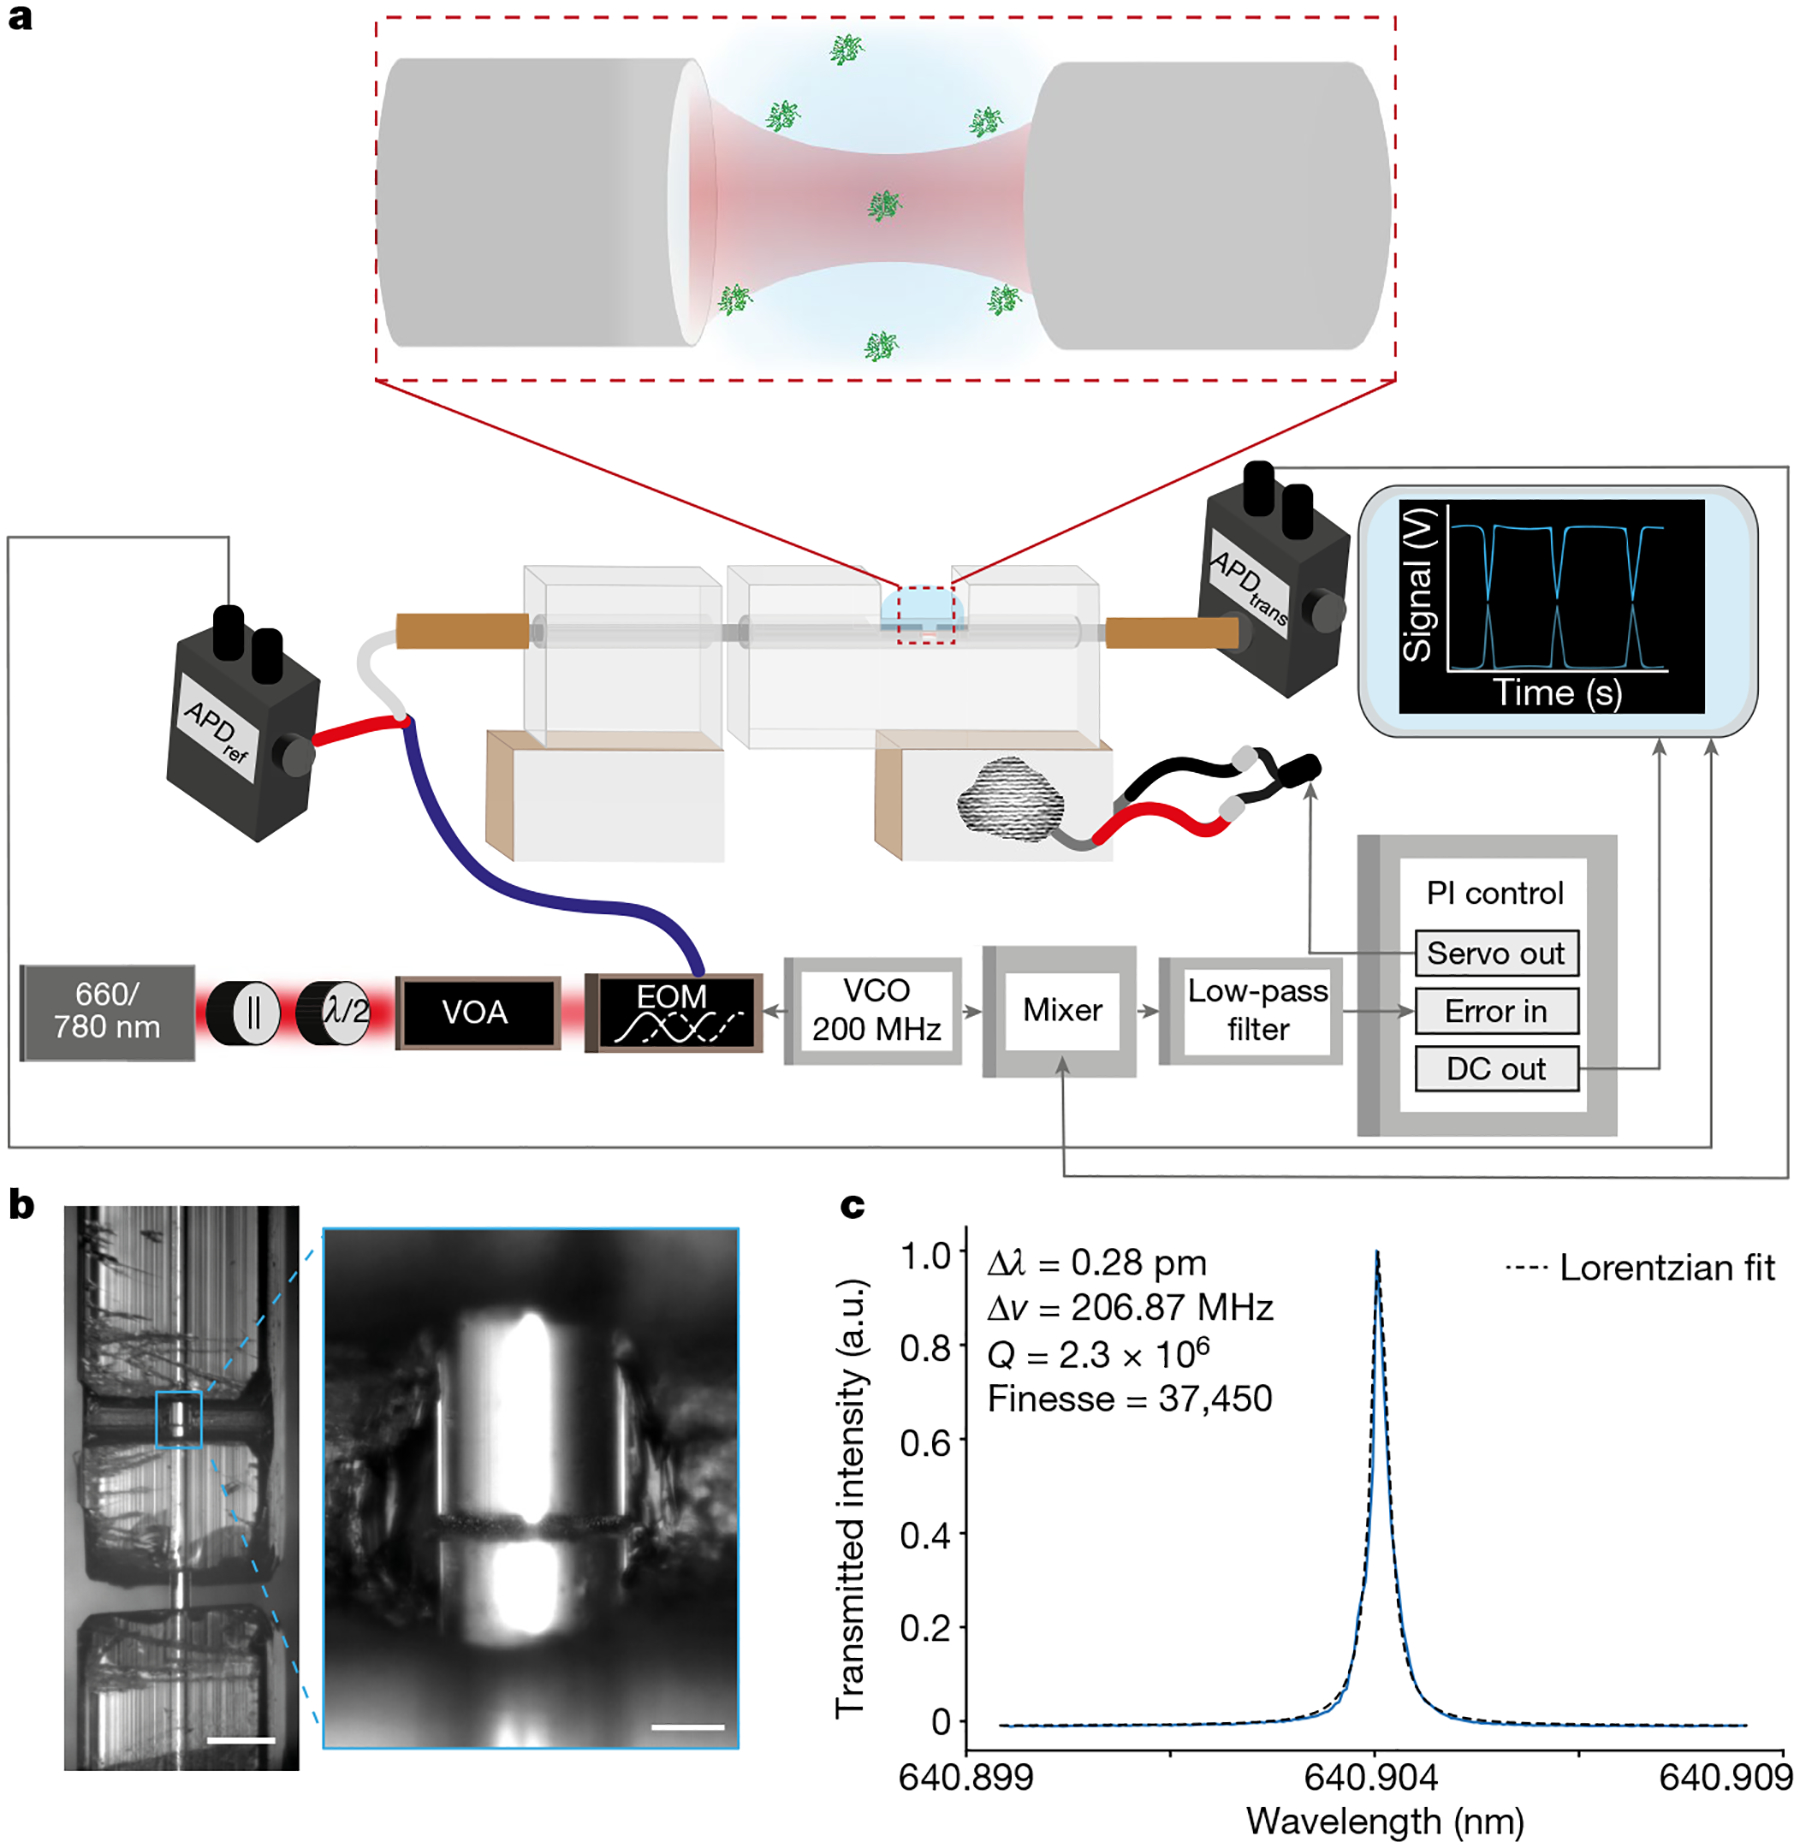
a, Simplified schematic of the FFPC-based single-molecule sensing instrumentation. Laser light (660–760 nm) of <1 MHz spectral width was transmitted through a linear polarizer (||) and half-wave plate (λ/2), selectively attenuated with a variable optical attenuator (VOA) and phase-modulated through a lithium niobate EOM driven by a 200 MHz VCO. Light was then coupled into the cavity using a fibre splitter, to enable collection of reflected light, and into an input optical fibre with transmitted intensity detected on a photodiode. PDH cavity-length stabilization, to maintain the cavity on resonance with the laser, was achieved using the frequency sidebands generated by the EOM driven by the VCO at 200 MHz. The error signal was generated by applying a low-pass filter to the mixed VCO reference and photodiode signals. This signal was then fed into the PI controller, which drives the ceramic piezo actuators to stabilize the cavity length to maintain resonance. Protein diffusion events were monitored in two channels on separate photodiodes, reflection (ref) and transmission (trans). b, Bright-field images of the FFPC optical fibres within the quartz ferrule. The fibres were affixed within the ferrule, forming a cavity 19.3 μm in length. Scale bars, 500 μm, 50 μm (inset). c, Wavelength scan used to determine the spectral linewidth of the cavity modes to be investigated. The cavity finesse was 37,450 in water. a.u., arbitrary units.
Fig. 2 |. Signals from individual molecules.
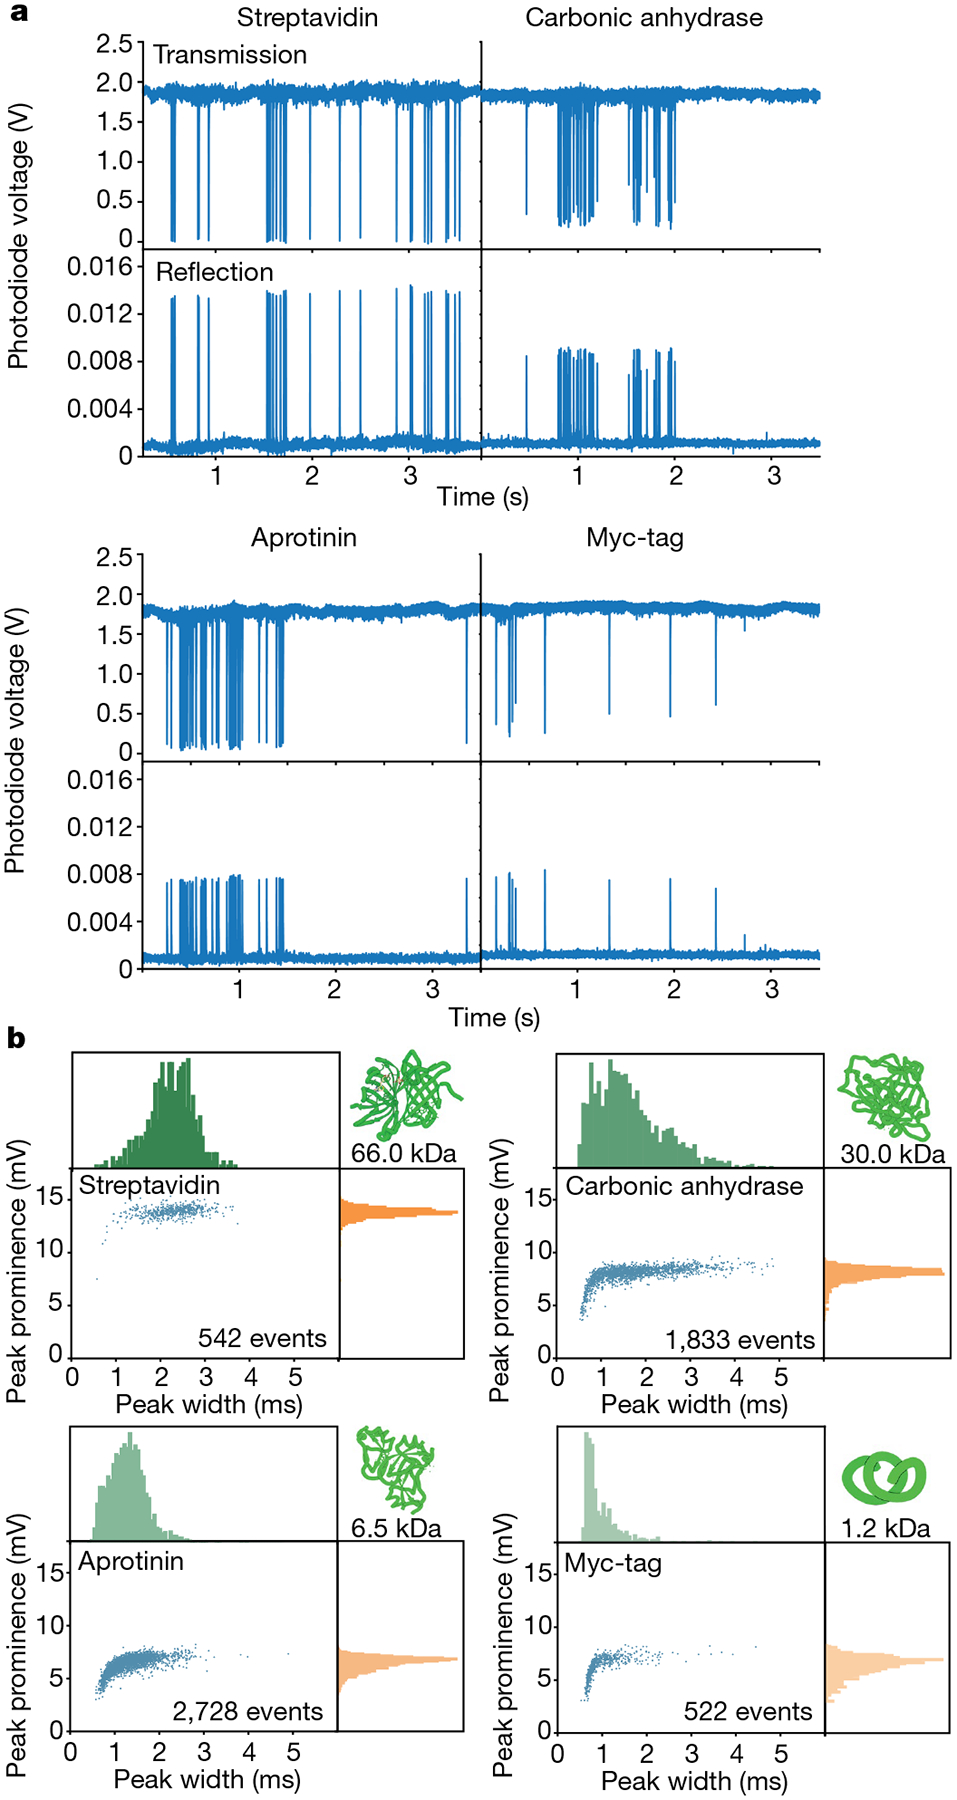
a, Perturbations of the locked resonant cavity mode originating from single-protein diffusion events. The locked signal was monitored in both transmission and reflection and the events manifested as a transient reduction of the transmitted signal intensity and an increase in the reflected intensity. b, 2D plots and accompanied histograms of the extracted prominences and temporal widths of the reflected signals. The corresponding transmission data can be found in Supplementary Fig. 5.
Each transit event comprises both temporal and intensity data. Most data were acquired with a temporal resolution of 20 μs but 2 μs time resolution (500 kHz acquisition rate; Extended Data Fig. 5) was also possible, suggesting the potential to capture even faster dynamics16. Plotting the distribution of temporal and intensity parameters provides a 2D signal profile containing unique information about the molecular mass and diffusion (Fig. 2b). Each protein molecule exhibited a distribution of temporal widths, identified from the full width at half maximum (FWHM) of events that rise significantly above the noise, and prominences, which increased with increasing protein molecular weight (Fig. 2b). A diversity of widths is expected because of the stochasticity of Brownian motion. The downward shift to lower prominences at shorter transit times is the result of a combination of this same diversity of molecular spatial paths and different intrinsic system response for smaller molecules. To demonstrate the ability of this technique to move beyond detection, we explored the potential for property assay by calculating the autocorrelation function of time traces containing several individually detected molecules to extract temporal information from the data. Correlation spectroscopy is a ubiquitous tool across temporally sensitive biophysical methods, such as fluorescence correlation spectroscopy (FCS) and dynamic light scattering, aiming to extract ensemble diffusional and, therefore, size and mass information of molecules41,45–49. FCS typically suffers from notable Poisson noise owing to the limited number of detected fluorescence photons per molecule, a particular problem in versions that rely on intrinsic fluorescence50. By contrast, our microcavity-based readout is based on >1012 detected photons per second, even facilitating faster sampling (Extended Data Fig. 5). Our method is also capable of quantifying diffusive behaviour on molecules >50 times smaller than other label-free single-molecule methods15,16. The autocorrelation expectedly shows dynamics on longer timescales for proteins of increasing mass (Fig. 3a). Notably, the autocorrelation times were consistently linear in proportion to the radius of the protein (Fig. 3b). This result confirms the versatility of this new single-molecule technique as a molecular property assay, demonstrating the potential to extract meaningful molecular information, including size and diffusional properties. Label-free methods of assessing molecular dynamics can offer substantial impact in biophysical applications.
Fig. 3 |. Diffusion information from single-molecule profiles.
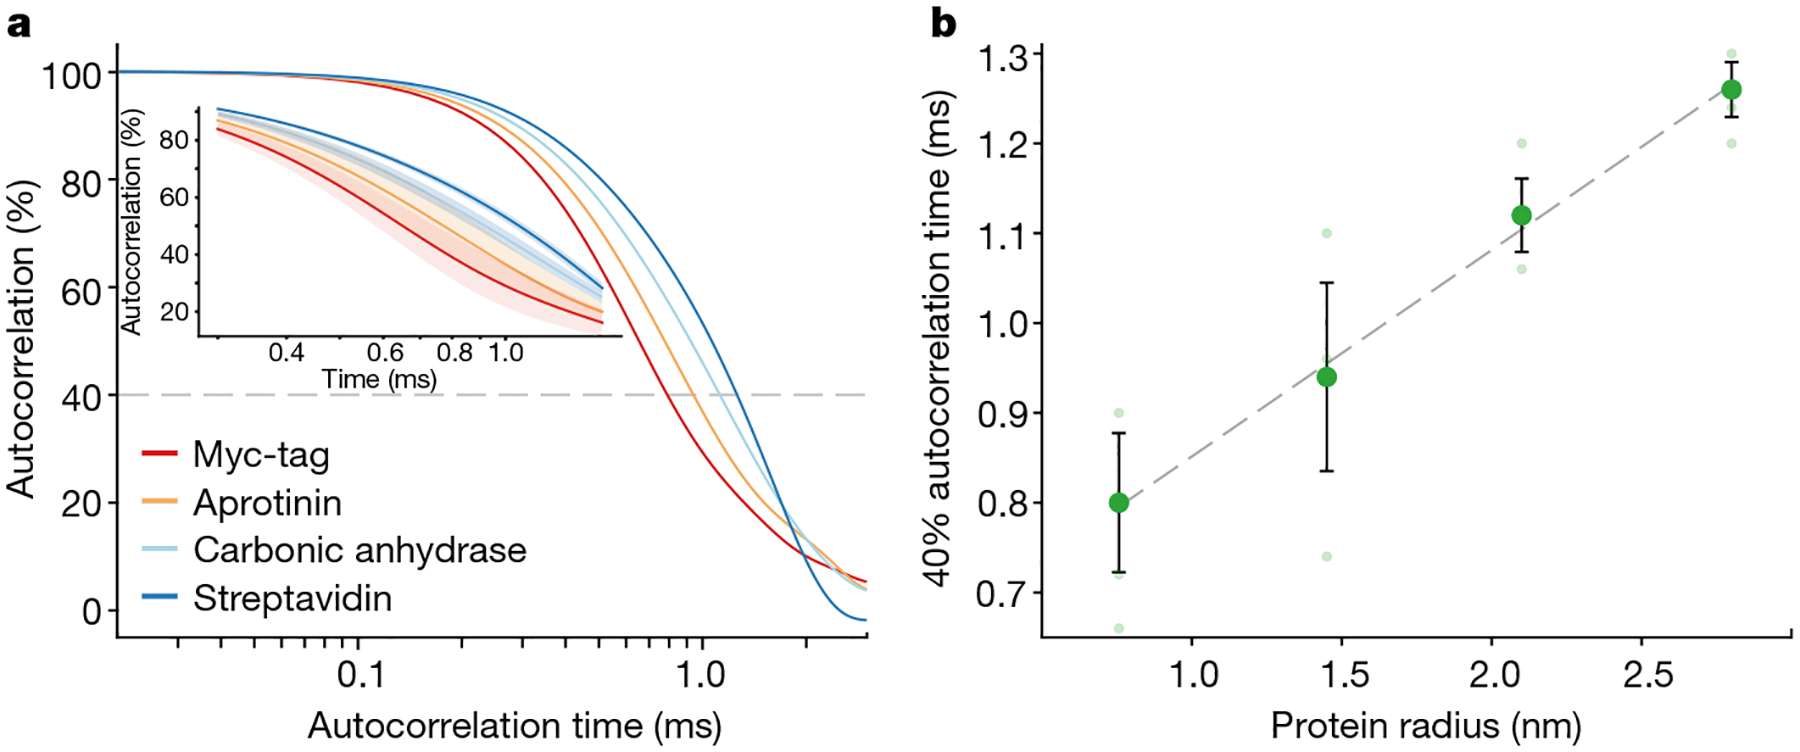
a, Ensemble autocorrelation of several hundred single-protein diffusion events. b, Relationship between mean autocorrelation time at an autocorrelation threshold of 40% (see Supplementary Fig. 9 for other thresholds) and the protein radius, showing a clear linear correlation. The linear regression does not intercept the origin (Supplementary Fig. 10), likely due to the finite length of the instrument response function. The shading in the zoomed in inset in a and error bars in b represent the standard error of the mean from several (N = 3) experiments within the same cavity.
Having demonstrated single-molecule measurements of solution-phase, label-free proteins, we next demonstrated the ability to resolve populations of simple binary mixtures. Resolution of mixtures is vital for identifying diagnostic biomarkers, understanding disease pathogenesis and for explaining biomolecule–biomolecule and biomolecule–drug interactions. Techniques such as FCS, invaluable for inferring conformation, and fluorescence polarization anisotropy, invaluable for ascertaining drug binding51, are generally limited by the requirement for fluorescent labels. Ensemble label-free techniques such as dynamic light scattering can provide diffusive information of biomolecules, but analysis is restricted by the high dependence of scattering on the molecular radius (r6), obscuring small particles among larger ones52, necessitating monodisperse samples for quantification7. Our approach produces 2D profiles that can act as molecular signatures (Fig. 2b) containing information about mass and diffusivity.
First, we investigated a mixture of aprotinin and Myc-tag, which have a 5.3 kDa mass and 0.7 nm radius difference (Fig. 4a). The contour plot of the mixture is qualitatively similar to the sum of the pure component distributions. Although these two populations would be difficult to resolve considering only peak prominence, two distinct populations, a fast-moving population with a mean event FWHM of 0.49 ± 0.15 ms and a broader, slow-moving population with a mean event FWHM of 1.68 ± 1.37 ms, are clearly evident in the 2D contour.
Fig. 4 |. Resolution of mixtures.
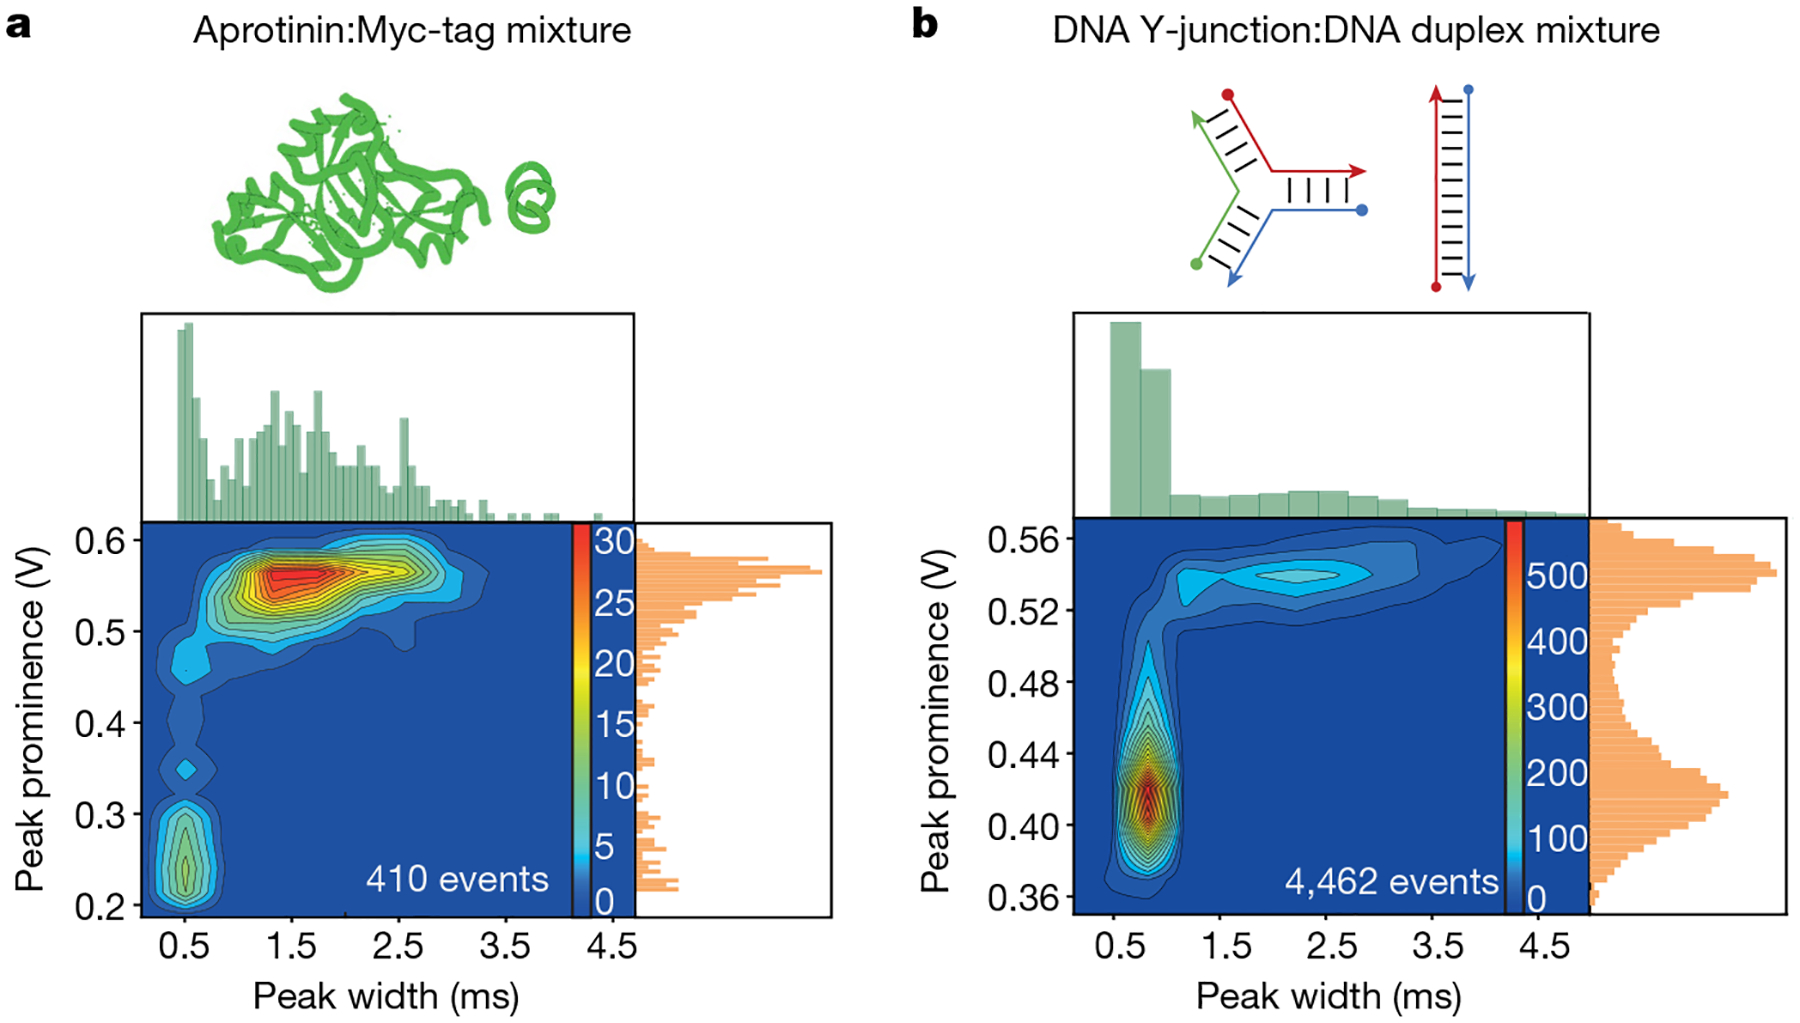
Contour plots of peak prominence versus temporal width and subsequent independent histograms for a mixed protein sample of aprotinin (6.5 kDa, 1.45 nm) and Myc-tag (1.2 kDa, 0.75 nm) (a) and a mixed DNA structure sample of a duplex (16.6 kDa, 9 nm) and Y-junction (16.6 kDa, 5 nm) (b), with numerous populations clearly resolved.
Moving beyond protein samples, we explored the resolution of bimolecular mixtures of DNA isomers of identical mass (16.6 kDa) and composition but differing sequence (Fig. 4b, Extended Data Fig. 6 and Supplementary Fig. 11): a DNA duplex (9 nm) and a Y-junction structure (5 nm). Here the two populations are clearly resolved in the 2D contour plot and along either individual axis and both components are present throughout the experiment (Extended Data Fig. 7). Spiking in known pure DNA samples identified the larger prominence population as coming from the Y-junction (Extended Data Fig. 6). A ternary mixture of three DNA Y-junctions of differing mass was also measured (Supplementary Fig. 12) and found to be at the limit of resolvability and is further discussed in the Supplementary Information. As discussed below, the response of the FFPC to the molecular perturbation is influenced by molecular properties as well as several dynamic cavity properties. The ability to cleanly reveal the presence of two molecules of identical small mass but differing conformation and diffusion behaviour shows that this approach provides complementary information that is not discernable from mass photometry.
Discussion
The detection of a single, freely moving, unlabelled small biomolecule with high SNR requires a plausible mechanism in which the small perturbation to the optical system can be detected. Our proposed mechanism begins with a refractive index change as the biomolecule displaces water molecules of lower index in the microcavity (often referred to as the ‘reactive mechanism’)32. Resonance shifts of 1–49 kHz resulting from the altered optical path length are estimated from the protein molecular weights (Supplementary Fig. 13). We note that these shifts are about 20 times greater at equivalent weights than estimates in whispering-gallery-mode resonators14 owing to smaller mode volume and better spatial overlap between molecule and optical mode in FFPCs (Supplementary Information). The ability to resolve resonance shifts that are small compared with the cavity linewidth (about 200 MHz) with such high SNR is based on a combination of high passive stability, active low-frequency stabilization, creation of a velocity discrimination window for molecular motion, and the use of dynamic photothermal distortion of the resonance line shape. In water, the photothermal effects occur because of absorption of some of the cavity circulating power, which alters the refractive index of the medium by means of the thermo-optic coefficient.
The combination of mounting the FFPC in a glass ferrule and PDH locking provides great stability, suppressing mechanical and laser frequency noise to detector-limited levels40 (Fig. 5a and Supplementary Fig. 14). Notably, the PDH locking bandwidth (LBW) only suppresses fluctuations (including molecular fluctuations) at temporal frequencies below 5 kHz (Fig. 5a), at which low-frequency mechanical fluctuations can introduce substantial resonance shifts. This loop would also suppress perturbations produced by larger, slow-moving molecules or particles, as most of their displacement would occur within the PDH LBW (Fig. 5a). Notably, small molecules undergoing Brownian motion, albeit with smaller overall resonance shifts owing to their reduced size, have a larger fraction of their mean squared displacement power spectral density53 outside the PDH suppression window (Fig. 5a and Supplementary Fig. 15). Integration of the mean squared displacement power spectral density for the smallest protein (Myc-tag, 0.75 nm) between the end of the LBW and the photothermal bandwidth (discussed below) yields a root mean square (r.m.s.) displacement of 93 nm (Supplementary Information). This displacement is comparable with the approximately 250 nm distance between the node and the antinode of the cavity standing wave (Extended Data Fig. 8), suggesting that the near full resonance shift from the diffusing molecule can be experienced by the microcavity outside the PDH LBW. When the molecule diffuses back into the node, the perturbation stops, leading the system to exhibit a dependence on the molecular diffusion constant (Fig. 3). Detection by shifting from node to antinode is distinct from the operational mechanisms in evanescent detection modalities3,11,12,14,43. Critically, a solution-phase label-free apparatus allows this new use of PDH as a high-pass filter to reduce mechanical noise while passing signals from fast-moving molecules (Fig. 5b), a key difference compared with previous schemes.
Fig. 5 |. Mechanism of cavity-enhanced single-molecule detection.
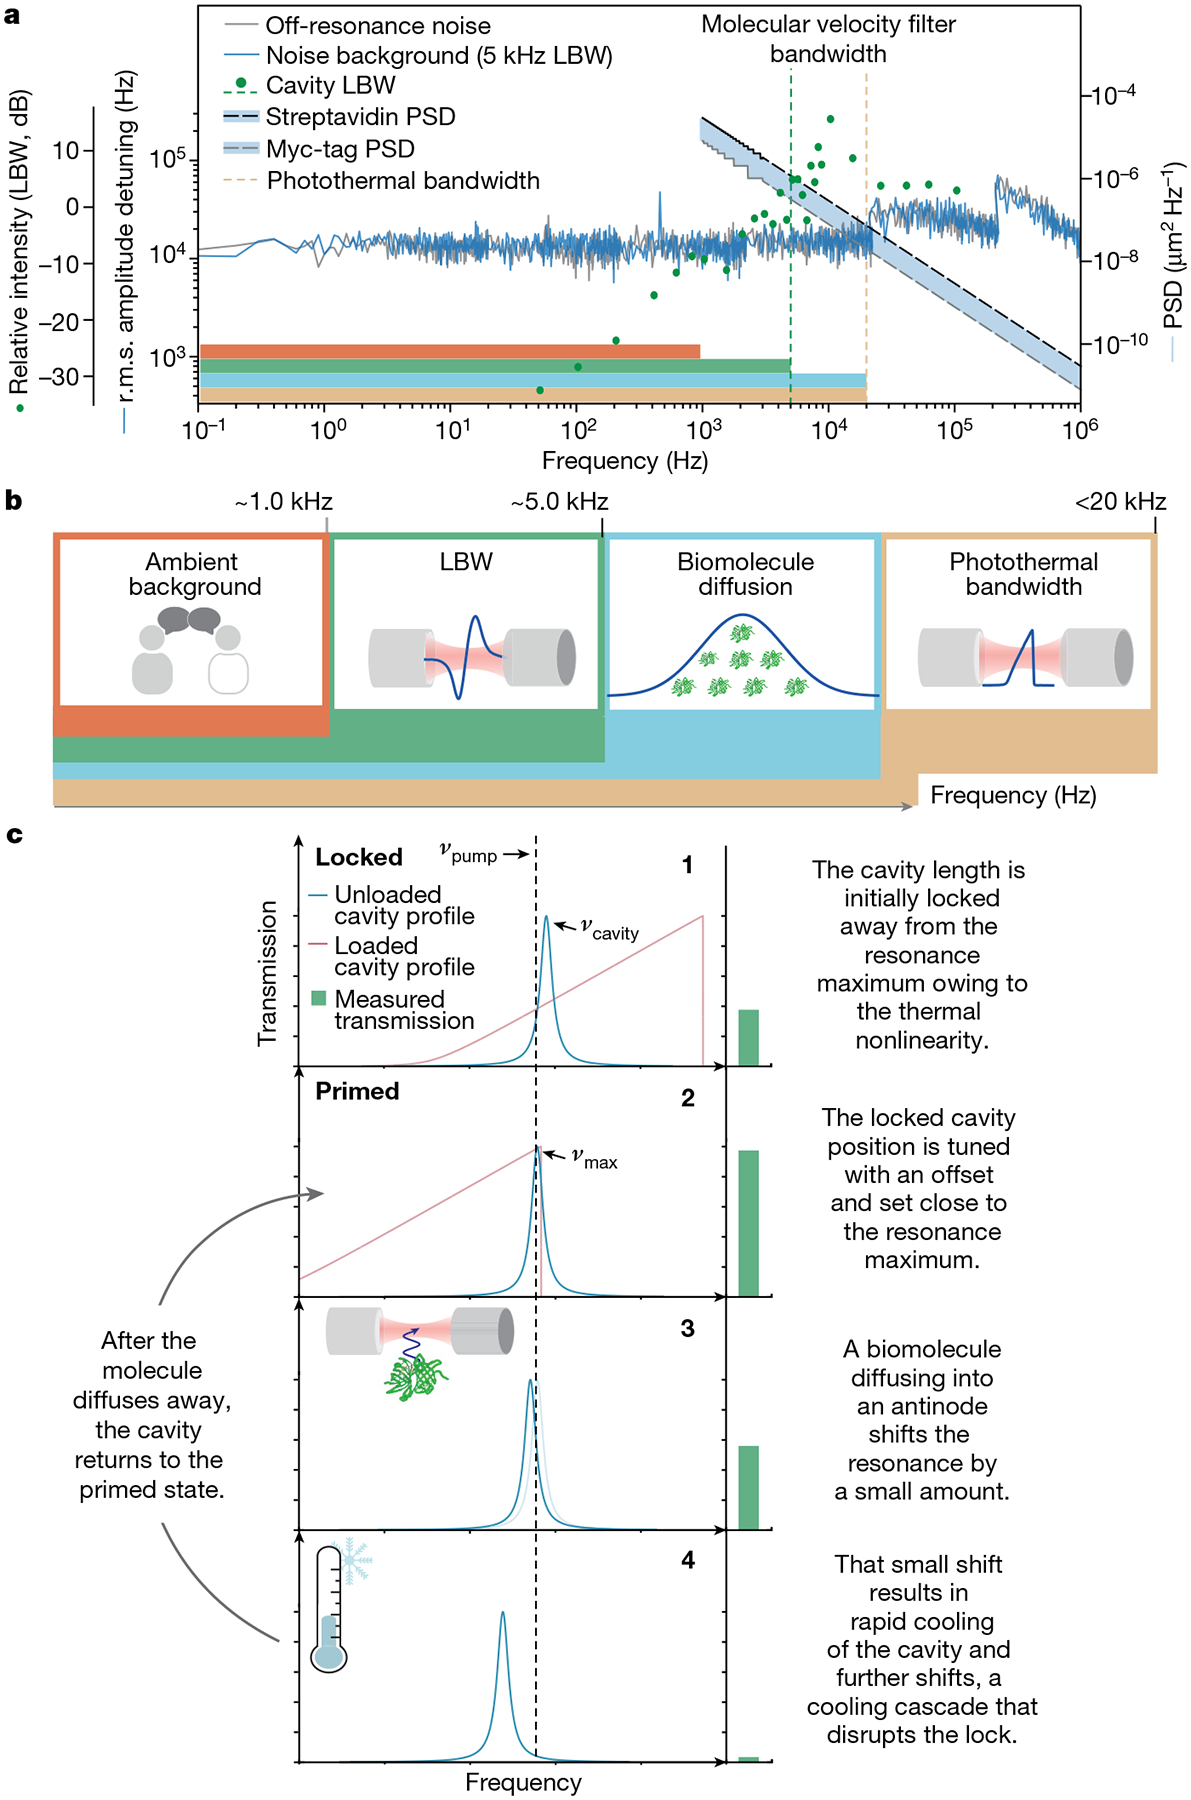
a, Plot showing frequency noise spectral density in water, LBW characterization and mean squared displacement (MSD) power spectral density (PSD) of proteins, streptavidin, aprotinin, carbonic anhydrase and Myc-tag. The noise spectral density of the locked cavity in water rapidly converges to the detector-limited noise (off-resonance noise), highlighting the high passive stability. The LBW of 5 kHz, defined by the 0 dB feedback gain crossing, governs the lower frequency limit of the velocity filter. The upper limit of the velocity filter is defined by the photothermal bandwidth (21 kHz). The molecular MSD PSD can be integrated within this filter bandwidth to determine the r.m.s. MSD. b, Illustration of the key processes and their frequency bandwidths. Noise below 5 kHz is suppressed by PDH. The lower limit, defined by the LBW, and the upper limit, defined by the photothermal bandwidth, determine the molecular diffusion velocity observation window. c, Schematic describing the mechanism of dynamic thermal priming (see text for details).
The second element of our proposed mechanism relies on a photothermally induced distortion of the resonance line shape (Fig. 5c) and a dynamic photothermal priming mechanism, which amplifies small resonance shifts. FFPCs spatially confine relatively intense optical fields, inducing on-resonance temperature changes inside the mode volume media and consequent thermo-optic resonance shifts22. The presence of this thermal nonlinearity clearly manifests as a broadened asymmetric cavity line shape on active scanning of the cavity length or wavelength23 (Extended Data Fig. 9). This photothermal nonlinearity arises from the mirror coatings and the aqueous medium and requires no light absorption by the molecule itself32,54. The photothermal bandwidth was determined experimentally to be 21 kHz (Supplementary Fig. 16a), defining the upper limit of our molecular observation window (Fig. 5b). In a non-PDH-stabilized cavity, these photothermal nonlinearities result in several distinct stable equilibria22. However, with PDH stabilization, this nonlinearity can be used for further signal amplification. Increasing the cavity transmission by introducing an offset from the original, arbitrary locked position (Fig. 5c, panel 1) results in the pump laser sitting at a frequency slightly lower than the cavity maximum (Fig. 5c, panel 2). In this primed state, even the resonance shift of a diffusing molecule can shift the cavity resonance to an unstable regime in which the pump laser sits at a higher frequency than the microcavity resonance (Fig. 5c, panel 3). Here the shift triggers a dynamic process by which the cavity cools faster than the LBW, resulting in further resonance shift and more cooling, ultimately causing a substantial transmission decrease (Fig. 5c, panel 4). Other molecule-induced mechanisms, such as scattering, may also contribute to cavity cooling. After the molecule has diffused out of the antinode, the cavity begins to warm and, eventually, the PDH recovers the initial locked position at a rate defined by the LBW (Fig. 5c, panel 2). In the case of smaller perturbations (as with Myc-tag), the cavity cools less, leading to the distribution of peak prominences. Evidence for this mechanism can be found in controlled voltage pulses added to the output servo of the PDH, providing internal perturbations that qualitatively mimic molecular passages (Extended Data Fig. 10).
In summary, our proposed mechanism features molecules diffusing into the microcavity, in which their fast motion exceeds the PDH LBW. A hypersensitive photothermally primed cavity, experiencing these fast molecular perturbations, rapidly cools, leading to enhanced shift and massive signal. Both peak prominence and temporal width are expected to be influenced by system parameters, including PDH LBW. However, although peak prominence is a complex function of biomolecule molecular weight (and thus refractive index) and diffusive parameters, the temporal width is expected to be dominated more purely by diffusive parameters, leading to clear linear dependence (Fig. 3). Future work will allow more quantitative information to be derived from peak prominence.
Conclusion
In the absence of surfaces, extrinsic labels, and plasmonic enhancers, this work has demonstrated exceptional sensitivity in observing single, diffusing biomolecules, achieving SNRs of more than 100 for a sub-1 nm peptide. Our approach takes advantage of the open-access geometry of microscale FFPCs to facilitate unimpeded biomolecule diffusion as well as maximize the overlap between the biomolecules and the optical field. Our enhanced sensitivity relative to other label-free techniques (Supplementary Fig. 4) originates in molecular velocity filtering and photothermal priming, in which two experimental challenges, fast molecular motion and thermal nonlinearity, are transformed into advantages. The resulting rich 2D intensity/temporal data can be used to distinguish unique, identifying molecular signatures and has the potential to provide quantitative mass and diffusional information.
Mass photometry, a new method that can provide quantitative mass information of unlabelled biomolecules7, has been commercialized and widely adopted, showcasing the possibilities of photonic single-molecule assays. Alternatively, our solution-phase FFPC-based approach avoids surfaces while providing μs-scale dynamics, a substantially higher sensitivity with ≤1 kDa detection limit and 2D signal profiles that offer a path towards distinguishing molecules based on conformation, which influences diffusion properties, as well as just mass. FFPCs offer convenient fibre-optic integration and molecules, after passing through the FFPC, could be readily interrogated using mass photometry, making the approaches truly complementary. Our approach also brings certain limitations at its current level of maturity (Supplementary Information). The nonlinearity of the signal, originating in the interplay between optical and thermal dynamics, imposes difficulties on the ability to derive quantitative information from peak prominence and to resolve more complex mixtures. Spatial resolution, so valuable in interferometric scattering, is largely absent in our method. The need for pM-level sample concentrations will provide benefit in sample-limited applications but also impose constraints on the ability to study bimolecular interactions. Future work will ascertain which of these limitations are fundamental and which can be circumvented. Simple experimental advances, such as suppression of external noise sources, are expected to yield marked improvements, including the capability to detect molecules smaller than 1 kDa. Optimization of measurement parameters using a quantitative model will enable configuration of the bandwidth of the velocity filter to selectively collect information from different diffusional populations. Our FFPC approach has the potential to resolve rapid biomolecular conformation changes, elucidate self-assembly of small molecules in complex samples, and provide routes to rapid screening of protein–protein and protein–drug interactions. By being label-free and single-molecule, our method can mitigate key experimental difficulties in FCS and dynamic light scattering, two widely applied biophysical techniques. This straightforward and readily scalable apparatus will bring numerous benefits to the fields of life and chemical sciences, such as trace analysis, separation science, mechanistic insights, and clinical diagnostics.
Methods
Mirrored fibre production
Copper-coated optical fibre with cladding diameter 125 μm (IVG Fiber, Cu600) was first etched using nitric acid (70%). This etching procedure removed the copper coating, leaving a layer of carbon coating above the cladding. The carbon coating was removed with a small amount of diamond paste on cloth; however, this step was removed for later fibre production owing to apparent contamination from the diamond paste. Fibres were flat-cleaved (<0.2–1.0°) using an automated cleaver (AFL Fujikura, CT-106)55.
An 18 W CO2 laser (Synrad, 48–1 KAM) generated the ablation laser beam, which was guided and modified with polarizing, phase retarding and other associated reflecting and ZnSe focusing optics. An arbitrary waveform generator (Agilent, 33220A) controlled the beam characteristics and a digital optical power meter head (Thorlabs, S314C) with an attached console (Thorlabs, PM100D) was used to measure the beam power. Optical fibre substrates were mounted on top of a fibre clamp (Thorlabs, HFF003), which rested on a three-axis translation system (Thorlabs, MTS50-Z8, MTS50B-Z8 and MTS50C-Z8), driven by a DC servo motor controller (Thorlabs, KDC101) secured to a long-range single-axis translator for inspection-ablation positioning (Thorlabs, LNR502(/M)) driven by a motor controller (Thorlabs, BSC201). A CCD camera (Thorlabs, CS165MU) coupled to a long-working-distance microscope system (Navitar, 160–10) with a 20× magnification, 0.42 NA infinity-corrected objective (Mitutoyo, 378-804-3) illuminated by a 635-nm LED source (Thorlabs, LEDD1B) was used to image the fibre position. Optimal ablation alignment was facilitated by illuminating the fibre core with an optical fault finder (VFLTOOL, HGB30). The laser was set to have a power of 0.28 W and a shot time of 250 ms was controlled using a shutter in front of the fibre. These shot parameters generated fibres with radii of curvature (ROC) at the base of the ablation of 48 μm on average and diameters, calculated by 2σ of a Gaussian fit to the ablation profile, of 21 μm on average (Supplementary Fig. 1).
The fibres were characterized with a ZYGO interferometer. Two perpendicular slices of the surface profile were analysed. For calculating the ROC, the centre of the ablation was assumed to be the minimum. A polynomial fit was then performed and stepwise derivatives were averaged to calculate the ROC. For the diameter, Gaussian fitting was performed and the diameter was taken to be two standard deviations of the fit. The ellipticity of the ablation was calculated by comparing both the ROC and the diameter values for the perpendicular slices. The decentration of the ablation was also measured by coupling the fault finder through the core of the fibre, which was then compared with the centre of the ablation. The decentration, ROC, diameter and ellipticity were all used to determine the viability of a fibre.
The fibre substrates were coated commercially with wavelengths of maximum reflectivity at either 635 nm (LASEROPTIK GmbH, Germany) or 635 and 780 nm (LAYERTEC GmbH, Germany), in which alternating layers of Ta2O5 and SiO2 were deposited using ion beam sputtering. These generated distributed Bragg reflector surfaces with transmission loss <20 ppm, absorption loss <10 ppm and scattering loss <16 ppm.
Ferrule assembly preparation
The cavity bridge assembly was prepared using fused silica ferrules (VitroCom, 8 × 1.25 × 1.25 mm) with an inner bore of 131 μm, based on the procedure in ref. 40. The glass ferrule was cleaned using an air plasma cleaner (Harrick Plasma, PDC-001-HP) for 10 min. A thin layer of ultraviolet (UV)-curable glue (Dymax, 9037-F) was placed on two 150 V piezos (Thorlabs, PA4DG), which were aligned flat to the ferrule, ensuring that the direction of translation was aligned with the long axis of the ferrule. The glue was then cured using a UV light (Rolence Enterprise, Q6 UV). The assembly of ferrule and two piezos was then affixed to a glass block, which was approximately 20 × 7 × 3 mm in dimensions. This assembly was then placed in an oven at 65–75 °C for 2–3 h for further curing of the glue. After this, wires were soldered onto the piezos. Two cuts were made in the ferrule to facilitate translation of the cavity length: one full-cut to separate the ferrule into two parts, maximizing the cavity length translation, and one half-cut to preserve fibre alignment along the inner bore. These cuts were made using diamond wire (Ø = 125 μm) secured in a jeweller’s saw. The full-cut was made off-centre and the half-cut was made close to the centre of the ferrule to provide access to the cavity mode. After the full-cut, a small piece of wire was placed in the bore to alert when the cut had reached the bore. During the cutting process, the glass dust was removed using canned air.
The ferrule was cleaned post-cutting by first running the ferrule under deionized water for 5 min. Using a digital microscope to visualize, Millipore water was pipetted through the bore of the ferrule and a piece of optical fibre was run through the bore to remove any remaining glass dust. This process was repeated until no visible dust remained. The ferrule was then rinsed under Millipore water and a few drops of methanol (≥99.9%) were run through the ferrule, which was then dried thoroughly using a nitrogen gas line.
Fibre cavity construction
The previously described high-reflectivity, mirror-coated optical fibres were spliced to a connectorized patch cable (Thorlabs, P3–630Y-FC-2) using a fusion splicer (Fujikura, FSM-100P). The fibres were aligned using a six-axis piezo actuated stage (Thorlabs, MAX602D). The input fibre was mounted to this stage using a tapered V-groove fibre holder (Thorlabs, HFV002). The output fibre was held by a V-groove fibre holder secured to an XYZ translation stage. To visually align the fibres, two cameras were aligned perpendicular to the fibre axis. The top-down view used a CMOS camera (Thorlabs, DCC1545M) connected to a zoom lens (Navitar, 1–50487). This imaging system was used for both alignment and to estimate the distance between the fibres. The second perpendicular axis was visualized using a digital microscope (Dino-Lite, AM4113ZT). Using both camera axes, the fibres were then coarsely aligned to one another visually using the six-axis stage. The next step was to finely align the fibres by recording resonances. To do this, a ramp signal from a data acquisition board (DAQ; National Instruments, BNC-2120) was applied to a piezo controller (Thorlabs, MDT693B), which drove the piezo aligned with the fibre axis. Laser light (635–760 nm) was then injected into the input fibre and collected through the output fibre to an avalanche photodiode (APD; Thorlabs, APD430A). Resonances were measured in transmission and optimized by adjusting all parameters of the six-axis stage. The cavity finesse was characterized by either using a wavelength-tunable external cavity diode laser (Newport, TLB-6704) or by means of an electro-optic phase modulator (EOM; EOSpace, PM-0S5–10-PFA-PFA-633 and PM-0S5–01-PFA-PFA-765/781) by introducing sidebands at a known frequency (2.6 GHz) and the linewidth extracted through Lorentzian fitting. The mirror separation was about 20 μm (Fig. 1b), leading to Q factors of around 2 × 10⁶ and mode volumes of roughly 80 μm3. The cavity finesses ranged from 27,000 to 101,000 across several cavities (Supplementary Information) in ambient conditions, reducing to 17,000–37,450 in water (owing to increased absorption and scattering losses and the higher refractive index of the medium; Fig. 1c).
The fibres were guided into the prepared ferrule using the top-down and perpendicular views, and the cavity formed at the centre of the half-cut. To secure the fibres inside the ferrule, 2 μl of low-viscosity, UV-curable glue (Master Bond, UV16) was deposited onto each fibre in turn at the left entrance of the non-slotted ferrule and the right entrance of the slotted ferrule. The glue was drawn up the fibre using capillary action and was UV-cured (Rolence Enterprise, Q6 UV) after about 2 mm of travel into the ferrule. The piezos on the bridge were then attached to a piezo driver (nPoint, D.200) and driven to assess the resonances under constant cavity translation.
Optical setup
Experiments were performed on a custom-built setup (Supplementary Fig. 19). Either a single-frequency, continuous-wave diode laser (660 nm, Cobolt Flamenco, 90261, 300 mW) of <1 MHz linewidth or a tunable Ti-sapphire cavity laser of <100 kHz linewidth operating at a single frequency (760 or 780 nm, M Squared, SolsTiS) was passed through a linear polarizer and half-wave plate then fibre-coupled into an electronic variable optical attenuator (Thorlabs, V600), then into an EOM (EOSpace, PM-0S5–10-PFA-PFA-633 and PM-0S5–01-PFA-PFA-765/781) driven by a voltage-controlled oscillator (VCO; Mini Circuits, ZX95–209-S+, 200 MHz). The light was then coupled into the input fibre of the cavity using a fibre-based beam splitter (Thorlabs, TW670R3A1). The power injected into the cavity was between 5 and 35 μW. The circulating power (Pcirc) was calculated using equation (1):
| (1) |
in which Pin is the input power56, η is the mode-matching overlap integral56, dm = ω(z = L/2) is the mode radius at the fibre mirror (see equation (3) in Supplementary Information), df is the radius of the mode inside the single-molecule fibre, T is the transmission factor of the mirror coating (transmission = 10 ppm) and F is the cavity finesse. This expression is valid for all cavity systems influenced by absorption losses57. The remaining path of the splitter was collimated and then focused (Thorlabs, C560TME-B) onto the active area of an APD (Thorlabs, APD430A), enabling collection of reflected resonance light. The reflected signal voltage was sent to a DAQ board (National Instruments, BNC-2120) and monitored using custom software. The transmitted light was collected through the output fibre of the cavity, collimated and focused (Thorlabs, C560TME-B) onto the active area of an APD (Thorlabs, APD430A). The transmitted signal voltage was sent to a diplexer (Mini Circuits, ZDPLX-2150-S+). The low-frequency component (DC–10 MHz) was then directed to the DAQ board (National Instruments, BNC-2120) to monitor the transmitted signal. The high-frequency component (50–2,150 MHz) was amplified and sent to a frequency mixer (Mini Circuits, ZP-1MH-S+), in which it was multiplied by the sinusoidal signal of the VCO under a homodyne detection scheme. The resulting frequency components were low-pass-filtered (Mini Circuits, SLP-1.9+) to extract the DC error signal and directed to the error input of the PDH lockbox (Vescent, D2–125). The locking feedback was supplied to the piezos driving the cavity length by means of the servo output of the PDH lockbox.
Hardware control and data-collection software
Experiments were performed using code written in-lab using Python 3 to handle both instrument control and data collection. The code interfaced with a DAQ board (National Instruments, BNC-2120) and oscilloscope (Rigol, DS1104). For DAQ and oscilloscope connections, control was established using the PyLabLib package published under the GPL 3.0 license (https://doi.org/10.5281/zenodo.7324876). The control code was written together with a graphical user interface to streamline user control. The graphical user interface and interactable elements of the program use the Qt framework through PySide2 bindings under the GPLv2 license. A copy of the control software is available for free use under the GPLv3 license at https://github.com/FairhallAlex/ces_tools.
Sample preparation
Protein samples included tetrameric streptavidin (66 kDa, 2.80 nm)58, carbonic anhydrase (30 kDa, 2.10 nm)59, aprotinin (6.5 kDa, 1.45 nm)60 and c-Myc peptide, known more commonly as Myc-tag (1.2 kDa, 0.75 nm)61. Lyophilized streptavidin (MilliporeSigma, 189730), carbonic anhydrase (MP Biomedicals, 0215387910), aprotinin (MilliporeSigma, A6106) and c-Myc peptide (MilliporeSigma, M2435) were dissolved to 1 mg ml−1 in PBS (pH 7.4), aliquoted to appropriate volumes and stored at −20 °C. For experimentation, samples were thawed on ice and diluted to the working concentration (0.25–15 pM) in filtered (Ø = 20 nm; Whatman Anotop, WHA68091002) ultrapure Millipore water (18 MΩ, pH 7). To ensure that the measurements would be at the single-molecule level, the optical mode volume was calculated to host an average of 0.7 molecules at the highest working concentration (15 pM).
DNA sequences for each construct were manually designed and validated by NUPACK (www.nupack.org). Commercially available oligonucleotides (Integrated DNA Technologies; Supplementary Table 1) were purchased and used without purification. To assemble each structure, corresponding DNA strands (5 μM) were mixed in folding buffer (25 mM HEPES, 100 mM KCl, 10 mM MgCl2, pH 7.4) and then annealed in a PCR thermal cycler (Bio-Rad) by a linear cooling step from 95 °C to 20 °C over 2 h (−0.1 °C per 10 s). The products were further purified by a size-exclusion chromatography column (Superdex 200 increase 10/300) on an ÄKTA pure system (Cytiva) to remove extra strand and potential aggregates. The final concentration of each construct was determined by NanoDrop (Thermo Fisher Scientific). Samples were stored at 4 °C for less than 1 month before use.
Single-molecule diffusion experiments
Before introducing proteins, filtered (Ø = 20 nm; Whatman Anotop, WHA68091002) MilliQ water (8 μl) was added to the cavity. The input power in the cavity was controlled with an applied voltage to the VOA (Thorlabs, V600A) to ensure that consistent power was used for all comparable experiments. The fundamental transmitted cavity mode was found under active-cavity-length translation and PDH-locked with a proportional gain of −40 dB. The locked position was tuned to the maximum possible transmission using the relative voltage offset on the lockbox (Vescent, D2–125). If spurious events were detected during the lock, the cavity was unlocked and cleaned under a flow of filtered MilliQ water and dried with N2. This process was repeated after protein experiments to ensure that the cavity was clean. The transmitted and reflected signals were monitored as a function of time at either 50 kHz or 500 kHz acquisition frequency. Intensity–time traces containing single-molecule events were saved as .csv files every 30 s using the custom software described above. Water control experiments were continued until 5 min of data in the absence of a spurious signal were collected.
Solutions of proteins (streptavidin, carbonic anhydrase, aprotinin or Myc-tag, 0.2–15 pM, 8 μl) or DNA (8 μl, 10 pM) in filtered MilliQ water were introduced into the cavity. The input power in the cavity was controlled with an applied voltage to the VOA to ensure that consistent power was used for all comparable experiments. The fundamental cavity mode was found under active-cavity-length translation and PDH-locked with a proportional gain of −40 dB. The transmitted and reflected signals were monitored as a function of time at either 50 kHz or 500 kHz acquisition frequency. Intensity–time traces containing single-molecule events were saved as .csv files every 30 s using the custom software described above. It is important to ensure that the single-molecule signals in the transmission geometry do not reach the noise floor of the detector, as this will limit the achievable dynamic range when studying molecules of varying mass/size. This can be controlled by appropriately minimizing the input power and the relative voltage offset of the PDH locking system.
To produce single-molecule traces in PBS (Extended Data Fig. 4) (10 mM phosphate, 150 mM NaCl, pH 7.4), the PBS was filtered through protein concentrators (Thermo Fisher, 88152) using a centrifuge (Eppendorf, MiniSpin) at 12,000 rpm for 30 min. The buffer filtered through the column was collected and filtered further (Ø = 20 nm; Whatman Anotop, WHA68091002). This cleaned buffer was then used to dilute aprotinin to a concentration of 15 pM. These experiments were conducted on a PDH-locked cavity in the same general manner as the experiments in water. First, the cavity was cleaned with water until no spurious events were detected in water. Then cleaned buffer was added, again assuring no spurious events were detected. The aprotinin in PBS was then added to the cavity and data were collected. After this step, the cavity was cleaned with water. Buffer control experiments under the same conditions were taken after the aprotinin experiments in the cleaned microcavity to ensure that the signal collected previously was because of single-molecule diffusion events of the desired analyte (aprotinin).
Mixture experiments were conducted on a locked cavity in the same general manner as the single-biomolecule diffusion experiments. Experiments began by adding filtered (Ø = 20 nm; Whatman Anotop, WHA68091002) MilliQ water (8 μl) and cleaning the cavity with filtered MilliQ water, until five blank 30 s, consecutive transmission time traces could be obtained. This same process was repeated after the set of DNA experiments to ensure that the cavity was clean and proper control data obtained.
DNA isomer spike experiments (Extended Data Fig. 6) were performed using two DNA isomers (Supplementary Table 1): a duplex (16.6 kDa, 9 nm) and a Y-junction (16.6 kDa, 9 nm). The duplex was diluted into filtered MilliQ water to a concentration of 1 pM and the Y-junction to a concentration of 20 pM. Equal parts of these solutions were then mixed for the initial mixture, yielding a concentration of 0.5 pM for the duplex and 10 pM for the Y-junction.
After the proper blank controls were obtained, the initial mixture (8 μl) was added to the cavity. The cavity was then locked and data collected. After sufficient data were collected for this condition, the cavity was unlocked, approximately 6 μl of solution was removed from the cavity, leaving solution behind, and the DNA duplex solution (6 μl, 1 pM) was added to the cavity. This addition defines the first ‘spike’. The cavity was then relocked and data were taken for this next condition. On finishing data collection for the second condition, the cavity was again unlocked and 6 μl of solution was removed from the cavity and the DNA Y-junction (6 μl, 20 pM) was added to the cavity. This was the second ‘spike’ to the cavity. The cavity was relocked and data collected for this third condition. Notably, at each step in which solution is removed from the cavity, there is still solution from the prior condition remaining.
DNA ternary mixture spike experiments (Supplementary Fig. 12) were performed using three DNA Y-junctions of varying mass: 9.2 kDa (2 nm), 16.6 kDa (4.5 nm) and 33 kDa (9 nm) (Supplementary Table 1). The complexes were each diluted to 10 pM using filtered MilliQ water and then mixed in equal parts. This yielded an initial mixture of each species having a concentration of 3.3 pM.
After the proper blank controls were obtained, 8 μl of the initial mixture was added to the cavity. The cavity was then locked and data collected. After sufficient data were collected for this condition, the cavity was unlocked, approximately 6 μl of solution were removed from the cavity, leaving solution behind, and 6 μl of the 9.2 kDa complex (3.3 pM) was added to the cavity. This addition defines the first ‘spike’. The cavity was then relocked and data were taken for this next condition. On finishing data collection for the second condition, the cavity was again unlocked and 6 μl of solution was removed from the cavity and the 16.6 kDa complex (6 μl, 3.3 pM) was added to the cavity. This was the second ‘spike’ to the cavity. The cavity was relocked and data collected for this third condition. For the final condition, the cavity was unlocked and 6 μl of solution was removed from the cavity and the 33 kDa complex (6 μl, 3.3 pM) was added to the cavity. This is the third ‘spike’ to the cavity and final condition, in which the cavity was locked and data collected. Notably, at each step for which solution is removed from the cavity, there is still solution from the prior condition remaining.
Signal strengths and temporal samplings
The prominence of the peaks differed between transmission and reflection detection channels (Fig. 2b, Extended Data Fig. 1 and Supplementary Fig. 5); this behaviour arises from the dispersion that is unique to FFPC cavities56 (Supplementary Fig. 6). The mean temporal widths of the events were unchanged at proportional gain values >−50 dB in the proportional-integral (PI) control of the PDH system (Supplementary Fig. 7), in which a higher proportional gain value constitutes a higher LBW. Consequently, experiments were conducted above this threshold at a LBW of approximately 5 kHz (Supplementary Fig. 8). Taken together, these data further confirm that these high-amplitude signals originate from the perturbation of the cavity-mode volume by single diffusing proteins.
The extraordinarily high SNR of the single-protein events, even down to the ten-amino-acid peptide Myc-tag, highlights the potential to extend the dynamic range of applications to both smaller molecules and higher acquisition rates. To demonstrate this, we measured transient events of Myc-tag diffusion with 2 μs time resolution (500 kHz acquisition rate; Extended Data Fig. 5). This high collection frequency facilitated the measurement of events as narrow as 26 μs. With a 500 kHz collection frequency, even these high-speed events can be sampled far beyond the minimum Nyquist requirement, highlighting the potential to study kHz processes such as enzyme kinetics and conformational changes62 without sacrificing SNR. Potentially higher sampling rates can be achieved with minimum contribution of photon shot noise using faster analogue electronics, as demonstrated recently16, but the finite photothermal bandwidth (see below) may limit the sensitivity at highly elevated sample rates.
LBW characterization
The LBW of the cavity was measured by adding a harmonic perturbation (Fh) of known frequency and amplitude together with the error signal (e) using a voltage adder to the PI input (Supplementary Fig. 17). To maintain a linear relationship between the voltage of the error signal during locking and the frequency detuning of the cavity, we optimized the amplitude of the perturbation to 0.2 times the peak-to-peak amplitude of the error signal. While the cavity was locked, we registered the sum of the perturbation signal and the error signal for different frequencies of the perturbation signal. This allowed us to measure the frequency at which the lock stops being effective at compensating for the perturbation to the system to determine the 0 dB gain value and thus the LBW of about 5 kHz (Supplementary Fig. 8 and Fig. 5a).
Noise-floor determination
We measured the noise profile of the locked cavity from the error signal data. The voltage amplitude of the error signal was converted to its corresponding cavity frequency shift using the scanned error signal slope calibrated with the modulation sidebands at 2.6 GHz. From the calculated Fourier transform of the error signal, we extracted the r.m.s. values of the cavity resonance frequency shift. We performed this measurement for different proportional gain settings at which the maximum noise suppression was reached for the maximum LBW at about 5 KHz. The noise floor was measured from the off-resonance error signal. This value, as well as the cavity finesse and gain, determine the LBW. We found effective noise suppression of external perturbations by the PDH-locking loop at the level of the noise floor throughout the LBW. Although the source of low-frequency noise is mainly because of ambient acoustic waves, mechanical waves that couple through the cavity system by means of contact points to the optical table, higher-frequency noise (above the LBW) inherent to the electronic control systems is suppressed using a low-pass passive filter before the piezo connection. Mechanical resonances of the cavity are expected to appear at frequencies above the LBW; however, its magnitude is below the detector noise floor40, at the level of 103 Hz Hz−1/2 (Supplementary Fig. 14). The high mechanical passive stability of the cavity and the active PDH defines a frequency region in which the cavity can be more sensitive to internal perturbations, as described in the main text.
Voltage-pulse experiments
To demonstrate the mechanism described in the main text (Fig. 5c), we induced controlled perturbations to the locked cavity to mimic molecular perturbations to the cavity. The passage of molecules into the cavity results in an increase in the average refractive index and a consequent decrease in frequency. This frequency decrease was mimicked by transiently, slightly increasing the length of the cavity by applying a voltage pulse to the piezo. On the basis of the measured duration of molecular transit events (Extended Data Fig. 1) and their prominence, we initially selected the parameters of the pulse, including duration and amplitude, to approximately induce similar detuning magnitudes and cavity transmission profiles (Extended Data Fig. 10). Square pulse signals of 140 μs to 1 ms duration (Extended Data Fig. 10) and 1 Hz repetition rate were produced to affect the cavity length while the cavity was locked. The pulse produced by a function generator (Keysight, DSOX1204G) was added to the servo output of the lockbox; this combined signal was then directed to the piezos. The transmission signal of the locked cavity over time was recorded to ensure that all perturbation events and pulse signals were correlated (Extended Data Fig. 10a). A small reaction delay was seen as a result of the length of the cables that drive the piezo, the reaction time of the electromechanics and the transmission signal to the DAQ card. The transmission profile (Extended Data Fig. 10, blue trace) is the result of the step-up voltage perturbation (grey), which produced a steep reduction of the locked transmission signal owing to the photothermal effect (a). This was followed by a brief recovery to the locked state by the PI feedback (b), followed by a second descent of the transmission signal as the step-up voltage of the pulse shifts the cavity in the opposite direction (c). Finally, the PI control recovers the locked state (d). When the pulse is generated, the resulting perturbation has a profile that resembles the transmitted signal profiles of the cavity owing to the molecular interaction (Fig. 2a and Extended Data Fig. 1).
Photothermal broadening and thermo-optic coefficient
Optical microcavities with small mode volumes are susceptible to dynamic photothermal nonlinearities that originate from the build-up of intense optical fields, causing the temperature to increase in the cavity as a result of the absorption of this electromagnetic energy by the cavity constituents. Coupling between the heat and cavity resonance frequency can result in drift of resonance frequencies and cooling cascades22.
These photothermal dynamics depend on the thermo-optic coefficient (dn/dT) of the medium dominating the thermal dissipation. Increasing the temperature of a medium with a negative dn/dT will result in a decrease in the refractive index and, consequently, a lower cavity resonance wavelength (high frequency). When the cavity length or laser frequency is scanned, the resonance may drift to higher or lower wavelengths, depending on the direction of the scan and the cavity-laser detuning. When the cavity length is scanned to longer lengths, the optimal resonance condition (equation (2)),
| (2) |
in which m is an integer, λ is the wavelength, n is the refractive index of the medium and L is the cavity length, seems to change as n decreases, resulting in a need for still higher lengths and resulting in a distorted line shape (Extended Data Fig. 9). This behaviour is expected in FFPCs when the medium is air and the thermal dissipation is dominated by the mirror coatings, in which an ‘effective’ negative dn/dT (ref. 23) owing to thermal expansion results in a shorter cavity length56. A negative dn/dT is also expected when the medium is water63. We characterized the photothermal behaviour in our FFPCs with water by actively scanning the cavity to increasing length and observing the direction of photothermal broadening in water (Extended Data Fig. 9). A positive voltage gradient was applied to one of the piezos and confirmation that the positive voltage corresponded to increasing cavity length was achieved by tuning the wavelength of the pump laser and observing a shift of the resonance position to higher voltages with a lower pump wavelength. The direction of the broadened resonance was observed to be towards longer cavity lengths, thus lower wavelengths, as expected for a system dominated by a medium with a negative thermo-optic coefficient.
Photothermal bandwidth measurement
Photothermal broadening of cavity line shapes as a function of applied ramp speed was recorded to quantify the photothermal bandwidth of the cavity in water (Supplementary Fig. 16a). Resonances were recorded in transmission as a function of time and the cavity length was tuned using a ramp signal applied to the piezos from a function generator (Keysight, DSOX1204G). Phase-modulated sidebands at a known frequency (2.6 GHz) were applied to be used as a frequency calibration marker to each trace. Initially, the ramp frequency and amplitude were chosen to minimize the photothermal effects in the cavity. This was determined by matching resonance line shapes during both the increase and the decrease of ramp voltage. This trace was used to measure the linewidth of the cavity. From there, the ramp speed was scanned and traces were recorded for both the increase and the decrease in ramp voltage components of the ramp signal.
Data analysis for single-molecule diffusion and autocorrelation
Analysis of transmitted and reflected signals resulting from perturbation by single biomolecules was performed with custom-written code using Python 3. Raw data were passed through a low-pass filter (1.2 kHz) using the scipy.signal.butter function. Biomolecule and water control data collected at a single input power were first normalized to the maximum (for reflection) or minimum (for transmission) signal intensity to enable all signal peaks at a comparable power to be selected with a single threshold between 0 and 1. Single events were identified and analysed using the scipy.signal.find_peaks function. Signal peaks were selected at a prominence threshold of 0.35. A temporal filter of 2 ms was applied to ensure that only peaks separated in time by more than 2 ms were selected. Temporal widths were determined at the FWHM of the event and prominences were determined as the vertical distance between the maximum of the peak and the local background intensity.
We performed autocorrelation analysis to quantify the temporal behaviour of the single-molecule events in the intensity–time traces with custom code written in Python 3. A normalized function was generated by comparing time-shifted values to one another (equation (3)):
| (3) |
in which k is the number of time steps, N is the total number of points, Yi is the intensity for a specific time and is the average intensity. Several 30 s intensity–time traces for proteins diffusing in the locked cavity were concatenated. To ensure that the background was approximately continuous between files, the minimum of each file was found and then subtracted from every point. Events were identified with an intensity threshold 2.5 standard deviations from the mean and used to generate an autocorrelation trace. The function sm.tsa.acf from the statsmodels package was used to generate the autocorrelation function. These functions were plotted for the four different proteins (streptavidin, carbonic anhydrase, aprotinin and Myc-tag; Fig. 3a) and the values for different decay times were extracted. The time to decay to 40% of the autocorrelation time is shown to be linear with protein radius (Fig. 3b). This linear trend was preserved for a large range of decay values (Supplementary Fig. 9), demonstrating the robustness of the analysis. A copy of the analysis software is available for free use under the GPLv3 license at https://github.com/FairhallAlex/ces_tools.
Data analysis for LBW determination
To extract the effective LBW of the system, the Fourier transform of the signal was measured at point S for each perturbation frequency (Supplementary Fig. 17). This Fourier analysis allowed us to decompose the signal into its frequency components, revealing how the system responds to different perturbation frequencies. The amplitudes at the perturbation frequencies were extracted and normalized with respect to the input signal Fh. This normalization process was crucial for comparing responses across different frequencies and conditions. The normalized amplitudes were then converted to dB to provide a logarithmic scale that is commonly used in signal analysis. The result of the normalized values is shown as a function of input frequency of the sine wave (Fig. 5a and Supplementary Fig. 8). The LBW was determined by identifying the frequency at which the normalized amplitude crosses 0 dB. This point represents the boundary at which the locking system begins to lose its effectiveness in tracking and correcting for perturbations and was determined to be about 5 kHz. It is noteworthy that, at higher frequencies, the signal exhibited amplification, attributed to a phase change in the control circuit referred to as the ‘servo bump’. This phenomenon is accounted for in the analysis. Furthermore, at even higher frequencies, the locking system had no discernible influence on the perturbation signal, resulting in a consistent relative intensity at 0 dB.
SNR determination
The data traces were smoothed using various bin sizes to generate a moving average, following:
| (4) |
in which n is the bin size and Fi is the value of the function at index i. This smoothing procedure was performed for a series of different bin sizes from n = 1 to n = 250 (Supplementary Fig. 18). Following smoothing, the trace was normalized. This process of smoothing the data was only performed for SNR calculations. To then calculate the SNR, the standard deviation of the background (σN) was taken from the longest segment of background in the trace. The signal (S) was then calculated from the amplitude of the peaks and the SNRs for the proteins measured in this paper (Supplementary Fig. 4) were calculated by:
| (5) |
quantifying the SNR for each peak under each smoothing bin size. Given the maximum average SNR, a bin size of 190 was used for all datasets. With a 50 kHz data acquisition rate and 190 point average, our SNR values can be considered to be over a 260 Hz bandwidth.
For comparison with other techniques, when provided, SNR values were taken directly from refs. 7,10,12,13,44. For ref. 3, data were extracted into a .csv file from Fig. 4a using WebPlotDigitizer. The SNR was then calculated by taking the maximum of the signal and dividing it by the standard deviation of a region without signal. For ref. 14, the resonance shift was taken to be 5 am as a high estimate from Fig. 5e and divided by the reported noise level of 9.6 × 10⁻⁴ fm. For ref. 11, the standard deviation of the noise was calculated by estimating 3σ from Fig. 5b and dividing that by 3. The SNR was then calculated using the mean reported value of 2.5 fm for the 8-mer and then dividing by the previously calculated standard deviation.
Data analysis for photothermal bandwidth determination
To determine the photothermal bandwidth, the frequency shift of the photothermally broadened peak was calculated for each corresponding ramp speed. The photothermally broadened peak for each ramp speed had the larger distance between the left sideband and the main peak, which was determined to be the interpeak distance. Using this information, the frequency shift for each ramp speed was then calculated by calculating the difference between the photothermally broadened interpeak distance and the photothermally narrowed interpeak distance. The frequency shift as a function of the ramp speed (Extended Data Fig. 9) was then fitted to equation (6) (ref. 23):
| (6) |
in which βad and τ corresponded to the adiabatic thermal resonance shift and the thermal reaction time constant, respectively. β(x) is the number of linewidths shifted and x is the scan speed in linewidths s−1. βad was calculated to be 8.28 linewidths and τ was calculated to be 23.7 μs. Then, using equation (7):
| (7) |
τ was converted to fth (21 kHz), which is the bandwidth for photothermal resonator length stabilization.
Data analysis for mixtures
In the main text, Fig. 4 demonstrates the resolution of mixtures of proteins and DNA isomers. This section discusses further supporting experiments and provides more analysis of mixtures.
For the DNA mixture, the identity of each isomer in the mixture was confirmed by starting with a mixture (Fig. 4b and Extended Data Fig. 6a), spiking in the Y-junction (Extended Data Fig. 6b), then spiking in the duplex (Extended Data Fig. 6c). Scatter plot versions of the contour plots in Fig. 4 are shown in Supplementary Fig. 11. In a statistical mixture of molecules, there should be no extended time periods in which only one population is observed. This is shown to be the case for both the protein and the DNA mixtures (Extended Data Fig. 8). Any mode wandering in the microcavity can be identified by a sudden shift of a population to a different peak amplitude.
A three-component DNA mixture of molecular weights 9.2 kDa, 16.6 kDa and 33 kDa (Supplementary Table 1) was studied, starting with the mixture (Supplementary Fig. 12a) and then independently spiking in each component. Although the smallest (Supplementary Fig. 12b) and largest (Supplementary Fig. 12d) components are easily resolved (Supplementary Fig. 12a–d), it is difficult to resolve the middle population (Supplementary Fig. 12c). When the middle population is spiked, a population is strengthened at (x, y) ≈ (0.75 ms, 0.55 V). On the one hand, this population would not be visible looking at the 1D histograms (green and yellow histograms), demonstrating the value of the 2D data. On the other hand, the location of this middle population on the 2D histogram seems to be highly sensitive to system parameters. Thus, resolving mixtures beyond binary mixtures seems to be at the edge of current feasibility. This problem is probably a result of the nonlinear nature of the readout and is further commented on in the ‘Additional Discussion’ section in the Supplementary Information.
Extended Data
Extended Data Fig. 1 |. Zoomed-in view of single-molecule signals.
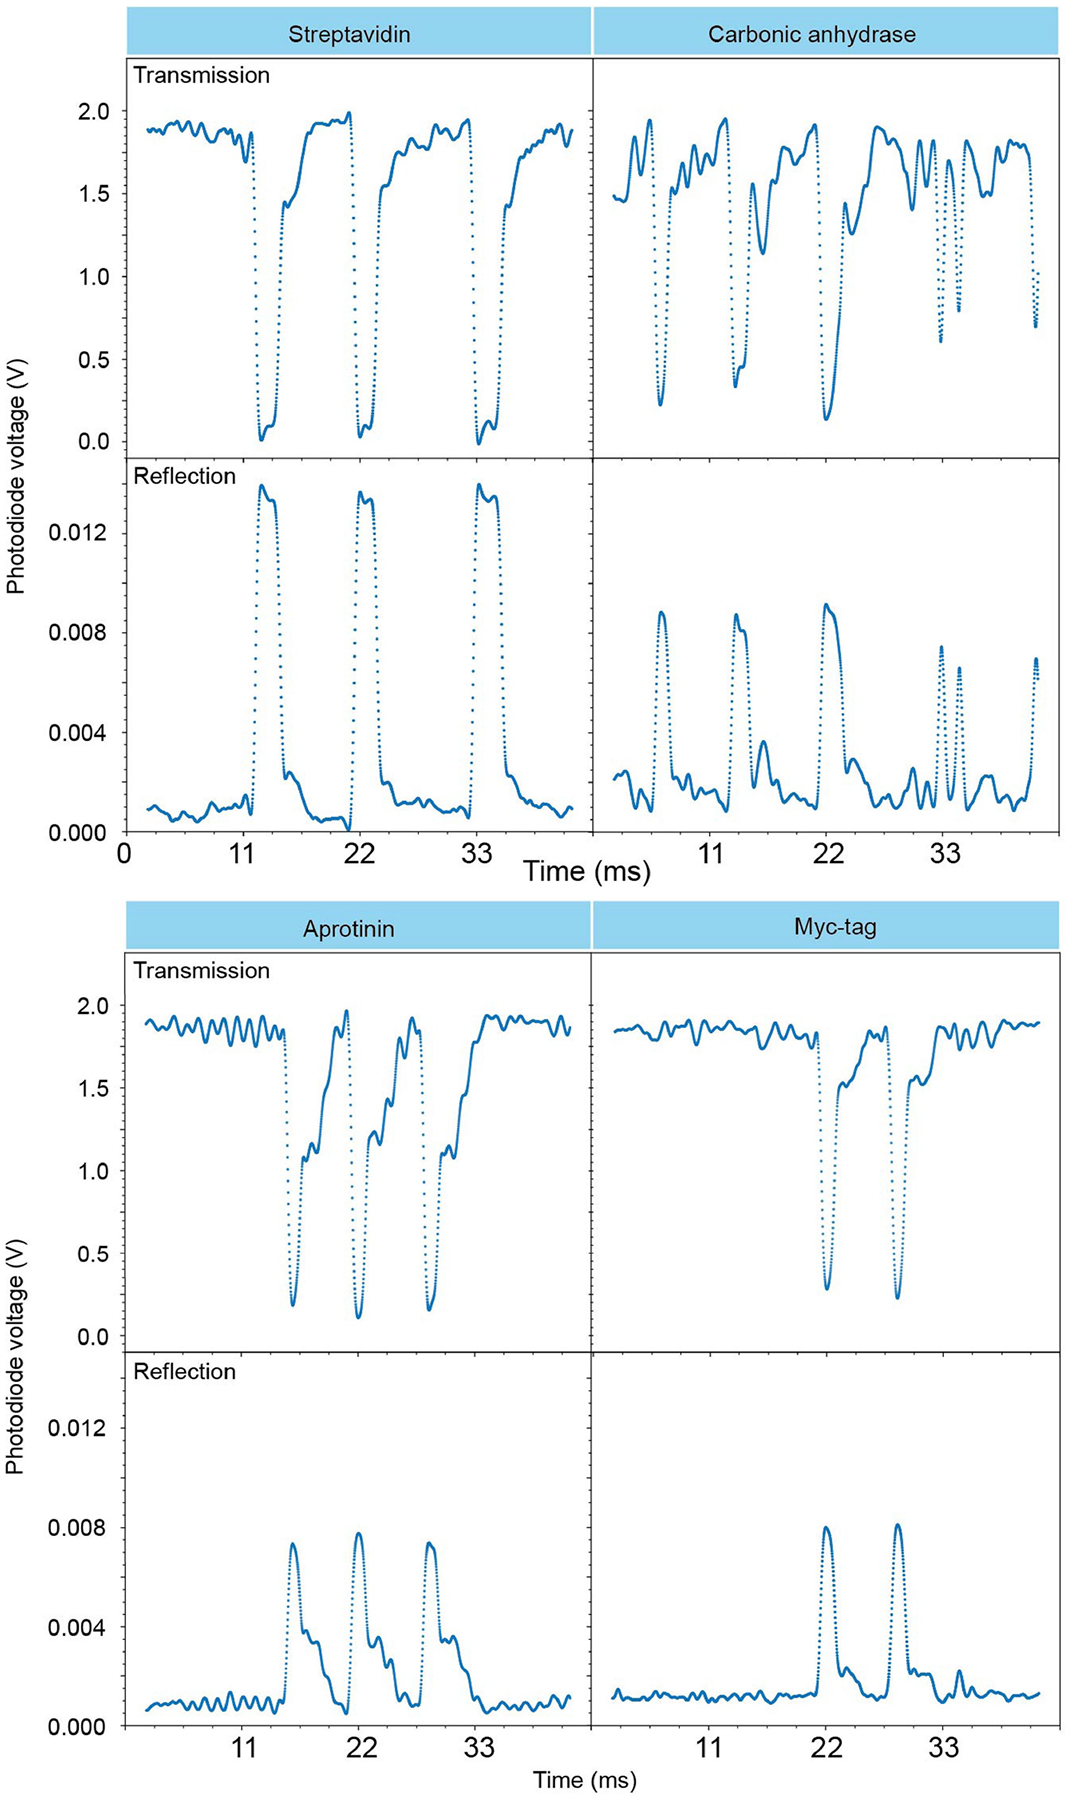
Representative 44-ms traces of proteins streptavidin, carbonic anhydrase, aprotinin and Myc-tag perturbing the cavity mode in both transmission and reflection. Data collected in cavity one.
Extended Data Fig. 2 |. Linearity of peak count with concentration.
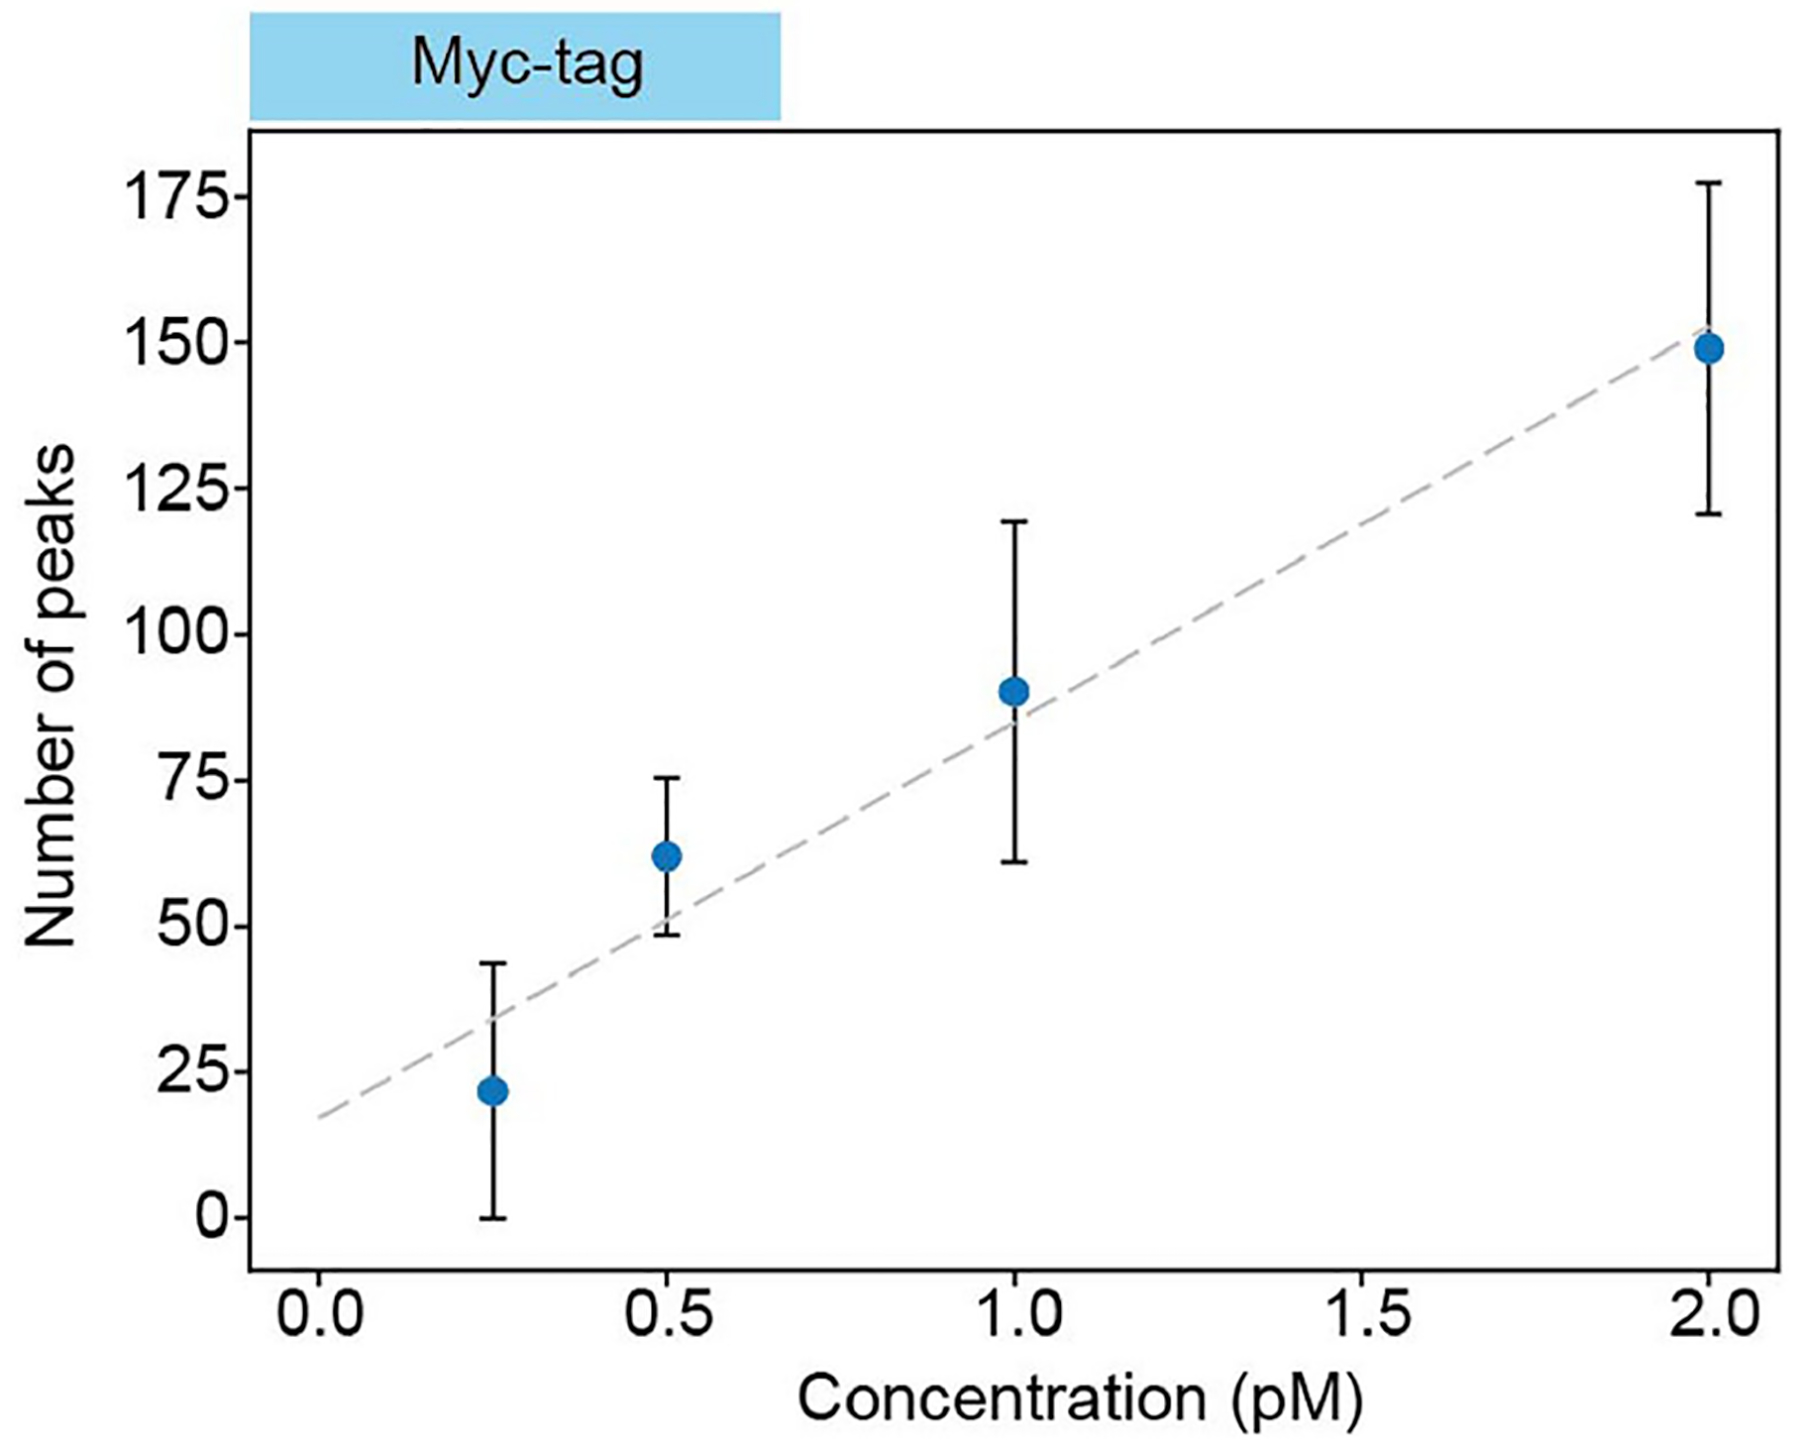
Number of detected peaks induced by Myc-tag as a function of the protein concentration. Error bars represent the standard deviation across datasets. This scaling demonstrates that the peaks are induced by interactions between biomolecules and the cavity mode. Data collected in cavity two.
Extended Data Fig. 3 |. Poisson distribution of single-molecule signal arrival times.
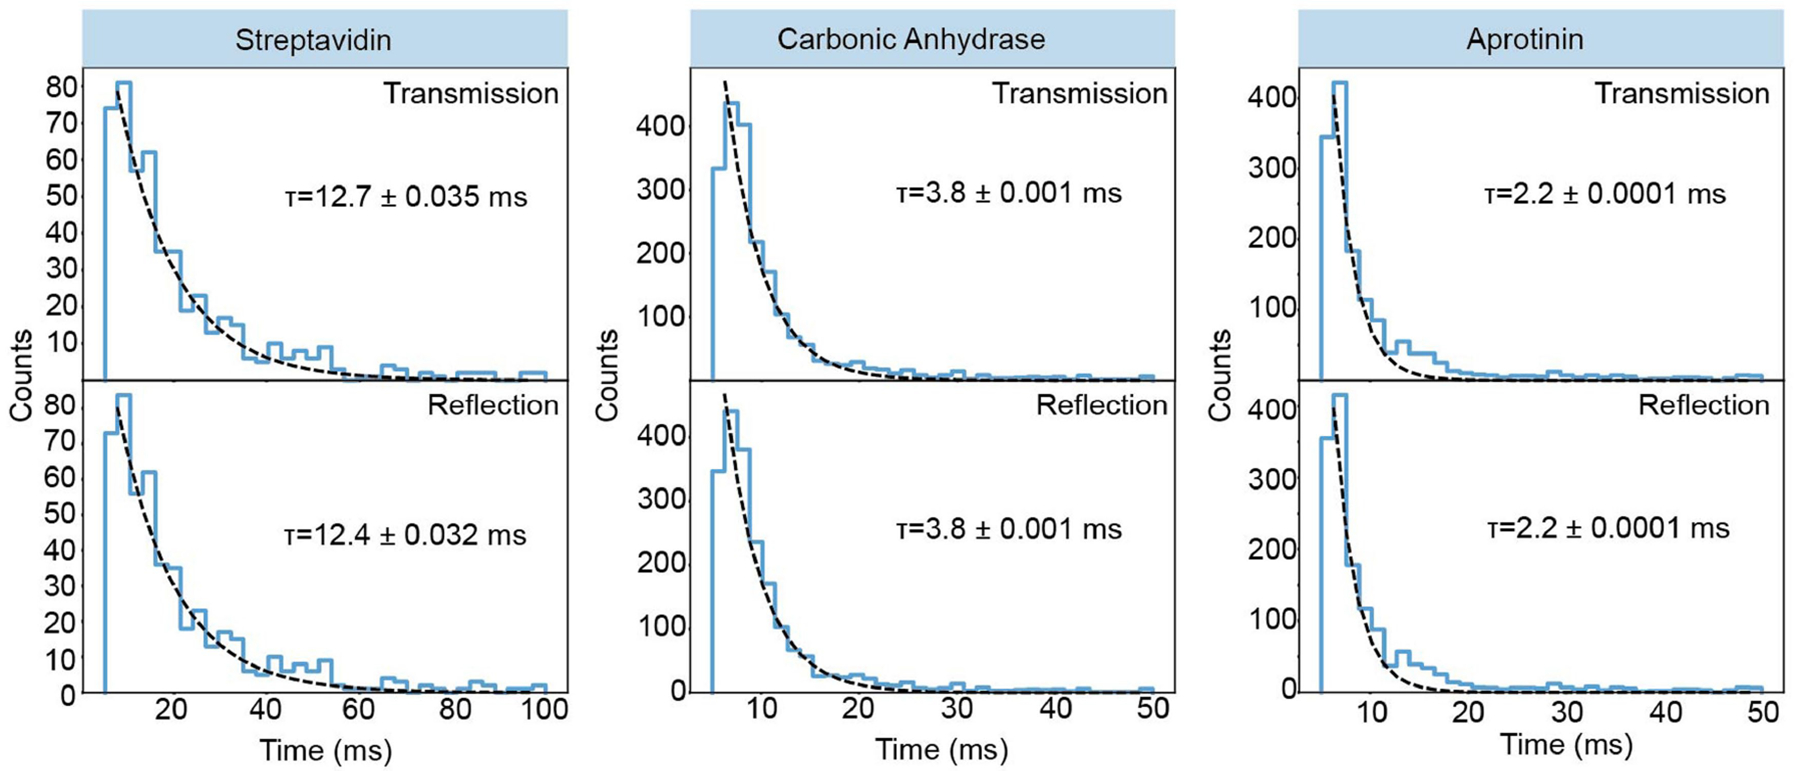
Statistical analysis of the time intervals between single-molecule events for proteins streptavidin, carbonic anhydrase and Myc-tag. This analysis shows mono-exponential decays illustrating the underlying Poisson behaviour of the experiment and providing evidence of single-molecule detection.
Extended Data Fig. 4 |. Detection of protein molecules in buffer.

Single-molecule transients of aprotinin are readily observed in PBS buffer, whereas the pure PBS buffer and pure water are devoid of single-molecule signals.
Extended Data Fig. 5 |. Detection of signals sampled at 500 kHz.
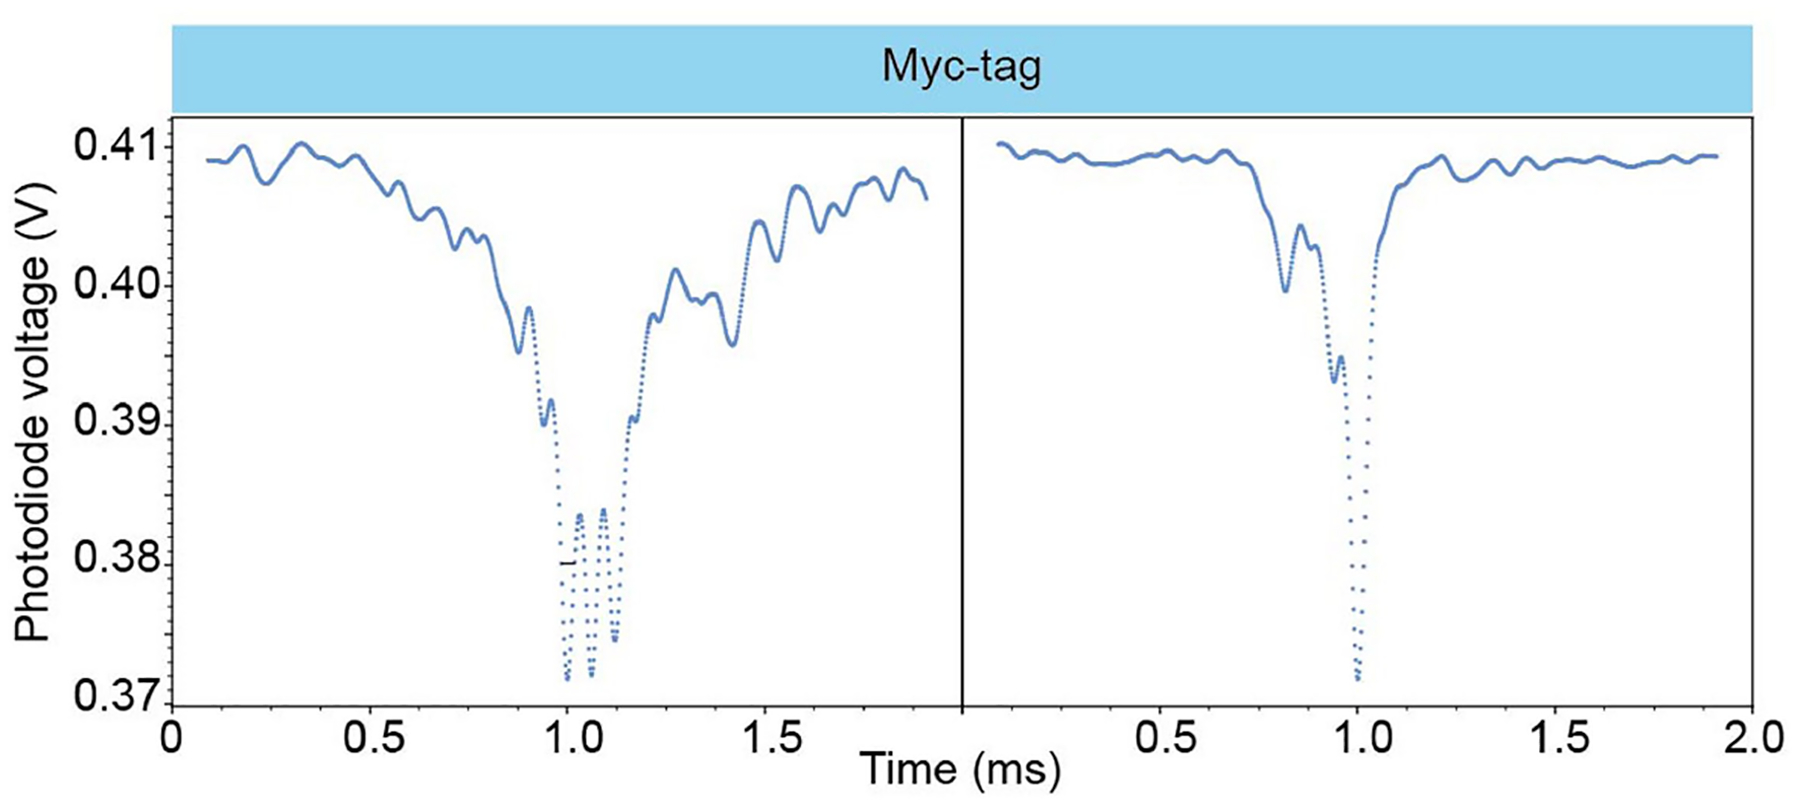
Single diffusion events of <1 nm protein, Myc-tag, are resolvable with 2 μs temporal resolution. Representative single Myc-tag events collected with 500 kHz acquisition frequency. Data collected using cavity two at a concentration of 1 pM.
Extended Data Fig. 6 |. Histograms of detection events in mixtures.
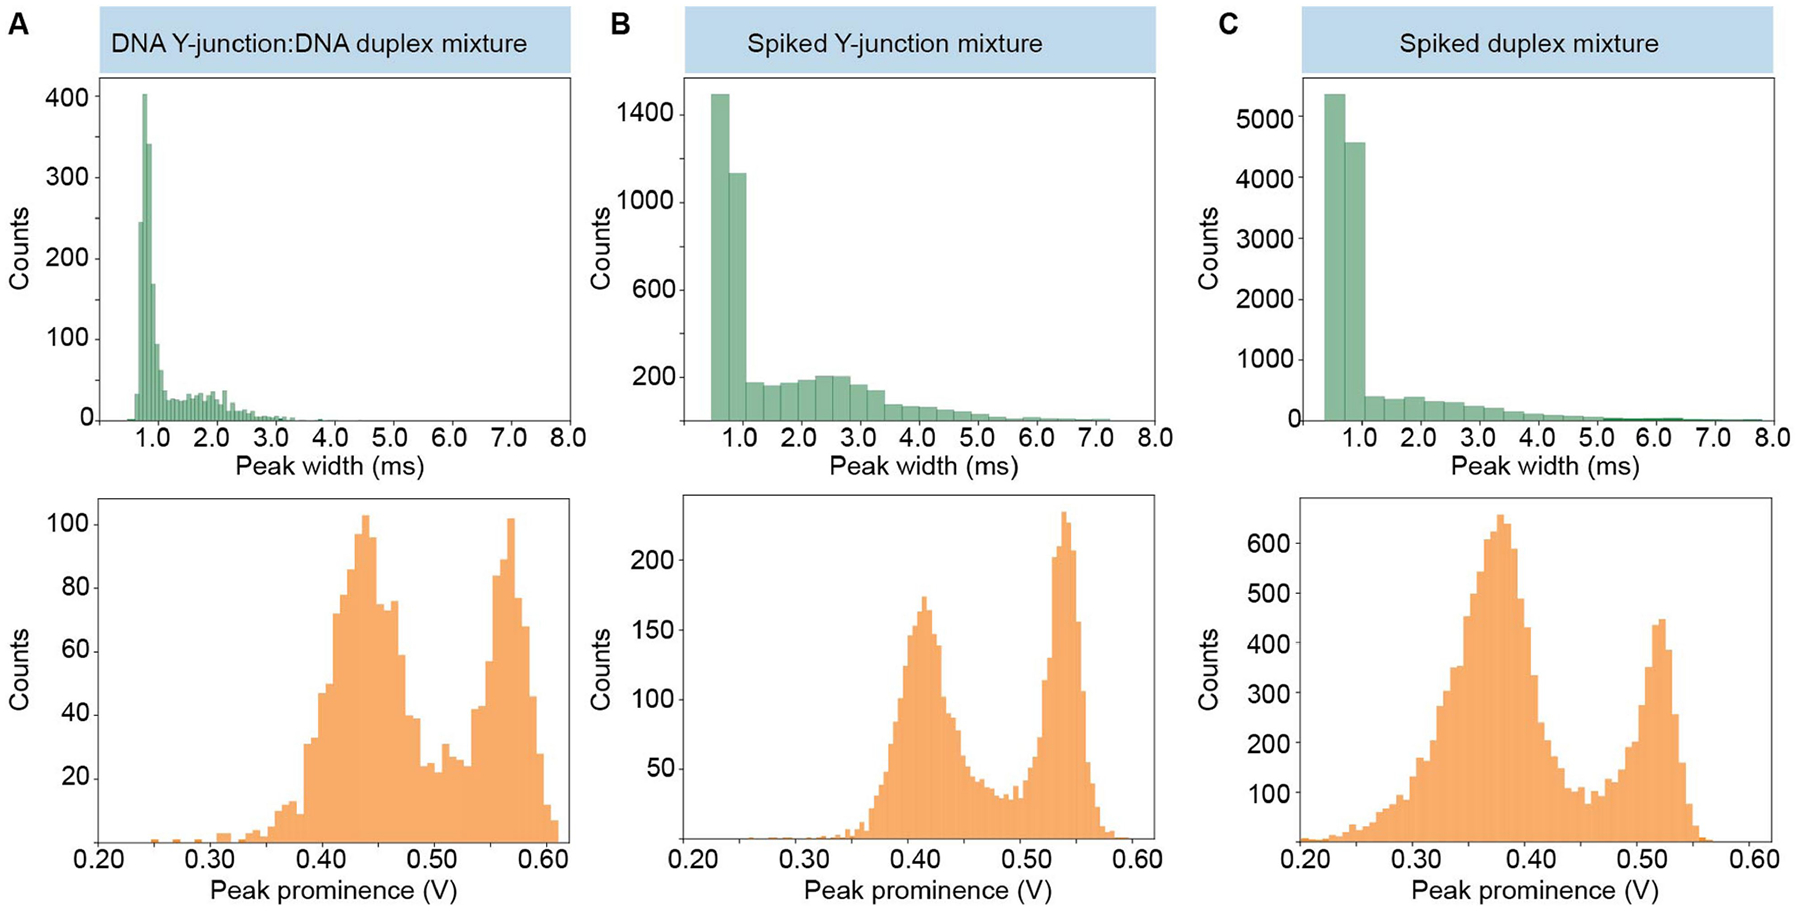
a–c, Histograms showing extracted temporal widths and peak prominences of transmitted signals of a binary DNA Y-junction:duplex mixture (a; Supplementary Table 1), the mixture spiked with extra amounts of the pure Y-junction (b) and the mixture spiked with extra amounts of pure duplex (c).
Extended Data Fig. 7 |. Staggered detection from mixtures.
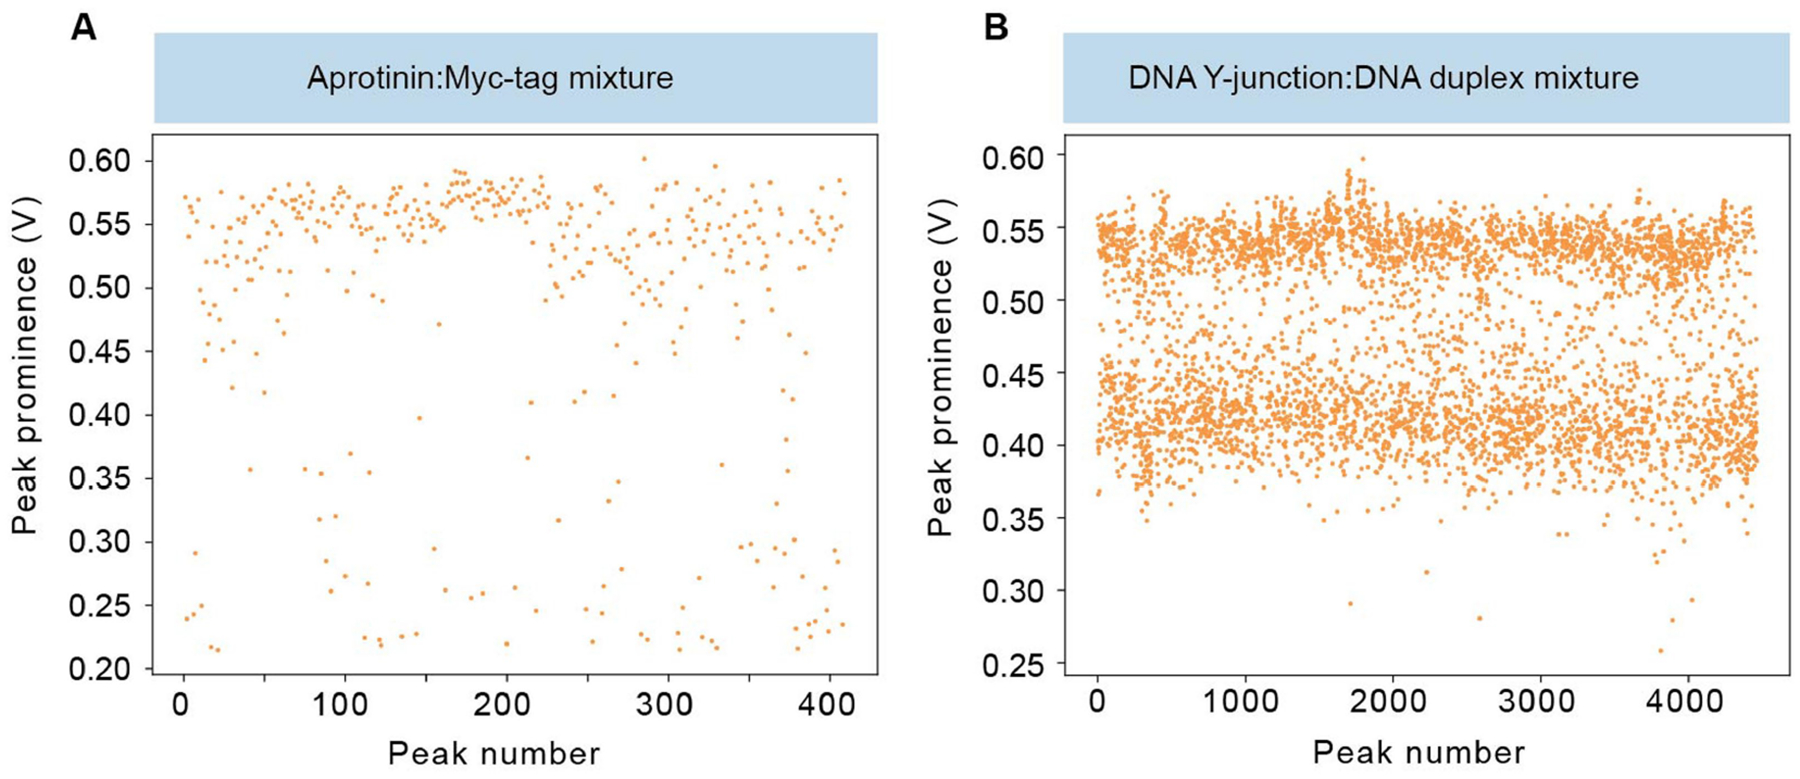
a,b, Scatter plots of peak prominence versus peak number showing consistency of molecular populations throughout the duration of an experiment and minimal cavity mode wandering for a binary mixture of aprotinin and Myc-tag (a) and a binary mixture of a DNA Y-junction and duplex (b; Supplementary Table 1).
Extended Data Fig. 8 |. Simulation of microcavity resonant mode.
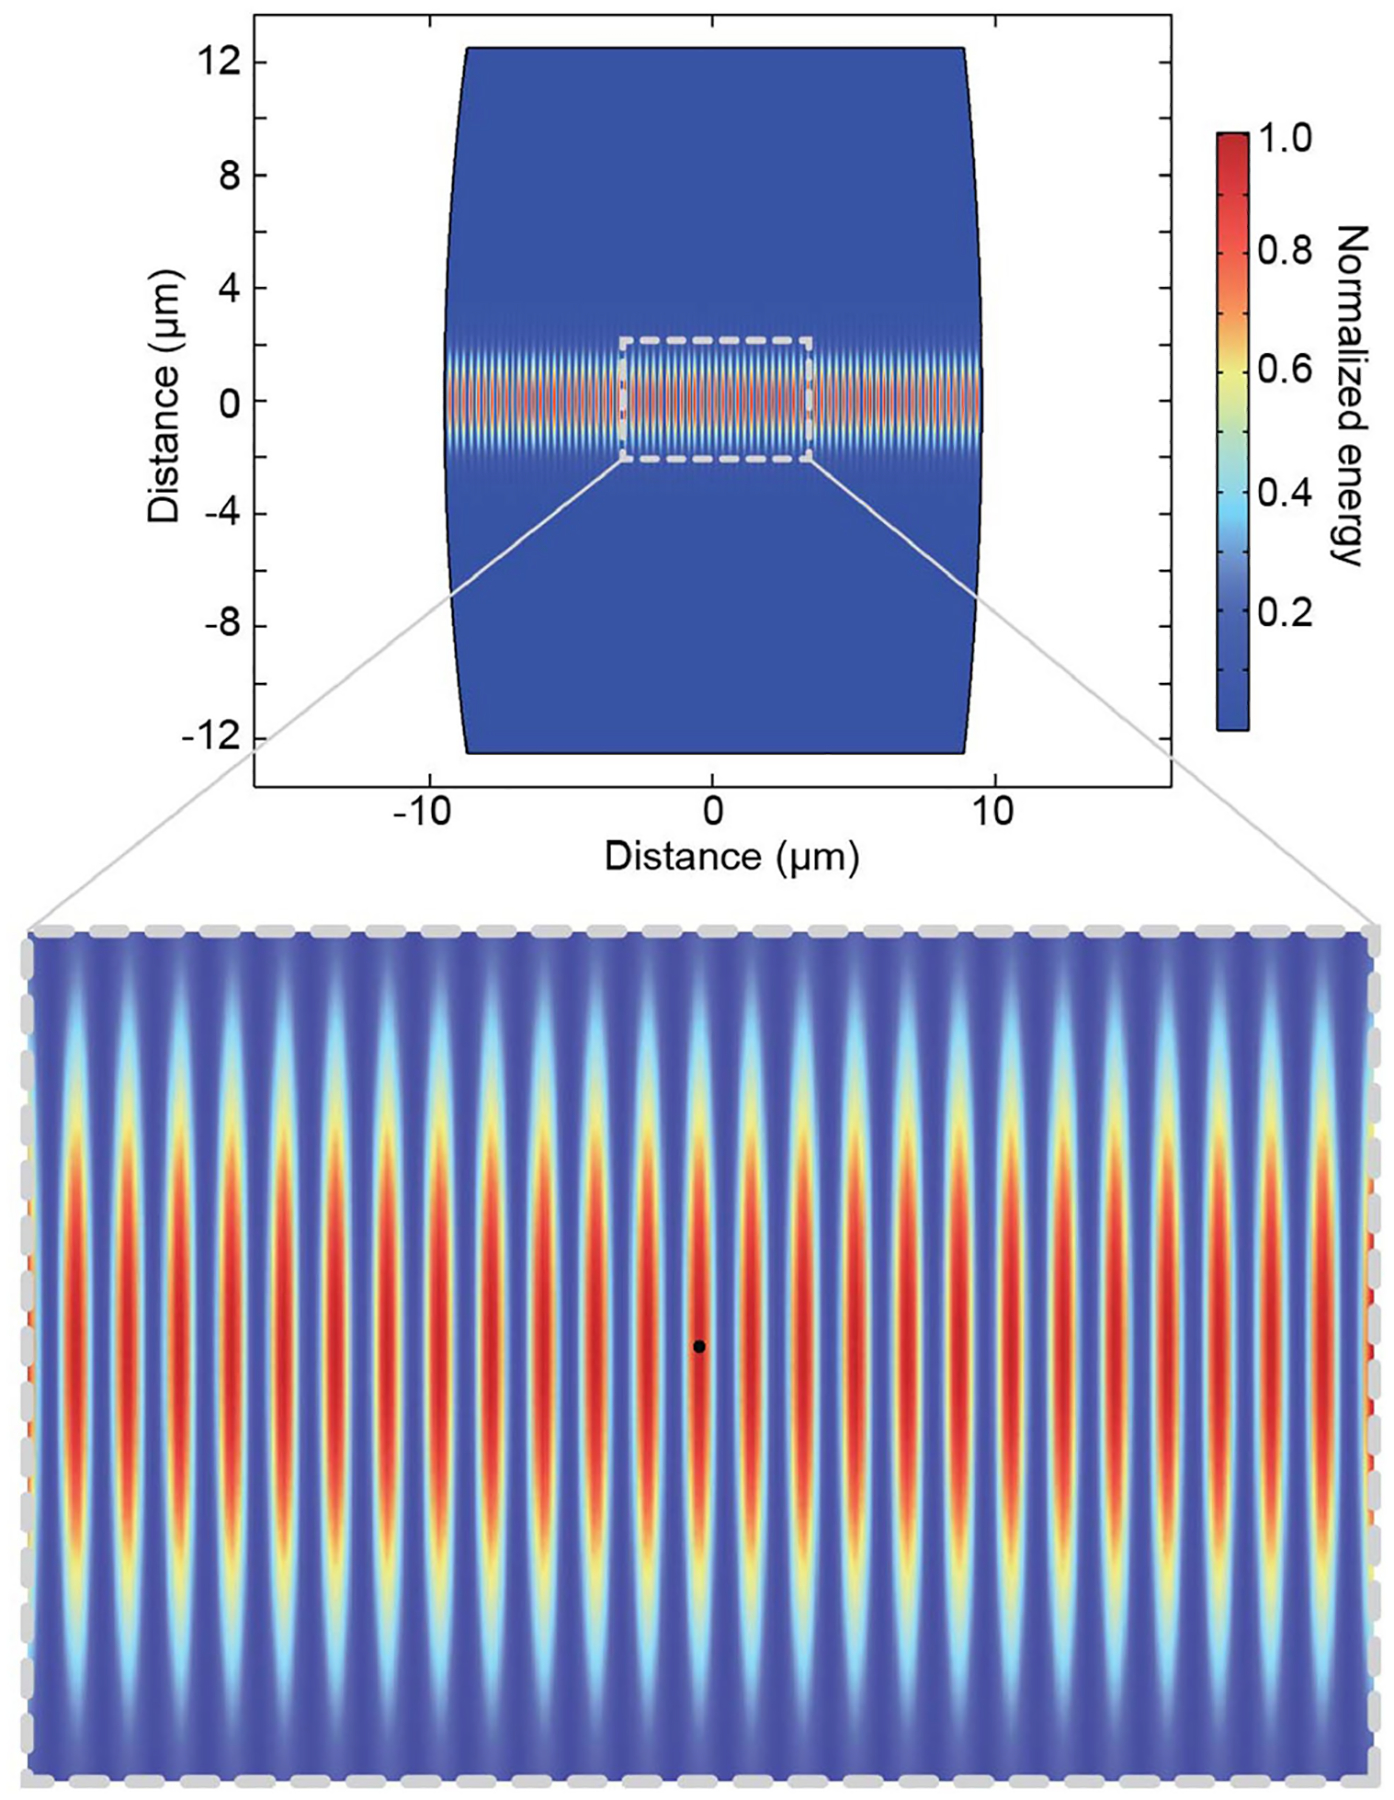
Simulated cavity mode given the mirror properties of cavity one (Supplementary Table 5) showing the normalized square of the electric field, which is proportional to the total energy stored in the cavity. The zoomed image shows a particle localized in an antinode in the centre of the optical mode.
Extended Data Fig. 9 |. Photothermally distorted cavity resonance scan.
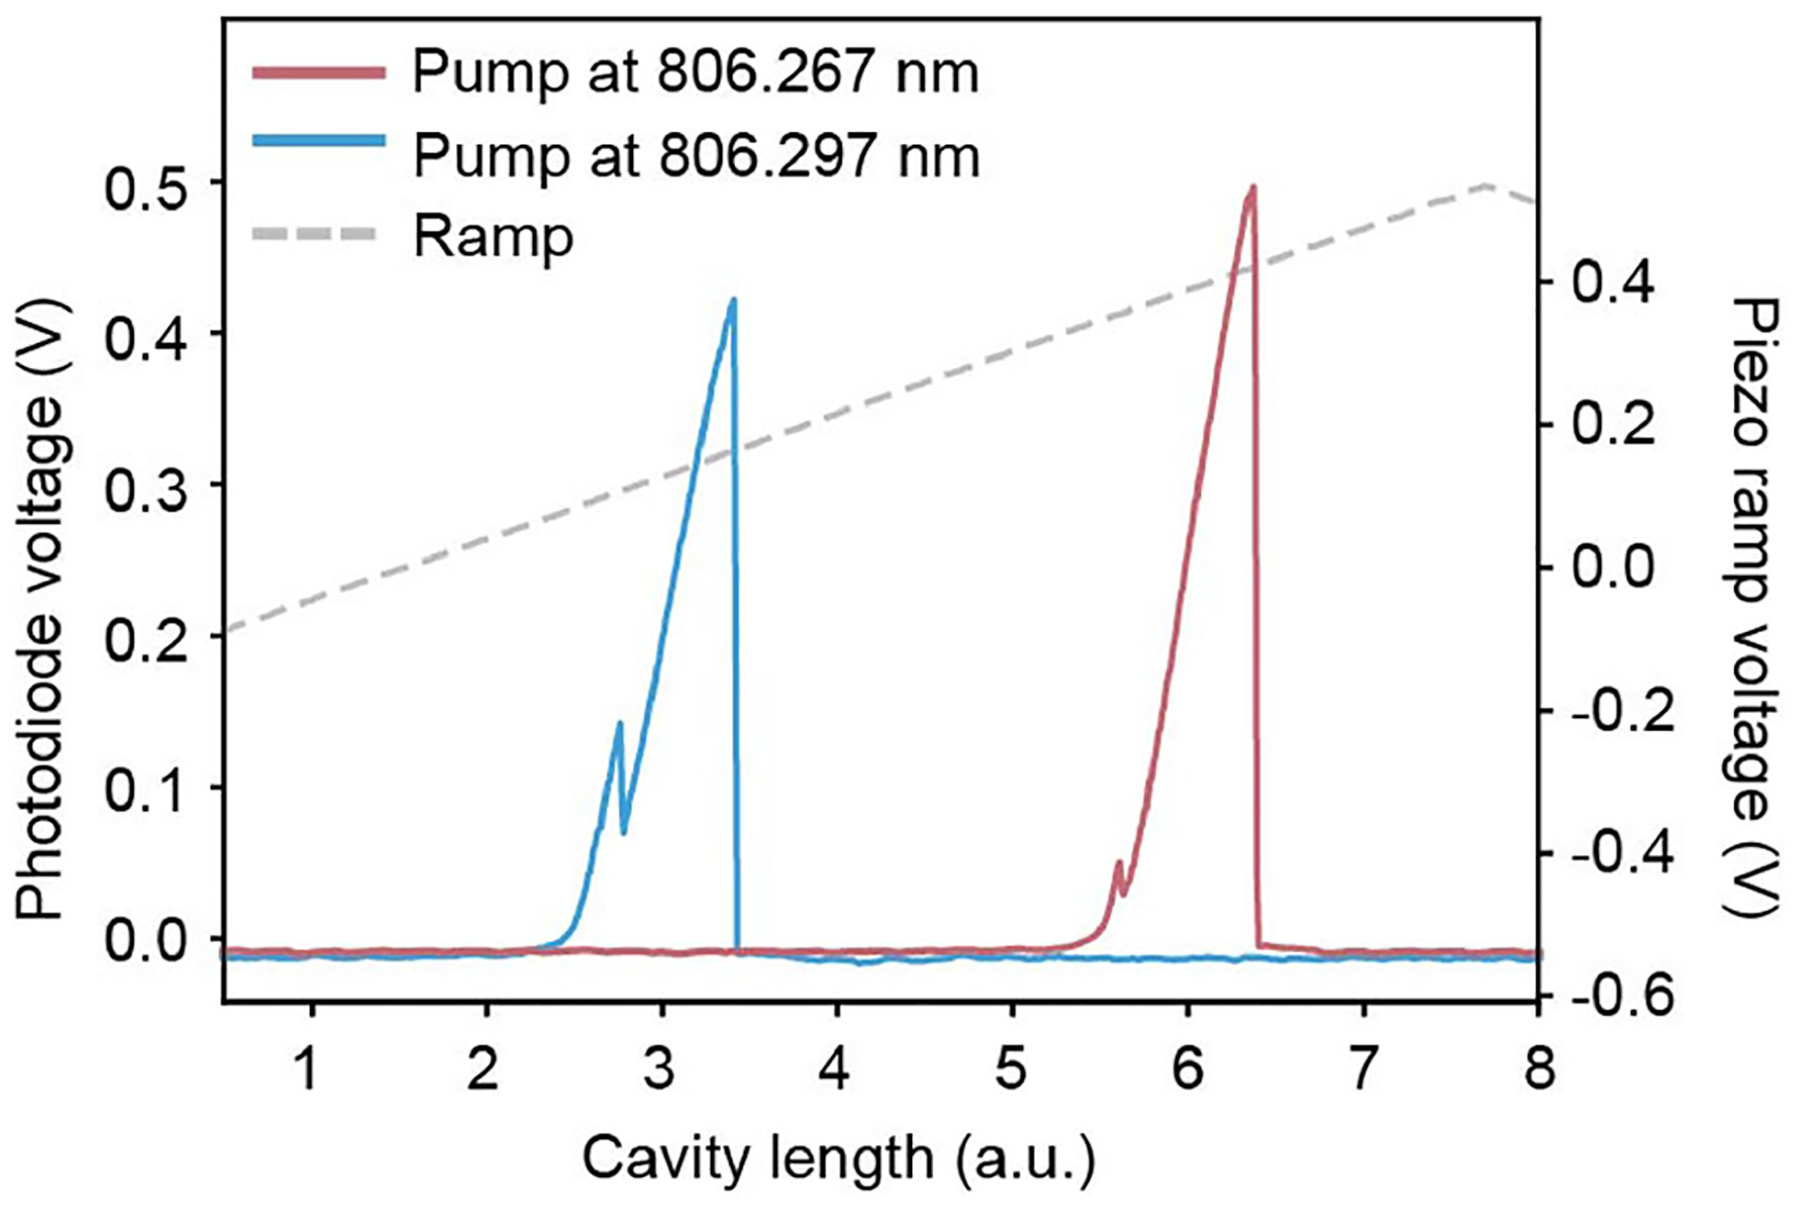
Photothermal-induced broadening of the transmitted cavity resonance in water, collected under cavity-length tuning at two different pump wavelengths. The blueshift in pump wavelength shifts the resonance position to lower piezo ramp voltage, demonstrating that increased piezo ramp voltage corresponds to increased cavity length. Furthermore, the direction of the broadening is indicative of a negative thermo-optic coefficient of the medium, as is expected in water. Despite the low circulating power (5.5 mW), photothermal broadening was apparent and enabled the high sensitivity of this measurement. The smaller peaks originate from polarization splitting owing to the birefringence of the cavity mode. Data collected with cavity four.
Extended Data Fig. 10 |. Replication of single-molecule-like signals by pulsing the length of the microcavity.
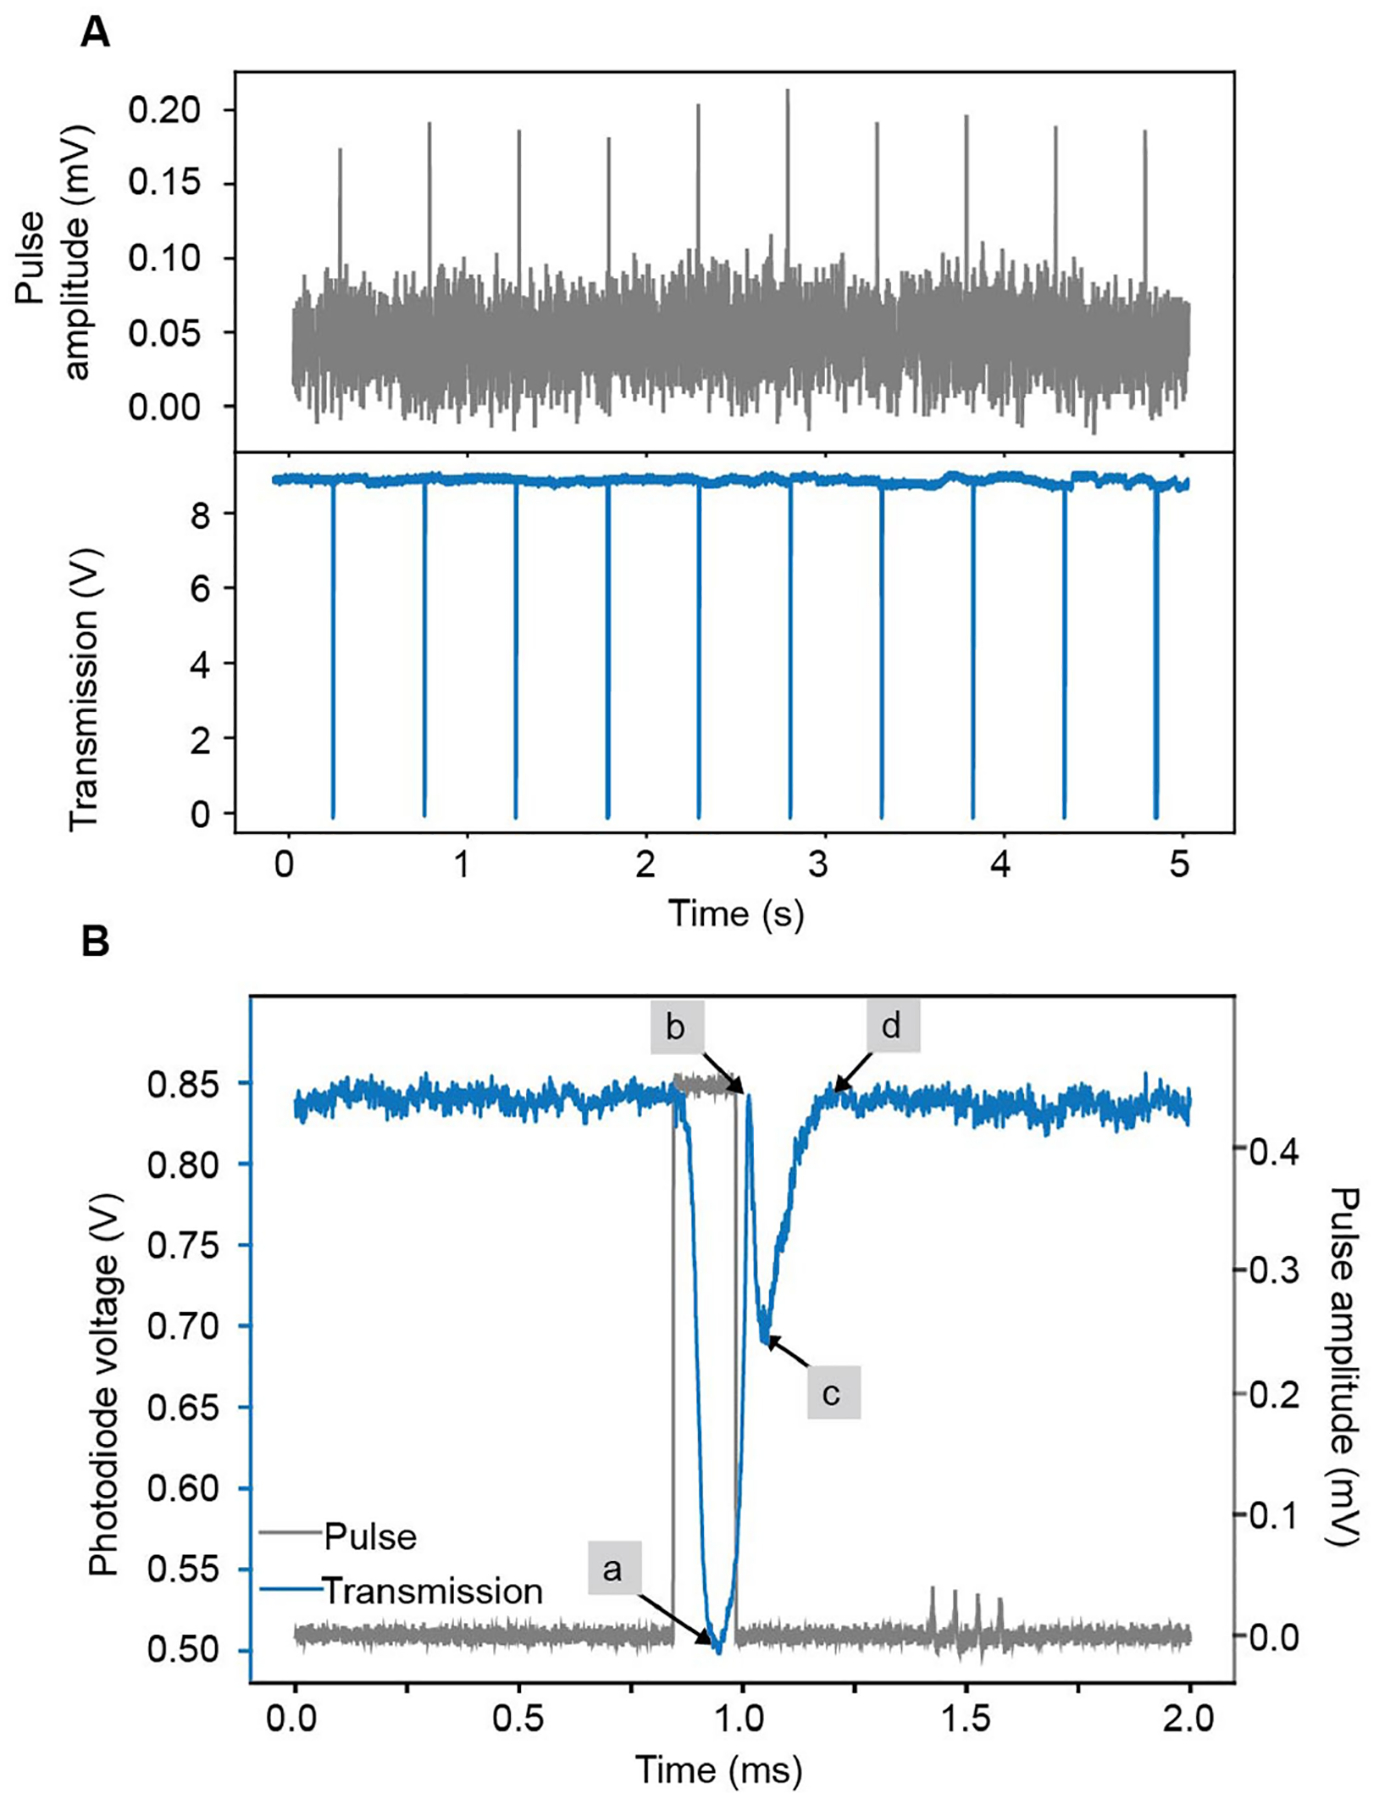
a, Transmitted intensity of locked cavity showing perturbations to the lock when voltage pulses are applied to the piezos at a frequency of 1 Hz. b, The applied pulse, input power and cavity-locking parameters can be optimized to mimic signals induced by diffusing molecules. a–d, The step-up voltage (grey) produced a steep reduction of the locked transmission signal as a result of the photothermal effect (a). This was followed by a brief recovery to the locked state by the PI feedback loop (b), followed by a second descent of the transmission signal as the step-up voltage of the pulse shifts the cavity in the opposite direction (c). Finally, the PI control recovers the locked state (d). Data collected with cavity four.
Supplementary Material
Acknowledgements
This work was mainly financed by the National Institutes of Health (NIH, R01GM136981), with resonator construction supported by the Q-NEXT Quantum Center, a U.S. Department of Energy (DOE), Office of Science, National Quantum Information Science Research Centers, under award number DE-FOA-0002253. Further instrumentation development was supported by the Center for Molecular Quantum Transduction, an Energy Frontier Research Center financed by DOE, Office of Science, BES under award DE-SC0021314, the National Science Foundation (NSF) Quantum Leap Challenge Institute for Hybrid Quantum Architectures and Networks, award no. 2016136, and by Schmidt Futures. L.-M.N. was partially financed by the European Union’s Horizon 2020 research and innovation programme under the Marie Skłodowska-Curie grant agreement no. 886216. E.R.C. was financed by the NIH (MH061876 and NS097362). H.P. was financed by the Deutsche Forschungsgemeinschaft (DFG, German Research Foundation) under Germany’s Excellence Strategy – Cluster of Excellence Matter and Light for Quantum Computing (ML4Q) EXC 2004/1 – 390534769. We thank D. Hunger, T. Northup and S. Vanga for help in initial fibre mirror and microcavity fabrication, X. Huang and B. Cullinane for conversations on diffusion, M. Saffman for early conversations on fibre microcavities and B. Thompson and T. Drier for instrumentation development.
Footnotes
Online content
Any methods, additional references, Nature Portfolio reporting summaries, source data, extended data, supplementary information, acknowledgements, peer review information; details of author contributions and competing interests; and statements of data and code availability are available at https://doi.org/10.1038/s41586-024-07370-8.
Competing interests R.H.G. and L.-M.N. have submitted PCT/US2023/079347, ‘Methods and systems for detecting diffusing single particles’, filed 10 November 2023.
Supplementary information The online version contains supplementary material available at https://doi.org/10.1038/s41586-024-07370-8.
Data availability
A representative sample of the raw data supporting the findings of this work is openly available on figshare at https://figshare.com/articles/dataset/Label-free_detection_and_profiling_of_individual_solution-phase_molecules-_sample_raw_data/25463965, under the title ‘Label-free detection and profiling of individual solution-phase molecules- sample raw data’, with the following ref. 64. The data are associated with Figs. 2 and 3. The sample data are in .csv format and available without restrictions.
References
- 1.Moerner WE Single-molecule spectroscopy, imaging, and photocontrol: foundations for super-resolution microscopy (Nobel Lecture). Angew. Chem. Int. Edn 54, 8067–8093 (2015). [DOI] [PubMed] [Google Scholar]
- 2.Li N et al. Photonic resonator interferometric scattering microscopy. Nat. Commun 12, 1744 (2021). [DOI] [PMC free article] [PubMed] [Google Scholar]
- 3.Mauranyapin NP, Madsen LS, Taylor MA, Waleed M & Bowen WP Evanescent single-molecule biosensing with quantum-limited precision. Nat. Photonics 11, 477–481 (2017). [Google Scholar]
- 4.Piliarik M & Sandoghdar V Direct optical sensing of single unlabelled proteins and super-resolution imaging of their binding sites. Nat. Commun 5, 4495 (2014). [DOI] [PubMed] [Google Scholar]
- 5.Ortega Arroyo J et al. Label-free, all-optical detection, imaging, and tracking of a single protein. Nano Lett. 14, 2065–2070 (2014). [DOI] [PMC free article] [PubMed] [Google Scholar]
- 6.Taylor RW & Sandoghdar V Interferometric scattering microscopy: seeing single nanoparticles and molecules via Rayleigh scattering. Nano Lett. 19, 4827–4835 (2019). [DOI] [PMC free article] [PubMed] [Google Scholar]
- 7.Young G et al. Quantitative mass imaging of single biological macromolecules. Science 360, 423–427 (2018). [DOI] [PMC free article] [PubMed] [Google Scholar]
- 8.Yu D et al. Whispering-gallery-mode sensors for biological and physical sensing. Nat. Rev. Methods Primers 1, 83 (2021). [Google Scholar]
- 9.Heylman KD et al. Optical microresonators for sensing and transduction: a materials perspective. Adv. Mater 29, 1700037 (2017). [DOI] [PubMed] [Google Scholar]
- 10.Zijlstra P, Paulo PMR & Orrit M Optical detection of single non-absorbing molecules using the surface plasmon resonance of a gold nanorod. Nat. Nanotechnol 7, 379–382 (2012). [DOI] [PubMed] [Google Scholar]
- 11.Baaske MD, Foreman MR & Vollmer F Single-molecule nucleic acid interactions monitored on a label-free microcavity biosensor platform. Nat. Nanotechnol 9, 933–939 (2014). [DOI] [PubMed] [Google Scholar]
- 12.Dantham VR et al. Label-free detection of single protein using a nanoplasmonic-photonic hybrid microcavity. Nano Lett. 13, 3347–3351 (2013). [DOI] [PubMed] [Google Scholar]
- 13.Yu W, Jiang WC, Lin Q & Lu T Cavity optomechanical spring sensing of single molecules. Nat. Commun 7, 12311 (2016). [DOI] [PMC free article] [PubMed] [Google Scholar]
- 14.Su J, Goldberg AF & Stoltz BM Label-free detection of single nanoparticles and biological molecules using microtoroid optical resonators. Light Sci. Appl 5, e16001 (2016). [DOI] [PMC free article] [PubMed] [Google Scholar]
- 15.Špačková B et al. Label-free nanofluidic scattering microscopy of size and mass of single diffusing molecules and nanoparticles. Nat. Methods 19, 751–758 (2022). [DOI] [PMC free article] [PubMed] [Google Scholar]
- 16.Baaske MD, Asgari N, Punj D & Orrit M Nanosecond time scale transient optoplasmonic detection of single proteins. Sci. Adv 8, 5576 (2022). [DOI] [PMC free article] [PubMed] [Google Scholar]
- 17.Wilson H & Wang Q ABEL-FRET: tether-free single-molecule FRET with hydrodynamic profiling. Nat. Methods 18, 816–820 (2021). [DOI] [PubMed] [Google Scholar]
- 18.Wang Q, Goldsmith RH, Jiang Y, Bockenhauer SD & Moerner WE Probing single biomolecules in solution using the anti-Brownian electrokinetic (ABEL) trap. Acc. Chem. Res 45, 1955–1964 (2012). [DOI] [PMC free article] [PubMed] [Google Scholar]
- 19.Vallance C, Trichet AAP, James D, Dolan PR & Smith JM Open-access microcavities for chemical sensing. Nanotechnology 27, 274003 (2016). [DOI] [PubMed] [Google Scholar]
- 20.Hunger D et al. A fiber Fabry–Perot cavity with high finesse. New J. Phys 12, 065038 (2010). [Google Scholar]
- 21.Kohler L, Mader M, Kern C, Wegener M & Hunger D Tracking Brownian motion in three dimensions and characterization of individual nanoparticles using a fiber-based high-finesse microcavity. Nat. Commun 12, 6385 (2021). [DOI] [PMC free article] [PubMed] [Google Scholar]
- 22.Carmon T, Yang L & Vahala KJ Dynamical thermal behavior and thermal self-stability of microcavities. Opt. Express 12, 4742–4750 (2004). [DOI] [PubMed] [Google Scholar]
- 23.Brachmann JFS, Kaupp H, Hänsch TW & Hunger D Photothermal effects in ultra-precisely stabilized tunable microcavities. Opt. Express 24, 21205–21215 (2016). [DOI] [PubMed] [Google Scholar]
- 24.Black ED An introduction to Pound–Drever–Hall laser frequency stabilization. Am. J. Phys 69, 79–87 (2001). [Google Scholar]
- 25.Moerner WE & Fromm DP Methods of single-molecule fluorescence spectroscopy and microscopy. Rev. Sci. Instrum 74, 3597–3619 (2003). [Google Scholar]
- 26.Riback JA et al. Commonly used FRET fluorophores promote collapse of an otherwise disordered protein. Proc. Natl Acad. Sci. USA 116, 8889–8894 (2019). [DOI] [PMC free article] [PubMed] [Google Scholar]
- 27.Zanetti-Domingues LC, Tynan CJ, Rolfe DJ, Clarke DT & Martin-Fernandez M Hydrophobic fluorescent probes introduce artifacts into single molecule tracking experiments due to non-specific binding. PLoS One 8, 74200 (2013). [DOI] [PMC free article] [PubMed] [Google Scholar]
- 28.Dietz MS, Wehrheim SS, Harwardt M-LIE, Niemann HH & Heilemann M Competitive binding study revealing the influence of fluorophore labels on biomolecular interactions. Nano Lett. 19, 8245–8249 (2019). [DOI] [PubMed] [Google Scholar]
- 29.Friedel M, Baumketner A & Shea J-E Effects of surface tethering on protein folding mechanisms. Proc. Natl Acad. Sci. USA 103, 8396–8401 (2006). [DOI] [PMC free article] [PubMed] [Google Scholar]
- 30.Wang Q & Moerner WE Single-molecule motions enable direct visualization of biomolecular interactions in solution. Nat. Methods 11, 555–558 (2014). [DOI] [PubMed] [Google Scholar]
- 31.Vahala KJ Optical microcavities. Nature 424, 839–846 (2003). [DOI] [PubMed] [Google Scholar]
- 32.Arnold S, Shopova SI & Holler S Whispering gallery mode bio-sensor for label-free detection of single molecules: thermo-optic vs. reactive mechanism. Opt. Express 18, 281–287 (2010). [DOI] [PubMed] [Google Scholar]
- 33.Zhu J et al. On-chip single nanoparticle detection and sizing by mode splitting in an ultrahigh-Q microresonator. Nat. Photonics 4, 46–49 (2010). [Google Scholar]
- 34.Foreman MR, Keng D, Treasurer E, Lopez JR & Arnold S Whispering gallery mode single nanoparticle detection and sizing: the validity of the dipole approximation. Opt. Lett 42, 963–966 (2017). [DOI] [PubMed] [Google Scholar]
- 35.Horak EH et al. Exploring electronic structure and order in polymers via single-particle microresonator spectroscopy. Nano Lett. 18, 1600–1607 (2018). [DOI] [PubMed] [Google Scholar]
- 36.Heylman KD et al. Optical microresonators as single-particle absorption spectrometers. Nat. Photonics 10, 788–795 (2016). [Google Scholar]
- 37.Hümmer T et al. Cavity-enhanced Raman microscopy of individual carbon nanotubes. Nat. Commun 7, 12155 (2016). [DOI] [PMC free article] [PubMed] [Google Scholar]
- 38.Hogan LT et al. Toward real-time monitoring and control of single nanoparticle properties with a microbubble resonator spectrometer. ACS Nano 13, 12743–12757 (2019). [DOI] [PMC free article] [PubMed] [Google Scholar]
- 39.Trichet AAP et al. Nanoparticle trapping and characterization using open microcavities. Nano Lett. 16, 6172–6177 (2016). [DOI] [PubMed] [Google Scholar]
- 40.Saavedra C, Pandey D, Alt W, Pfeifer H & Meschede D Tunable fiber Fabry-Perot cavities with high passive stability. Opt. Express 29, 974–982 (2021). [DOI] [PubMed] [Google Scholar]
- 41.Haustein E & Schwille P Fluorescence correlation spectroscopy: novel variations of an established technique. Annu. Rev. Biophys. Biomol. Struct 36, 151–169 (2007). [DOI] [PubMed] [Google Scholar]
- 42.Barnes JA, Gagliardi G & Loock H-P Absolute absorption cross-section measurement of a submonolayer film on a silica microresonator. Optica 1, 75–83 (2014). [Google Scholar]
- 43.Baaske MD & Vollmer F Optical observation of single atomic ions interacting with plasmonic nanorods in aqueous solution. Nat. Photonics 10, 733–739 (2016). [Google Scholar]
- 44.Dahmardeh M, Mirzaalian Dastjerdi H, Mazal H, Köstler H & Sandoghdar V Self-supervised machine learning pushes the sensitivity limit in label-free detection of single proteins below 10 kDa. Nat. Methods 20, 442–447 (2023). [DOI] [PMC free article] [PubMed] [Google Scholar]
- 45.Torres T & Levitus M Measuring conformational dynamics: a new FCS-FRET approach. J. Phys. Chem. B 111, 7392–7400 (2007). [DOI] [PubMed] [Google Scholar]
- 46.Kandula HN, Jee A-Y & Granick S Robustness of FCS (fluorescence correlation spectroscopy) with quenchers present. J. Phys. Chem. A 123, 10184–10189 (2019). [DOI] [PubMed] [Google Scholar]
- 47.Kratz K, Hellweg T & Eimer W Structural changes in PNIPAM microgel particles as seen by SANS, DLS, and EM techniques. Polymer 42, 6631–6639 (2001). [Google Scholar]
- 48.Hoo CM, Starostin N, West P & Mecartney ML A comparison of atomic force microscopy (AFM) and dynamic light scattering (DLS) methods to characterize nanoparticle size distributions. J. Nanopart. Res 10, 89–96 (2008). [Google Scholar]
- 49.Stetefeld J, McKenna SA & Patel TR Dynamic light scattering: a practical guide and applications in biomedical sciences. Biophys. Rev 8, 409–427 (2016). [DOI] [PMC free article] [PubMed] [Google Scholar]
- 50.Roy P, Claude JB, Tiwari S, Barulin A & Wenger J Ultraviolet nanophotonics enables autofluorescence correlation spectroscopy on label-free proteins with a single tryptophan. Nano Lett. 23, 497–504 (2023). [DOI] [PubMed] [Google Scholar]
- 51.Jameson DM & Ross JA Fluorescence polarization/anisotropy in diagnostics and imaging. Chem. Rev 110, 2685–2708 (2010). [DOI] [PMC free article] [PubMed] [Google Scholar]
- 52.Bohren CF & Huffman DR Absorption and Scattering of Light by Small Particles (Wiley, 1998). [Google Scholar]
- 53.Lukić B et al. Motion of a colloidal particle in an optical trap. Phys. Rev. E 76, 011112 (2007). [DOI] [PubMed] [Google Scholar]
- 54.Gaiduk A, Yorulmaz M, Ruijgrok PV & Orrit M Room-temperature detection of a single molecule’s absorption by photothermal contrast. Science 330, 353–356 (2010). [DOI] [PubMed] [Google Scholar]
- 55.Brandstätter B et al. Integrated fiber-mirror ion trap for strong ion-cavity coupling. Rev. Sci. Instrum 84, 123104 (2013). [DOI] [PubMed] [Google Scholar]
- 56.Gallego J et al. High-finesse fiber Fabry–Perot cavities: stabilization and mode matching analysis. Appl. Phys. B 122, 47 (2016). [Google Scholar]
- 57.Demtröder W Laser Spectroscopy 1: Basic Principles (Springer, 2014). [Google Scholar]
- 58.van Oss CJ et al. Macroscopic-scale surface properties of streptavidin and their influence on aspecific interactions between streptavidin and dissolved biopolymers. Colloids Surf. B Biointerfaces 30, 25–36 (2003). [Google Scholar]
- 59.Krishnamurthy VM et al. Carbonic anhydrase as a model for biophysical and physical-organic studies of proteins and protein–ligand binding. Chem. Rev 108, 946–1051 (2008). [DOI] [PMC free article] [PubMed] [Google Scholar]
- 60.Agić D, Brkić H, Kazazić S, Tomić A & Abramić M Aprotinin interacts with substrate-binding site of human dipeptidyl peptidase III. J. Biomol. Struct. Dyn 37, 3596–3606 (2019). [DOI] [PubMed] [Google Scholar]
- 61.Evan GI, Lewis GK, Ramsay G & Michael Bishop J Isolation of monoclonal antibodies specific for human c-myc proto-oncogene product. Mol. Cell. Biol 5, 3610–3616 (1985). [DOI] [PMC free article] [PubMed] [Google Scholar]
- 62.Hilvo M et al. Biochemical characterization of CA IX, one of the most active carbonic anhydrase isozymes. J. Biol. Chem 283, 27799–27809 (2008). [DOI] [PubMed] [Google Scholar]
- 63.Novais S, Ferreira MS & Pinto JL Determination of thermo-optic coefficient of ethanol-water mixtures with optical fiber tip sensor. Opt. Fiber Technol 45, 276–279 (2018). [Google Scholar]
- 64.Needham L-M et al. Label-free detection and profiling of individual solution-phase molecules—sample raw data. figshare 10.6084/m9.figshare.25463965.v1 (2024). [DOI] [PMC free article] [PubMed] [Google Scholar]
Associated Data
This section collects any data citations, data availability statements, or supplementary materials included in this article.
Supplementary Materials
Data Availability Statement
A representative sample of the raw data supporting the findings of this work is openly available on figshare at https://figshare.com/articles/dataset/Label-free_detection_and_profiling_of_individual_solution-phase_molecules-_sample_raw_data/25463965, under the title ‘Label-free detection and profiling of individual solution-phase molecules- sample raw data’, with the following ref. 64. The data are associated with Figs. 2 and 3. The sample data are in .csv format and available without restrictions.


