Abstract
Although chimeric antigen receptor (CAR) T cells are effective against B-lineage malignancies, post-CAR relapse is common, and efficacy in other tumors is limited. These challenges may be addressed through rational manipulations to control CAR T cell function. Here we examine the impact of cognate T cell antigen experience on subsequent CD8+ CAR T cell activity. Prior antigen encounter resulted in superior effector function against leukemia expressing low target antigen density at the expense of reduced proliferative capacity and susceptibility to dysfunction at limiting CAR doses. Distinctive temporal transcriptomic and epigenetic profiles in naive-derived and memory-derived CAR T cells identified RUNX family transcription factors as potential targets to augment the function of naive-derived CD8+ CAR T cells. RUNX2 overexpression enhanced antitumor efficacy of mouse CAR T cells, dependent on prior cell state, and heightened human CAR T cell functions. Our data demonstrate that prior antigen experience of CAR T cells determines functional attributes and amenability to transcription factor-mediated functional enhancement.
Subject terms: Epigenetics in immune cells, Cancer immunotherapy, CD8-positive T cells
Here, Fry and colleagues examine the impact of antigen experience on subsequent CD8+ CAR T cell activity during the antileukemia response and show that RUNX2 overexpression enhances antitumor activity of these cells.
Main
Adoptive transfer of T cells expressing chimeric antigen receptors (CARs) is highly successful for treating B-lineage hematologic malignancies. However, many individuals do not achieve complete remission or they relapse. Poor response results from cancer cell resistance or suboptimal CAR T cell function1. Thus, further studies into the immunobiology of engineered T cells are warranted. CAR T cell products are generated from a heterogeneous population of peripheral blood T cells that varies between individuals, likely impacting CAR T cell product attributes2. Although tracking cell fate through the manufacturing process and into people is challenging, previous reports found differential function of CAR T cell products generated from memory versus naive T cells sorted by surface markers that do not always represent differentiation state accurately2–4. Emerging studies demonstrate that phenotypic, transcriptomic and epigenomic attributes of the CAR product can influence outcomes5.
During acute infections, naive T cells are activated through the T cell antigen receptor (TCR) by antigen-presenting cells displaying cognate antigen and co-stimulatory ligands and subsequently enter a highly regulated differentiation trajectory. A phase of rapid expansion and differentiation into effector cells is followed by contraction and formation of long-lived memory cells that rapidly respond to future exposures. However, if the pathogen is not cleared, antigen-specific T cell populations receive recurring antigen stimulation, differentiating down a trajectory characterized by progressive dysfunction. A growing body of work demonstrates that these differentiation trajectories (and resulting T cell functional characteristics) are controlled epigenetically in traditional T cell responses to viral infections and tumors. These programs are defined by progressive changes to the epigenome, associated with DNA methylation and histone modifications driven by a variety of transcription factors (TFs) and modulated by antigen receptor signaling6. These molecular modifications alter chromatin accessibility and transcriptional profiles, which characterize differentiation state and functional capacity. Epigenetic modulation of T cells via TCR stimulation has a well-established role in impacting the differentiation programs and functional capacity of T cells7. Emerging data highlight the importance of epigenetic remodeling in CAR T cell responses5.
Here, we examine the biology of CD8+ CAR (CAR8) T cells that differ as to whether cognate TCR antigen has been encountered before transduction with a CAR. We hypothesize that (1) T cells exhibit functional characteristics after CAR transduction that are impacted by prior TCR antigen experience, (2) the functional characteristics of CAR8 T cells derived from naive or memory cells are the result of epigenetic attributes maintained through CAR transduction and reinfusion, and (3) TF modulation to enhance CAR8 T cell function may depend on epigenetic and transcriptomic contexts determined by prior antigen experience. Prior work has shown dose-dependent effects in the antitumor responses of adoptively transferred T cells2, and CAR T cells have been shown to elicit poor responses to tumors with low antigen density1,8–10. Using limiting target antigen density or limiting T cell dose as stressors, we show that prior T cell antigen experience influences in vitro and in vivo functional characteristics of CAR8 T cells. Genomic comparisons of CAR8 T cells stratified by prior antigen experience status reveals differential chromatin accessibility and transcriptional programming. We pinpoint divergent RUNX2 activity as a potential driver of differential function and show that overexpression of RUNX2 enhances the antileukemia response and mediates exhaustion resistance in CAR T cells in a manner dependent on prior T cell antigen experience. We demonstrate that RUNX2 overexpression increases gene expression and chromatin accessibility at effector-associated loci without compromising self-renewal loci and show functional impacts of RUNX2 overexpression in human CAR T cells, signifying therapeutic translation potential.
Results
Antigen experience directs in vitro functions of CAR8 T cells
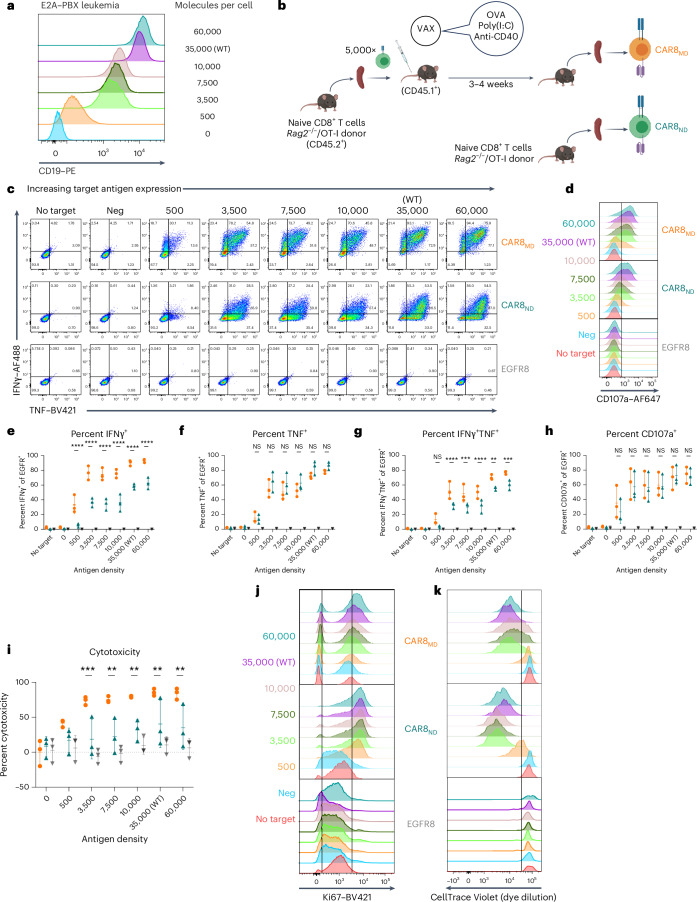
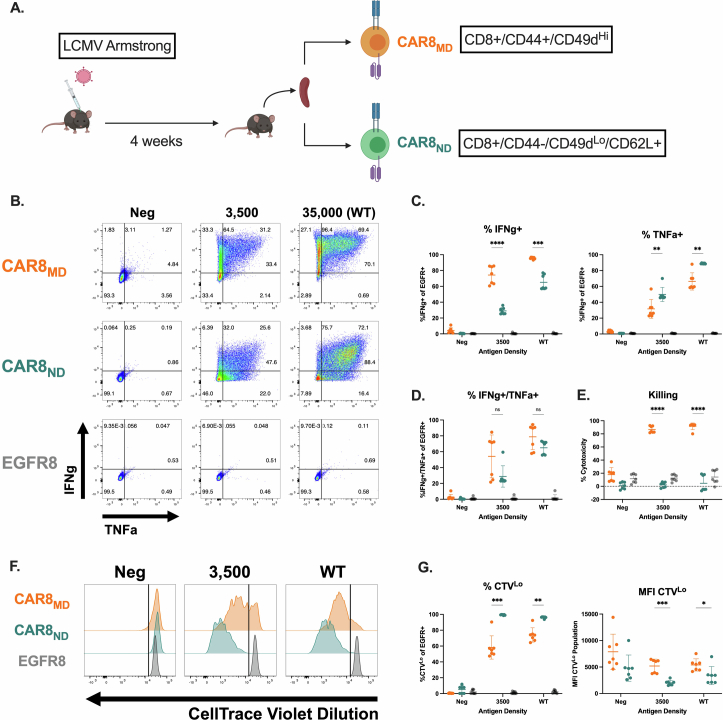
Memory T cells demonstrate superior antigen sensitivity compared to naive T cells in some contexts11,12. We therefore hypothesized that CAR T cells derived from a memory T cell population that experienced TCR antigen before CAR transduction would exhibit enhanced antigen sensitivity compared to naive-derived CAR T cells. Anti-mouse CD19 CAR T cells containing CD28 and CD3ζ13(Extended Data Fig. 1a) were generated; CAR expression correlated strongly with epidermal growth factor receptor (EGFR) reporter expression, allowing the use of EGFR for tracking CAR+ cells (Extended Data Fig. 1b). CAR T cells were used to target mouse leukemia driven by the E2A–PBX1 fusion protein (E2A–PBX)14–16 that was modified to express different CD19 densities (Fig. 1a and Extended Data Fig. 1c). Memory OT-I T cells, generated using a well-characterized ovalbumin vaccination model17–19(Fig. 1b), were used to produce memory-derived CAR8 (CAR8MD) T cells for comparison to naive-derived CD8+ OT-I CAR T (CAR8ND) T cells. As no difference was seen between memory and naive-derived CAR–EGFR+ T cells (Extended Data Fig. 1d), naive-derived cells were used as the control (EGFR8) in subsequent experiments. CAR8ND T cells expanded more during manufacturing (Extended Data Fig. 1e). Following CAR stimulation, a greater proportion of CAR8MD T cells produced both tumor necrosis factor (TNF) and interferon-γ (IFNγ), and despite no differences in degranulation (as measured by CD107a), CAR8MD T cells were also more cytotoxic, which was most pronounced in response to low target antigen (Fig. 1c–h and Extended Data Fig. 1f–h). Interestingly, although the proportion of IFNγ+ cells was greater in CAR8MD T cells, the proportion of TNF+ cells was slightly increased in CAR8ND T cells, suggesting a predisposition toward either IFNγ or TNF (Fig. 1e,f). To compare polyclonal antigen-experienced and naive T cells more analogous to human CAR T cells, we infected C57BL/6 mice with lymphocytic choriomeningitis virus Armstrong (LCMV-Armstrong) and transduced memory (CD8+CD44+CD49dhi) and naive (CD8+CD44–CD49dloCD62L+) T cell populations sorted by fluorescence-activated cell sorting (FACS) with CAR (Extended Data Fig. 2a). LCMV-CAR8MD T cells demonstrated superior effector function, and LCMV-CAR8ND T cells demonstrated superior proliferative capacity (Extended Data Fig. 2b–g). Collectively, data from multiple model systems, including after vaccination and infection, suggest that CAR8MD T cells underperform CAR8ND T cells in measures of poststimulation proliferative capacity across antigen densities, paralleling reduced expansion during manufacturing (Fig. 1j,k and Extended Data Figs. 1e,i,j and 2b–g). Thus, CD8+ T cell antigen experience before transduction with a CAR promotes effector functions at the expense of proliferative capacity.
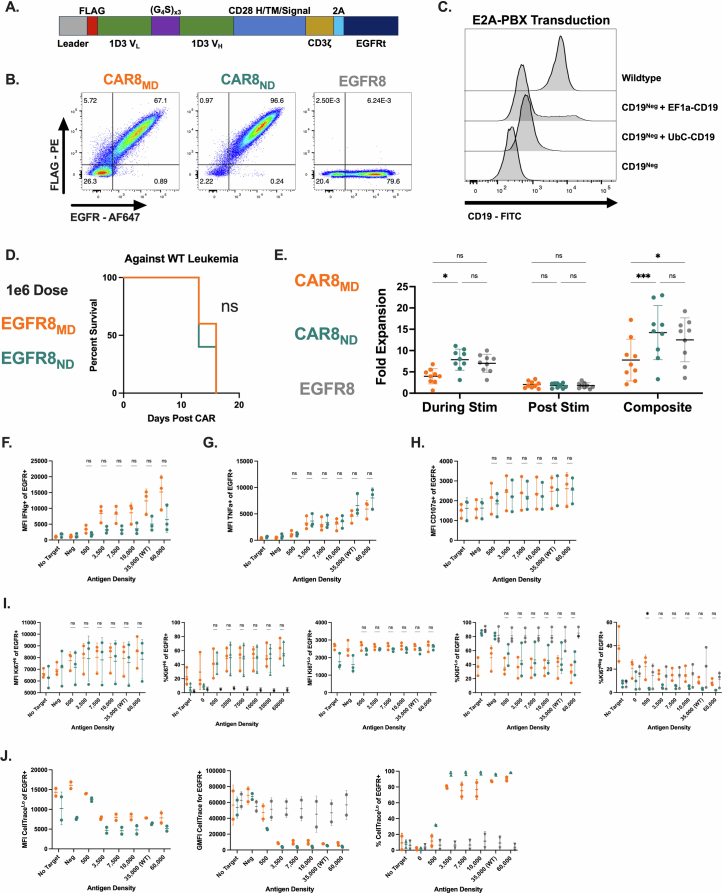
Extended Data Fig. 1. E2A-PBX/mCD19 antigen density model and murine anti-CD19 CAR T cells, and additional comparisons of in vitro data.
Data are related to Fig. 1. 1A: Schematic of the anti-mouse CD19 CAR contained in pMSCV backbone. 1B: Coexpression of CAR and EGFR on murine CAR T cells. 1C: Engineering of murine leukemia with lentiviral vectors containing hUbC or hEF1a promoters driving the CD19 transgene. 1D: Survival of mice after treatment with 1e6 EGFR+ (EGFR8, non-CAR expressing) naïve or memory-derived CD8 + T cells. 1E: Fold expansion of T cells during transduction protocol: During Stim (while on anti-CD3/CD28 beads, from day 1 to day 4), Post Stim (continued expansion from day 4 to day 6 after removing anti-CD3/CD28 beads), and Composite (total fold expansion from day 1 to day 6). (Exact p values, left to right: 0.0477, 0.0005, 0.0127). 1 F: Mean fluorescence intensity of IFNγ+ cell population. 1 G: Mean fluorescence intensity of TNF+ cell population. 1H: Mean fluorescence intensity of CD107a+ population. 1I: Statistical comparisons of Ki67Neg (% Ki67Neg of EGFR+), Ki67Lo (%Ki67Lo of EGFR+, MFI Ki67Lo of EGFR+) and Ki67Hi (%Ki67Hi of EGFR+, MFI Ki67Hi of EGFR+) populations. (Exact p value, far right plot: 0.0105) 1 J: Statistical comparisons of CellTraceLo (% CellTraceLo of EGFR+, MFI CellTraceLo of EGFR+) and total EGFR+ cells (GFMI CellTrace). Data in S1B is representative transduction data from 1 experiment. Data in 1 C is from 1 transduction experiment before single cell cloning. Data in S1D is from 1 experiment, total n = 5 mice per group. Data in S1E is compiled and quantified from 9 independent experiments. All in vitro assays in S1F-S1J were performed with n = 3 technical replicates per experiment, which were averaged and compiled to perform quantifications and statistics on n = 3 independent experiments (CellTrace data compiled from two independent experiments). Statistical comparisons were performed using two-way ANOVA with two-sided Tukey’s multiple comparisons test for comparisons of 3 groups or multiple two-sided t-tests or Welch t-tests with Holm-Sidak correction for multiple comparisons of 2 groups. Statistical comparisons are performed between CAR8MD and CAR8ND groups when not otherwise specified. Data represent mean +/− SD. * p < 0.05, ** p < 0.01, *** p < 0.001, **** p < 0.0001.
Fig. 1. Antigen experience history directs multiple aspects of in vitro function of mouse CAR8 T cells.
a, E2A–PBX mouse leukemia was engineered to knockout Cd19, followed by reintroduction of CD19 at different levels to generate a range of antigen density clones. b, Schematic showing the vaccine model for generating memory CD8+ OT-I T cells. In total, 5 × 10³ OT-I T cells were transferred into congenically distinct hosts that were concurrently vaccinated with antigen and adjuvants. Three to 5 weeks later, CAR T cells were manufactured from memory OT-I T cells (CAR8MD T cells) or naive OT-I T cells (CAR8ND T cells). c, Intracellular cytokine staining of IFNγ and TNF after 6 h of coculture. d, Degranulation as measured by CD107a expression after 4 h of coculture. e–g, Quantification of cytokine data shown as the percentage of positive cells for IFNγ (e), TNF (f) and IFNγ and TNF (g); exact P values from left to right: P < 0.0001 (e) and P < 0.0001, P = 0.0001, P < 0.0001, P = 0.0019 and P = 0.0005 (g); NS, not significant. h, Quantification of CD107a data shown as the percentage of positive cells. i, Percent cytotoxicity, quantified after 6 h of coculture; exact P values from left to right: P = 0.0008, P = 0.0014, P = 0.0040, P = 0.0062 and P = 0.0030. j, Representative data for cell cycle entry as measured by Ki67 staining after 18 h of coculture. k, Representative data for proliferation as measured by dilution of CellTrace Violet dye after a 72-h coculture assay. All in vitro assays were performed with n = 3 technical replicates per experiment, which were averaged and compiled to perform quantifications and statistics on n = 3 independent experiments (CellTrace data are representative of two independent experiments). Flow plots show representative data from a single experiment. Statistical comparisons were performed using two-way analysis of variance (ANOVA) with Tukey’s multiple comparisons test. Statistical comparisons were performed between CAR8MD and CAR8ND T cell groups. Data are shown as mean ± s.d.; *P < 0.05, **P < 0.01, ***P < 0.001 and ****P < 0.0001. The schematic in b was generated using BioRender.com.
Extended Data Fig. 2. Polyclonal pathogen-elicited CAR8MD function similarly to vaccine-elicited CAR8MD.
Data are related to Fig. 1. 2A: Schematic: LCMV model for generating memory CD8 + T cells. C57BL/6 hosts were infected with LCMV-Armstrong. 4 weeks later, naïve and memory CD8 + T cells were sorted from the same hosts using the indicated FACS markers and used to manufacture CAR8MD, memory-derived or CAR8ND, naïve-derived or EGFR8 control cells. 2B: Intracellular cytokine staining of IFNγ and TNF after 6 hour co-culture assay. 2 C: Quantifications of proportions of IFNγ+ and TNF+ cells of EGFR+ population. (Exact p values, left to right: <0.0001, 0.0003, 0.0077, 0.0015) 2D: Quantifications of proportions of IFNγ+/TNF+ double positive cells of EGFR+ population. 2E: % cytotoxicity, quantified after 6 hour co-culture assay. (Exact p values, left to right: <0.0001, <0.0001). 2 F: Proliferation as measured by dilution of CellTrace Violet dye after 72 hour co-culture assay. 2 G: Quantification of CellTrace assay, proportions of CTVLo cells, MFI of CTVLo cells. (Exact p values, left to right: 0.0007, 0.0014, 0.0002, 0.0480). All assays are a total of n = 7 pooled technical replicates from 3 independent experiments. Statistical comparisons were performed using two-way ANOVA with two-sided Tukey’s multiple comparisons test for comparisons of 3 groups or multiple two-sided t-tests or Welch t-tests with Holm-Sidak correction for multiple comparisons of 2 groups. Data represent mean +/− SD. Statistical comparisons are performed between CAR8MD and CAR8ND groups. * p < 0.05, ** p < 0.01, *** p < 0.001, **** p < 0.0001. Schematic in A generated using BioRender.com.
CAR8MD T cells are effector like and clear antigen-low leukemia
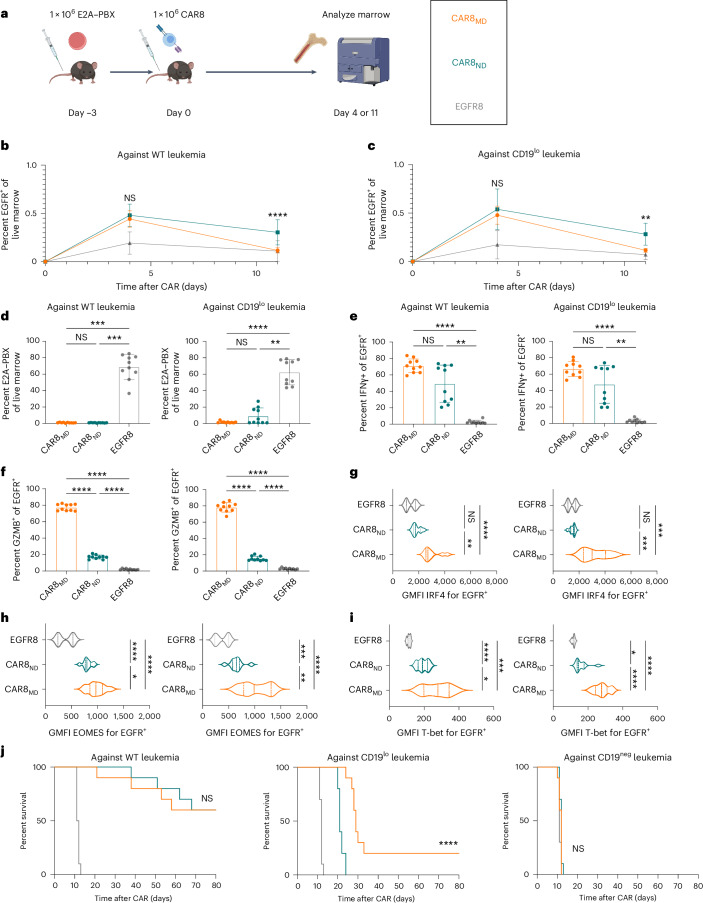
Given opposing functional in vitro profiles of naive- and memory-derived T cells, we next compared the two populations in vivo. Mice were engrafted with wild-type (WT; 35,000 antigens per cell) or CD19lo (10,000 antigens per cell) leukemia, followed 3 days later by the introduction of 1 × 10⁶ CAR T cells (Fig. 2a). The CD19lo clone was chosen based on differential in vitro responses (Fig. 1), and, although higher than the antigen density reported for CAR relapses post-CD22 CAR9, it is consistent with dropoff in CAR sensitivity8,10. RAG1-deficient hosts enabled CAR T cell expansion without irradiation and limited CAR T cell exposure to CD19 density on leukemia rather than on endogenous B cells. There was no difference in CAR T cells in the marrow at peak expansion (day 4), but CAR8ND T cells were increased in mice bearing WT or CD19lo leukemia after contraction (day 11; Fig. 2b,c and Extended Data Fig. 3a,b). Despite no significant difference in CD19lo leukemia at day 11, four of ten mice treated with CAR8ND T cells had >15% leukemia in the marrow, whereas all ten mice treated with CAR8MD T cells had <5% (Fig. 2d). We next tested whether enhanced clearance of CD19lo leukemia was associated with superior cytotoxic capacity of CAR8MD T cells observed in vitro. Following ex vivo restimulation of CAR8 T cells, IFNγ production was variable, but CAR8MD T cells demonstrated markedly greater granzyme B (GZMB) production (Fig. 2e,f). The CAR8MD T cell group had significantly higher proportions of cells bearing phenotypes of short-lived effector cells (interleukin-7 receptor-α–KLRG1+ (IL-7Rα–KLRG1+)) and effector memory precursors (CD27+CD62L–), lower central memory precursors (CD27+CD62L+) and no change in memory precursor effector cells (IL-7Rα+KLRG1–; Extended Data Fig. 4a–e). Early expression of effector-associated TFs (IRF4, T-bet and EOMES) was greater in CAR8MD T cells (Fig. 2g–i). Finally, although there was no survival difference after treatment of mice bearing WT leukemia with CAR8MD versus CAR8ND T cells, mice bearing CD19lo leukemia treated with CAR8MD T cells showed a significant survival benefit, with 20% of mice surviving (Fig. 2j). In summary, CAR8MD T cells mediate superior clearance of CD19lo leukemia relative to CAR8ND T cells and maintain superior effector profiles.
Fig. 2. CAR8MD T cells exhibit enhanced cytotoxicity and clearance of CD19lo leukemia in vivo.
a, Schematic showing the timeline for in vivo experiments. Rag1−/− mice were injected with 1 × 10⁶ E2A–PBX1 leukemia cells on day −3, followed by 1 × 10⁶ OT-I CD8+EGFR+ T cells from the indicated T cell conditions on day 0. Bone marrow was analyzed by flow cytometry on day +4 or +11. The isolated T cell populations were CAR8MD T cells, CAR8ND T cells or EGFR control T cells (EGFR8). Leukemia populations were CD19neg, CD19lo (10,000 antigens per cell) or WT (35,000 antigens per cell). b,c, Early T cell expansion (day +4) or persistence (day +11) after infusion of transduced T cells against WT leukemia (b), exact P value of <0.0001, and CD19lo leukemia (c), exact P value of 0.0011. Transduced T cell populations were measured by coexpression of CD8a+TCRβ+EGFR+. d, Clearance of WT and CD19lo leukemia at day +11 after CAR infusion. E2A–PBX leukemia was measured by coexpression of B220+CD22+; exact P values from left to right: P = 0.0004, P = 0.0004, P < 0.0001 and P = 0.0019. e,f, Intracellular cytokine staining of IFNγ (e; exact P values from left to right: P < 0.0001, P = 0.0045, P < 0.0001 and P = 0.0034) or GZMB (f; exact P values: all P < 0.0001) in CAR T cells from whole bone marrow restimulated ex vivo with leukemia. Data are shown as mean ± s.d.; GMFI, geometric mean fluorescence intensity. g–i, Intranuclear TF staining of IRF4 (g; exact P values from bottom to top in each plot from left to right: P < 0.0001, P = 0.0038, P = 0.0005 and P = 0.0004), EOMES (h; exact P values from bottom to top in each plot from left to right: P = 0.0334, P < 0.0001, P < 0.0001, P = 0.0051, P < 0.0001 and P = 0.0006) or T-bet (i; exact P values from bottom to top in each plot from left to right: P = 0.0265, P = 0.0003, P < 0.0001, P < 0.0001, P < 0.0001 and P = 0.0139) on CAR+ T cells from mice bearing the indicated leukemia at day +4 after CAR infusion. Violin plot data represent median with quartiles. j, Survival of mice after treatment with 1 × 10⁶ EGFR+ CAR or control T cells. Data are from two independent pooled experiments with a total of n = 10 mice per condition (exact P value of <0.0001). Statistical comparisons were performed using a two-way ANOVA with Tukey’s multiple comparisons test (b and c), one-way Brown–Forsythe and Welch ANOVA with Dunnett’s T3 multiple comparisons test or Kruskal–Wallis nonparametric test with Dunn’s multiple comparisons test (d–i) or log-rank (Mantel–Cox) test for survival comparisons. Statistical comparisons were performed between CAR8MD and CAR8ND T cell groups when not otherwise specified; *P < 0.05, **P < 0.01, ***P < 0.001 and ****P < 0.0001. The schematic in a was generated using BioRender.com.
Extended Data Fig. 3. CAR T cells and leukemia counts per tibia for in vivo data.
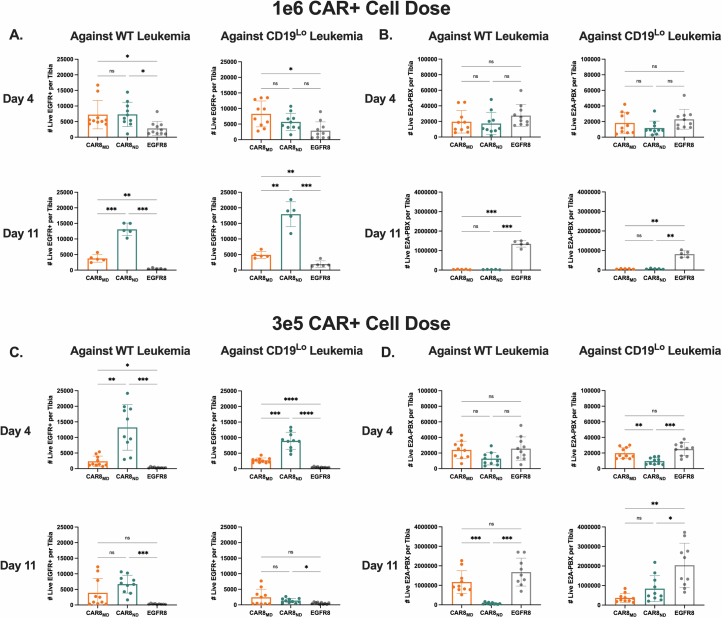
Data are related to Figs. 2 and 3. All analyses in this figure are done on the same experiments described in Figs. 2 and 3. Counts data was generated by flushing a single tibia and using total tibia counts and cytometer proportions data to calculate CAR and leukemia cell counts per tibia. 3 A: CAR counts for 1e6 CAR dose experiments. (Exact p values, left to right then top to bottom: 0.0472, 0.0203, 0.0111, 0.0001, 0.0099, 0.0004, 0.0111). 3B: Leukemia counts for 1e6 CAR dose experiments. (Exact p values, left to right then top to bottom: 0.0002, 0.0002, 0.0014, 0.0014). 3 C: CAR counts for 3e5 CAR dose experiments. (Exact p values, left to right then top to bottom: 0.0029, 0.0127, 0.0010, 0.0001, <0.0001, <0.0001, 0.0002, 0.0184). 3D: Leukemia counts for 3e5 CAR dose experiments. (Exact p values, left to right then top to bottom: 0.0041, 0.0005, 0.0006, 0.0004, 0.0029, 0.0321). Data are from 2 pooled, independent experiments with n = 10 mice per condition, apart from the 1e6 CAR dose day 11 timepoint, which contains data from one experiment with n = 5 mice per condition. Statistical comparisons were performed using one-way Brown-Forsythe and Welch ANOVA with two-sided Dunnett’s T3 multiple comparisons test. Data represent mean +/− SD. * p < 0.05, ** p < 0.01, *** p < 0.001, **** p < 0.0001.
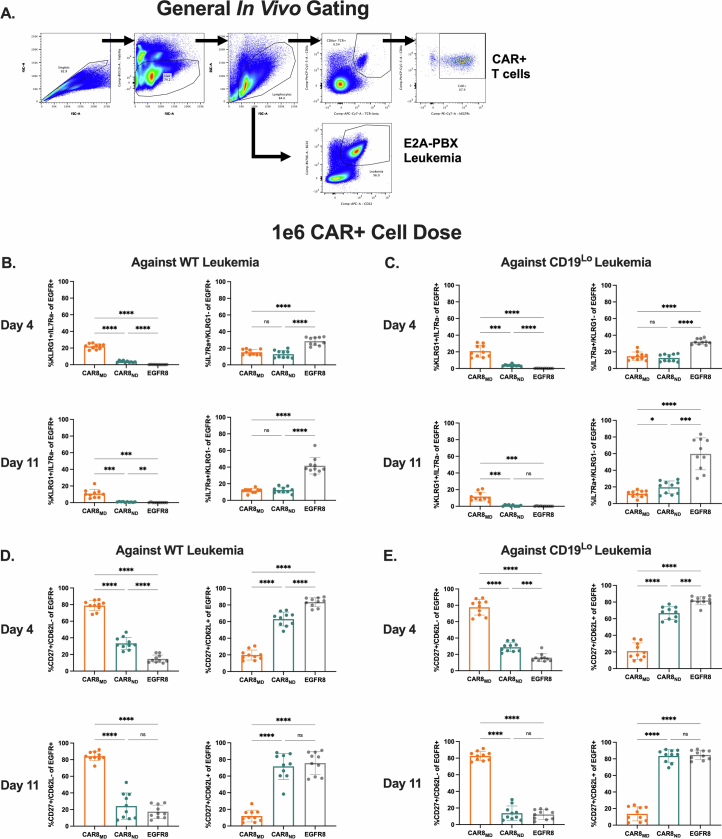
Extended Data Fig. 4. Basic characterization of in vivo model and additional in vivo effector/memory phenotyping at high CAR dose.
Data are related to Fig. 2. 4A: Basic flow cytometry gating strategy for in vivo experiments. Total events were gated by Singlets, Live Cells and then Lymphocytes, followed by CD8a+/TCRbeta+/EGFR+ cells for CAR8/EGFR8 or B220+/CD22+ cells for E2A-PBX. S4C-F are from experiments with the 1e6 EGFR+ cell dose. 4B: Proportions of CAR8 with the short-lived effector cell (SLEC, IL7Ra-/KLRG1+) or memory precursor effector cell (MPEC, IL7Ra+/KLRG1-) phenotypes at the indicated timepoint against WT leukemia. (Exact p values, left to right then top to bottom: <0.0001, <0.0001, <0.0001, <0.0001, <0.0001, 0.0005, 0.0003, 0.0016, <0.0001, <0.0001). 4C: Proportions of CAR8 with the short-lived effector cell (SLEC, IL7Ra-/KLRG1+) or memory precursor effector cell (MPEC, IL7Ra+/KLRG1-) phenotypes at the indicated timepoint against CD19Lo leukemia. (Exact p values, left to right then top to bottom: 0.0001, <0.0001, <0.0001, <0.0001, <0.0001, 0.0004, 0.0002, 0.0363, <0.0001, 0.0001). 4D: Proportions of CAR8 with the effector memory precursor (EMP, CD27+/CD62L-) or central memory precursor (CMP, CD27+/CD62L+) phenotypes at the indicated timepoint against WT leukemia. (Exact p values: All <0.0001). 4E: Proportions of CAR8 with the effector memory precursor (EMP, CD27+/CD62L-) or central memory precursor (CMP, CD27+/CD62L+) phenotypes at the indicated timepoint against CD19Lo leukemia. (Exact p values, left to right then top to bottom: <0.0001, <0.0001, 0.0001, <0.0001, <0.0001, 0.0003, <0.0001, <0.0001, <0.0001, <0.0001). Data in S4B-E are from 2 pooled, independent experiments with n = 10 mice per condition. Statistical comparisons were performed using one-way Brown-Forsythe and Welch ANOVA with two-sided Dunnett’s T3 multiple comparisons test. Data represent mean +/− SD. * p < 0.05, ** p < 0.01, *** p < 0.001, **** p < 0.0001.
CAR8ND T cells are proliferative and more functional at low doses
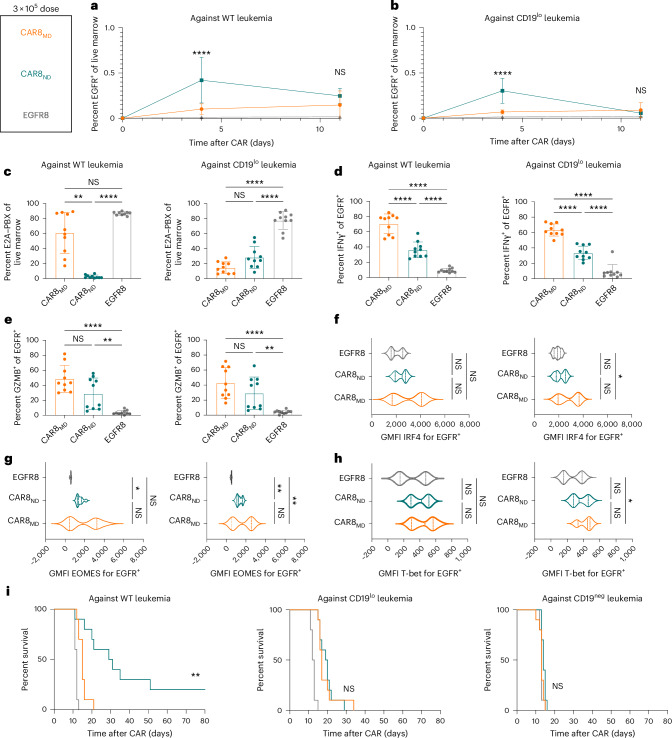
We hypothesized that the benefit of the superior proliferative capacity of CAR8ND T cells would emerge at a lower CAR+ cell dose (3 × 10⁵). As anticipated, CAR8ND T cells expanded to significantly higher numbers by day 4 regardless of leukemia antigen density, mirroring in vitro proliferation (Fig. 3a,b and Extended Data Figs. 1i,j and 3c), and mediated enhanced clearance and survival in mice bearing WT leukemia (Fig. 3c,i and Extended Data Fig. 3d). Ex vivo IFNγ production was greater in CAR8MD T cells, with no difference in GZMB production or expression of IRF4, T-bet or EOMES (Fig. 3d–h). CAR8MD T cells again demonstrated significantly higher proportions of short-lived effector cells at day 4 but no difference by day 11 or in memory precursor effector cells (Extended Data Fig. 5a,b). Effector memory precursor and central memory precursor differences mimicked high-dose experiments but were less pronounced, suggesting that CAR8ND T cells became more ‘effector like’ following greater proliferative drive (Extended Data Fig. 5c,d), consistent with prior reports20,21. However, net effects did not result in survival benefit against CD19lo leukemia (Fig. 3i). Finally, we predicted that at lower cell doses, T cell dysfunction could emerge. Indeed, more CAR8MD T cells expressed exhaustion-associated markers against WT leukemia, with failure of CAR8MD T cells to control leukemia (Extended Data Fig. 5e,f,i,j). Interestingly, we found that CD19lo leukemia drove similar exhaustion phenotypes in both CAR8 T cell populations, demonstrating that even chronic exposure to low-density antigens can drive dysfunction (Extended Data Fig. 5g,h,k,l). These findings highlight the proliferative capacity and dysfunction resistance afforded by CAR8ND T cells at limiting cell doses.
Fig. 3. CAR8ND T cells exhibit enhanced expansion capacity and clearance of WT leukemia in vivo.
Rag1−/− mice were injected with 1 × 10⁶ E2A–PBX1 leukemia cells on day −3, followed by 3 × 10⁵ OT-I CD8+EGFR+ T cells from the indicated T cell conditions on day 0. Bone marrow was analyzed by flow cytometry on day +4 or +11. The T cell populations isolated were CAR8MD T cells, CAR8ND T cells or EGFR control T cells (EGFR8). a,b, Early T cell expansion (day +4) or persistence (day +11) after infusion of transduced T cells against WT leukemia (a; exact P value of <0.0001) and CD19lo leukemia (b; exact P value of <0.0001). Transduced T cell populations were measured by coexpression of CD8a+TCRβ+EGFR+. c, Clearance of WT and CD19lo leukemia at day +11 after CAR infusion. E2A–PBX cells were measured by coexpression of B220+CD22+; exact P values from left to right: P = 0.0042, P < 0.0001, P < 0.0001 and P < 0.0001. d,e, Intracellular cytokine staining of IFNγ (d; exact P values: all <0.0001) or GZMB (e; exact P values from left to right: P < 0.0001, P = 0.0063, P < 0.0001 and P = 0.0034) in CAR T cells from whole bone marrow restimulated ex vivo with leukemia. Data are shown as mean ± s.d. f–h, Intranuclear TF staining of IRF4 (f; exact P value of 0.0287), EOMES (g; exact P values from left to right: P = 0.0133, P = 0.0058 and P = 0.0017) or T-bet (h; exact P value of 0.0150) on CAR+ T cells from mice bearing the indicated leukemia at day +4 after CAR infusion. Violin plot data represent median values with quartiles. i, Survival of mice after treatment with 1 × 10⁶ EGFR+ CAR or control T cells. Data are from two independent pooled experiments, with a total of n = 10 mice per condition; exact P value of 0.0012. Statistical comparisons were performed using a two-way ANOVA with Tukey’s multiple comparisons test (a and b), one-way Brown–Forsythe and Welch ANOVA with Dunnett’s T3 multiple comparisons test or Kruskal–Wallis nonparametric test with Dunn’s multiple comparisons test (c–h) or log-rank (Mantel–Cox) test for survival comparisons. Statistical comparisons were performed between CAR8MD and CAR8ND T cell groups when not otherwise specified; *P < 0.05, **P < 0.01, ***P < 0.001 and ****P < 0.0001.
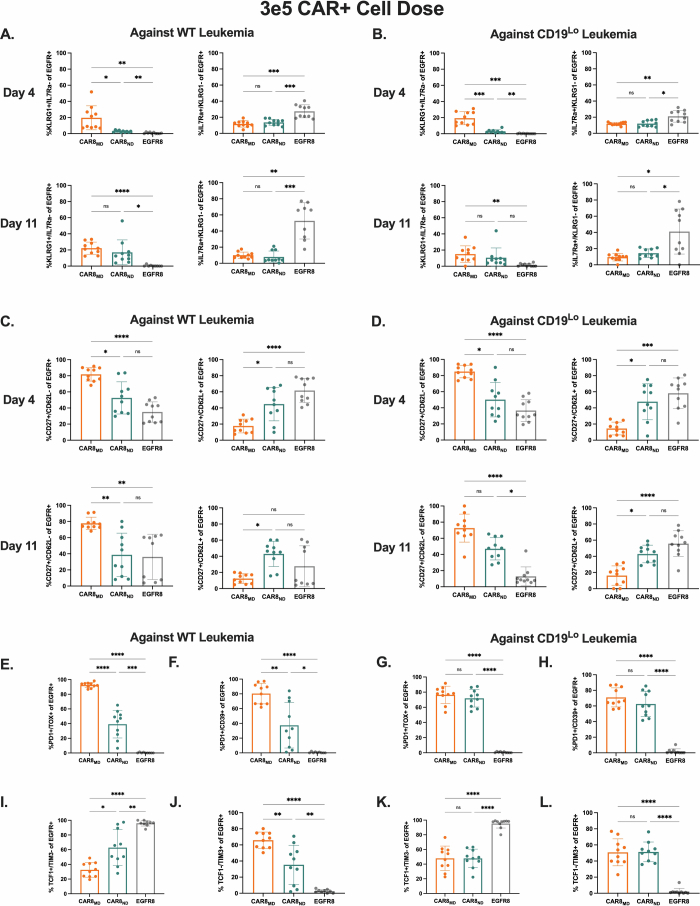
Extended Data Fig. 5. Additional in vivo effector/memory and exhaustion phenotyping at low CAR dose.
Data are related to Fig. 3. All data in this figure are from experiments with the 3e5 EGFR+ cell dose. 5A: Proportions of CAR8 with the short-lived effector cell (SLEC, IL7Ra-/KLRG1+) or memory precursor effector cell (MPEC, IL7Ra+/KLRG1-) phenotypes at the indicated timepoint against WT leukemia. (Exact p values, left to right then top to bottom: 0.0171, 0.0087, 0.0012, 0.0003, 0.0009, <0.0001, 0.0221, 0.0014, 0.0006). 5B: Proportions of CAR8 with the short-lived effector cell (SLEC, IL7Ra-/KLRG1+) or memory precursor effector cell (MPEC, IL7Ra+/KLRG1-) phenotypes at the indicated timepoint against CD19Lo leukemia. (Exact p values, left to right then top to bottom: 0.0003, 0.0001, 0.0084, 0.0081, 0.0103, 0.0057, 0.0154, 0.0389). 5C: Proportions of CAR8 with the effector memory precursor (EMP, CD27+/CD62L-) or central memory precursor (CMP, CD27+/CD62L+) phenotypes at the indicated timepoint against WT leukemia. (Exact p values, left to right then top to bottom: 0.0287, <0.0001, 0.0320, <0.0001, 0.0053, 0.0010, 0.0116). 5D: Proportions of CAR8 with the effector memory precursor (EMP, CD27+/CD62L-) or central memory precursor (CMP, CD27+/CD62L+) phenotypes at the indicated timepoint against CD19Lo leukemia. (Exact p values, left to right then top to bottom: 0.0133, <0.0001, 0.0156, 0.0005, <0.0001, 0.0309, 0.0128, <0.0001). Figures S4E-L display proportions of CAR8 with the indicated phenotype at 11 days post-CAR injection against either WT (left, E,F,I,J) or CD19Lo (right, G,H,K,L) leukemia. 5E & G: PD1+/TOX+ (Exact p values, left to right: <0.0001, <0.0001, 0.0003, <0.0001, <0.0001). 5 F & H: PD1+/CD39+ (Exact p values, left to right: 0.0042, <0.0001, 0.0122, <0.0001, <0.0001). 5I & K: TCF1+/TIM3- (Exact p values, left to right: 0.0101, <0.0001, 0.0063, <0.0001, <0.0001). 5 J & L: TCF1-/TIM3+. (Exact p values, left to right: 0.0092, <0.0001, 0.0061, <0.0001, <0.0001). Data are from 2 pooled, independent experiments with n = 10 mice per condition. Statistical comparisons were performed using one-way Brown-Forsythe and Welch ANOVA with two-sided Dunnett’s T3 multiple comparisons test or Kruskal-Wallis nonparametric test with two-sided Dunn’s multiple comparisons test. Data represent mean +/− SD. * p < 0.05, ** p < 0.01, *** p < 0.001, **** p < 0.0001.
CAR8 T cell chromatin accessibility is dictated by prior cell state
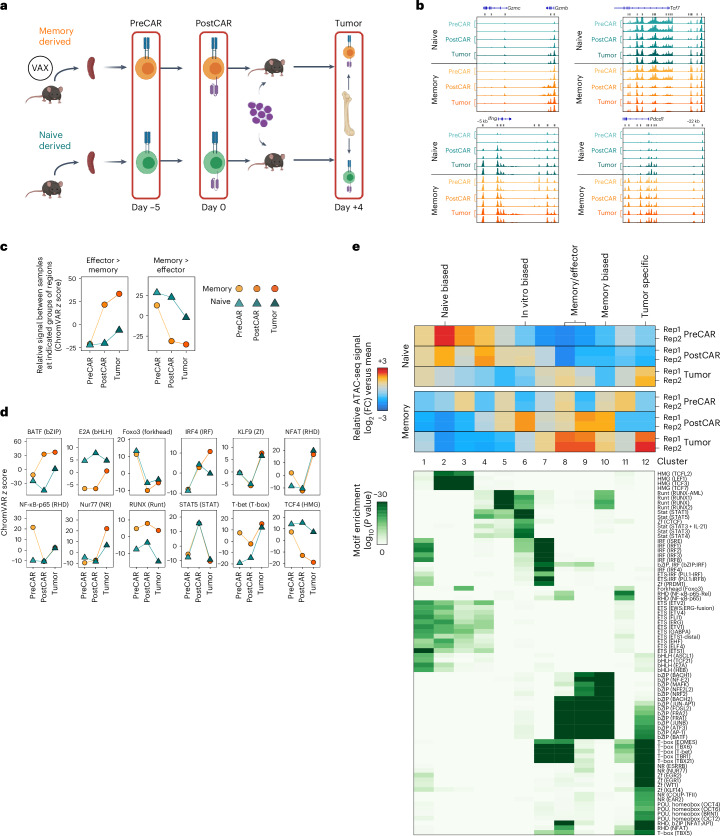
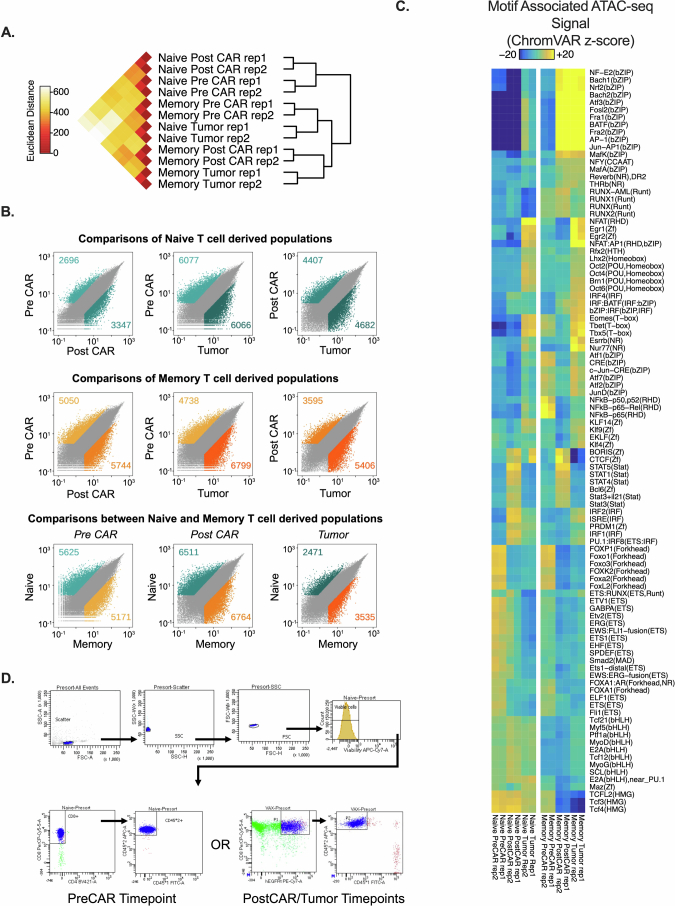
We predicted that functional traits established before manufacturing were a product of distinct epigenetic profiles. To test this, we performed bulk assay for transposase-accessible chromatin with sequencing (ATAC-seq) on naive and memory-derived cells at the following three time points: ex vivo before CAR transduction (day −5, ‘PreCAR’), in vitro after CAR transduction (day 0, ‘PostCAR’) and after reinfusion into leukemia-bearing mice (day 4, ‘Tumor’; Fig. 4a). Experimental replicates showed tight concordance of chromatin accessibility at each condition and time point (Extended Data Fig. 6a). Broadly, the data showed several thousand differentially accessible regions between either cell type compared to itself across time points and between cell types at each time point (Extended Data Fig. 6b). Predictably, there was higher chromatin accessibility in CAR8MD T cells at effector/activation loci (Gzmb, Gzmc, Ifng and Pdcd1) and in CAR8ND T cells at the Tcf7 locus (Fig. 4b). We used ChromVAR22 to associate changes in chromatin accessibility with previous datasets and potential TF activities. Comparison to LCMV-Armstrong-elicited T cells23 showed that CAR8MD T cells acquired effector-associated chromatin changes during CAR generation that were maintained after transfer into tumor-bearing mice and had reduced memory-associated chromatin accessibility. Conversely, naive-derived cells maintained chromatin accessibility at memory-associated regions and had minimal effector skewing (Fig. 4c)23. To associate these changes with specific TF activities, we used ChromVAR to compare chromatin accessibility at regions containing DNA motifs for different TFs (Fig. 4d). Distinct patterns of motif-associated chromatin accessibility between conditions and across time points were found (Fig. 4e). bZIP and IRF family TF motifs became progressively enriched in memory cells, TCF family motifs became enriched in naive cells, and E2A family motifs progressively converged. Uniquely, RUNX family motifs were always more accessible in CAR8MD T cells (Fig. 4d,e and Extended Data Fig. 6c). Overall, these data show that epigenetic features imprinted in the starting CD8+ T cell population are maintained through CAR engineering.
Fig. 4. Prior antigen experience imprints unique temporal chromatin accessibility states in CAR8.
a, Schematic showing the layout for paired ATAC-seq/RNA-seq experiments. Memory-derived (vaccine (‘VAX’)-elicited T cells) or naive-derived CAR8 T cells were sorted at three sequential time points: ex vivo from donor mice before CAR transduction (PreCAR), in vitro after CAR transduction (PostCAR) and ex vivo after reinfusion into CD19lo leukemia-bearing Rag1−/− mice (Tumor). b, Chromatin accessibility at Gzmb, Gzmc, Ifng, Tcf7 and Pdcd1 gene loci for naive- and memory-derived T cells at each time point. c, ChromVAR deviation z scores between the indicated populations at differentially accessible regions between effector and memory T cells after LCMV-Armstrong infection23. Data are shown as mean of two biological replicates. d, Motif-associated ChromVAR deviation z scores between the indicated populations. Data are shown as the mean of two biological replicates. e, k-Means clustering of relative ATAC-seq signal at differentially accessible regions (top, data from two biological replicates are shown) and motif enrichment in each cluster versus all regions (bottom); FC, fold change. Motifs with a P value of less than 1 × 10–15 in at least one cluster are shown. Detailed statistical analyses are described in Methods. The schematic in a was generated using BioRender.com.
Extended Data Fig. 6. Additional analyses of ATAC-seq data.
Data are related to Fig. 4. All analyses in this figure are from the same timeline/experimental layout described in Fig. 4a. 6A: Inter-replicate Euclidian distance of voom-normalized ATAC-seq counts per peak between biological replicates. 6B: Pairwise comparisons of differentially accessible chromatin regions within conditions between different timepoints of the same condition, or between different conditions at each timepoint. Data points are mean of voom-normalized ATAC-seq counts per peak between biological replicates of each group. 6C: Heatmap of motif-associated ChromVAR deviation z-scores patterns of motif-associated ATAC-seq signal for indicated transcription factors. List comprises all significant differentially accessible comparisons. 6D: Representative gating for sorting of cells in sequencing experiments. Additional statistical analyses described in Methods section.
Prior antigen experience directs transcriptomic state
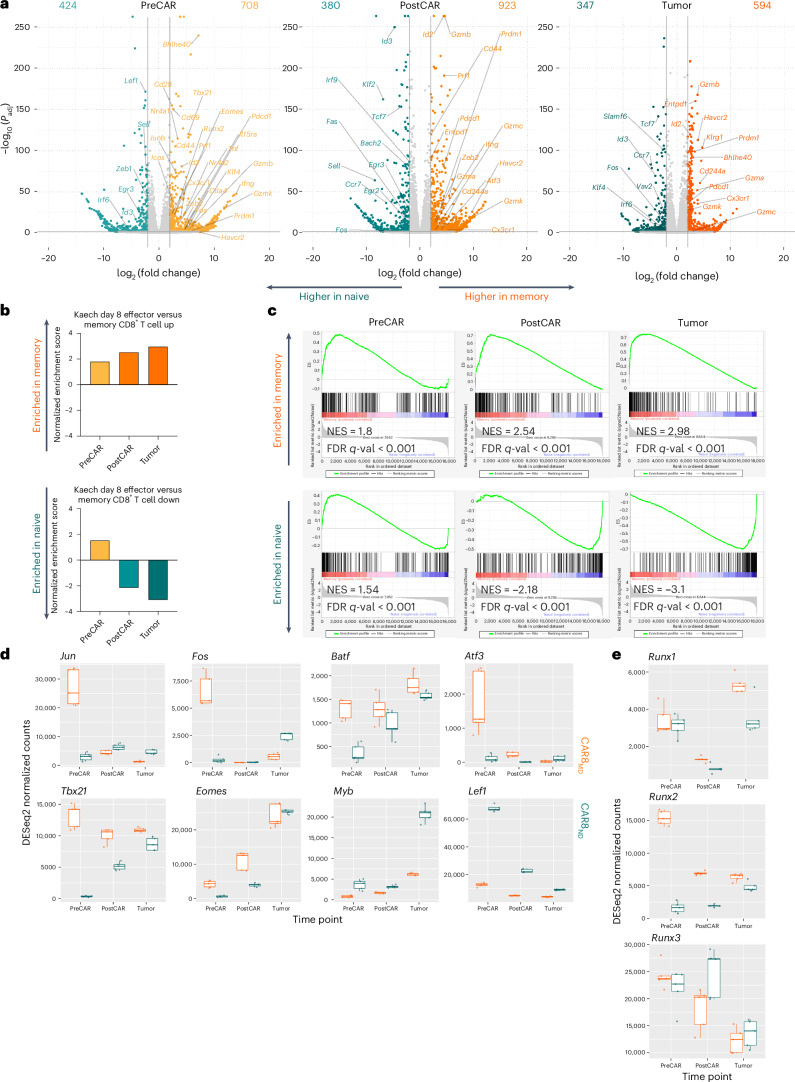
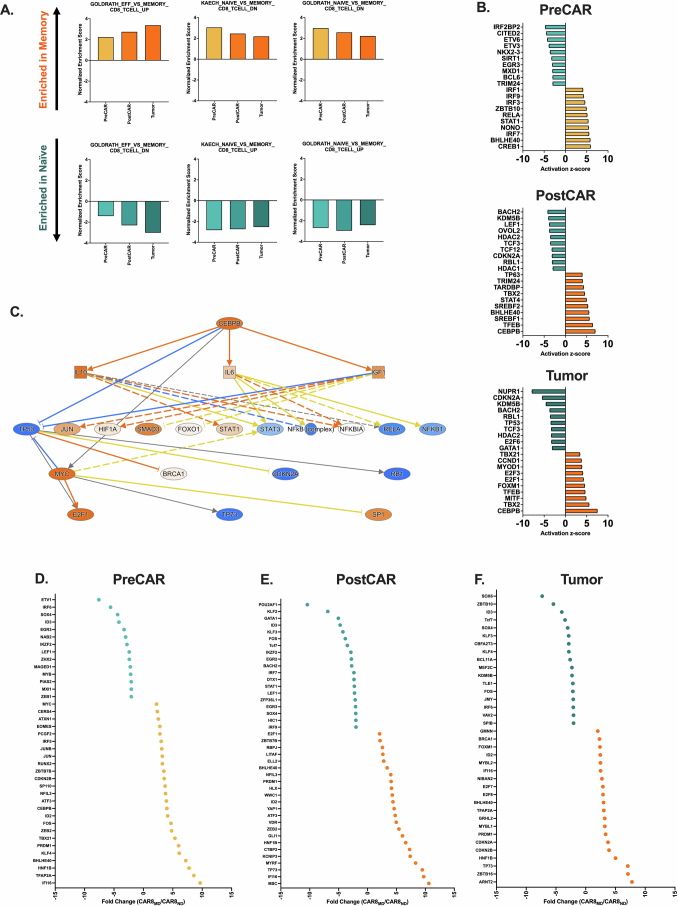
We next performed bulk RNA sequencing (RNA-seq) at the same time points as for ATAC-seq to test whether cell history conferred transcriptomic changes (Fig. 4a). Predictably, the expression of self-renewal genes (Lef1, Sell, Id3, Tcf7 and Il7r) was upregulated in CAR8ND T cells, and the expression of effector/activation genes (Prf1, Ifng, Gzmb, Id2, Pdcd1 and Tbx21) was upregulated in CAR8MD T cells (Fig. 5a). Gene set enrichment analysis (GSEA) showed progressive bias toward more effector-like (less memory-like) in CAR8MD T cells and toward more memory-like (less naive-like) in CAR8ND T cells (Fig. 5b,c and Extended Data Fig. 7a)24–26. PreCAR top differentially expressed genes and Ingenuity Pathway Analysis (IPA) demonstrated many expected differences, including increased expression of Bhlhe40, Klf4, Tbx21, Id2 and bZIP family members (Jun, JunB, Fos and Cebpb) in the memory cells, whereas Zeb1, Myb and Lef1, encoding TFs associated with self-renewal, were increased in expression in naive cells23,27 (Extended Data Figs. 5d and 7b–f). Notably, for the RUNX family, which showed uniquely stable differential motif accessibility (Fig. 4d), Runx2 was among the most differentially expressed TFs with striking overexpression in memory-derived cells (Extended Data Fig. 7d). A common pattern among ChromVAR-implicated TFs was high initial expression in memory cells at the PreCAR time point, followed by a convergence in expression at the PostCAR and Tumor time points, as seen with bZIP family members Jun, Fos and Atf3 along with the gene Tbx21, encoding the canonical effector TF T-bet (Fig. 5d). Interestingly, the expression of Runx2 followed this exact pattern, whereas the expression of Runx1 and Runx3 tracked between memory- and naive-derived T cells at each time point (Fig. 5e). In summary, naive- and memory-derived T cells show differential transcriptional profiles of memory-associated genes and activation/effector-associated genes, respectively. Many relevant TF genes show a pattern of high initial expression in memory cells at the PreCAR time point, which converges following transduction with a CAR and reinfusion into tumor-bearing hosts.
Fig. 5. Prior antigen experience drives differential temporal transcriptomic states in CAR8 T cells.
RNA-seq analysis was performed at the time points and under the conditions indicated in Fig. 4a. a, Volcano plots of significant differentially expressed genes between naive- and memory-derived T cells at each of the three time points. b, Normalized enrichment scores from GSEA of differentially enriched gene sets between the indicated CD8+ T cell subsets after acute LCMV-Armstrong infection24. c, GSEA plots at each time point; NES, normalized enrichment score; ES, enrichment score; FDR, false discovery rate. d, DESeq2-normalized counts of the indicated TFs at each time point for naive- and memory-derived T cells. e, DESeq2-normalized counts of RUNX family TFs at each time point for naive- and memory-derived T cells. All RNA-seq differential gene expression statistical analyses were performed using pooled technical replicates from two independent biological experiments using the DESeq2 R package, with a filtering threshold at 10, log2 (fold change) of >2 and adjusted P value (Padj) of <0.05. Box plots display median values with first and third quartiles.
Extended Data Fig. 7. Additional analyses of RNA-seq data.
Data are related to Fig. 5. All analyses in this figure are from the same timeline/experimental layout described in Fig. 4a. 7A: Normalized enrichment scores from GSEA of differentially enriched genesets between indicated CD8 + T cell subsets after LCMV-armstrong acute viral infection24,25. 7B: Top transcriptional activators predicted to be activated and driving differential transcriptional state between naïve versus memory-derived cells at the indicated timepoint, as predicted by Qiagen Ingenuity Pathway Analysis67 (IPA). 7C: IPA activation map for the Cebpb transcription factor, the top predicted driver of transcriptional state in memory-derived cells at the PostCAR and Tumor timepoints. 7D-F: Top differentially expressed transcription factors, at the indicated timepoint. All statistics performed using DESeq2 with filtering threshold at 10, log2foldchange > 2 and padj > 0.05.
Overexpression of bZIP family proteins in CAR8 T cells
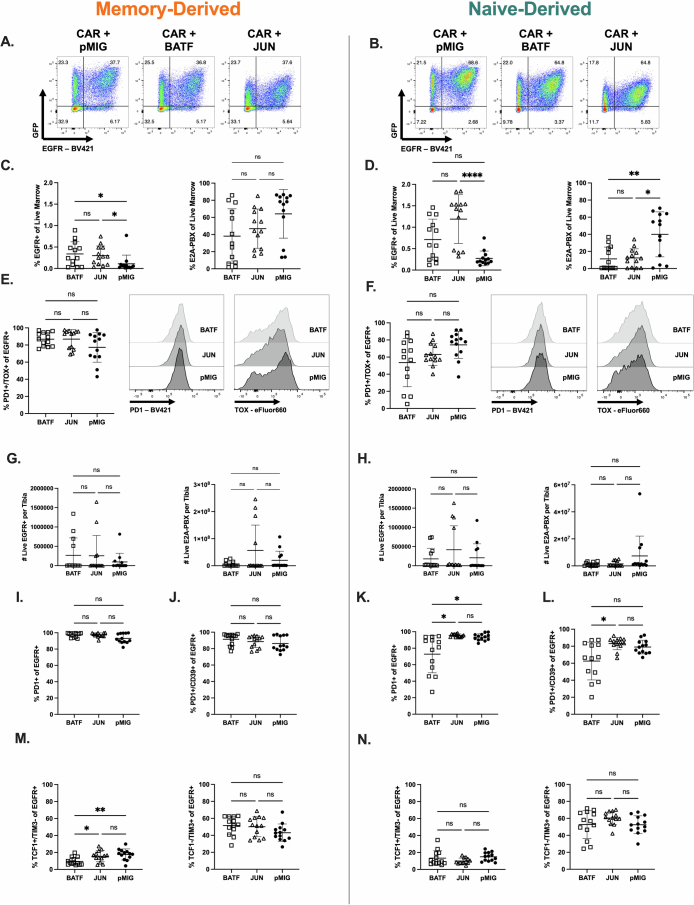
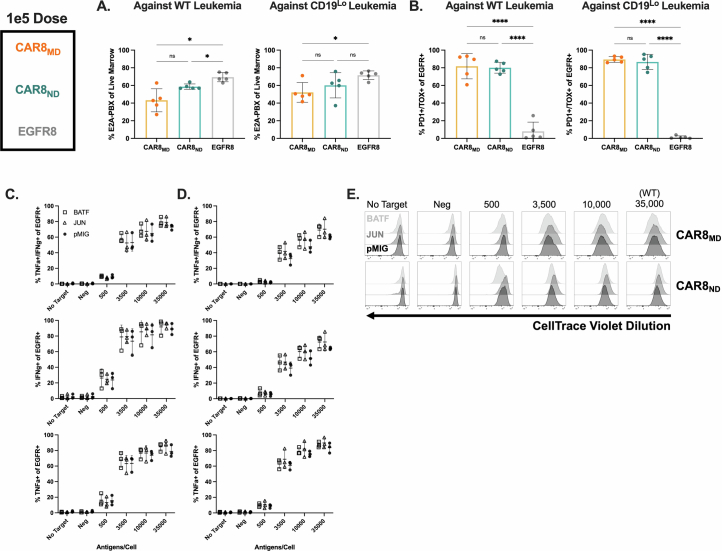
The bZIP family showed the greatest differences between memory- and naive-derived T cells in motif-associated chromatin accessibility (Extended Data Fig. 6c), indicating the importance of this family in T cell function. To validate our genomic data, we overexpressed two TFs from the ChromVAR-implicated bZIP family, BATF and c-JUN, both of which have been previously reported to impact CAR T cell function (Extended Data Fig. 9a,b)28–30. Overexpression of either TF enhanced proportions of memory- and naive-derived CAR T cells in the marrow at a subcurative CAR dose (1 × 10⁵) against which both CAR8ND and CAR8MD T cells exhibit markers of exhaustion and fail to control leukemia (Extended Data Figs. 8a,b and 9c,d,g,h), although neither TF impacted in vitro function (Extended Data Fig. 8c–e). Interestingly, there was no difference between BATF-CAR8 or c-JUN-CAR8 T cells and control CAR8 T cells in leukemia clearance by CAR8MD T cells, whereas both TFs enhanced clearance by CAR8ND T cells (Extended Data Fig. 9c,d,g,h). Although BATF slightly reduced PD1+ and PD1+CD39+ CAR8ND T cells, TF signatures of exhaustion (PD1+TOX+, TCF1+TIM3– and TCF1–TIM3+) were unchanged, and both overexpressed TFs decreased progenitor-exhausted CAR8MD T cells (TCF1+TIM3−; Extended Data Fig. 9e,f,i–n). These data indicate that overexpression of bZIP family TFs can enhance function of naive-derived CAR T cells but do not prevent progression into phenotypic exhaustion.
Extended Data Fig. 9. Overexpression of BATF or c-JUN results in functional enhancement of naïve-derived cells in the presence of phenotypic exhaustion.
Data are related to Fig. 6. 9A-B: Cotransduction of memory (A) or naïve (B) CD8 + T cells with CAR and pMIG-Empty, pMIG-BATF, or pMIG-JUN. For 9C-N Rag1−/− mice were given leukemia on day −3, followed by 1e5 pMIG-Runx2 or pMdIG-Empty co-transduced CAR8 on day 0. Bone marrow was analyzed by flow cytometry on day 11 post-CAR. 9C & D: CAR T cell and leukemia proportions for memory (C) (Exact p values, left to right: 0.0197, 0.0101). or naïve-derived (D) (Exact p values, left to right: <0.0001, 0.0072, 0.0388) cells CAR T cells cotransduced with BATF, JUN or pMIG control. 9E & F: Proportion of CAR T cells displaying PD1+/TOX+ phenotype. For S9G-HCounts data was generated by flushing a single tibia and using total tibia counts and cytometer proportions data to calculate CAR and leukemia cell counts per tibia. 9G-H: CAR and leukemia counts for BATF or JUN overexpressing memory (G) or naïve-derived (H) CAR T cells compared to pMIG control. 9I-N: Proportions of EGFR+ cells from BATF, JUN or pMIG CAR8 with the indicated phenotype. S9I,J,M are memory-derived cells, S9K,L,N are naïve-derived cells. 9I,K: PD1+ (Exact p values, left to right: 0.0103, 0.0185). 9J,L: PD1+/CD39+ (Exact p value: 0.0176). 9M-N: Indicated TCF1/TIM3 phenotype. (Exact p values, left to right: 0.0369, 0.0036). Data are from 3 pooled, independent experiments with n = 13 mice per condition. Statistical comparisons were performed using ordinary one-way ANOVA with Holm-Sidak’s multiple comparisons test, one-way Brown-Forsythe and Welch ANOVA with Dunnett’s T3 multiple comparisons test or Kruskal-Wallis nonparametric test with Dunn’s multiple comparisons test. Data represent mean +/− SD. * p < 0.05, ** p < 0.01, *** p < 0.001, **** p < 0.0001.
Extended Data Fig. 8. Characterization of 1e5 CAR T cell dose in vivo experiments and in vitro comparisons of BATF, JUN overexpressing cells to pMIG (Related to Fig. 6).
Data are related to Fig. 6. All analyses in this figure are the same timeline/experimental layout described in Fig. 3a except with 1e5 CAR+ cell dose, at 11 days post-CAR timepoint. S8A-B are characterization of the 1e5 cell dose with standard T cell groups (no ectopic transcription factor expression). 8A: Leukemia burden. (Exact p values, left to right: 0.0231, 0.0199, 0.0323). 8B: Proportions of CAR8 with the PD1+/TOX+ phenotype. Data in S8A-B are from 1 experiment with n = 5 mice per condition. (Exact p values: All <0.0001). 8C-D: Quantification of intracellular cytokine staining of IFNγ and TNF after 6 hour co-culture assay, % positive of EGFR+, for memory (C) or naïve-derived (D) cells co-transduced with BATF, JUN or pMIG. Data in S8C-D are from 3 independent experiments. 8E: Proliferation as measured by dilution of CellTrace Violet dye dilution of EGFR+ cells after 72 hour co-culture assay, for memory or naïve derived cells co-transduced with BATF, JUN or pMIG. Data representative of 3 independent experiments. Statistical comparisons were performed using one-way Brown-Forsythe and Welch ANOVA with two-sided Dunnett’s multiple comparisons test for S8A-B, and two-way ANOVA with Tukey’s multiple comparisons test for S8C-E. No statistically significant differences were found between BATF or JUN engineered CAR T cells and pMIG control T cells for in vitro data. Data represent mean +/− SD. * p < 0.05, ** p < 0.01, *** p < 0.001, **** p < 0.0001.
RUNX2 overexpression augments in vivo CAR8 T cell function
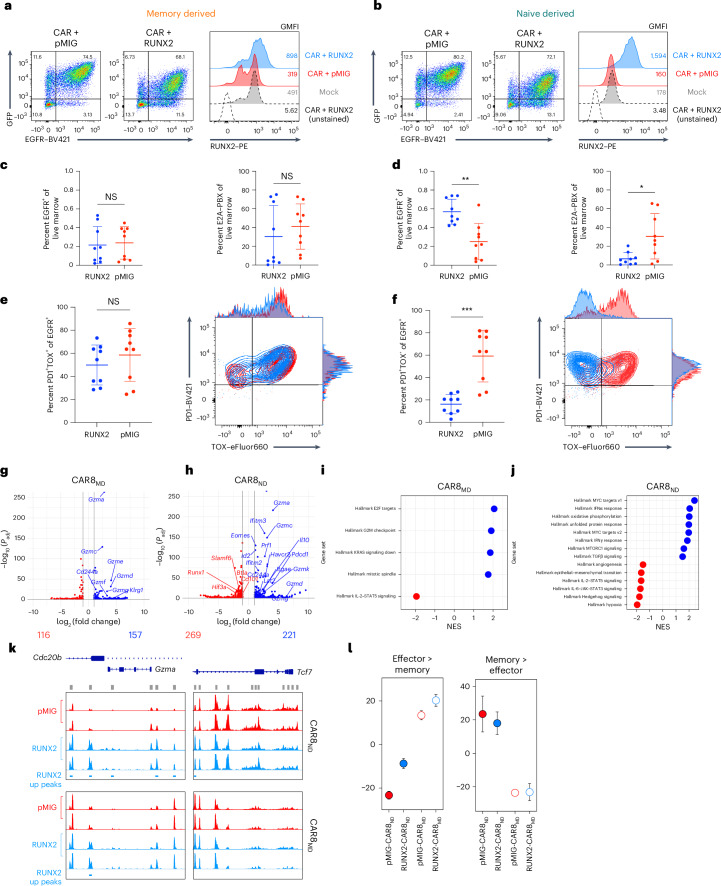
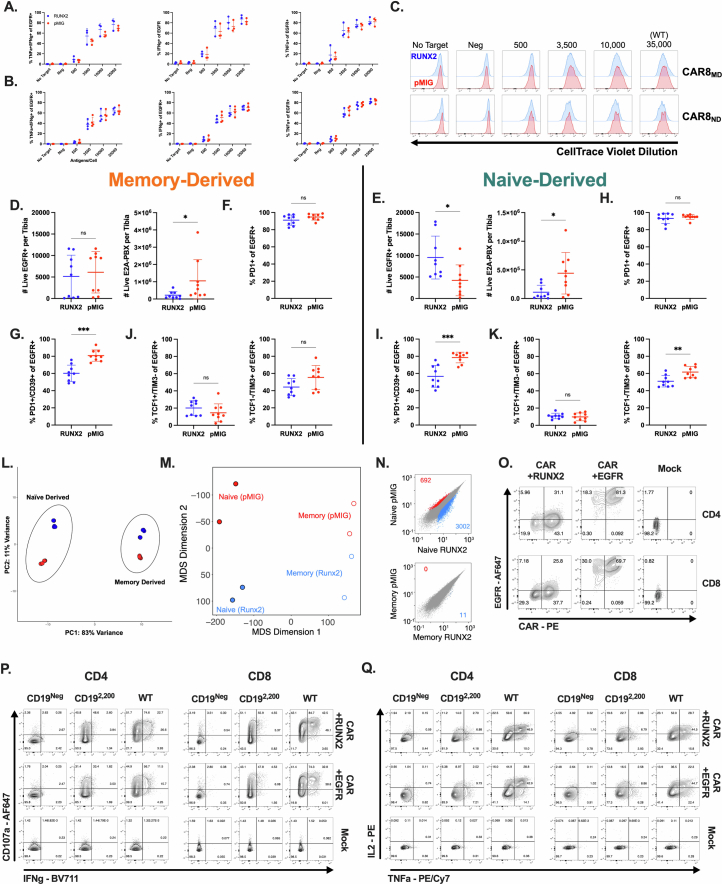
Due to the memory-like genomic profile of CAR8ND T cells after transduction, we predicted that factors enriched in memory cells over naive cells and not fully induced in naive cells during CAR manufacturing could be important drivers of differential functions in CAR8MD T cells relative to CAR8ND T cells. Given the uniquely stable higher accessibility of RUNX family binding motifs in memory-derived cells and the high gene expression in PreCAR memory T cells that later converged, we hypothesized that boosting RUNX2 expression in CAR8ND T cells could enhance the existing memory-like profile. Cotransduction of CD8+ T cells with CAR (EGFR) and mouse RUNX2 (green fluorescent protein (GFP); in tandem in pMSCV-IRES-eGFP (pMIG)) resulted in a large proportion of cells expressing both reporters and increased RUNX2 expression by intracellular staining (Fig. 6a,b). Although RUNX2-CAR8 functioned similarly in vitro relative to pMIG-CAR8 for both CAR8MD and CAR8ND T cells (Extended Data Fig. 10a–c), RUNX2 overexpression in CAR8ND T cells strongly enhanced leukemia clearance and increased CAR proportions and counts in the marrow at 11 days after CAR infusion (Fig. 6c,d and Extended Data Fig. 10d,e). Although there was no difference in the PD1+ proportion, consistent with similar activation, mice treated with RUNX2-CAR8ND T cells (but not RUNX2-CAR8MD T cells) exhibited dramatically reduced proportions of PD1+TOX+ and lower proportions of PD1+CD39+ and TCF1–TIM3+ phenotypes, suggesting that RUNX2 overexpression counteracts the differentiation trajectory toward terminal exhaustion (Fig. 6e,f and Extended Data Fig. 10f–k)27,31. RUNX2 overexpression resulted in a significant reduction in the PD1+CD39+ exhaustion phenotype of RUNX2-CAR8MD T cells and reduction in leukemia counts in the marrow (Extended Data Fig. 9i) but no difference in other metrics (Fig. 6e and Extended Data Fig. 10d). Thus, RUNX2 overexpression in naive-derived T cells augments the functional capacity of naive-derived CAR T cells and mediates a favorable exhaustion profile at a highly subcurative CAR T cell dose, with less impact in memory-derived CAR T cells.
Fig. 6. RUNX2 overexpression enhances CAR8ND T cell potency and effector-like profile while preserving memory-like characteristics.
a,b, Cotransduction of memory (a) or naive (b) CD8+ T cells with CAR and pMIG-Empty or pMIG-RUNX2 and intracellular staining for RUNX2. c,d, CAR T cell and leukemia proportions for naive- (c) and memory-derived (d) CAR T cells cotransduced with RUNX2 or pMIG control; exact P values from left to right: 0.0011 and 0.0188. e,f, Proportion of CAR T cells displaying the PD1+TOX+ phenotype for memory- (e) or naive-derived (f) CAR T cells; exact P value of 0.0003. Data in c–f are from two pooled, independent experiments with n = 9 mice per condition. Statistical comparisons were performed using unpaired two-tailed t-tests with Welch’s correction or Mann–Whitney test. Data are shown as mean ± s.d.; *P < 0.05, **P < 0.01, ***P < 0.001 and ****P < 0.0001. g,h, Volcano plots of significant differentially expressed genes between RUNX2-CAR8 and pMIG-CAR8 at a PostCAR time point for memory- (g) or naive-derived (h) CAR T cells. i,j, Top enriched Hallmark gene sets between RUNX2-CAR8 and pMIG-CAR8 at a PostCAR time point for memory- (i) or naive-derived (j) CAR T cells. All RNA-seq differential gene expression statistics in g–j were performed using pooled replicates and the DESeq2 R package, with filtering threshold at 10, log2 (fold change) of >2 and adjusted P value of <0.05. k, Chromatin accessibility at Gzma and Tcf7 and gene loci for RUNX2 or pMIG naive- and memory-derived T cells at the PostCAR time point. l, ChromVAR deviation z scores at the PostCAR time point between indicated RUNX2/pMIG populations at differentially accessible regions between effector and memory T cells after LCMV-Armstrong infection23. Data are shown as mean ± range of two biological replicates. Detailed statistical information is provided in Methods.
Extended Data Fig. 10. In vitro characterization, additional in vivo data, and additional genomic comparisons for RUNX2-overexpressing CAR8 (Related to Figs. 6 & 7).
Data are related to Figs. 6 and 7. Data in S10A-S10N are from murine CAR T cells. 10A-B: Quantification of intracellular cytokine staining of IFNγ and TNF after 6 hour co-culture assay, % positive of EGFR+, for memory (C) or naïve-derived (D) cells cotransduced with RUNX2 or pMIG. Data in S10-A-C are from 3-4 independent experiments. 10C: Proliferation as measured by dilution of CellTrace Violet dye dilution of EGFR+ cells after 72 hour co-culture assay, for memory or naïve derived cells co-transduced with RUNX2 or pMIG. Data representative of 3 independent experiments. All analyses in S10D-K are done on the same experiments described in Fig. 6. Counts data was generated by flushing a single tibia and using total tibia counts and cytometer proportions data to calculate CAR and leukemia cell counts per tibia. 10D-E: CAR and leukemia counts for RUNX2 overexpressing memory (D) (Exact p value: 0.0142) or naïve-derived (E) (Exact p values, left to right: 0.0106, 0.0188) CAR T cells compared to pMIG control. 10F-I: Proportions of EGFR+ cells from RUNX2 or pMIG CAR8 with the indicated phenotype. S10D,F,G are memory-derived cells, S10E,H,I are naïve-derived cells. 10F,H: PD1 + 10 G,I: PD1+/CD39+ (Exact p values, left to right: 0.0002, 0.0006) 10J-K: Indicated TCF1/TIM3 phenotype (Exact p value: 0.0036). Data in S9A-H are from one experiment with n = 5 mice per condition. Data in S10D-K are from 2 pooled, independent experiments with n = 9 mice per condition. 10L: PCA plot for RUNX2 and pMIG cells, both memory and naïve-derived groups, generated via variance stabilization transformation (vst) function from the R package DESeq2 and the removeBatchEffect function from the R package Limma to account for different collection dates. 10M: Inter-replicate Euclidian distance of voom-normalized ATAC-seq counts per peak between biological replicates, plotted using multidimensional scaling. 10N: Pairwise comparisons of differentially accessible chromatin regions within conditions between RUNX2 and pMIG CAR T cells in memory or naïve-derived groups. Data points are mean of voom-normalized ATAC-seq counts per peak between biological replicates of each group. Data in S10O-S10Q are from human CAR T cells. 10O: Co-staining of the h1928z CAR with EGFR in CD4+ or CD8+ cells co-transduced with hRUNX2-IRES-EGFR, EGFR (control) or Mock (untransduced). 10P: Degranulation as measured by CD107a expression and intracellular cytokine staining of IFNg after 5.5 hour co-culture assay. 10Q: Intracellular cytokine staining of IL-2 and TNF after 5.5 hour co-culture assay. Statistical comparisons for S10A-C were performed using Welch t-tests with Holm-Sidak correction for multiple comparisons of 2 groups. No statistically significant differences were found between RUNX2 engineered CAR T cells and pMIG control T cells for in vitro data. Statistical comparisons for data in S10D-K were performed using unpaired two-tailed t-test with or without Welch’s correction, or Mann-Whitney test. Data represent mean +/− SD. * p < 0.05, ** p < 0.01, *** p < 0.001, **** p < 0.0001.
RUNX2 overexpression directs distinct profiles in CAR8 T cells
To better understand functional differences endowed by RUNX2 overexpression, we next performed ATAC-seq and RNA-seq at the PostCAR time point for CAR8MD and CAR8ND T cells. CAR8ND and CAR8MD T cell groups showed enhanced transcriptional and epigenetic profiles associated with effector cells with RUNX2 overexpression, although changes were more dramatic in CAR8ND T cell groups (Fig. 6g–l). Although there were minimal RUNX2-dependent changes in chromatin accessibility for CAR8MD T cells, we found increased accessibility in RUNX2-CAR8ND T cells at effector loci (Gzma) while preserving accessibility at self-renewal loci (Tcf7), reflecting the in vivo changes seen in CAR8ND but not CAR8MD T cells (Fig. 6k). Although dimensionality reduction analyses of both ATAC-seq and RNA-seq datasets and pairwise global chromatin comparisons still suggested prior antigen experience as the primary driver of genomic variation, RUNX2 overexpression drove greater changes within CAR8ND T cells than within CAR8MD T cells (Extended Data Fig. 10l–n). Overall, these data demonstrate that RUNX2 overexpression drives unique epigenetic and transcriptomic states characterized by enhanced effector profiles with intransigence of the self-renewal profile and a greater effect in CAR8ND T cells.
RUNX2 overexpression enhances human CAR T cell function
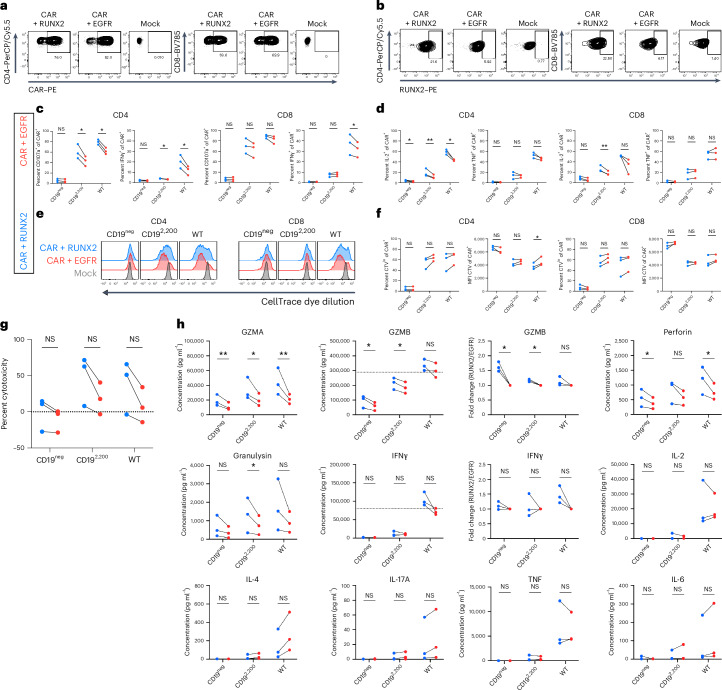
We next tested the impact of RUNX2 overexpression in bulk human CD4+ and CD8+ CAR T cells. We generated a pLenti-RUNX2-IRES-EGFR construct and cotransduced with human anti-CD19-28z CAR (hCAR; Fig. 7a,b and Extended Data Fig. 10o). Despite lower RUNX2 overexpression than in the mouse data, across three independent human donors, RUNX2 overexpression increased proportions of CD8+ cells producing IL-2 and IFNγ, whereas CD4+ cells showed increases in CD107a+, IFNγ+ and IL-2+ cells (Fig. 7c,d and Extended Data Fig. 10p,q). RUNX2 overexpression slightly enhanced proliferation of CD4+ CAR T cells (Fig. 7e,f), and bulk RUNX2-hCAR showed evidence for increased cytotoxicity against both WT and CD19lo leukemia despite donor-to-donor variability (Fig. 7g). To more broadly characterize RUNX2-hCAR, we performed a multiplex enzyme-linked immunosorbent assay (ELISA) and found that RUNX2 overexpression significantly enhanced secretion of effector molecules (GZMA, GZMB, perforin and granulysin) while trending toward a type 1 helper T cell-like profile (increased IFNγ and decreased IL-4 and IL-17A) and decreased IL-6 (Fig. 7h). Together, these data confirm the enhanced effector-like profile and similar self-renewal profile found in genomic profiling of mouse RUNX2-CAR8 T cells and reveal an impact of RUNX2 overexpression on the function of human CD8+ CAR T cells as well as CD4+ CAR T cells.
Fig. 7. RUNX2 overexpression enhances in vitro function of human CD4+ and CD8+ CAR T cells.
a, Expression of the h1928z CAR in CD4+ or CD8+ cells cotransduced with hRUNX2, EGFR (control) or mock (untransduced). b, Intracellular staining for hRUNX2 in CD4+ or CD8+ cells cotransduced with hRUNX2, EGFR (control) or mock (untransduced). c, Degranulation as measured by CD107a expression and intracellular cytokine staining of IFNγ after 5.5 h of coculture; exact P values from left to right: P = 0.0112, P = 0.0076, P = 0.05, P = 0.01 and P = 0.033. d, Intracellular cytokine staining of IL-2 and TNF after 5.5 h of coculture; exact P values from left to right: P = 0.02, P = 0.005, P = 0.01 and P = 0.006. e, Proliferation as measured by dilution of CellTrace Violet (CTV) dye after 72 h of coculture. f, Quantification of data in e; exact P value of 0.02. MFI, mean fluorescence intensity. g, Percent cytotoxicity after 5.5 h of coculture. h, Indicated protein concentrations were measured in cell culture supernatants by multiplexed ELISA after 16 h of coculture; exact P values from left to right and then top to bottom: P = 0.004, P = 0.02, P = 0.007, P = 0.01, P = 0.02, P = 0.01, P = 0.02, P = 0.01, P = 0.04 and P = 0.03. All in vitro assays show data from three independent biological donors. Statistical comparisons were performed using multiple two-sided nonadjusted paired ratio t-tests or multiple two-sided nonadjusted paired t-tests whenever not possible (when a data point was at 0 or below); *P < 0.05, **P < 0.01, ***P < 0.001 and ****P < 0.0001.
Discussion
Factors underlying post-CAR relapse are a central focus in the field of cell therapy. Advances have been made in engineering solutions to prevent tumor escape due to antigen modulation, T cell dysfunction and poor T cell trafficking/persistence1. Defining functional strengths and cellular profiles associated with different starting T cell populations may help identify approaches to arm CAR T cells against specific relapse modalities. Recent work has sought to use targeted modulation of TFs to enhance CAR T cell function, with several publications focusing on the bZIP TF family (specifically BATF and c-JUN) or the NR4A family of nuclear receptors28–30,32,33. However, the impact of bZIP modulation has been variable. Therefore, we sought to characterize functional attributes programmed by prior T cell antigen experience, with the prediction that these would be preserved during CAR T cell generation and could impact response to TF manipulation. Several studies on CAR T cells in hematologic malignancies have described sustained leukemic remissions, associated with CAR T cells exhibiting ‘memory-like’ genomic or phenotypic profiles34–38, and efforts to induce memory-like profiles in CAR T cells have begun39,40. Despite the thorough characterization of endogenous T cell differentiation before and after antigen experience, work to characterize the effects of this starting state on the functional, epigenetic and transcriptomic features of engineered T cell populations has been limited, largely due to difficulty in carefully defining and tracing these populations through CAR transduction and reinfusion.
Here, we use a syngeneic mouse model to track T cell differentiation trajectories without xenogeneic TCR stimulation. We also used a well-defined vaccine model for precise control of antigen experience by clonotypic T cells before CAR transduction and confirmed findings in polyclonal pathogen-elicited cells. Importantly, memory T cells generated from this vaccine model share many characteristics with human memory T cells (rapid effector functions, high expression and dependence on TNF superfamily members (CD27) and cytokine receptors such as IL-7Rα and IL-27Rα (and downstream JAK/STAT activation)) and essential ‘self-renewal’-associated transcriptional programs driven by FOXO1 and TCF1 (refs. 17,41–44). With limiting T cell dose or low target antigen density as stressors, we report that antigen experience dictates multiple functions of CAR T cells. CAR8MD T cells exhibited stronger cytotoxic function across target antigen densities, whereas CAR8ND T cells had greater proliferative capacity and more rapid cell cycle entry. This was associated with enhanced antigen sensitivity of CAR8MD T cells but enhanced activity of CAR8ND T cells at limiting cell doses. Our studies provide insight into prior studies using CAR T cells with TCRs specific to Epstein–Barr virus and suggest that these antigen-experienced cell populations may show utility in targeting tumors with low antigen density or when short-term effector function is desired45–49.
T cell differentiation is a product of epigenetic and transcriptomic state23,27 and, although CAR T cells have been extensively profiled after manufacturing, little work has been done to characterize the effects of prior T cell state on post-transduction CAR T cell profiles5. We demonstrate that features of these states are maintained through CAR manufacturing and associate with functional differences. Here, ex vivo genomic assays were performed on cells infused at high CAR+ cell doses due to cell number limitations. Comparison of cells infused at lower doses, which has been shown to influence T cell functions20,21, will be important in future studies. Nonetheless, we find significant differences in bZIP family TFs, which have been previously implicated in CAR T cell function28–30. Interestingly, overexpression of BATF or c-JUN only conferred significantly enhanced leukemia clearance by naive-derived cells. This indicates that bZIP TFs may exert their functional effect via binding to NFAT-bZIP or IRF-bZIP composite motifs, which show high accessibility in both cell types and contrast with bZIP binding motifs, which have higher accessibility in memory-derived cells. Despite functional benefit, overexpression of either bZIP TF did not prevent phenotypic exhaustion, with no differences in exhaustion-associated TF profiles (TCF1–TIM3+ and PD1+TOX+) relative to control. Together, these data suggest that overexpression of bZIP TFs may preserve function during phenotypic exhaustion. Interestingly, these data are corroborated by a recent study describing a functional but phenotypically exhausted population, characterized by high Batf expression, in mouse and human T cells targeting hematologic cancers50.
Epigenomic and transcriptomic assays identified modulation of RUNX family TFs, particularly RUNX2, as likely having a higher impact in naive-derived cells than in memory-derived cells, with distinctive motif-associated chromatin accessibility and transcriptomic patterns relative to all other TF families. Indeed, RUNX2-overexpressing CAR8ND T cells (but not CAR8MD RUNX2-overexpressing T cells) mediated superior clearance of leukemia, higher proportions of cells in the marrow and reduced proportions of cells displaying terminally exhausted phenotypes. Our data suggest that RUNX2 overexpression, in contrast to bZIP family members, enhances functional potency of CAR8ND T cells while preventing exhaustion differentiation. The role of RUNX2 as a negative regulator of exhaustion warrants further investigation, and strategies to exploit this attribute could produce highly functional T cell responses to solid tumors. In addition to activity as a transcriptional activator, RUNX2 interacts with SWI/SNF complexes, histone acetyltransferases (MOZ and p300), histone deacetylases (HDAC3, HDAC4 and HDAC6) and histone methyltransferases (SUV39H1), along with all three TET family enzymes, indicating the ability of RUNX2 to recruit chromatin remodelers to RUNX binding motifs51–54. Profiling of RUNX2-CAR8 by RNA-seq and ATAC-seq revealed an effector-like profile with preservation of self-renewal characteristics, consistent with functional readouts. Dimensionality reduction of genomic data showed greater-magnitude changes from RUNX2 overexpression in naive-derived cells, although the primary driver of variation was still prior antigen experience. Together, these data suggest that RUNX2 allows for enhanced effector function while maintaining proliferative capacity, likely leading to the enhanced in vivo antitumor activity.
The top TF family (bZIP) in our dataset showing CAR8MD-biased motif accessibility showed similar patterns of chromatin accessibility in previous human and mouse datasets and high peak-specific species conservation between mouse and human T cells in thorough analyses performed by Gennert et al.55. RUNX was unique among TF families in our analysis, showing stably higher motif-associated chromatin accessibility, analogous to observations between human naive and memory T cells reported by Lynn et al.30. Additionally, RUNX2 was among a list of TFs in the Gennert et al. study showing motif enrichment among peaks that were biased toward accessibility in human over mouse cells. Our mouse data reveal RUNX2 overexpression-mediated chromatin remodeling at effector loci, predominantly in CAR8ND T cells, consistent with mouse data in the prior study. Finally, in vitro functional differences from RUNX2 overexpression were species conserved (but more evident in human), fitting with prior findings of ‘human accessibility bias’ at genomic RUNX binding motifs and providing further evidence for therapeutic translation of RUNX2 overexpression23,30,55. Functional enhancement was observed in RUNX2-overexpressing mouse T cells in vivo and human cells in vitro, albeit with donor-to-donor variability in some cases. Some human functional readouts also suggested RUNX2-mediated induction of off-target activity in the absence of antigen. Thus, as with modulation of any TF, RUNX2 overexpression may have risks. Therefore, additional preclinical studies, including in vivo safety studies, before carefully designed clinical trials would be justified.
In summary, we have generated a framework for the role of prior antigen experience on function of a CAR T cell in situations of limiting T cell dose or target antigen density. We highlight the importance of considering this framework when assessing approaches to apply synthetic immunology to manipulate therapeutic immune effector cell functions. Refining qualities of the starting cell population will be relevant to cellular therapeutics derived from healthy allogeneic donors, induced pluripotent stem cells or targeted in vivo gene delivery. We show that RUNX2 overexpression in naive-derived CAR T cells enhances in vivo function, prevents differentiation into an exhausted state and promotes an effector-like profile without sacrificing self-renewal. We confirm RUNX2 overexpression as a potential strategy to enhance human CAR T cell therapies, revealing a role of RUNX2 in improving function of both CD8+ and CD4+ CAR T cells. Our findings suggest that RUNX2 overexpression augments antitumor function of CAR T cell therapies, and we predict that these datasets will help inform other strategies to realize the full potential of engineered cellular therapeutics in oncology and other implications.
Methods
Mouse strains
B6.129S6-Rag2tm1FwaTg(TcraTcrb)1100Mjb (‘OT-I’; model 2334-F) mice were obtained from Taconic Biosciences. B6.SJL-PtprcaPepcb/BoyJ (‘PepBoy’; strain 002014), B6.129S7-Rag1tm1Mom/J (‘Rag1−/−’; strain 002216) and C57BL/6J mice (‘B6’; strain 000664) mice were obtained from The Jackson Laboratory. Female mice were used for all experiments. All CAR T cells were generated from female donor mice at 6–12 weeks of age, and all hosts receiving adoptive transfers were female 6–10 weeks of age. All mice were bred and/or maintained in the animal facility at University of Colorado Anschutz Medical Campus. Mice were housed at up to five mice per cage with free access to chow (Inotiv, 2920X) and water. Statistical calculations for animal cohort sizes were based on conservative anticipated decreases in leukemia burden from 60% to 20%, with a standard deviation of 20%, a two-sided α of 0.05 and power of 0.80, with allowance of occasional unpredictable attrition during the study, resulting in a final cohort size of n = 5 biological replicates (mice) per group. The cohort sizes were generalized across studies based on the power analysis calculations specified above as well as our experience of the typical numbers of mice used in prior work16. As we have repeatedly demonstrated consistent engraftment of mouse B cell acute lymphoblastic leukemia (E2A–PBX) in our mouse models14,16, we did not anticipate engraftment difficulties. Mice were carefully monitored before experiments to ensure health before inclusion in experimental cohorts. For these reasons, we did not use additional mice beyond the numbers in our calculated sample sizes. Mice were housed at a temperature of 22 °C (±1 °C) at a humidity of 35%, with lighting 14 h on (0600–2000 h) and 10 h off and air changes at 10 to 15 per h. All experiments were performed in compliance with the study protocol approved by University of Colorado Anschutz Medical Campus Institutional Animal Care and Use Committee (protocol number 00751).
Mouse DNA constructs
Basic construction of the mouse 1928z CAR was previously described56. The mouse anti-CD19 scFv was Flag tagged to enable CAR detection, and all ITAMs in the CD3ζ domain were kept intact. A truncated human EGFR reporter protein was incorporated following a 2A skip sequence to provide an additional method for detection of CAR-transduced cells13. The DNA was codon optimized, ordered from Thermo Fisher GeneArt and cloned into the MSCV-IRES-GFP backbone, a gift from T. Reya (Departments of Pharmacology and Medicine, University of California San Diego School of Medicine, La Jolla, CA, USA, Addgene plasmid 20672; http://n2t.net/addgene:20672; RRID: Addgene_20672) using XhoI and ClaI enzyme sites. A control plasmid with just the truncated EGFR reporter in the MSCV backbone was generated using similar methods. The DNA sequences for mouse Batf, Jun and Runx2 were codon optimized, ordered from either Twist Biosciences or Thermo Fisher GeneArt and cloned into MSCV-IRES-GFP upstream of the IRES using EcoRI and XhoI enzyme sites.
Human DNA constructs
The human 1928z CAR construct was a gift from J. Kochenderfer (Surgery Branch, Center for Cancer Research, National Cancer Institute, National Institutes of Health, Bethesda, MD, USA)57. Human RUNX2-IRES-hEGFRt DNA was codon optimized, ordered from Thermo Fisher GeneArt and cloned into a lentiviral backbone using XhoI and BamHI restriction sites. A control plasmid with just the truncated human EGFR reporter was PCR amplified out of the MSCV construct and cloned into the lentiviral backbone.
Cell lines and media
E2A–PBX mouse pre-B cell acute lymphoblastic leukemia was developed in the laboratory as previously described14–16. Mouse T cells and leukemia were cultured in complete mouse medium consisting of RPMI 1640 medium (Gibco) with 10% heat-inactivated fetal calf serum (Omega Bio), 1% nonessential amino acids (Gibco), 1% sodium pyruvate (Gibco), 1% penicillin/streptomycin (Gibco), 1% l-glutamine (Gibco), 1.5% HEPES buffer (Gibco) and 50 μM 2-mercaptoethanol (Sigma-Aldrich). NALM6 GFP/luciferase human B cell acute lymphoblastic leukemia was a gift from C. Mackall (Department of Pediatrics, Stanford University, Stanford, CA, USA; originally obtained from Leibniz Institute DSMZ German Collection of Microorganisms and Cell Cultures) and was cultured in complete RPMI medium consisting of RPMI 1640 medium (Gibco) supplemented with 10% heat-inactivated fetal calf serum (Omega Bio), 1% penicillin/streptomycin (Gibco) and 1% l-glutamine (Gibco). All cell lines were routinely tested for mycoplasma (at least on an annual basis). Human T cells were cultured in human T cell expansion medium (hTCEM) consisting of AIM-V medium (Gibco) supplemented with 5% heat-inactivated fetal calf serum (Omega Bio), 1% l-glutamine (Gibco) and 1.5% HEPES buffer. Platinum E cells were purchased from Cell Biolabs and grown to create frozen stocks in Plat E medium containing DMEM, 10% heat-inactivated fetal calf serum (Omega Bio), 1% penicillin/streptomycin (Gibco) and 1% l-glutamine (Gibco) with 1 μg ml–1 puromycin and 10 μg ml–1 blasticidin for selection. Transfections were performed without penicillin/streptomycin or selection antibiotics in the medium. Lenti X cells were purchased from Takara and grown to create frozen stocks in Lenti X medium containing DMEM, 10% heat-inactivated fetal calf serum (Omega Bio), 1% penicillin/streptomycin (Gibco), 1% l-glutamine (Gibco) and 1.5% HEPES buffer.
Generation of retrovirus and lentivirus
For retrovirus, 11 × 106 Platinum E cells (Cell Biolabs) were plated in a T75 flask and allowed to adhere overnight. The following day, the medium was changed to fresh Plat E medium, and transfection was performed with transfer plasmid DNA and Lipofectamine 3000 and p3000 reagents in basal OptiMEM medium (Gibco) according to the manufacturer’s protocol. Supernatant containing virus was collected 48 h later and spun at 2,000g to remove cellular particulate. For lentivirus, 10 × 106 Lenti X cells (Takara) were plated in a T75 flask and allowed to adhere overnight. The following day, the medium was changed to fresh OptiMEM+ medium containing 5% heat-inactivated fetal calf serum (Omega Bio), 1% l-glutamine (Gibco) and 1% sodium pyruvate (Gibco). Transfection was performed with transfer plasmid DNA, plasmids encoding packing and envelope vectors (pMDLg/pRRE, pMD.2G, pRSV-Rev) and Lipofectamine 3000 and p3000 reagents in basal OptiMEM medium (Gibco) according to manufacturer’s protocol. After 5 h, the medium was replaced with 16 ml of fresh OptiMEM+. Supernatant containing virus was collected 48 h later, spun at 2,000g to remove cellular particulate and spun for 90 min at 20,000g to concentrate.
Mouse CAR transduction
CAR transduction was performed as previously described14–16. Briefly, spleens from 6- to 12-week-old donor mice were collected, and CD8+ T cells were isolated using an EasySep Mouse CD8+ T cell Isolation kit from STEMCell Technologies or bulk T cells were isolated using a Mouse CD3+ T Cell Enrichment Column kit (R&D Biosciences, MTCC-25). On day 1, T cells were activated on anti-CD3/anti-CD28 Mouse T cell Activator Dynabeads (Gibco) at a 1:1 cell:bead ratio and cultured at 1 × 10⁶ cells per ml in complete mouse medium in the presence of recombinant human IL-2 (rhIL-2; 40 IU ml–1) and rhIL-7(10 ng ml–1) from R&D Systems. On days 2 and 3, retroviral supernatant was added to RetroNectin-coated (Takara Biosciences) six-well plates and spun at 2,000g at 32 °C for 2–3 h. The supernatant was then removed, and activated T cells were added to the wells at 1.67 ml per well. On day 4, beads were removed, and T cells were resuspended at 1 × 10⁶ cells per ml in fresh medium with cytokines. CAR transduction was determined after debeading by analyzing T cells by flow cytometry for a Flag+EGFR+ population (or EGFR+ for control T cells), and T cells were used in assays or infused into mice on day 5 or 6.
Human CAR transduction
Human peripheral blood mononuclear cells were isolated from Leukocyte Reduction System Chambers from healthy blood donors at Children’s Hospital Colorado. Bulk T cells were isolated using an EasySep Human T Cell Enrichment kit from STEMCell Technologies and cryopreserved. On day 1, T cells were thawed and activated on Human T-Expander CD3/CD28 Dynabeads (Gibco) at a 1:3 cell:bead ratio and cultured at 1 × 10⁶ cells per ml in hTCEM in the presence of rhIL-2 (50 IU ml–1) from R&D Systems. On days 3 and 4, T cells were cotransduced with lentivirus encoding CAR and RUNX2 or CAR and EGFR, and mock T cells were left untransduced and provided with fresh medium with cytokines. For transductions, 1 × 10⁶ T cells were added to RetroNectin-coated (Takara Biosciences) 24-well plates, along with concentrated lentiviral supernatant and LentiBOOST (SIRION Biotech), and plates were spun at 2,000g at 32 °C for 2–3 h. On day 5, the beads and supernatant were removed, and cells were replated at 1 × 10⁶ cells per ml in hTCEM with IL-2 (300 IU ml–1). On day 7, cells were were replated at 1 × 10⁶ cells per ml in hTCEM with IL-2 (300 IU ml–1), rhIL-7(10 ng ml–1; R&D Systems) and rhIL-15 (10 ng ml–1; STEMCell Technologies), and CAR and RUNX2 transduction was determined by flow cytometry. Cells were used for assays on day 8 after transduction.
Vaccine model
The ovalbumin vaccine consists of 100 μg of whole ovalbumin protein (InvivoGen, vac-pova-100), 40 μg of anti-mouse CD40 (BioXCell, BE0016-2) and 40 μg of polyinosinic:polycytidylic acid (InvivoGen, tlrl-pic-5) per mouse resuspended to 200 μl total volume in PBS17–19. CD8+ T cells were isolated from naive 6- to 8-week-old OT-I mouse splenocytes using a Mouse CD3+ T Cell Enrichment Column kit (R&D Biosciences, MTCC-25). PepBoy mice were treated with 5 × 10³ OT-I T cells retro-orbitally and concurrently vaccinated intravenously. Three to 4 weeks later, spleens from 5–20 vaccinated mice were pooled, and CD45.2+ OT-I memory T cells were isolated using an EasySep Mouse CD8+ T cell Isolation kit, followed by column isolation using biotinylated anti-mouse CD45.2 (BioLegend, 109804), LS columns (Miltenyi Biotec, 130-042-401) and anti-biotin MicroBeads (Miltenyi Biotec, 130-090-485). Naive T cells from one to five naive OT-I donors were isolated in parallel. T cells were then activated and transduced as described for downstream experiments.
Generation of CD19lo E2A–PBX and NALM6 leukemia cell lines
E2A–PBX mouse leukemia was generated in our lab as previously described14. Cd19-knockout leukemia was produced using CRISPR–Cas9. A previously validated mouse CD19-targeting single guide RNA15 (GTGGAATGCTTCAGACGTCAGGG) from the CRISPR GeCKO v2 library58 was ordered from Integrated DNA Technologies and incubated with recombinant Cas9 from TakaraBio (632641) to create a ribonucleoprotein complex. Ribonucleoprotein was then electroporated into E2A–PBX cells using a Lonza 4D-Nucleofector X with nucleofector solution SG and pulse program CM-147. Electroporated cells were allowed to recover for 48 h and then sorted by FACS twice to obtain a pure Cd19-knockout cell line. This cell population was additionally single-cell cloned to generate a Cd19-knockout single-cell clone before transduction with mouse CD19. A truncated/nonsignaling mouse CD19 was ordered from Thermo Fisher GeneArt and cloned into the pLV.SP146.gp91.GP91.cHS4 plasmid, a gift from D. Trono (Swiss Federal Institute of Technology Lausanne (Ecole Polytechnique Fédérale de Lausanne, EPFL), School of Life Sciences, Laboratory of Virology and Genetics (LVG), EPFL-SV-GHI-LVG, Station 11, CH-1015 Lausanne, Switzerland, Addgene plasmid 30480; http://n2t.net/addgene:30480; RRID: Addgene_30480). Backbones were generated with the EEF1A1 promoter (pLV.hEF1a.cHS4) or the UBC promoter (pLV.hUbC.cHS4) from the pLenti6/UbC/mSlc7a1 plasmid, a gift from S. Yamanaka (Center for iPS Cell Research and Application, Kyoto University, Kyoto, Japan, Addgene plasmid 17224; http://n2t.net/addgene:17224; RRID: Addgene_17224). VSV-G pseudotyped lentivirus was generated as previously described, and E2A–PBX Cd19 knockout underwent a single round of transduction using standard protocols, followed by single-cell cloning to obtain clonally derived lines expressing defined levels of CD19 target antigen. NALM6 Cd19 knockout was a gift from C. Mackall and was originally generated using CRISPR–Cas9 with guide RNAs from CRISPR GeCKO v2 libraries (CACCGTGGAATGTTTCGGACCTAGG and AAACCCTAGGTCCGAAACATTCCAC)58. The CD19lo-2,200 variant was generated using similar methods as described for mouse leukemia, with a truncated/nonsignaling human CD19 ordered from Twist Bioscience cloned into the pLV.SP146.gp91.GP91.cHS4 plasmid with the UBC promoter. Approximate mouse or human CD19 antigen densities on all cell lines were quantified using a BD Quantibrite PE Fluorescence Quantitation kit following the manufacturer’s protocol (BD Biosciences, 340495).
Flow cytometry
Flow cytometry analysis was performed using an LSR-Fortessa X-20 flow cytometer (BD Biosciences) and analyzed using FlowJo (BD Biosciences). Monoclonal antibodies used for staining are listed in the Reporting Summary. Intracellular flow cytometry staining was performed using the TrueNuclear Transcription Factor Buffer Set (BioLegend) for ex vivo staining of TFs, the Cytofix/Cytoperm Fixation/Permeabilization kit (BD Biosciences) for intracellular cytokine staining and a Mouse Foxp3 Buffer Set (BD Biosciences) for intracellular staining of Ki67 and RUNX2.
Mouse CD107a degranulation, intracellular cytokine staining, Ki67 and CellTrace dilution in vitro assays
In vitro assays were performed using a 1:1 effector:target cell ratio with 1 × 10⁵ of each cell type in a 96-well round-bottom plate, followed by analysis by flow cytometry at the indicated time points. Degranulation assays were performed by incubation for 4 h in the presence of 2 μM monensin and 1 μl of anti-CD107a. Intracellular cytokine staining was performed by incubation for 6 h with 1 μM monensin and 2.5 μM Brefeldin A added at 1 h in. A Ki67 assay was performed by incubation for 18 h, followed by intracellular staining for Ki67. CellTrace dilution assays were performed by staining T cells with CellTrace Violet (Thermo Fisher Scientific) as per the manufacturer’s protocols, followed by incubation with target cells for 72 h. All mouse in vitro assays were performed in complete mouse medium.
Human CD107a degranulation, intracellular cytokine staining, killing, CellTrace dilution and LEGENDplex in vitro assays
In vitro assays were performed using a 1:1 effector:target cell ratio with 1 × 10⁵ of each cell type in a 96-well round-bottom plate, followed by analysis by flow cytometry at the indicated time points. Combined degranulation/intracellular cytokine staining assays were performed by incubation for 5.5 h in the presence of 2 μM monensin and 1 μl of anti-CD107a. CellTrace dilution assays were performed by staining T cells with CellTrace Violet (Thermo Fisher Scientific) as per the manufacturer’s protocols, followed by incubation with target cells for 72 h. Multiplexed ELISAs using the LEGENDplex Hu CD8/NK Panel V02 (BioLegend, 741187) were performed on supernatant collected after 16 h of coculture. All human in vitro assays were performed in complete RPMI medium.
Mouse and human in vitro killing assays
In vitro killing assays were quantified from intracellular cytokine staining datasets as described above, with a 1:1 effector:target cell ratio with 1 × 10⁵ of each cell type in a 96-well round-bottom plate, followed by analysis by flow cytometry at a 6-h time point. Live leukemia proportions at 0 h (L0) were calculated by the following formula: L0 = 100 – ({(1 / TE)/[1 + (1 / TE)]} × 100), where TE represents transduction efficiency of CAR, with live leukemia and live T cell proportions quantified by Trypan Blue staining. Percent cytotoxicity for each replicate was calculated by using the following formula: percent cytotoxicity = 100 × [1 – (L6 / L0)], where L6 represents live leukemia proportions at 6 h gated using Viability Dye.
LCMV infection and T cell isolation
Six-week-old female C57BL/6 mice were injected retro-orbitally with 2 × 10⁵ plaque-forming units of LCMV-Armstrong. Four weeks later, CD8+ T cells were isolated from five to ten pooled spleens using an EasySep Mouse CD8+ T cell Isolation kit from STEMCell Technologies and then sorted by FACS to obtain memory (CD8+CD44+CD49dhi) and naive (CD8+CD44–CD49dloCD62L+) populations from the same mice. T cells were then transduced using the standard transduction protocol as described earlier.
In vivo experiments in Rag1–/– hosts
Experiments were performed using a previously optimized timeline14. Briefly, 6- to 10-week-old Rag1–/– hosts were inoculated with 1 × 10⁶ E2A–PBX cells by intravenous tail vein injection on day −3, followed by CAR T cell administration via retro-orbital injection at a dose of 1 × 10⁵, 3 × 10⁵ or 1 × 10⁶ CAR+ T cells on day 0. Bone marrow was collected and analyzed by flow cytometry on day 4 or 11 after CAR infusion, or mice were killed at humane endpoints for survival experiments. Ex vivo stimulation for cytokine production was performed using 1 × 10⁶ E2A–PBX WT cells to stimulate approximately 1.5 × 10⁶ whole bone marrow cells from each individual mouse, with pooled bone marrow from each n = 5 experimental group stimulated by E2A–PBX CD19neg cells as a negative control. Cells were cocultured for 6 h with 1 μM monensin and 2.5 μM Brefeldin A added at 1 h and then analyzed by flow cytometry for cytokine production. Mice were carefully monitored daily for symptoms related to high leukemia burden, including hind limb paralysis, lethargy or hunching. Experimental endpoints were designated as survival studies with careful monitoring or time points that avoided excessive leukemia burdens.
Bulk ATAC- and RNA-seq experimental setup and workflows
OT-I CD8+ T cells were isolated from vaccinated or naive donors, and CARs were transduced into T cells as described above. CAR8 Rag1−/− hosts were inoculated with 1 × 10⁶ E2A–PBX CD1910,000 cells, followed by 1 × 10⁶ CAR8MD or CAR8ND T cells on the timeline described above. At day 4 after CAR infusion, bone marrow from ten mice per CAR group was collected and pooled. At each of three time points, CD8+ cells were isolated using an EasySep Mouse CD8+ T cell Isolation kit from STEMCell Technologies and then sorted by FACS to obtain 50,000 cells per condition. ATAC-seq and RNA-seq were performed in triplicate on separate sorted aliquots of 50,000 cells at ‘PreCAR/day −5’ (ex vivo, directly after isolation of memory or naive CD8+ T cells from donor mice), ‘PostCAR/day 0’ (in vitro, after CAR manufacturing) and ‘Tumor/day 4’ (ex vivo, after reinfusion into leukemia-bearing mice). Experimental analyses were performed on the first technical replicate from two separate experimental replicates. For RNA-seq, cells were homogenized in QIAzol lysis reagent (Qiagen, 79306) and frozen at −80 °C for processing within 2 weeks. Samples were thawed and processed using an miRNeasy Micro kit (Qiagen, 1071023) with on-column DNase treatment (RNase-Free DNase Set, Qiagen, 79254), both according to the manufacturer’s protocols. RNA purity, quantity and integrity were determined with NanoDrop (Thermo Fisher Scientific) and TapeStation 4200 (Agilent) analysis before RNA-seq library preparation. A Universal Plus mRNA-Seq library preparation kit with NuQuant was used (Tecan) with an input of 200 ng of total RNA to generate RNA-seq libraries. Paired-end sequencing reads of 150 base pairs (bp) were generated on a NovaSeq 6000 (Illumina) sequencer at a target depth of 40 million clusters/80 million paired-end reads per sample. Raw sequencing reads were demultiplexed using bcl2fastq. For ATAC-seq, cells were immediately processed using the Omni-ATAC protocol as previously described59. Briefly, sorted cells were washed once in 1× PBS, lysed and washed once in Wash Buffer. The transposition reaction was performed at 32 °C for 30 min on a thermomixer set to 1,000 rpm. Transposed chromatin was then purified using a Zymo Clean and Concentrator 5 kit (Zymo Research, D4013) as per the manufacturer’s protocols. DNA was then subjected to PCR for 12 total cycles with matched barcoding primers60. PCR reactions were then size selected using AMPure XP beads (Beckman Coulter Life Sciences, A63880) and checked for quality and size distribution using a TapeStation 4200 with D5000 reagents (Agilent). Libraries were pooled at equimolar ratios for sequencing, and paired-end sequencing reads of 150 bp for the first replicate and 50 bp for the second replicate were generated on a NovaSeq 6000 (Illumina) sequencer at a target depth of 40 million clusters/80 million paired-end reads per sample. Raw sequencing reads for replicate 1 were shortened to match the read lengths for replicate 2 using the trimmomatic function CROP. Raw sequencing reads were demultiplexed using bcl2fastq.
RNA-seq data analysis
The quality of fastq files was accessed using FastQC (v.0.11.8; http://www.bioinformatics.babraham.ac.uk/projects/fastqc), FastQ Screen (v.0.13.0)61 and MultiQC (v.1.8)62. Illumina adapters and low-quality reads were filtered out using BBDuk (v. 38.87; http://jgi.doe.gov/data-and-tools/bb-tools). Trimmed fastqc files were aligned to the mm10 mouse reference genome, and aligned counts per gene were quantified using STAR (v.2.7.9a)63. Differential gene expression analysis was performed using pooled replicates with the DESeq2 package64. Pathway enrichment analysis was performed using GSEA (University of California San Diego/Broad Institute)26,65, Metascape66 for gene mapping and IPA (Qiagen)67,68. Differential gene expression was plotted using GraphPad Prism or ggplot2 (R package). RNA-seq differential gene expression statistics were analyzed using the DESeq2 R package, with the filtering threshold set at 10 with a greater than twofold change and adjusted P value of <0.05. PCA plots were generated using the variance stabilization transformation (vst) function from the R package DESeq2 and the removeBatchEffect function from the R package limma. The correction was done to account for different collection dates.
ATAC-seq data analysis
Fastq files were used to map to the mm10 genome using the ENCODE ATAC-seq pipeline (https://www.encodeproject.org/atac-seq/) with default parameters, except bam files used for peak calling were randomly downsampled to a maximum of 50 million mapped reads. MACS2 (https://pypi.org/project/MACS2/) summits from each replicate with a fold change of more than 4 and a q value of more than 13.81 were extended to 500-bp regions. These regions from all replicates were merged with bedtools69 and processed to uniform 500-bp peaks with the functions getPeaks and resize from the R package ChromVAR22. Reads overlapping peaks were enumerated with the getCounts function from ChromVAR and normalized with the quantile option from voom from the R package limma70. Peaks with three or more normalized counts per million mapped reads per kilobase in at least one replicate were included to define a global peak set. Pairwise Euclidean distances were computed between all samples using voom-normalized counts across the global peak set. Differentially accessible peaks were identified in pairwise comparisons based on FDR-adjusted P values of less than 0.01 and a log2 (fold change) of at least 2 (for naive versus memory-derived CAR T cell analyses) or FDR-adjusted P values of less than 0.1 and log2 (fold change) of at least 1 (for RUNX2 versus empty vector analyses) and an average of three normalized counts per million mapped reads per kilobase using the R package limma. Differentially accessible regions were partitioned based on centered counts from each replicate using k-means clustering. Enrichment of motifs in sequences of peaks in each cluster were compared to all differentially accessible peaks using HOMER (v4.11)71. Motif- or peak-associated variability in ATAC-seq signals was computed with the R package ChromVAR using HOMER motifs from the R package chromVARmotifs or peaks defined from Chen et al.32. Genome-wide coverage of ATAC-seq data was computed with the deeptools72 function coveragebam using scale factors calculated from the number of reads per sample that overlap the total peak set.
Statistics
Statistical tests for all experiments except sequencing analyses were performed using GraphPad Prism v9.0 and v10.1.1 for MacIntosh (GraphPad Software). All data are represented as mean ± s.d. unless otherwise noted. Normality and equal variances of data were not formally tested; data distributions were assumed to be normal, and nonparametric or corrected tests were always used in cases where data were clearly outside of test assumptions. Data collection and analysis were not performed blind to the conditions of the experiments. No data points were excluded from analysis. Significance is denoted by *P < 0.05, **P < 0.01, ***P < 0.001 and ****P < 0.0001. Specific tests used along with technical, biological and experimental replicates in each dataset are indicated in the figure legends.
Reporting summary
Further information on research design is available in the Nature Portfolio Reporting Summary linked to this article.
Online content
Any methods, additional references, Nature Portfolio reporting summaries, source data, extended data, supplementary information, acknowledgements, peer review information; details of author contributions and competing interests; and statements of data and code availability are available at 10.1038/s41590-024-02034-1.
Supplementary information
Source data
Flow cytometry statistical source data.
Flow cytometry statistical source data.
Flow cytometry statistical source data.
Flow cytometry statistical source data.
Flow cytometry/ELISA statistical source data.
Flow cytometry statistical source data.
Flow cytometry statistical source data.
Flow cytometry statistical source data.
Flow cytometry statistical source data.
Flow cytometry statistical source data.
Flow cytometry statistical source data.
Flow cytometry statistical source data.
Flow cytometry statistical source data.
Acknowledgements
We thank all members of the laboratories of T.J.F. and M.E.K. for productive discussions regarding the work and help with bone marrow isolation. We thank L. Berg and M.J. Michaels for productive discussions regarding RUNX2. We thank L. Leach for laboratory management, A. Novak for animal colony management, G. Hedlund, H. Chu and D. Flebbe at the CU Anschutz Clinical Immunology Flow Core for their assistance in cell sorting, the CU Cancer Center Genomics Shared Resource (RRID: SCR_021984) for their help with sequencing/genomics and the CU Anschutz OLAR and the animal facility for their support. This work was funded, in part, by Department of Defense W81XWH-19-1-0196 (awarded to T.J.F.) and partly supported by the National Institutes of Health P30CA046934 awarded to Bioinformatics and Biostatistics Shared Resource Core (RRID: SCR_021983). Some figures were created with BioRender.com, as noted in the figure legends.
Extended data
Author contributions
K.R.D. conceptualized the studies, performed experiments and data analysis and wrote the paper. E.D. performed data analysis and provided expertise related to ATAC-seq and RNA-seq. M.D. performed LCMV experiments. J.C. conceptualized the studies and provided expertise related to the mouse CAR and leukemia models. M.Y. designed and generated DNA constructs. R.M.K. provided expertise related to the vaccine model. M.E.K. conceptualized the studies and provided expertise related to the mouse CAR and leukemia models. J.P.S.-B. conceptualized the studies, performed data analysis and provided expertise related to ATAC-seq and RNA-seq. T.J.F. conceptualized, supervised and acquired funding for the studies and wrote the paper. All authors contributed to the article and approved the submitted version.
Peer review
Peer review information
Nature Immunology thanks Hubert Hackl, Tuoqi Wu and the other, anonymous, reviewer(s) for their contribution to the peer review of this work. Primary Handling Editor: Nick Bernard, in collaboration with the Nature Immunology team.
Data availability
All RNA-seq and ATAC-seq data have been deposited at the Gene Expression Omnibus (GSE249734). All mapping of sequencing datasets was performed using the Mus musculus mm10 genome (https://www.ncbi.nlm.nih.gov/datasets/genome/GCF_000001635.20/). Source data are provided with this paper. Any other data related to the paper are available from the corresponding author upon request.
Code availability
All code was obtained from established pipelines as described in Methods.
Competing interests
The University of Colorado Anschutz Medical Campus has filed a patent application, PCT/US2024/054159, regarding compositions and methods of enhancing immune cell therapies by RUNX2 modulation, with K.R.D., J.P.S.-B. and T.J.F. listed as inventors. The other authors have no competing interests.
Footnotes
Publisher’s note Springer Nature remains neutral with regard to jurisdictional claims in published maps and institutional affiliations.
Extended data
is available for this paper at 10.1038/s41590-024-02034-1.
Supplementary information
The online version contains supplementary material available at 10.1038/s41590-024-02034-1.
References
- 1.Labanieh, L. & Mackall, C. L. CAR immune cells: design principles, resistance and the next generation. Nature614, 635–648 (2023). [DOI] [PubMed] [Google Scholar]
- 2.Sommermeyer, D. et al. Chimeric antigen receptor-modified T cells derived from defined CD8+ and CD4+ subsets confer superior antitumor reactivity in vivo. Leukemia30, 492–500 (2016). [DOI] [PMC free article] [PubMed] [Google Scholar]
- 3.Qin, H. et al. CAR T cells targeting BAFF-R can overcome CD19 antigen loss in B cell malignancies. Sci. Transl. Med.11, eaaw9414 (2019). [DOI] [PMC free article] [PubMed] [Google Scholar]
- 4.Aldoss, I. et al. Favorable activity and safety profile of memory-enriched CD19-targeted chimeric antigen receptor T-cell therapy in adults with high-risk relapsed/refractory ALL. Clin. Cancer Res.29, 742–753 (2023). [DOI] [PMC free article] [PubMed] [Google Scholar]
- 5.Alvanou, M. et al. Empowering the potential of CAR-T cell immunotherapies by epigenetic reprogramming. Cancers15, 1935 (2023). [DOI] [PMC free article] [PubMed] [Google Scholar]
- 6.Frias, A. B., Boi, S. K., Lan, X. & Youngblood, B. Epigenetic regulation of T cell adaptive immunity. Immunol. Rev.300, 9–21 (2021). [DOI] [PMC free article] [PubMed] [Google Scholar]
- 7.Wherry, E. J. & Kurachi, M. Molecular and cellular insights into T cell exhaustion. Nat. Rev. Immunol.15, 486–499 (2015). [DOI] [PMC free article] [PubMed] [Google Scholar]
- 8.Heitzeneder, S. et al. GPC2-CAR T cells tuned for low antigen density mediate potent activity against neuroblastoma without toxicity. Cancer Cell40, 53–69.e9 (2022). [DOI] [PMC free article] [PubMed]
- 9.Fry, T. J. et al. CD22-targeted CAR T cells induce remission in B-ALL that is naive or resistant to CD19-targeted CAR immunotherapy. Nat. Med.24, 20–28 (2018). [DOI] [PMC free article] [PubMed] [Google Scholar]
- 10.Majzner, R. G. et al. Tuning the antigen density requirement for CAR T-cell activity. Cancer Discov.10, 702–723 (2020). [DOI] [PMC free article] [PubMed] [Google Scholar]
- 11.Kumar, R. et al. Increased sensitivity of antigen-experienced T cells through the enrichment of oligomeric T cell receptor complexes. Immunity35, 375–387 (2011). [DOI] [PubMed] [Google Scholar]
- 12.Mehlhop-Williams, E. R. & Bevan, M. J. Memory CD8+ T cells exhibit increased antigen threshold requirements for recall proliferation. J. Exp. Med.211, 345–356 (2014). [DOI] [PMC free article] [PubMed] [Google Scholar]
- 13.Wang, X. et al. A transgene-encoded cell surface polypeptide for selection, in vivo tracking, and ablation of engineered cells. Blood118, 1255–1263 (2011). [DOI] [PMC free article] [PubMed] [Google Scholar]
- 14.Qin, H. et al. Murine pre-B-cell ALL induces T-cell dysfunction not fully reversed by introduction of a chimeric antigen receptor. Blood132, 1899–1910 (2018). [DOI] [PMC free article] [PubMed] [Google Scholar]
- 15.Jacoby, E. et al. CD19 CAR immune pressure induces B-precursor acute lymphoblastic leukaemia lineage switch exposing inherent leukaemic plasticity. Nat. Commun.7, 12320 (2016). [DOI] [PMC free article] [PubMed] [Google Scholar]
- 16.Yang, Y. et al. TCR engagement negatively affects CD8 but not CD4 CAR T cell expansion and leukemic clearance. Sci. Transl. Med.9, eaag1209 (2017). [DOI] [PMC free article] [PubMed] [Google Scholar]
- 17.Ivanova, D. L. et al. Vaccine adjuvant-elicited CD8+ T cell immunity is co-dependent on T-bet and FOXO1. Cell Rep.42, 112911 (2023). [DOI] [PMC free article] [PubMed] [Google Scholar]
- 18.Klarquist, J. et al. B cells promote CD8 T cell primary and memory responses to subunit vaccines. Cell Rep.36, 109591 (2021). [DOI] [PMC free article] [PubMed] [Google Scholar]
- 19.Klarquist, J. et al. Clonal expansion of vaccine-elicited T cells is independent of aerobic glycolysis. Sci. Immunol.3, eaas9822 (2018). [DOI] [PMC free article] [PubMed] [Google Scholar]
- 20.Badovinac, V. P., Haring, J. S. & Harty, J. T. Initial T cell receptor transgenic cell precursor frequency dictates critical aspects of the CD8+ T cell response to infection. Immunity26, 827–841 (2007). [DOI] [PMC free article] [PubMed] [Google Scholar]
- 21.Marzo, A. L. et al. Initial T cell frequency dictates memory CD8+ T cell lineage commitment. Nat. Immunol.6, 793–799 (2005). [DOI] [PMC free article] [PubMed] [Google Scholar]
- 22.Schep, A. N., Wu, B., Buenrostro, J. D. & Greenleaf, W. J. chromVAR: inferring transcription-factor-associated accessibility from single-cell epigenomic data. Nat. Methods14, 975–978 (2017). [DOI] [PMC free article] [PubMed] [Google Scholar]
- 23.Scott-Browne, J. P. et al. Dynamic changes in chromatin accessibility occur in CD8+ T cells responding to viral infection. Immunity45, 1327–1340 (2016). [DOI] [PMC free article] [PubMed] [Google Scholar]
- 24.Wherry, E. J. et al. Molecular signature of CD8+ T cell exhaustion during chronic viral infection. Immunity27, 670–684 (2007). [DOI] [PubMed] [Google Scholar]
- 25.Luckey, C. J. et al. Memory T and memory B cells share a transcriptional program of self-renewal with long-term hematopoietic stem cells. Proc. Natl Acad. Sci. USA103, 3304–3309 (2006). [DOI] [PMC free article] [PubMed] [Google Scholar]
- 26.Subramanian, A. et al. Gene set enrichment analysis: a knowledge-based approach for interpreting genome-wide expression profiles. Proc. Natl Acad. Sci. USA102, 15545–15550 (2005). [DOI] [PMC free article] [PubMed] [Google Scholar]
- 27.Giles, J. R. et al. Human epigenetic and transcriptional T cell differentiation atlas for identifying functional T cell-specific enhancers. Immunity55, 557–574 (2022). [DOI] [PMC free article] [PubMed] [Google Scholar]
- 28.Zhang, X. et al. Depletion of BATF in CAR-T cells enhances antitumor activity by inducing resistance against exhaustion and formation of central memory cells. Cancer Cell40, 1407–1422.e7 (2022). [DOI] [PubMed]
- 29.Seo, H. et al. BATF and IRF4 cooperate to counter exhaustion in tumor-infiltrating CAR T cells. Nat. Immunol.22, 983–995 (2021). [DOI] [PMC free article] [PubMed] [Google Scholar]
- 30.Lynn, R. C. et al. c-Jun overexpression in CAR T cells induces exhaustion resistance. Nature576, 293–300 (2019). [DOI] [PMC free article] [PubMed] [Google Scholar]
- 31.van der Heide, V., Humblin, E., Vaidya, A. & Kamphorst, A. O. Advancing beyond the twists and turns of T cell exhaustion in cancer. Sci. Transl. Med.14, eabo4997 (2022). [DOI] [PMC free article] [PubMed] [Google Scholar]
- 32.Chen, J. et al. NR4A transcription factors limit CAR T cell function in solid tumours. Nature567, 530–534 (2019). [DOI] [PMC free article] [PubMed] [Google Scholar]
- 33.Jung, I. Y. et al. BLIMP1 and NR4A3 transcription factors reciprocally regulate antitumor CAR T cell stemness and exhaustion. Sci. Transl. Med.14, eabn7336 (2022). [DOI] [PMC free article] [PubMed] [Google Scholar]
- 34.Bai, Z. et al. Single-cell antigen-specific landscape of CAR T infusion product identifies determinants of CD19-positive relapse in patients with ALL. Sci. Adv.8, eabj2820 (2022). [DOI] [PMC free article] [PubMed] [Google Scholar]
- 35.Chen, G. M. et al. Integrative bulk and single-cell profiling of premanufacture T-cell populations reveals factors mediating long-term persistence of CAR T-cell therapy. Cancer Discov.11, 2186–2199 (2021). [DOI] [PMC free article] [PubMed] [Google Scholar]
- 36.Deng, Q. et al. Characteristics of anti-CD19 CAR T cell infusion products associated with efficacy and toxicity in patients with large B cell lymphomas. Nat. Med.26, 1878–1887 (2020). [DOI] [PMC free article] [PubMed] [Google Scholar]
- 37.Kirouac, D. C. et al. Deconvolution of clinical variance in CAR-T cell pharmacology and response. Nat. Biotechnol.41, 1606–1617 (2023). [DOI] [PMC free article] [PubMed] [Google Scholar]
- 38.Sheih, A. et al. Clonal kinetics and single-cell transcriptional profiling of CAR-T cells in patients undergoing CD19 CAR-T immunotherapy. Nat. Commun.11, 219 (2020). [DOI] [PMC free article] [PubMed] [Google Scholar]
- 39.Chan, J. D. et al. FOXO1 enhances CAR T cell stemness, metabolic fitness and efficacy. Nature629, 201–210 (2024). [DOI] [PMC free article] [PubMed] [Google Scholar]
- 40.Doan, A. E. et al. FOXO1 is a master regulator of memory programming in CAR T cells. Nature629, 211–218 (2024). [DOI] [PMC free article] [PubMed] [Google Scholar]
- 41.Pennock, N. D., Gapin, L. & Kedl, R. M. IL-27 is required for shaping the magnitude, affinity distribution, and memory of T cells responding to subunit immunization. Proc. Natl Acad. Sci. USA111, 16472–16477 (2014). [DOI] [PMC free article] [PubMed] [Google Scholar]
- 42.Sanchez, P. J., McWilliams, J. A., Haluszczak, C., Yagita, H. & Kedl, R. M. Combined TLR/CD40 stimulation mediates potent cellular immunity by regulating dendritic cell expression of CD70 in vivo. J. Immunol.178, 1564–1572 (2007). [DOI] [PubMed] [Google Scholar]
- 43.Sanchez, P. J. & Kedl, R. M. An alternative signal 3: CD8+ T cell memory independent of IL-12 and type I IFN is dependent on CD27/OX40 signaling. Vaccine30, 1154–1161 (2012). [DOI] [PMC free article] [PubMed] [Google Scholar]
- 44.Ahonen, C. L. et al. Combined TLR and CD40 triggering induces potent CD8+ T cell expansion with variable dependence on type I IFN. J. Exp. Med.199, 775–784 (2004). [DOI] [PMC free article] [PubMed] [Google Scholar]
- 45.Quach, D. H. et al. Rejection resistant CD30.CAR-modified Epstein–Barr virus-specific T cells as an off-the-shelf platform for CD30+ lymphoma. Mol. Ther. Oncol.32, 200814 (2024). [DOI] [PMC free article] [PubMed] [Google Scholar]
- 46.Savoldo, B. et al. Epstein Barr virus specific cytotoxic T lymphocytes expressing the anti-CD30ζ artificial chimeric T-cell receptor for immunotherapy of Hodgkin disease. Blood110, 2620–2630 (2007). [DOI] [PMC free article] [PubMed] [Google Scholar]
- 47.Louis, C. U. et al. Antitumor activity and long-term fate of chimeric antigen receptor-positive T cells in patients with neuroblastoma. Blood118, 6050–6056 (2011). [DOI] [PMC free article] [PubMed] [Google Scholar]
- 48.Terakura, S. et al. Generation of CD19-chimeric antigen receptor modified CD8+ T cells derived from virus-specific central memory T cells. Blood119, 72–82 (2012). [DOI] [PMC free article] [PubMed] [Google Scholar]
- 49.Curran, K. J. et al. CD19 targeted allogeneic EBV-specific T cells for the treatment of relapsed ALL in pediatric patients post HSCT. Blood120, 353 (2012). [Google Scholar]
- 50.Minnie, S. A. et al. TIM-3+ CD8 T cells with a terminally exhausted phenotype retain functional capacity in hematological malignancies. Sci. Immunol.9, eadg1094 (2024). [DOI] [PMC free article] [PubMed] [Google Scholar]
- 51.Tandon, M. et al. RUNX2 mediates epigenetic silencing of the bone morphogenetic protein-3B (BMP-3B/GDF10) in lung cancer cells. Mol. Cancer11, 27 (2012). [DOI] [PMC free article] [PubMed] [Google Scholar]
- 52.Hojo, H. et al. RUNX2 regulates chromatin accessibility to direct the osteoblast program at neonatal stages. Cell Rep.40, 111315 (2022). [DOI] [PMC free article] [PubMed] [Google Scholar]
- 53.Wang, L. et al. TET enzymes regulate skeletal development through increasing chromatin accessibility of RUNX2 target genes. Nat. Commun.13, 4709 (2022). [DOI] [PMC free article] [PubMed] [Google Scholar]
- 54.Korinfskaya, S., Parameswaran, S., Weirauch, M. T. & Barski, A. RUNX transcription factors in T cells—what is beyond thymic development? Front. Immunol.12, 701924 (2021). [DOI] [PMC free article] [PubMed] [Google Scholar]
- 55.Gennert, D. G. et al. Dynamic chromatin regulatory landscape of human CAR T cell exhaustion. Proc. Natl Acad. Sci. USA118, e2104758118 (2021). [DOI] [PMC free article] [PubMed] [Google Scholar]
- 56.Kochenderfer, J. N., Yu, Z., Frasheri, D., Restifo, N. P. & Rosenberg, S. A. Adoptive transfer of syngeneic T cells transduced with a chimeric antigen receptor that recognizes murine CD19 can eradicate lymphoma and normal B cells. Blood116, 3875–3886 (2010). [DOI] [PMC free article] [PubMed] [Google Scholar]
- 57.Kochenderfer, J. N. et al. Construction and preclinical evaluation of an anti-CD19 chimeric antigen receptor. J. Immunother.32, 689–702 (2009). [DOI] [PMC free article] [PubMed] [Google Scholar]
- 58.Sanjana, N. E., Shalem, O. & Zhang, F. Improved vectors and genome-wide libraries for CRISPR screening. Nat. Methods11, 783–784 (2014). [DOI] [PMC free article] [PubMed] [Google Scholar]
- 59.Corces, M. R. et al. An improved ATAC-seq protocol reduces background and enables interrogation of frozen tissues. Nat. Methods14, 959–962 (2017). [DOI] [PMC free article] [PubMed] [Google Scholar]
- 60.Buenrostro, J. D. et al. Single-cell chromatin accessibility reveals principles of regulatory variation. Nature523, 486–490 (2015). [DOI] [PMC free article] [PubMed] [Google Scholar]
- 61.Wingett, S. W. & Andrews, S. FastQ Screen: a tool for multi-genome mapping and quality control. F1000Res.7, 1338 (2018). [DOI] [PMC free article] [PubMed] [Google Scholar]
- 62.Ewels, P., Magnusson, M., Lundin, S. & Käller, M. MultiQC: summarize analysis results for multiple tools and samples in a single report. Bioinformatics32, 3047–3048 (2016). [DOI] [PMC free article] [PubMed] [Google Scholar]
- 63.Dobin, A. et al. STAR: ultrafast universal RNA-seq aligner. Bioinformatics29, 15–21 (2013). [DOI] [PMC free article] [PubMed] [Google Scholar]
- 64.Love, M. I., Huber, W. & Anders, S. Moderated estimation of fold change and dispersion for RNA-seq data with DESeq2. Genome Biol.15, 550 (2014). [DOI] [PMC free article] [PubMed] [Google Scholar]
- 65.Zhu, A., Srivastava, A., Ibrahim, J. G., Patro, R. & Love, M. I. Nonparametric expression analysis using inferential replicate counts. Nucleic Acids Res.47, e105 (2019). [DOI] [PMC free article] [PubMed] [Google Scholar]
- 66.Zhou, Y. et al. Metascape provides a biologist-oriented resource for the analysis of systems-level datasets. Nat. Commun.10, 1523 (2019). [DOI] [PMC free article] [PubMed] [Google Scholar]
- 67.Krämer, A., Green, J., Pollard, J.Jr & Tugendreich, S. Causal analysis approaches in Ingenuity Pathway Analysis. Bioinformatics30, 523–530 (2014). [DOI] [PMC free article] [PubMed] [Google Scholar]
- 68.Mootha, V. K. et al. PGC-1α-responsive genes involved in oxidative phosphorylation are coordinately downregulated in human diabetes. Nat. Genet.34, 267–273 (2003). [DOI] [PubMed] [Google Scholar]
- 69.Quinlan, A. R. & Hall, I. M. BEDTools: a flexible suite of utilities for comparing genomic features. Bioinformatics26, 841–842 (2010). [DOI] [PMC free article] [PubMed] [Google Scholar]
- 70.Ritchie, M. E. et al. limma powers differential expression analyses for RNA-sequencing and microarray studies. Nucleic Acids Res.43, e47 (2015). [DOI] [PMC free article] [PubMed] [Google Scholar]
- 71.Heinz, S. et al. Simple combinations of lineage-determining transcription factors prime cis-regulatory elements required for macrophage and B cell identities. Mol. Cell38, 576–589 (2010). [DOI] [PMC free article] [PubMed] [Google Scholar]
- 72.Ramírez, F., Dündar, F., Diehl, S., Grüning, B. A. & Manke, T. deepTools: a flexible platform for exploring deep-sequencing data. Nucleic Acids Res.42, W187–W191 (2014). [DOI] [PMC free article] [PubMed] [Google Scholar]
Associated Data
This section collects any data citations, data availability statements, or supplementary materials included in this article.
Supplementary Materials
Flow cytometry statistical source data.
Flow cytometry statistical source data.
Flow cytometry statistical source data.
Flow cytometry statistical source data.
Flow cytometry/ELISA statistical source data.
Flow cytometry statistical source data.
Flow cytometry statistical source data.
Flow cytometry statistical source data.
Flow cytometry statistical source data.
Flow cytometry statistical source data.
Flow cytometry statistical source data.
Flow cytometry statistical source data.
Flow cytometry statistical source data.
Data Availability Statement
All RNA-seq and ATAC-seq data have been deposited at the Gene Expression Omnibus (GSE249734). All mapping of sequencing datasets was performed using the Mus musculus mm10 genome (https://www.ncbi.nlm.nih.gov/datasets/genome/GCF_000001635.20/). Source data are provided with this paper. Any other data related to the paper are available from the corresponding author upon request.
All code was obtained from established pipelines as described in Methods.


