Abstract
The pair PhoR1-PhoP1 is the third two-component system of the family PhoRP reported in M. xanthus. PhoR1 is a histidine kinase anchored to the membrane through a transmembrane domain located in the amino-terminal portion of the protein. As a result, 93% of the protein is located in the cytoplasm. This topology is unusual in the PhoR-type histidine kinases. PhoP1 is a response regulator with a helix-loop-helix motif typical of the DNA-binding proteins. Although the operon phoPR1 is expressed during vegetative growth, it peaks during development. The expression levels of this operon are higher in phosphate-containing media than in those in which the nutrient is absent. A deletion mutant in this system exhibits a delay in aggregation and the formation of fruiting bodies larger than those of the wild-type strain. The expression of the operon is autoregulated. This system is also partially responsible for the expression of Mg-independent acid and neutral phosphatases, but it is not required for the expression of alkaline phosphatases.
Myxococcus xanthus is a soil-dwelling bacterium that responds to nutrient depletion by entering a developmental program that culminates with the formation of colored macroscopic structures known as fruiting bodies. Inside the fruiting bodies, the rod-shaped cells differentiate into dormant myxospores (8). Myxospores are resistant to different stress conditions, such as heat, desiccation, or sonication.
During this developmental cycle, several two-component systems have been reported to function at different stages. FruA, a response regulator (20), and SdeK (22) and TodK (23), histidine kinases, are parts of two-component systems involved in the transmission of the C signal; AsgA is a histidine kinase that controls the expression of the proteases that originate the A factor (21); and two chemotactic homologue systems are required for aggregation (14, 32).
In addition, M. xanthus possesses a large family of eukaryotic-style protein serine/threonine kinases, whose number has been estimated to be over 26 by PCR and hybridization analyses (7, 34) and some of which have been demonstrated to be involved in development (19). As a counterpart, protein phosphatases are required to dephosphorylate the substrate phosphorylated by the kinases. Altogether, protein kinases and phosphatases function as biological switches that turn on and off the signal transduction pathways in which they participate by phosphorylation.
In our laboratory, in an attempt to identify and clone genes that encode proteins with phosphatase activities, five different DNA fragments have been cloned, which encode a permease for glycerol 3-phosphate, GlpT (16); a lipoprotein, MlpB (11); and two very similar two-component regulatory systems that have been designated PhoR2-PhoP2 and PhoR3-PhoP3 (17).
The fifth clone encodes a histidine kinase designated PhoR1, for which the response regulator has not been found. A strain harboring a disruption of phoR1 shows some defects in aggregation and sporulation (12).
In this report, we have identified PhoP1, the cognate response regulator for PhoR1, and characterized the PhoRP1 system. The resolution of the topology of the histidine kinase PhoR1 indicates that it is anchored to the membrane through the amino-terminal portion of the protein. Analysis of a phoPR1 deletion mutant has revealed that this system partially regulates the expression of its own operon and other genes, such as those for phosphatases, during development.
MATERIALS AND METHODS
Bacterial strains, growth conditions, and plasmids.
The M. xanthus and Escherichia coli strains, plasmids, and oligonucleotides used in this study are summarized in Tables 1, 2, and 3 respectively. M. xanthus strains were grown at 30°C in liquid CTT (6) with shaking. CTT agar plates contained 1.5% Bacto Agar (Difco). When necessary, kanamycin (40 μg/ml), X-Gal (5-bromo-4-chloro-3-indolyl-β-d-galactopyranoside; 40 μg/ml), or galactose (10 mg/ml) was added. E. coli strains were grown at 37°C in LB medium, which was supplemented with ampicillin (50 μg/ml), kanamycin (25 μg/ml), or X-Gal (25 μg/ml or 400 μg/ml) when needed.
TABLE 1.
Bacterial strains used in this study
| Bacterial strain | Genotype/phenotypea | Reference |
|---|---|---|
| E. coli JM109 | recA1 supE44 endA1 hsdR17 gyrA96 relA1 thi Δ(lac-proAB)F′[traD36 proAB+lacIqlacZ ΔM15] | 33 |
| M. xanthus | ||
| DZF1 | pilQ1 | 18 |
| JM12 | ΔphoR1-phoP1 Kms | This study |
| JM1ZY | phoP1-lacZ Kmr | This study |
| JM12ZY | ΔphoR1-phoP1 phoP1′-lacZ Kmr | This study |
Km, Kanamycin.
TABLE 2.
Plasmids used in this study
| Plasmid | Relevant features and/or genesa | Reference |
|---|---|---|
| pKG-3 | KmrgalK | 29 |
| pKM005 | lacZY | 13 |
| pATP6 | fusion pph1-lacZ | 28 |
| pUC7SKm(Pst−) | Kmr | S. Inouye, unpublished results |
| pKY481 | lacZY Kmr | 2 |
| TOP1 | Fusion phoR1-lacZ Kmr | This study |
| TOP2 | Fusion phoR1-lacZ Kmr | This study |
| TOP3 | Fusion phoR1-lacZ Kmr | This study |
| pJC1BElacK | Fusion phoP1-lacZ Kmr | This study |
| pJCΔR1P1KG3 | ΔphoR1-phoP1 Kmr | This study |
Km, kanamycin.
TABLE 3.
Oligonucleotides used in this study
| Oligonucleotide | Purpose | Sequence (5′→3′) |
|---|---|---|
| TOPR1K | Amplification of upstream region of phoR1 | CGGGTACCTGACGCTGACCGGTGG |
| TOPR1B1 | Amplification of upstream region of phoR1 | GCGGATCCATGGGCGGGGCGGCCTC |
| TOPR1B2 | Amplification of upstream region of phoR1 | AGGGATCCTTCGGCCCGTCGAGG |
| TOPR1B3 | Amplification of upstream region of phoR1 | GGGGATCCAGCAGGTCGAGCTGCC |
| RTP1C | Synthesis of cDNA from phoP1 | TCTCGCGCAGCCGCTTGATG |
| P1E3RC | Synthesis of cDNA from phoR1 | CTCCACCAGTTCGGACA |
| RTP1F | Amplification inside phoP1 | CATCCTGATTATCGAGGACG |
| RTP1R | Amplification inside phoP1 | ACTTCCTCGCCCTTCACACG |
| P1E15U | Amplification inside phoR1 | GTGATGGGCGTGCGCAG |
| P1E15R | Amplification inside phoR1 | CGCCATCGACTCGCTGC |
| P1EcoRI | Amplification of upstream region of phoP1 | GGGAATTCAGACTCCTTCCAGCCGCTCAT |
| P1BamHI | Amplification of upstream region of phoP1 | GGGGATCCTCGTCCTCGATAATCAGGAT |
Nucleic acid manipulations.
Routine molecular biology techniques were used (25). Plasmids were introduced into E. coli by transformation and into M. xanthus by electroporation by using the conditions reported by Kashefi and Hartzell (9). Total RNA was prepared by using the High Pure RNA Isolation kit provided by Roche. Samples were treated with the kit DNA-free (Ambion) to completely remove chromosomal DNA. The RNA was then subjected to reverse transcription (RT) using either primer RTP1C or P1E3RC (Table 3), and cDNAs thus obtained were amplified by 30 cycles of PCR with primers RTP1F and RTP1R, which anneal inside phoP1, or P1E15U and P1E15R, which anneal inside phoR1.
Construction of the deletion strain JM12.
Plasmid pJCΔR1P1KG3 was constructed for deletion of the entire operon phoP1-phoR1. A 770-bp fragment upstream of phoP1 was amplified by PCR using as primers oligonucleotides P1EcoRI and P1BamHI (Table 3). This fragment was ligated to pUC19 (33) after digestion with EcoRI and BamHI, and the resulting plasmid was designated pJC1BE. This plasmid was then digested with PstI and HindIII and ligated to a 953-bp fragment obtained after digestion of plasmid p1E (12) with the same enzymes. This fragment contained the region downstream of phoR1. The resulting plasmid, pΔP1R1, was finally digested with PstI, and the KG3 system (29) was ligated to obtain pJCΔR1P1KG3. The final construct, which contained 92% of phoR1-phoP1 replaced by the KG3 system, was linearized with HindIII and electroporated to the wild-type strain DZF1 to obtain a single deletion mutant for system 1. Kanamycin-resistant colonies that appeared after a 5-day incubation on CTT agar plates supplemented with this antibiotic were analyzed for the double crossing-over event by Southern blot hybridization. One of the positives was then grown on CTT with no antibiotic in order to remove the KG3 system as a result of a recombination event between the two yeast arms (29). Cells were then plated on medium with galactose to select those colonies that had lost the KG3 system. The final strain, sensitive to kanamycin, was also checked by Southern blot hybridization and named JM12.
Construction of strains harboring lacZ fusions.
A translational fusion between phoP1 and lacZ was obtained by ligation of a 6.2-kb fragment obtained after digestion of pKM005 with BamHI and SalI to plasmid pJC1BE (see above) digested with the same enzymes. The BamHI sites of phoP1 in pJC1BE and of lacZ in pKM005 are in the same frame. The resulting plasmid was then digested with SalI and ligated to a 1.3-kb SalI fragment obtained after digestion of pUC7Skm(Pst−), which carries a kanamycin resistance gene. The final plasmid, pJC1BElacK, was electroporated to the wild-type DZF1 and to the mutant JM12 to obtain strains JM1ZY and JM12ZY, respectively. Kanamycin-resistant colonies were analyzed for the crossing-over event by Southern blot hybridization.
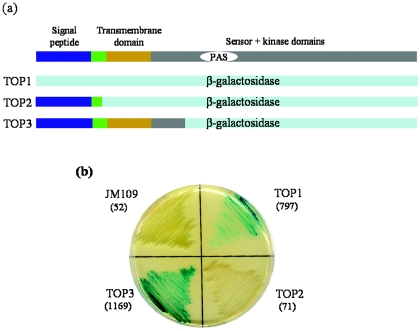
Three different translational fusions between phoR1 and lacZ were constructed to investigate the topology of PhoR1 in the membrane (for details of the fusions, see Fig. 2). Three different sets of PCR were performed by using primer TOPR1K in the forward direction and primers TOP1R1B1, TOP1R1B2, and TOP1R1B3 in the reverse direction. The last three oligonucleotides contain a BamHI site in phoR1 in frame with the lacZ gene in plasmid pKY481. The three PCR products were digested with BamHI and KpnI and ligated to plasmid pKY481 digested with the same enzymes. The three final plasmids, TOP1, TOP2, and TOP3, were used to transform E. coli and to assay for β-galactosidase activity in the bacterium.
FIG. 2.
Transmembrane topology of PhoR1 analyzed by lacZ protein fusions. (a) Domain structures of the chimeric proteins resulting from construction of three in-frame translational fusions between different sites of phoR1 and lacZ compared to that of PhoR1. (b) β-Galactosidase activities of E. coli strains harboring each translational fusion. The cells were grown on LB agar medium containing X-Gal. The numbers in parentheses indicate the β-galactosidase specific activity (pmol of o-nitrophenol produced per min and mg of protein) of each strain.
Developmental conditions.
To induce development, two different media were used, TPM (10) and MCM (24). Solid MCM was prepared with 8 g/liter agarose. The main difference between these two media is the absence of a phosphate source in MCM. Cells grown in CTT were centrifuged and concentrated to 4.5 × 10⁹ cells per ml in TM buffer (10 mM Tris-HCl [pH 7.6], 1 mM MgSO4). For analysis of aggregation, a unique 10-μl drop was spotted in the center of a 5.5-cm petri dish. For quantification of spores, 200 μl of concentrated cells was spotted on a 9-cm petri dish containing the appropriate medium. Development was allowed to proceed for 48 h. Cells were then harvested, and rod-shaped cells were disrupted by sonication. Myxospores were counted in a Petroff-Hausser chamber.
Determination of enzymatic activities.
To obtain cell extracts during vegetative growth, cells were cultured in rich medium and aliquots were withdrawn at different growth stages. The cells were then centrifuged, washed in TM buffer, concentrated at least 10-fold, and disrupted by sonication. For the preparation of cell extract during development, 200 μl of concentrated cultures containing 4.5 × 10⁹ cells per ml were spotted on either MCM or TPM. After incubation, fruiting bodies were harvested by scraping the surfaces of the plates, resuspended in 200 μl of glass beads equilibrated in TM buffer, and sonicated as described previously (19). The amounts of protein in the extracts were determined by using the Bio-Rad protein assay. Phosphatase activities were determined as described by Weinberg and Zusman (31) using p-nitrophenyl phosphate as a substrate. Specific activity is expressed as nmol of p-nitrophenol produced per min and mg of protein. β-Galactosidase activity was determined as described by Kroos et al. (10). Specific activity is expressed as pmol of o-nitrophenol produced per min and mg of protein when determined in E. coli and as nmol of o-nitrophenol produced per min and mg of protein when determined in M. xanthus. When required, E. coli membranes were separated from the soluble fraction by ultracentrifugation at 100,000 × g for 30 min. All the results shown are the averages of at least three experiments.
Nucleotide sequence accession numbers.
The nucleotide sequence of the operon phoP1-phoR1 has been deposited in EMBL with accession number AJ133131.
RESULTS
Sequence analysis of the phoR1 region.
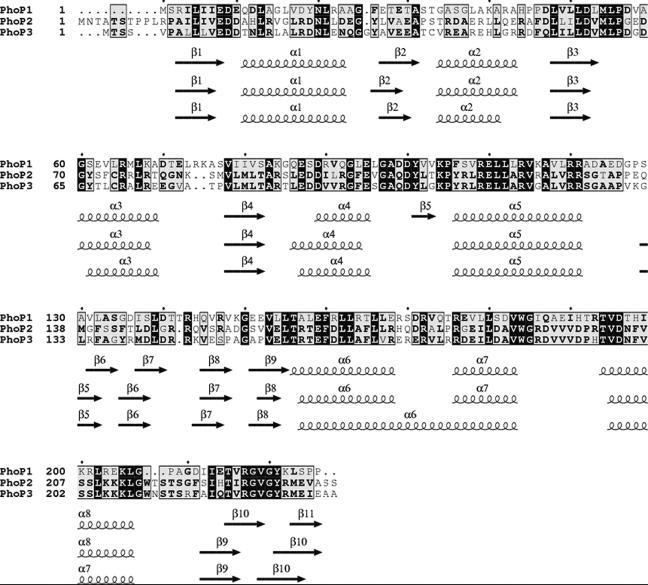
The recent sequencing of the M. xanthus genome by The Institute for Genomic Research-Monsanto has allowed the analysis of genes surrounding phoR1. This analysis has revealed that the termination codon of a gene in which 96% of the codons have G or C at the third position is located 13 bp upstream of phoR1. The start codon was chosen based on the codon usage and the presence of a putative ribosome-binding site (GAGAGGG) five bases upstream of an ATG. This gene encodes a protein with 226 amino acids and a deduced molecular weight of 24,778. The protein shows striking similarities to response regulators that participate in the expression of the phosphate regulon in other bacteria, and it has been designated PhoP1. PhoP1 shows strong identity with the other PhoP proteins so far reported in M. xanthus, PhoP2 and PhoP3 (Fig. 1).
FIG. 1.
Sequence alignment of response regulators PhoP1, PhoP2, and PhoP3 from M. xanthus. Invariant residues in the three proteins are shown on a black background, whereas conserved residues are shaded in grey. Boldface letters indicate similarities in at least two sequences. The predicted secondary structure for each response regulator is shown under each row of alignments. Alpha helices and beta strands are represented as loops and arrows, respectively.
PhoP1 is a cytoplasmic protein that contains two domains. All the amino acids conserved in the response regulators are located in the amino-terminal region. The carboxyl-terminus domain contains a helix-loop-helix motif typical of the DNA-binding proteins of the family OmpR/PhoB (15), with helix α7 in PhoP1 and PhoP2 and α6 in PhoP3 corresponding to the stabilizing helix and α8 in PhoP1 and PhoP2 and α7 in PhoP3 corresponding to the recognition helix. As can be observed, the recognition helices for PhoP2 and PhoP3 are identical, while they share 42% identity with that of PhoP1 (Fig. 1). This helix-loop-helix structure implies that these three PhoP response regulators function as transcriptional regulators.
Topology of PhoR1.
PhoR1 shows a putative signal peptide in the amino-terminal region, with a cleavage site between residues 24 and 25 and one putative transmembrane domain from residues 31 to 53 on servers such as TMHMM (http://www.cbs.dtu.dk/services/TMHMM-2.0/). Other servers, such as DAS (http://www.sbc.su.se/∼miklos/DAS/), provided a much shorter hydrophobic region, from residues 31 to 44 (12). In order to confirm whether PhoR1 is soluble or anchored to the membrane, different translational fusions between phoR1 and lacZ have been constructed (Fig. 2a). In the first, the fusion was constructed just at the start codon for phoR1. In this construction (TOP1), the resulting β-galactosidase protein lacked the signal peptide and should be located in the cytoplasm as a soluble protein. In the second fusion (TOP2), codons for the amino acids between the signal peptide and the transmembrane domain were fused in frame to the lacZ gene. This protein should be located in the periplasmic space. In the third construction (TOP3), the fusion was performed at codons for amino acids located after the region that encodes the transmembrane domain. The chimeric protein would be anchored to the membrane, with the portion for β-galactosidase located in the cytoplasm. Since β-galactosidase must be located in the cytoplasm to be active (4), fusions TOP1 and TOP3 should exhibit activity, but TOP2 should not. Qualitative and quantitative results of β-galactosidase activity in E. coli strains harboring plasmids containing these three fusions are shown in Fig. 2b. As can be observed, fusion TOP2 showed β-galactosidase activity levels very similar to that of a strain with no lacZ gene, while in fusions TOP1 and TOP3, activity increased 15- and 22-fold, respectively. In addition, cytoplasm and membrane fractions from cells harboring TOP1 and TOP3 fusions were obtained, and the β-galactosidase activity in each fraction was determined. In the case of the TOP1 fusion, 91% of the activity was located in the soluble fraction, while in TOP3, 82% of the activity was placed in the membrane fraction. This result indicates that PhoR1 is anchored to the membrane, with 93% of the protein located in the cytoplasm.
The two genes phoP1 and phoR1 are coexpressed.
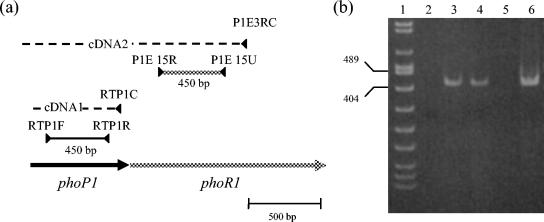
If PhoP1 and PhoR1 are part of the same two-component system, they should be expressed at the same time. In order to analyze whether phoP1 and phoR1 are expressed in the same mRNA, total RNA from cells during vegetative growth was used as a template for RT-PCR experiments. Oligonucleotide P1E3RC, which anneals at the phoR1 gene (Fig. 3a), was used to synthesize the cDNA. Two sets of PCR were performed using this cDNA as a template, one with oligonucleotides RTP1F and RTP1R, which anneal inside phoP1, as primers and another with primers P1E15U and P1E15R, which anneal inside phoR1 (Fig. 3a). As a control, a second cDNA was synthesized by using oligonucleotide RTP1C, which anneals inside phoP1, as a primer. In this case, only oligonucleotides RTP1F and RTP1R were used as primers for PCR. As shown in Fig. 3b, all the reactions amplified one fragment with the expected size (lanes 3, 4, and 6). On the other hand, reactions in which no cDNA was previously synthesized from the RNA sample yielded no PCR product (lanes 2 and 5). This result indicates that the two genes are coexpressed, forming parts of the same operon.
FIG. 3.
phoP1 and phoR1 are in the same operon. (a) Strategy used to study the coexpression of the two genes. (b) RT-PCR experiment. Lane 1, DNA molecular size markers VIII (Roche); the sizes in base pairs of only two of the fragments are represented. Lanes 2 to 4, PCR products obtained with primers RTP1F and RTP1R using total RNA as a template (lane 2) and cDNAs prepared with RTP1C (lane 3) and P1E3RC (lane 4). Lanes 5 and 6, PCR products obtained with primers P1E15U and P1E15R using as templates total RNA and cDNA synthesized with P1E3RC, respectively.
Expression time of the operon.
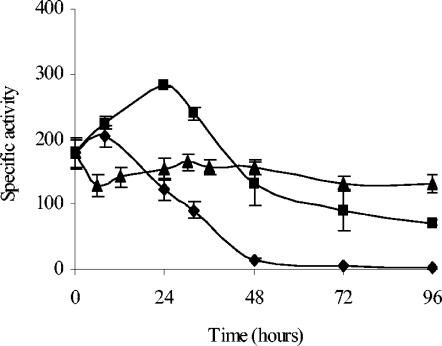
In order to analyze the expression time of the operon, an M. xanthus strain harboring a translational fusion between the first codons of phoP1 and lacZ from E. coli was constructed as described in Materials and Methods. The plasmid pJC1BElacK (Table 2) integrates into the M. xanthus chromosome by a single homologous recombination event, so a wild-type copy of the phoPR1 operon remains in the strain thus constructed. β-Galactosidase activity in this strain, JM1ZY, was determined in two different starvation media, MCM and TPM, in which the bacteria enter the developmental cycle, and in the rich medium CTT, in which cells grow. This analysis has revealed that the operon is expressed at high levels during vegetative growth on CTT. The levels of expression remain almost constant during growth (Fig. 4), although a slight increase in β-galactosidase activity can be observed when cells enter the stationary phase. During development, a peak of expression is obtained several hours after starvation (Fig. 4). On MCM, a medium with no phosphate, the maximum was reached at 8 h, and activity decreased after that time to undetectable levels at 48 h. On TPM, a medium that contains phosphate, the levels of activity were higher, reaching a maximum at 24 h. Although the activity decreased after that time, it was still quite high even after 96 h of starvation (Fig. 4). It is interesting that the expression level of the operon was higher in a medium with phosphate than in a medium with no phosphate.
FIG. 4.
Expression time of the phoPR1 operon. β-Galactosidase specific activity (nmol of o-nitrophenol produced per min and mg of protein) of the JM1ZY strain during vegetative growth in CTT medium (▴) and development on TPM (▪) and MCM (⧫). The error bars indicate standard deviations.
Phenotype of a deletion mutant in the system PhoRP1.
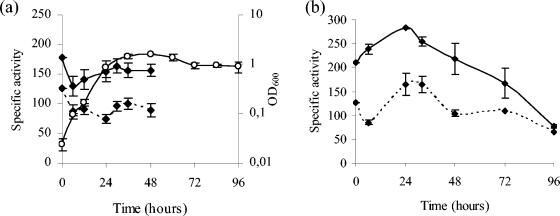
A single-deletion mutant for the PhoRP1 system (strain JM12) was constructed as described in Materials and Methods. No differences in the growth curve were observed when strains JM12 and DZF1 were cultured in CTT medium. The generation time and cell density of the mutant were identical to those of the wild-type strain. Moreover, death phase also occurred with the same slope (data not shown). (For a typical M. xanthus growth curve, see Fig. 7a.)
FIG. 7.
System PhoRP1 regulates its own expression. β-Galactosidase specific activities (nmol of o-nitrophenol produced per min and mg of protein) of strain JM12ZY (phoRP mutant genetic background; dashed lines) compared to that of JM1ZY (wild-type genetic background; solid lines) during growth in CTT medium (a) and development on TPM (b). The growth curve of these strains in CTT medium is shown in panel a (solid line with open circles).
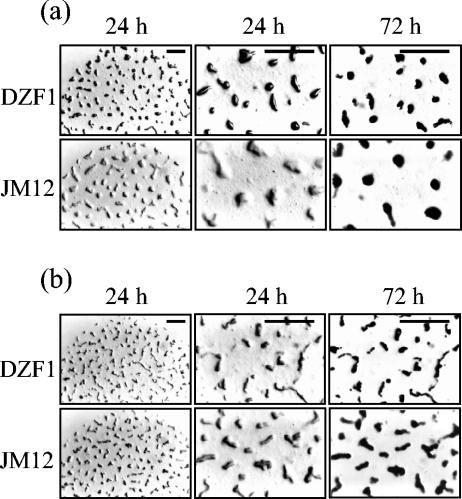
We have also analyzed the phenotype of the mutant during development on TPM and MCM. As can be observed in Fig. 5a, strain JM12 delayed aggregation on TPM. However, fruiting bodies of the mutant were as perfectly packed as those of the wild-type strain after 72 h of starvation, although the number of fruiting bodies originating in the spots was much higher in the wild type than in the JM12 strain (Fig. 5a). This lower number of fruiting bodies in the mutant strain was correlated with larger size (Fig. 5a). The fruiting bodies of the mutant strain were almost twice the size of those of the wild-type strain. The numbers of myxospores were very similar in the two strains. Thus, after 48 h of development, the yield of myxospores was 1.9 × 10⁷ spores per plate in the wild-type strain and 1.5 × 10⁷ spores per plate in the mutant.
FIG. 5.
Morphologies of fruiting bodies of M. xanthus strains DZF1 and JM12 on TPM (a) and MCM (b) starvation media. The bars represent 1 mm.
On MCM, the phenotype of the mutant strain is less dramatic than on TPM. Thus, JM12 did not delay aggregation, although the fruiting bodies were also larger than those of the wild-type strain (Fig. 5b).
Role of the phoPR1 operon in phosphatase expression.
Since the operon phoPR1 was cloned by its ability to originate blue E. coli colonies on LB medium with 5-bromo-4-chloro-3-indolyl phosphate, we analyzed the possibility that this system could also regulate the expression of phosphatases in M. xanthus. Five different phosphatase activities have been reported in this bacterium (31), two during growth (Mg-dependent acid and alkaline phosphatases) and three during development (Mg-independent acid, neutral, and alkaline phosphatases).
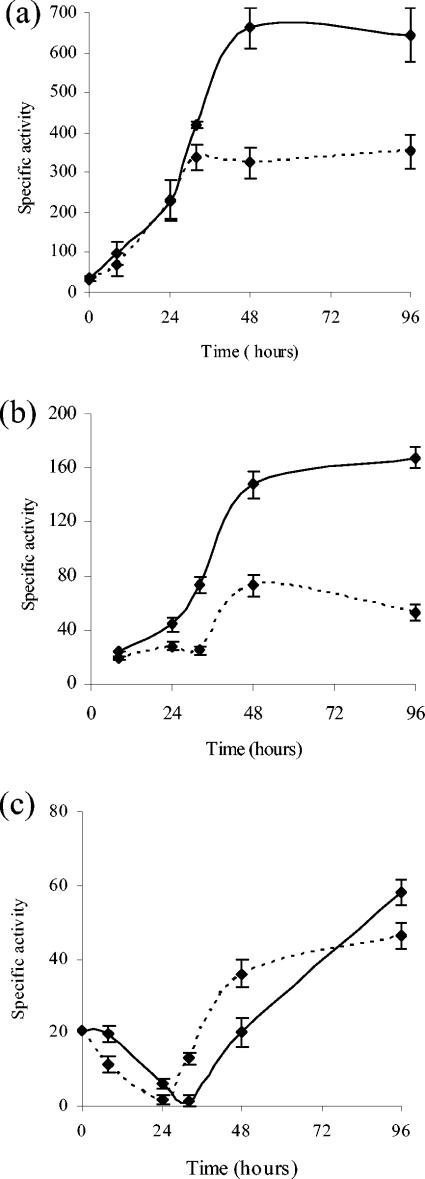
No significant differences in activity levels were detected for any of these five phosphatases when strains DZF1 and JM12 were compared during vegetative growth and development on TPM (data not shown). However, we did observe that Mg-independent acid and neutral phosphatase activities exhibited lower levels in the mutant than in the wild-type strain on MCM (Fig. 6a and b). Alkaline phosphatase showed similar levels in the two strains (Fig. 6c). Although activities of Mg-independent acid and neutral phosphatases in the mutant were lower than those of the wild-type strain, high levels still remained in the JM12 strain. This result was not surprising, since systems 2 and 3 are also responsible for the expression of these phosphatases (17), and both are present in the JM12 strain.
FIG. 6.
Determination of phosphatase activities (nmol of p-nitrophenol produced per min and mg of protein) in M. xanthus strains DZF1 (solid lines) and JM12 (dashed lines) on MCM starvation medium. Results for Mg-independent acid (a), neutral (b), and alkaline (c) phosphatases at different times of development are shown. The error bars indicate standard deviations.
Furthermore, we have analyzed whether pph1, the only cloned gene that encodes a protein phosphatase in M. xanthus, was under the control of this system. For this purpose, plasmid pATP6 (28), which contains a fusion between the first codons of pph1 and lacZ, was electroporated into strain JM12. The strain thus constructed was analyzed for β-galactosidase activity and compared with the activity of a wild-type strain harboring the same fusion. The results revealed that this gene is not under the control of system 1, since no significant difference in β-galactosidase activity was observed in the JM12 strain compared to the wild-type strain (data not shown).
The PhoRP1 system regulates its own expression.
Plasmid pJC1BElacK (Table 2), harboring a fusion between phoP1 and lacZ, was introduced into the mutant strain JM12 to investigate whether this PhoRP system regulates its own expression. When the strain thus obtained, JM12ZY, was analyzed for β-galactosidase activity during vegetative growth in CTT medium and development on TPM, it was found that the levels of expression of the operon were reduced to 50 to 60% in the phoRP mutant genetic background (Fig. 7). The peak of maximum expression observed at 24 h of development still remained in the mutant strain (Fig. 7b). Nevertheless, β-galactosidase activity was not completely abolished in the mutant.
DISCUSSION
Three two-component systems of the family PhoRP have been reported in M. xanthus. In systems designated 2 and 3, both histidine kinases and response regulators have been identified (17). Conversely, only the histidine kinase of system 1 has been reported (12). Here, along with the identification of the cognate response regulator for the histidine kinase PhoR1, we have characterized the PhoRP1 system.
Although systems 1 and 2 were cloned by their ability to induce the expression of E. coli phosphatases, and system 3 was cloned because of its high identity to system 2 (17), the three systems show striking differences. The three histidine kinases have a signal peptide in the amino-terminal region and a transmembrane domain. The transmembrane domain found in PhoR2 and PhoR3 is located in the middle of the protein, which suggests that the amino-terminal domain faces the periplasmic space. On the other hand, the transmembrane domain of PhoR1 is located in the N-terminal portion of the protein. As a consequence, the protein is anchored to the membrane but with most of the protein located in the cytoplasm (Fig. 2). This difference seems to indicate that the natures and locations of the signals to which these systems respond most likely will not be the same. In addition, the presence of one PAS module (27) in the sensor region of PhoR1 (residues 111 to 174) gives some clues about the kind of stimulus that might activate this kinase. Since system 1 increases its expression upon starvation (Fig. 4) and a deletion mutant exhibits several defects during aggregation, it is tempting to speculate that PhoR1 might detect low energy levels in the cytosol through the PAS domain to activate the expression of genes involved in development. Alternatively, PhoR1 autophosphorylation could be inhibited by reduced quinones, as has been recently demonstrated in PhoR from Bacillus subtilis (26).
Some differences can be observed in the behavior of the JM12 deletion mutant during development compared to that of the wild type (Fig. 5). Although the differences are small, it should be taken into consideration that systems 2 and 3 remain in the mutant. These systems might take over in part some of the functions of the system that has been deleted. The phenotype observed must be the result of the reduction in the expression levels of several genes, including those that encode phosphatases and the phoPR1 operon (Fig. 6 and 7).
The pho regulon of M. xanthus seems to differ from that of other organisms, such as Bacillus subtilis or E. coli (1, 30). Thus, while the expression of alkaline phosphatases in these bacteria is dependent on the PhoRP system during phosphate starvation, neither of the two M. xanthus alkaline phosphatase activities is dependent on any of the three PhoRP systems (17) (Fig. 6). On the other hand, the levels of expression of the operon phoPR1 are higher in media with phosphate than in those in which this nutrient is lacking. In Bacillus and E. coli, the expression levels of the two-component system operon that controls the pho regulon increases upon phosphate starvation (1, 30).
In some ways, M. xanthus PhoRP1 resembles the Salmonella PhoPQ system. PhoPQ, initially identified as controlling the expression of a nonspecific acid phosphatase, responds to either Mg2+ or Ca2+ and controls virulence in the bacterium (5). As shown in Results, PhoRP1 is involved in the expression of acid and neutral phosphatases, and its expression does not increase significantly upon phosphate starvation but upon general nutrient depletion. In addition, the fact that a phoPR1 deletion mutant exhibits several defects in development implies that this system might control the expression of genes that are not related to phosphate assimilation.
The M. xanthus pho regulon exhibits much higher complexity than its homologues in other organisms. This complexity is reflected by the fact that five phosphatase activities have been reported in the bacterium (31); three two-component systems are involved in the control of this regulon, and these three systems are also involved in aggregation and differentiation (reference 17 and this study). In addition to M. xanthus, a role in morphogenesis has recently been found for two-component systems of the pho regulon in Caulobacter crescentus. In that bacterium, it has been reported that phoB is required for stalk elongation in response to phosphate starvation (3).
We are currently concentrating our efforts on the proteomic analysis of single- and double-deletion mutants in order to examine other genes that might be under the control of the three M. xanthus PhoRP systems during development. Furthermore, we are trying to elucidate whether cross-regulation between the three PhoRP systems occurs. These experiments will shed some light on development and the pho regulon in M. xanthus.
Acknowledgments
We are very grateful to Sumiko Inouye (University of Medicine and Dentistry of New Jersey), Anke Treuner-Lange (Forschungszentrum der Universität Giessen, Giessen, Germany), and David Zusman (University of California—Berkeley) for providing plasmids and strains. We also thank The Institute for Genomic Research-Monsanto for permission to use and deposit in the EMBL database the sequences of the M. xanthus genome used in this study prior to publication.
This work has been supported by the Ministerio de Ciencia y Tecnología (grant numbers BMC2002-03012 and BMC2003-02038; 70% financed by FEDER), Spain. J.C.-L. and A.M.-M. are predoctoral fellows from the Ministerio de Educación y Cultura, Spain. R.G.-H. is a predoctoral fellow from Plan Propio, Universidad de Granada.
REFERENCES
- 1.Antelmann, H., C. Scharfand, and M. Hecker. 2000. Phosphate starvation-inducible proteins of Bacillus subtilis: proteomics and transcriptional analysis. J. Bacteriol. 182:4478-4490. [DOI] [PMC free article] [PubMed] [Google Scholar]
- 2.Cho, K., and D. R. Zusman. 1999. AsgD, a new two-component regulator required for A-signalling and nutrient sensing during early development of Myxococcus xanthus. Mol. Microbiol. 34:268-281. [DOI] [PubMed] [Google Scholar]
- 3.Gonin, M., F. M. Quardokus, D. O'Donnol, J. Maddock, and Y. V. Brun. 2000. Regulation of stalk elongation by phosphate in Caulobacter crescentus. J. Bacteriol. 182:337-347. [DOI] [PMC free article] [PubMed] [Google Scholar]
- 4.Gött, P., and W. Boos. 1988. The transmembrane topology of the sn-glycerol 3-phosphate permease of Escherichia coli analysed by phoA and lacZ protein fusions. Mol. Microbiol. 2:655-663. [DOI] [PubMed] [Google Scholar]
- 5.Groisman, E. A. 2001. The pleiotropic two-component regulatory system PhoP-PhoQ. J. Bacteriol. 183:1835-1842. [DOI] [PMC free article] [PubMed] [Google Scholar]
- 6.Hodgkin, J., and D. Kaiser. 1977. Cell-to-cell stimulation of movement in nonmotile mutants of Myxococcus xanthus. Proc. Natl. Acad. Sci. USA 74:2938-2942. [DOI] [PMC free article] [PubMed] [Google Scholar]
- 7.Inouye, S., R. Jain, T. Ueki, H. Nariya, C.-Y. Xu, M.-Y. Hsu, B. A. Fernández-Luque, J. Muñoz-Dorado, E. Farez-Vidal, and M. Inouye. 2000. A large family of eukaryotic-like Ser/Thr kinases of Myxococcus xanthus, a developmental bacterium. Microb. Comp. Genom. 5:103-120. [DOI] [PubMed] [Google Scholar]
- 8.Kaiser, D. 2003. Coupling cell movement to multicellular development in myxobacteria. Nat. Rev. Microbiol. 1:45-54. [DOI] [PubMed] [Google Scholar]
- 9.Kashefi, K., and P. L. Hartzell. 1995. Genetic suppression and phenotypic masking of a Myxococcus xanthus frzF defect. Mol. Microbiol. 15:483-494. [DOI] [PubMed] [Google Scholar]
- 10.Kroos, L., A. Kuspa, and D. Kaiser. 1986. A global analysis of developmentally regulated genes in Myxococcus xanthus. Dev. Biol. 117:252-266. [DOI] [PubMed] [Google Scholar]
- 11.Martínez-Cañamero, M., C. Ortiz-Codorniu, A. L. Extremera, J. Muñoz-Dorado, and J. M. Arias. 2002. mlpB, a gene encoding a new lipoprotein in Myxococcus xanthus. J. Appl. Microbiol. 92:134-139. [DOI] [PubMed] [Google Scholar]
- 12.Martínez-Cañamero, M., C. Ortiz-Codorniu, A. L. Extremera, J. Muñoz-Dorado, and J. M. Arias. 2003. phoR1, a gene encoding a new histidine protein kinase in Myxococcus xanthus. Antonie Leeuwenhoek 83:361-368. [DOI] [PubMed] [Google Scholar]
- 13.Masui, Y., J. Coleman, and M. Inouye. 1983. Multipurpose expression cloning vehicles in Escherichia coli, p. 15-32. In M. Inouye (ed.), Experimental manipulation of gene expression. Academic Press, New York, N.Y.
- 14.McBride, M. J., R. A. Weinberg, and D. R. Zusman. 1989. “Frizzy” aggregation genes of the gliding bacterium Myxococcus xanthus show sequence similarities to the chemotaxis genes of enteric bacteria. Proc. Natl. Acad. Sci. USA 86:424-428. [DOI] [PMC free article] [PubMed] [Google Scholar]
- 15.Mizuno, T., and I. Tanaka. 1997. Structure of the DNA-binding domain of the OmpR family of response regulators. Mol. Microbiol. 24:665-670. [DOI] [PubMed] [Google Scholar]
- 16.Moraleda-Muñoz, A., J. Carrero-Lérida, A. L. Extremera, J. M. Arias, and J. Muñoz-Dorado. 2001. Glycerol 3-phosphate inhibits swarming and aggregation of Myxococcus xanthus. J. Bacteriol. 183:6135-6139. [DOI] [PMC free article] [PubMed] [Google Scholar]
- 17.Moraleda-Muñoz, A., J. Carrero-Lérida, J. Pérez, and J. Muñoz-Dorado. 2003. Role of two novel two-component regulatory systems in development and phosphatase expression in Myxococcus xanthus. J. Bacteriol. 185:1376-1383. [DOI] [PMC free article] [PubMed] [Google Scholar]
- 18.Morrison, C. E., and D. R. Zusman. 1979. Myxococcus xanthus mutants with temperature-sensitive stage-specific defects: evidence for independent pathways in development. J. Bacteriol. 155:317-329. [DOI] [PMC free article] [PubMed] [Google Scholar]
- 19.Muñoz-Dorado, J., S. Inouye, and M. Inouye. 1991. A gene encoding a serine/threonine kinase is required for normal development of Myxococcus xanthus, a Gram-negative bacterium. Cell 67:995-1006. [DOI] [PubMed] [Google Scholar]
- 20.Ogawa, M., S. Fujitani, X. Mao, S. Inouye, and T. Komano. 1996. FruA, a putative transcription factor essential for development of Myxococcus xanthus. Mol. Microbiol. 24:839-850. [DOI] [PubMed] [Google Scholar]
- 21.Plamann, L., Y. Li, B. Cantwell, and J. Mayor. 1995. The Myxococcus xanthus asgA gene encodes a novel signal transduction protein required for multicellular development. J. Bacteriol. 177:2014-2020. [DOI] [PMC free article] [PubMed] [Google Scholar]
- 22.Pollack, J. S., and M. Singer. 2001. SdeK, a histidine kinase required for Myxococcus xanthus development. J. Bacteriol. 183:3589-3596. [DOI] [PMC free article] [PubMed] [Google Scholar]
- 23.Rasmussen, A. A., and L. Søgaard-Andersen. 2003. TodK, a putative histidine protein kinase, regulates timing of fruiting body morphogenesis in Myxococcus xanthus. J. Bacteriol. 185:5452-5464. [DOI] [PMC free article] [PubMed] [Google Scholar]
- 24.Rosenbluh, A., and E. Rosenberg. 1989. Sporulation of Myxococcus xanthus in liquid shake flask cultures. J. Bacteriol. 171:4521-4524. [DOI] [PMC free article] [PubMed] [Google Scholar]
- 25.Sambrook, J., and D. W. Russell. 2001. Molecular cloning: a laboratory manual, 3rd ed. Cold Spring Harbor Laboratory Press, Cold Spring Harbor, N.Y.
- 26.Schau, M., A. Eldakak, and F. M. Hulett. 2004. Terminal oxidases are essential to bypass the requirement for ResD for full Pho induction in Bacillus subtilis. J. Bacteriol. 186:8424-8432. [DOI] [PMC free article] [PubMed] [Google Scholar]
- 27.Taylor, B. L., and I. B. Zhulin. 1999. PAS domains: internal sensors of oxygen, redox potential, and light. Microbiol. Mol. Biol. Rev. 63:479-506. [DOI] [PMC free article] [PubMed] [Google Scholar]
- 28.Treuner-Lange, A., M. J. Ward, and D. R. Zusman. 2001. Pph1 from Myxococcus xanthus is a protein phosphatase involved in vegetative growth and development. Mol. Microbiol. 40:126-140. [DOI] [PubMed] [Google Scholar]
- 29.Ueki, T., S. Inouye, and M. Inouye. 1996. Positive-negative KG cassettes for construction of multi-gene deletions using a single drug marker. Gene 183:153-157. [DOI] [PubMed] [Google Scholar]
- 30.Wanner, B. L. 1996. Phosphorus assimilation and control of the phosphate regulon, p. 1357-1381. In F. C. Neidhardt, R. Curtiss III, J. L. Ingraham, E. C. C. Lin, K. B. Low, B. Magasanik, W. S. Reznikoff, M. Riley, M. Schaechter, and H. E. Umbarger (ed.), Escherichia coli and Salmonella: cellular and molecular biology. ASM Press, Washington, D.C.
- 31.Weinberg, R. A., and D. R. Zusman. 1990. Alkaline, acid and neutral phosphatase activities are induced during development in Myxococcus xanthus. J. Bacteriol. 172:2294-2302. [DOI] [PMC free article] [PubMed] [Google Scholar]
- 32.Yang, Z., Y. Geng, D. Xu, H. B. Kaplan, and W. Shi. 1998. A new set of chemotaxis homologs is essential for Myxococcus xanthus social motility. Mol. Microbiol. 30:1123-1130. [DOI] [PubMed] [Google Scholar]
- 33.Yanisch-Perron, C., J. Vieira, and J. Messing. 1985. Improved M13 phage cloning vectors and host strains: nucleotide sequences of the M13mp18 and pUC19 vectors. Gene 33:103-119. [DOI] [PubMed] [Google Scholar]
- 34.Zhang, W., J. Muñoz-Dorado, M. Inouye, and S. Inouye. 1992. Identification of a putative eukaryotic-like protein kinase family in the developmental bacterium Myxococcus xanthus. J. Bacteriol. 174:5450-5453. [DOI] [PMC free article] [PubMed] [Google Scholar]


