Abstract
Glutamine metabolism is pivotal in cancer biology, profoundly influencing tumor growth, proliferation, and resistance to therapies. Cancer cells often exhibit an elevated dependence on glutamine for essential functions such as energy production, biosynthesis of macromolecules, and maintenance of redox balance. Moreover, altered glutamine metabolism can contribute to the formation of an immune-suppressive tumor microenvironment characterized by reduced immune cell infiltration and activity. In this study on lung adenocarcinoma, we employed consensus clustering and applied 101 types of machine learning methods to systematically identify key genes associated with glutamine metabolism and develop a risk model. This comprehensive approach provided a clearer understanding of how glutamine metabolism associates with cancer progression and patient outcomes. Notably, we constructed a robust nomogram based on clinical information and patient risk scores, which achieved a stable area under the curve (AUC) greater than 0.8 for predicting patient survival across four datasets, demonstrating high predictive accuracy. This nomogram not only enhances our ability to stratify patient risk but also offers potential targets for therapeutic intervention aimed at disrupting glutamine metabolism and sensitizing tumors to existing treatments. Moreover, we identified ALDH18A1 as a prognostic hub gene of glutamine metabolism, characterized by high expression levels in glutamine cluster 3, which is associated with poor clinical outcomes and worse survival, and is included in the risk model. Such insights underscore the critical role of glutamine metabolism in cancer and highlight avenues for personalized medicine in oncology research.
Supplementary Information
The online version contains supplementary material available at 10.1007/s12672-024-01698-3.
Introduction
Lung cancer is a significant global health concern, responsible for a substantial number of cancer-related deaths worldwide. Non-small cell lung cancer (NSCLC) constitutes the majority of cases, with lung adenocarcinoma (LUAD) being the most prevalent histological subtype. Epidemiologically, lung adenocarcinoma shows distinct trends, including higher incidence rates among non-smokers and an increasing prevalence among women [1]. Geographical variations in incidence and mortality rates are influenced by factors such as tobacco consumption, industrial pollution, and genetic predisposition [2].
Bioinformatics has significantly advanced our understanding of lung cancer by leveraging complex genomic, transcriptomic, and clinical datasets. These computational tools are pivotal in elucidating molecular mechanisms underlying lung tumorigenesis, progression, and therapeutic responses. Recent studies employing integrated multi-omics approaches have identified key driver mutations, oncogenic pathways, and actionable targets specific to different subtypes of lung cancer [3, 4]. Bioinformatics analyses also contribute to the development of predictive models for patient stratification and prognosis, as well as the discovery of novel biomarkers for early detection and personalized treatment strategies [5, 6]. Such advancements underscore the critical role of bioinformatics in advancing precision medicine and improving clinical outcomes in lung cancer.
Glutamine metabolism plays a crucial role in the metabolic reprogramming of lung adenocarcinoma, a prevalent subtype of NSCLC. Cancer cells, including those in lung adenocarcinoma, demonstrate heightened dependence on glutamine for sustaining rapid proliferation and survival under stressful tumor microenvironment conditions [7]. Glutamine serves as a critical substrate for energy production, nucleotide synthesis, and redox balance, significantly contributing to cancer cell survival and growth [8]. The dysregulation of glutamine metabolism in lung adenocarcinoma involves alterations in enzymes such as glutaminase and glutamine transporters, which facilitate glutamine uptake and utilization within cancer cells [9]. Understanding these metabolic adaptations in lung adenocarcinoma is essential for developing targeted therapies aimed at disrupting glutamine metabolism and improving treatment outcomes.
Recent research has highlighted the intricate interplay between glutamine metabolism and anti-tumor immunity, shedding light on its critical role in shaping the tumor microenvironment. Glutamine serves not only as a vital nutrient for cancer cell proliferation but also influences immune cell function within the tumor milieu. Glutamine metabolism impacts T cell differentiation, effector function, and cytokine production, thereby modulating immune responses against tumor [10]. Furthermore, glutamine-derived metabolites such as α-ketoglutarate and glutamate contribute to the stability of regulatory T cell (Treg) and myeloid-derived suppressor cell (MDSC) function, promoting immune evasion mechanisms employed by tumors [11, 12]. Understanding these metabolic interactions is crucial for developing strategies that harness glutamine metabolism to enhance anti-tumor immunity and improve therapeutic outcomes in cancer.
In this study, we systematically explored the glutamine metabolism (GM) related genes in LUAD, and established a GM risk model using machine learning algorithms. Further analyses identified ALDH18A1 as a hub gene in GM related to LUAD, which correlated with immune exclusion and shorter OS.
Method
Data acquisition
The RNA sequencing data for the consensus clustering and establishment of GM risk score was downloaded from the TCGA databases with the TPM data and clinical data. The validation data were collected from the GEO database with accession number GSE31210 [13], GSE37745 [14], GSE50081 [15]. And the processed single-cell RNA sequencing data were obtained in GSE131907 [16] with 11 LUAD samples. FPKM-format RNA sequencing data, proteomics data, and clinical data from the CPTAC-LUAD cohort were obtained from the R package PCAS [17]. The glutamine metabolism related genes were summarized from REACTOME GLUTAMATE AND GLUTAMINE METABOLISM, GOBP GLUTAMINE METABOLIC PROCESS and GOBP GLUTAMINE TRANSPORT.
Identification of risky factors
To initially explore the clinical associations of glutamine metabolism-related genes, the TCGA-LUAD dataset was used. The optimal cut-off value for high and low gene expression groups was determined using the surv_cutpoint function from the survminer package. The survdiff method was employed to evaluate survival differences, and the hazard ratio (HR) was calculated by comparing the high expression subgroups to the low expression subgroups. Glutamine metabolism-related genes with an HR greater than 1 and a p-value less than 0.05 were considered risky factors in LUAD.
Identification of differentially expressed genes (DEGs)
The Wilcox test was applied to compared the expression levels of glutamine metabolism-related genes between cluster C3, C1 and cluster C3, C2, and a p-value less than 0.05 was considered as significant.
The limma method was employed to evaluate DEGs between high and low-risk subgroups and high and low ALDH18A1 expression groups using default parameters. We used lmFit to perform linear fitting on the expression data, then applied the contrast matrix with contrasts.fit, and finally conducted empirical Bayesian adjustment using eBayes. A p-value less than 0.05, FDR (False Discovery Rate) less than 0.05 and a log-fold change (logFC) greater than 1 were considered significant.
Consensus clustering
Consensus clustering using the k-means algorithm was conducted on a set of 44 genes associated with glutamine metabolism and CIBERSORTx results. This analysis utilized the ConsensusClusterPlus package in R [18], which assesses the stability and robustness of clusters by aggregating results from multiple clustering runs. Log transformation was applied to the expression matrix to group samples based on their gene expression patterns. The optimal number of clusters (k) was determined using the minimal proportion of ambiguous clustering (PCA) as criterion.
Integrated machine learning method
In this study, a comprehensive set of 101 machine learning methods was employed, including Random Survival Forest (RSF), Elastic Net (Enet), Stepwise Cox (StepCox), CoxBoost, Partial Least Squares Regression Cox (plsRCox), SuperPC, Gradient Boosting Machine (GBM), Survival SVM, LASSO, Ridge, and various combinations. The TCGA-LUAD dataset was used for variable selection and model construction, while the GSE31210, GSE37745, and GSE50081 datasets were utilized to validate the model performance. The scale() function in R was initially used to normalize gene expression across samples in each dataset. This process standardized the data by transforming each feature (gene expression) to have a mean of 0 and a standard deviation of 1, thereby reducing biases from platform-specific differences in expression quantification. When combining algorithms, the first algorithm was used for variable selection, and the second algorithm utilized these selected variables to build predictive models.
Notably, for RSF, the optimal mtry value was determined through exhaustive search. Variable importance was assessed using the subsample command in the randomForestSRC R package.
Survival analysis
Kaplan–Meier (KM) analysis was performed using the survival package in R. The optimal cut-off value was determined using the survminer package. A log-rank p-value less than 0.05 was used to assess statistical significance.
Gene enrichment analysis
Gene Ontology (GO) analysis was performed on the DAVID database (https://davidbioinformatics.nih.gov/). Additionally, gene set enrichment analysis (GSEA) was conducted using the GSEA command in R package clusterProfiler [19] with HALLMARK gene sets. Pathways with an FDR smaller than 0.1 were considered as statistically significant.
Evaluation of immune signatures
In this study, the CIBERSORTx results were obtained from CIBERSORTx online website, and the ESTIMATE score was obtained with IOBR R package[20].
Statistical analysis
All data processing, statistical analyses, and plotting were conducted using R version 4.3.1 software. Spearman’s correlation analysis was utilized to examine correlations between continuous variables. The chi-squared test was employed for comparing categorical variables.
For survival analysis, both univariate and multivariate Cox regression analyses were performed using the survival package in R. Receiver Operating Characteristic (ROC) curves were generated using the timeROC package, and time-dependent ROC curves with a 1-month interval were computed using the reportROC package.
All statistical tests were two-sided, and statistical significance was defined as a p-value less than 0.05.
Results
Summary of the glutamine metabolism related genes in LUAD
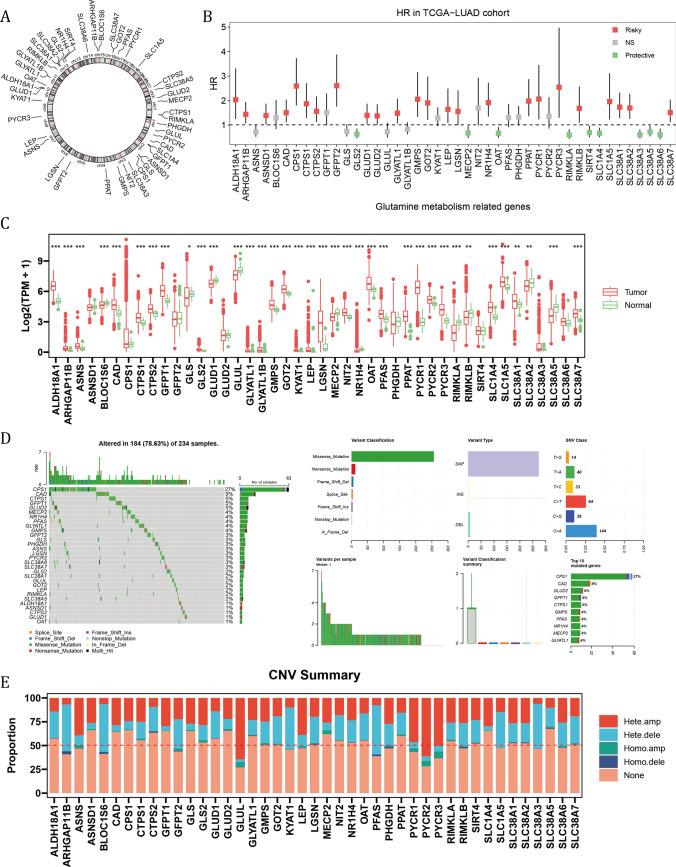
Figure 1A showed the chromosomal locations of a total of 44 glutamine metabolism related genes (GMRGs) from the REACTOME and GO databases. Based on their transcripts per million (TPM) values, their HRs were calculated between high and low expression groups as determined by optimal cut-off value (Fig. 1B). 24 of them (54.5%) were determined as risky factors. Compared with normal tissue in the TCGA-LUAD cohort, 26 out of 44 GMRGs had elevated expression level in tumor (Fig. 1C). Notably, the genetic alternations of GMRGs were observed in 184 out of 234 (78.63%) LUAD cases in the TCGA-LUAD cohort, and CPS1 mutation, mainly missense mutation, occurred in 27 per cent of all cases (Fig. 1D). Moreover, the CNV mutations of GMRGs were common, with most genes mutated with most genes mutated in nearly 50% of cases, and heterozygous amplification and deletion comprising the majority of the mutations (Fig. 1E).
Fig. 1.
The expression, clinical correlation and mutation landscape of glutamine metabolism related genes (GMRG). A The chromosomal locations of 44 GMRGs. B The hazard ratios of GMRGs compared between a given high and low GMRG groups with optimal survival cut-off. C The expression level of GMRGs compared between tumor and normal tissues. The Wilcoxon rank-sum test was used to assess statistical significance. D The mutational landscape and E copy number variation mutation landscape of GMRGs
Consensus clustering with combination of GMRGs and CIBERSORTx results
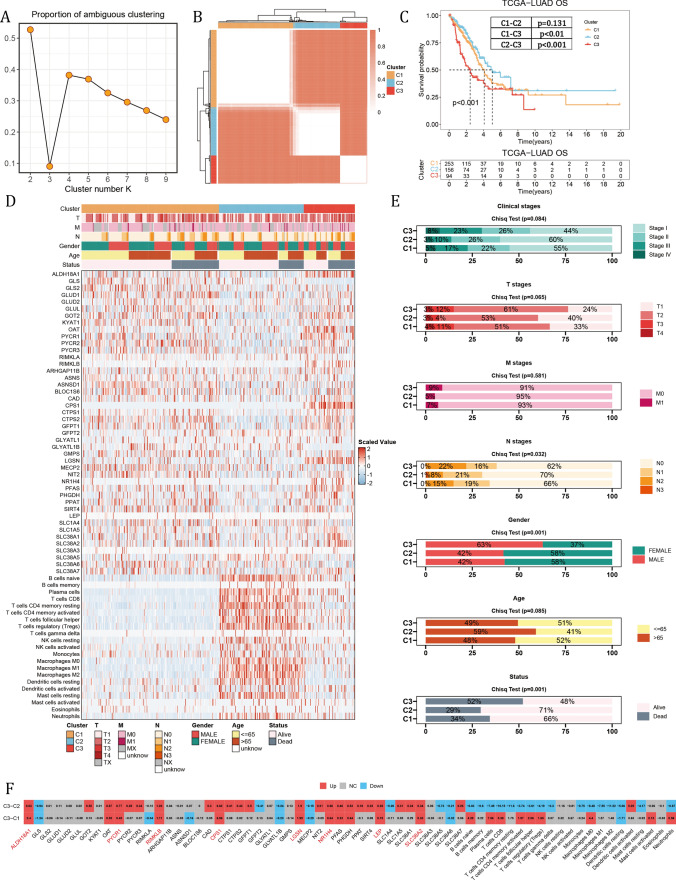
Glutamine metabolism has been shown to predominantly affect immunity, by serving as an essential nutrient for the proliferation of lymphocytes. As a result, we combined the expression GMRGs and the CIBERSORTx results in absolute mode, representing the absolute infiltration status of immune cells, to cluster the LUAD samples. The optimal k value of 3 was determined by the least proportion of ambiguous clustering (PAC) (Fig. 2A), and the clustering result was presented in Fig. 2B. There were significant survival differences among three clusters, and cluster 3 suffered from worst survival compared with the other two groups (all p value < 0.01) respectively (Fig. 2C). The summary of the clustering results, along with clinical information of patients was illustrated in Fig. 2D. Of note, cluster 1 and cluster 3 showed more activated glutamine metabolism, but with more infiltrated immune cells. With further analysis of clinical status distribution, there were larger proportion of patients with advanced stages (p = 0.084), T stages (p = 0.065), N stages (p = 0.032) in cluster 1 and cluster 3, and cluster 3 had more male patients (p = 0.001) (Fig. 2E). Given the worst survival in cluster 3, we filtered the elevated genes and immune cell infiltration in cluster 3. And a total of 11 GMRGs were upregulated in cluster 3 as compared with cluster 1 and cluster 2, of which 8 were risky factors (Fig. 2F, 1B).
Fig. 2.
Consensus clustering with GMRGs and CIBERSORTx results. A The proportion of ambiguous clustering. B The consensus clustering results. C The KM plot of three GM clusters. The Log-rank Test was used to assess statistical significance. D The summary of clinical information, GMRG expression and CIBERSORTx value among three GM clusters. E The comparison of proportion of clinical indicators among three GM clusters. The Chi-square test was used to assess statistical significance. F The differential expression of GMRGs and CIBERSORTx value of GM cluster 3 compared with cluster 1 and cluster 2. The Wilcoxon rank-sum test was used to assess statistical significance
Establishment of the glutamine metabolism risk score
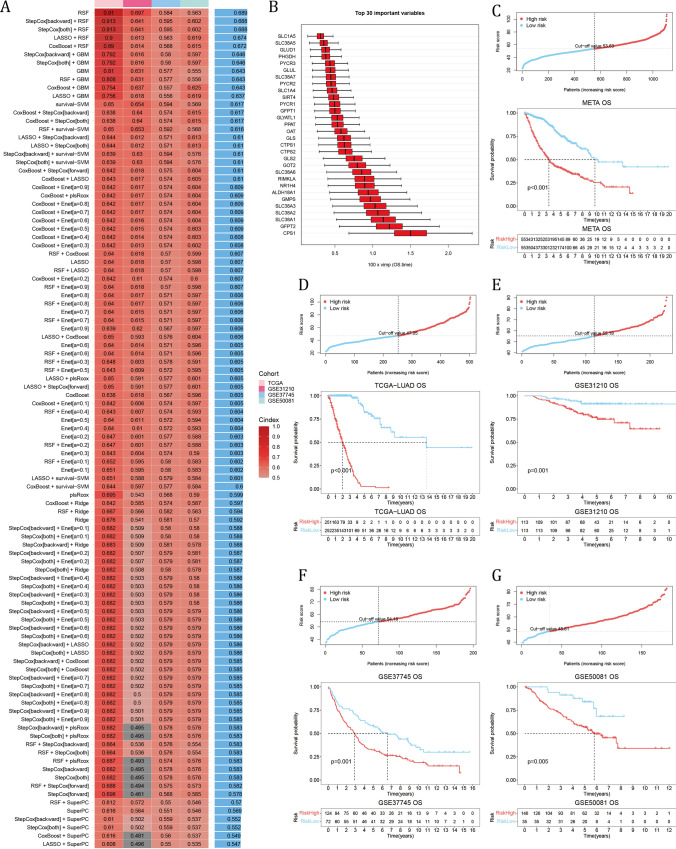
There were 42 GMRGs also detected by the GPL570 platform (excluding ARHGAP11B and GLYATL1B), which were then fitted into 101 machine learning algorithms (see Supplementary materials). The random survival forest model (RSF) demonstrated peak performances with highest average C-index (average C-index = 0.689) among datasets (Fig. 3A). And Fig. 3B showed the top 30 important variables in the RSF. In the integrated meta-LUAD cohort containing 1106 samples, the KM analysis indicated worse overall survival (OS) in the high-risk group using the median risk score as the cut-off point (Fig. 3C). Also with medium cut-off value, high-risk group had significantly worse OS in the TCGA-LUAD and GSE31210 cohort independently (Fig. 3D, E). And with optimal cut-off value, the high-risk group had significantly shorter OS (Fig. 3F, G). These results indicated that a RSF model built with GMRGs could predict effectively the OS of LUAD patients.
Fig. 3.
Construction of the GM risk model. A Comparison of C-index among 101 machine learning models in 4 LUAD datasets. B The top 30 important variables in the RSF model. C–G The cut-off risk score for each dataset (top). The KM analysis results of LUAD samples (bottom). The Log-rank Test was used to assess statistical significance
Construction of a GMRG risk score-based nomogram and verification of its performance
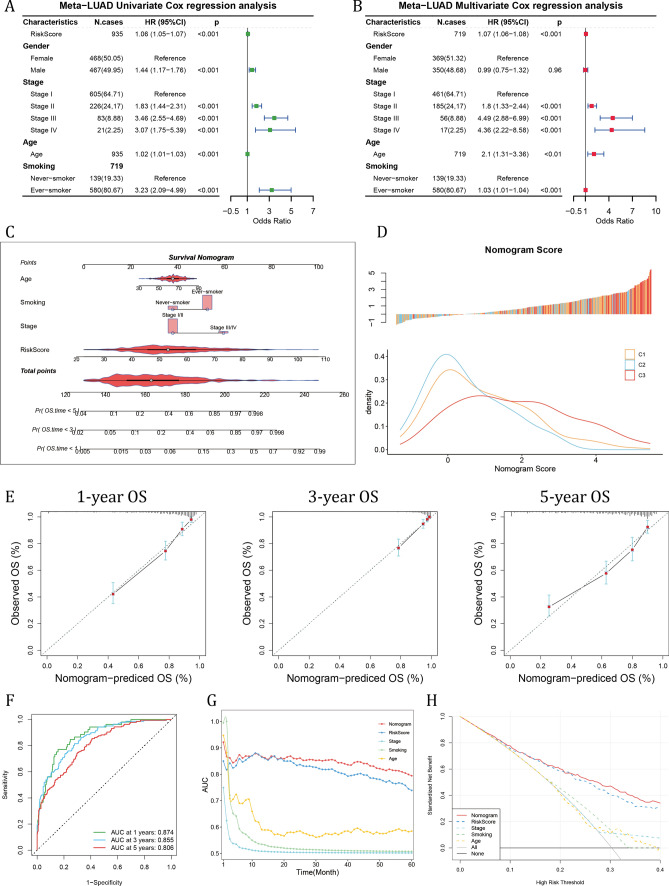
Through univariable Cox regression analysis, the GMRG risk score, male gender, advanced stages, patient age and history of smoking were risky factors (Fig. 4A). In the subsequent multivariable Cox regression analysis, the risk score, advanced stages, age and smoking history were independent risky factors (Fig. 4B). Considering all these risky factors,1 we established a survival nomogram (Fig. 4C). To build the nomogram with our clustering results, we evaluated the distribution of nomogram score in different GM clusters, and discovered that patients in the cluster 3 had higher nomogram score, indicating greater risk (Fig. 4D). Moreover, the calibration curve demonstrated that the survival nomogram score had high consistency between predicted OS and actual OS (Fig. 4E). The predictive performance of 1-, 3- and 5-year survival were evaluated using ROC curves, and the nomogram's prediction of OS had an area under the curve (AUC) of 0.874 at 1 year, 0.855 at 3 year and 0.806 at 5-year survival (Fig. 4F). And the time-dependent AUC value indicated a risk score-based GM nomogram had stable predicting value over time (Fig. 4G). The decision curve analysis (DCA) result showed that nomogram had more benefit for clinical decision compared with other indicators (Fig. 4H).
Fig. 4.
Validation of the efficiency of GM risk model and construction of GM risk score-based nomogram. A The univariable Cox regression and B multivariable Cox regression analyses of GM risk score together with other clinical indicators. C Construction of GM risk score-based nomogram. D The distribution of nomogram score in the TCGA-LUAD cohort in different GM clusters. E Calibration curve showed the correlation between nomogram predicted OS and actual OS at 1-, 3-, and 5-year OS. F The ROC results of nomogram in the meta-LUAD cohort. G The time-dependent AUC value of nomogram score. H The DCA results of nomogram compared with other indicators
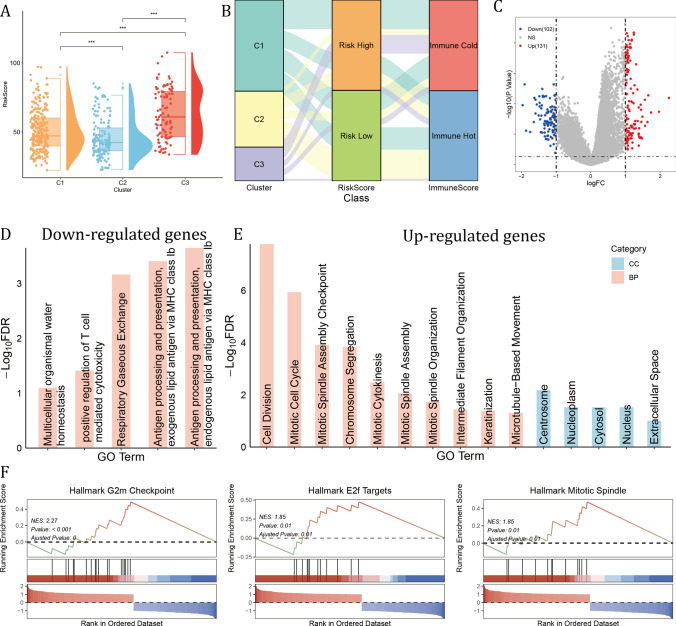
Cluster 3 LUAD patients had higher risk scores and aberrant cell proliferative activity
Among three GM clusters, cluster 3 exhibited the highest average risk scores, demonstrating a consistent relationship between GM molecular clusters and GM risk score (Fig. 5A). Glutamine metabolism was essential in the activation and maintenance of anti-tumor immunity. As was illustrated in Fig. 5B, samples in the cluster 3 were mainly risk high and immune cold, which may contribute to the poorest OS (Fig. 5B). When comparing cluster 3 samples with the other two clusters, a total of 131 up-regulated and 102 down-regulated genes were obtained using limma (Fig. 5C). These down-regulated genes were correlated with Gene ontology (GO) biological processes (BP) including positive regulation of T cell mediated cytotoxicity and antigen processing and presentation, highlighting the immune cold landscape in cluster 3 (Fig. 5D). While these up-regulated genes were enriched in cell proliferation related GO BPs, including cell division, mitotic cell cycle, mitotic spindle assembly checkpoint, indicating aberrant proliferative activity, and was located in the centrosome, nucleoplasm, cytosol and nucleus (Fig. 5E). In addition, the GSEA results showed that the top variable genes were enriched in Hallmark G2M checkpoint, E2F targets and mitotic spindle, further validating the GO results (Fig. 5F).
Fig. 5.
GM cluster 3 samples had highest average risk score and aberrant proliferating activity. A Comparison of GM risk score among three GM clusters. The Wilcoxon rank-sum test was used to assess statistical significance. (***: p < 0.001) B Sankey plot showed the connection of GM clusters, GM risk score and Immune score by ESTIMATE. C The differentially expressed genes (DEGs) of GM cluster 3. D, E The gene ontology (GO) results of biological process (BP) and cellular component (CC) of cluster 3 DEGs. F The GSEA results of DEGs
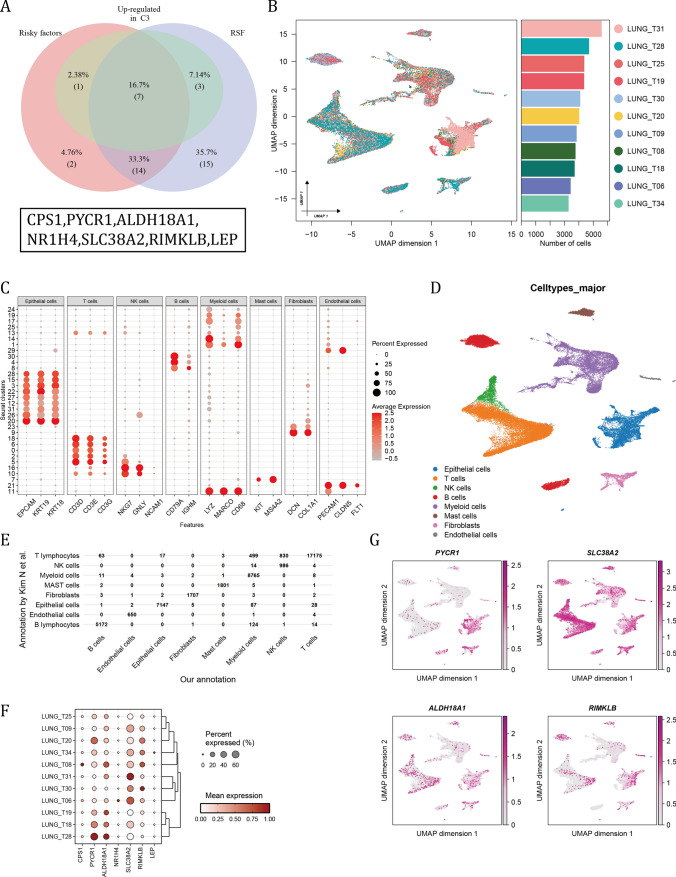
Single-cell RNA sequencing data determined 4 GMRGs as hub genes in LUAD
Based our previous identification of genes that were risky factors, up-regulated in cluster 3 and were included in the establishment of RSF, a total of 7 overlapping genes were finally filtered (Fig. 6A). To validate the expression level of them in cancer cells, a single-cell RNA sequencing data including 11 samples (Fig. 6B). According to canonical cell markers, these cells were annotated into 8 major cell types (Fig. 6C, D). And compared with the annotation by Kim N et al., the annotated epithelial cells were highly consistent[16] (Fig. 6E). In each patient, the relative expression level of PYCR1, ALDH18A1, SLC38A2 and RIMKLB was relatively abundant (Fig. 6F). And the umap plot illustrated the absolute expression of 4 GMRGs among cell types (Fig. 6G).
Fig. 6.
Single-cell RNA data validated the GM hub genes in LUAD cancer cells. A The overlap of risky factors, up-regulated genes in cluster 3 and genes used in the RSF model. B Umap plot of the summary of the integration results of 11 LUAD samples. Boxplot showed the number of cells in each sample after quality control. (C) The expression patterns of canonical cell markers among cell clusters. D The annotated major cell types as referred to cluster markers. E Comparison of our annotation with the annotation by Kim N et al. F The relative expression of 7 GM hub genes among patients. G The expression level of 7 GM hub genes in different cell types
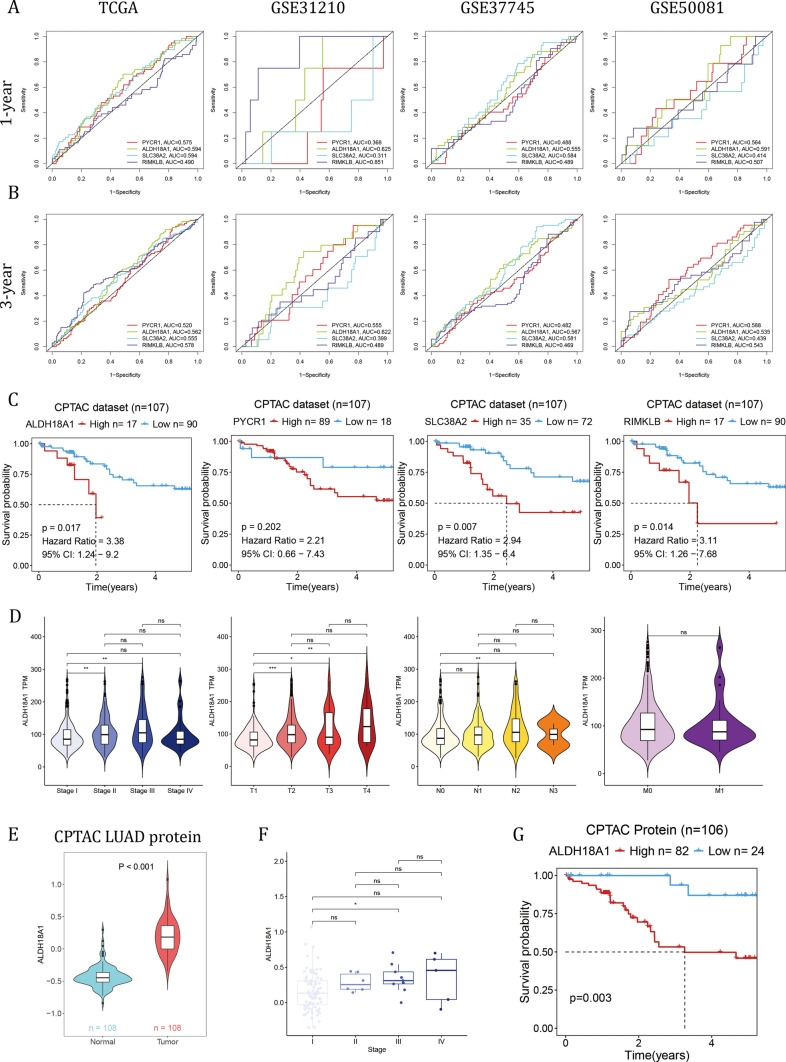
ALDH18A1 exhibited the strongest correlation with patient overall survival
ALDH18A1 exhibited an AUC value greater than 0.55 across all four LUAD datasets for both 1-year and 3-year survival (Fig. 7A, B). In the external CPTAC-LUAD database with FPKM-format RNA sequencing data, higher expression of ALDH18A1, SLC38A2, and RIMKLB correlated with shorter overall survival (OS) (Fig. 7C). Based on the results presented above, ALDH18A1 exhibited the strongest correlation with OS in LUAD patients. The expression level of ALDH18A1 was significantly higher in stage II compared to stage I, in advanced T stages compared to T1, and in N2 compared to N0 (Fig. 7D). At the protein level, ALDH18A1 was higher in tumor tissue compared to normal tissue (Fig. 7E). The average protein level increased with advanced stages and was significantly higher in stage III compared to stage I (Fig. 7F). Furthermore, higher protein levels of ALDH18A1 were associated with shorter OS in the CPTAC-LUAD cohort (Fig. 7G).
Fig. 7.
ALDH18A1 exhibited the strongest correlation with patient overall survival. A, B The ROC analysis results of four candidate hub genes at A 1-year OS and B 3-year OS in 4 LUAD datasets. C The KM analysis of ALDH18A1, PYCR1, SLC38A2 and RIMKLB at mRNA level in the CPTAC-LUAD cohort. D The correlation of ALDH18A1 with clinical stages, T, N and M. E The protein level of ALDH18A1 compared between tumor and normal tissues in the CPTAC cohort. F The correlation of ALDH18A1 protein level with clinical stages. The Wilcoxon rank-sum test was used to assess statistical significance. G The KM analysis of ALDH18A1 at protein level in the CPTAC-LUAD cohort. The Log-rank Test was used to assess statistical significance
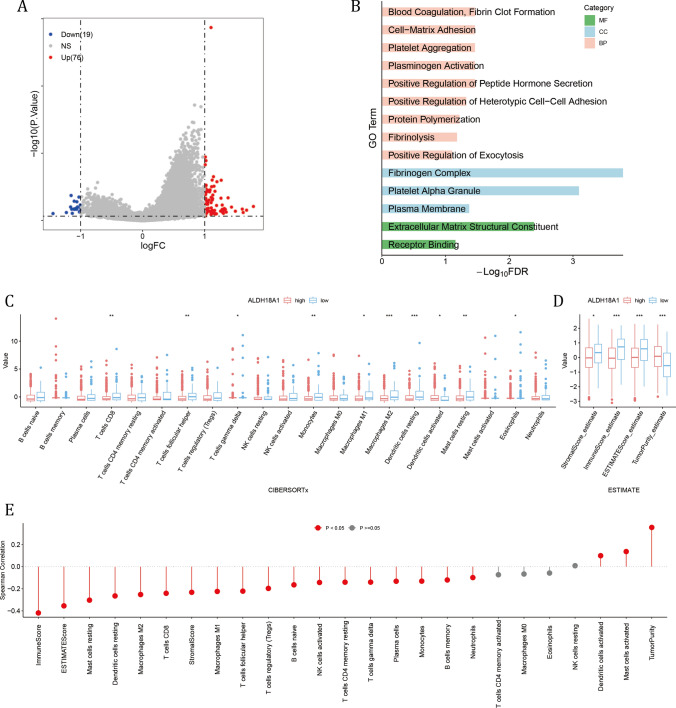
The up-regulated expression of ALDH18A1 was correlated with cell proliferation and immune exclusion
A total of 76 upregulated genes were filtered in the high ALDH18A1 expression group (Fig. 8A), and genes were enriched in pathways involved in the formation of the extracellular environment, such as BPs like blood coagulation, fibrin clot formation, and cell–matrix adhesion; CCs including the fibrinogen complex and platelet alpha granules; and MFs such as extracellular matrix structural constituent (Fig. 8B). Moreover, levels of T cells CD8, T cells follicular helper, Macrophages M1 and M2 were significantly higher in the low ALDH18A1 subgroup, as well as higher stromal score, immune score and ESTIMATE score (Fig. 8C, D). And the expression of ALDH18A1 were tightly negatively correlated with immune score, and numerous immune cells (Fig. 8E). The results suggested that ALDH18A1 may contribute to the establishment of an immune-excluded extracellular environment, which finally led to an immune-cold tumor microenvironment and ultimately resulted in shorter OS.
Fig. 8.
High ALDH18A1 subgroup had abnormal proliferating activity and immune cold tumor microenvironment. A The DEGs between high and low ALDH18A1 subgroups. B The GO results of up-regulated DEGs in high ALDH18A1 subgroup. C, D Comparison of C CIBERSORTx results and D ESTIMATE results between two ALDH18A1 subgroups. The Wilcoxon rank-sum test was used to assess statistical significance. E The Spearman correlation results of ALDH18A1 value with CIBERSORTx and ESTIMATE results
Discussion
Lung adenocarcinoma, a prominent subtype of NSCLC, presents with a heterogeneous spectrum of biomarkers that are integral to its diagnosis and therapeutic management. Key biomarkers, including EGFR mutations and ALK rearrangements, play pivotal roles in directing targeted therapies, significantly enhancing treatment efficacy and patient survival outcomes [21, 22]. These biomarkers not only facilitate precise molecular profiling of tumors but also inform personalized therapeutic strategies tailored to individual patient profiles [22]. The characterization and utilization of these biomarkers are essential for advancing precision oncology and improving clinical outcomes in lung adenocarcinoma patients.
Although previous research had shown a glutamine metabolism related genes-based risk model had predictive value in LUAD [23, 24], they did not adequately explore the actual distribution patterns of GMRGs in LUAD and neglected the essential crosstalk between GM and immune cells. By combining gene expression patterns with CIBERSORTx-estimated absolute immune cell infiltration, we clustered the patients into three GM clusters, where GM cluster 1 and 3 were immune cold, and there were also molecular differences between GM cluster 1 and 3, which contributed to their disparity in OS. Moreover, we applied integrated machine learning algorithms to select the optimal way of calculating risk score. The advantage of integrative procedures lied in their ability to achieve a model with robust prognostic performance for LUAD by leveraging a diverse array of machine learning algorithms and their combinations. These integrative approaches not only harnessed the strengths of individual algorithms but also synergistically enhanced predictive accuracy through ensemble strategies. Furthermore, algorithmic combinations effectively reduce variable dimensionality, simplifying the model while preserving its translational applicability. This streamlined approach not only improves computational efficiency but also enhances the interpretability and clinical relevance of prognostic models in LUAD management.
Conventional methods for the diagnostic and classification could grade the severity of LUAD patients, but was anergy in predicting the OS. Our GM risk score was also an independent indicator for patient OS. Notably, our GM risk score-based nomogram had a steady prognostic value over a 5-year span. Also, we discovered that high glutamine metabolism was positively coupling with stronger proliferative activity, which was consistent with previous results [25].
Single-cell RNA sequencing is pivotal in cancer research, revealing intricate gene expression profiles across individual tumor cells. Based on the single-cell RNA sequencing data from previous research, we defined 4 GMRGs with steady expression among patients, and further prognostic assessment using ROC analysis determined that ALDH18A1 had settled prognostic value. And at protein level, higher ALDH18A1 represented shorter OS.
ALDH18A1, also known as delta-1-pyrroline-5-carboxylate synthase (P5CS), is essential for proline biosynthesis, catalyzing the conversion of glutamate-to-glutamate semialdehyde, bridging glutamine metabolism and proline metabolism, fueling tumor growth and progression. In our research, we discovered that ALDH18A1 was upregulated in LUAD, and had strong connection with immune exclusion, which was worthy of further investigation.
This study has its inherent limitations. The stability of the prognostic model requires more patient inclusion to enhance accuracy. Furthermore, the biological mechanism underlying the prognostic hub gene ALDH18A1 requires further experimental studies to validate its precise involvement in this process.
Supplementary Information
Acknowledgements
None.
Author contributions
Bin Zhang designed this study. Hao Ren, Deng-Feng Ge and Zi-Chen Yang performed the major analyses and wrote this manuscript. Zhen-Ting Cheng and Shou-Xiang Zhao collected the data and reviewed the manuscript.
Funding
This work was supported by grants from The Specialized Project for the Promotion of Department Heads at Jiangsu Province Hospital of Chinese Medicine (Y2021ZR08).
Data availability
All data generated or analyzed during this study can be accessed in the TCGA and GEO databases and are included in the method section. Codes for analyses in the study are available upon reasonable request from the corresponding author.
Declarations
Competing interests
The authors declare no competing interests.
Footnotes
Publisher's Note
Springer Nature remains neutral with regard to jurisdictional claims in published maps and institutional affiliations.
References
- 1.Siegel RL, Miller KD, Fuchs HE, Jemal A. Cancer statistics, 2021. Cancer J Clin. 2021;71(1):7–33. [DOI] [PubMed] [Google Scholar]
- 2.Bray F, Laversanne M, Sung H, Ferlay J, Siegel RL, Soerjomataram I, Jemal A. Global cancer statistics 2022: GLOBOCAN estimates of incidence and mortality worldwide for 36 cancers in 185 countries. Cancer J Clin. 2024;74(3):229–63. [DOI] [PubMed] [Google Scholar]
- 3.Campbell JD, Alexandrov A, Kim J, Wala J, Berger AH, Pedamallu CS, Shukla SA, Guo G, Brooks AN, Murray BA, Imielinski M, Hu X, Ling S, et al. Distinct patterns of somatic genome alterations in lung adenocarcinomas and squamous cell carcinomas. Nat Genet. 2016;48(6):607–16. [DOI] [PMC free article] [PubMed] [Google Scholar]
- 4.Liu Y, Balagurunathan Y, Atwater T, Antic S, Li Q, Walker RC, Smith GT, Massion PP, Schabath MB, Gillies RJ. Radiological image traits predictive of cancer status in pulmonary nodules. Clin Cancer Res. 2017;23(6):1442–9. [DOI] [PMC free article] [PubMed] [Google Scholar]
- 5.Chen H, Chong W, Teng C, Yao Y, Wang X, Li X. The immune response-related mutational signatures and driver genes in non-small-cell lung cancer. Cancer Sci. 2019;110(8):2348–56. [DOI] [PMC free article] [PubMed] [Google Scholar]
- 6.Cheng B, Deng H, Zhao Y, Xiong J, Liang P, Li C, Liang H, Shi J, Li J, Xiong S, Lai T, Chen Z, Wu J, et al. Predicting EGFR mutation status in lung adenocarcinoma presenting as ground-glass opacity: utilizing radiomics model in clinical translation. Eur Radiol. 2022;32(9):5869–79. [DOI] [PubMed] [Google Scholar]
- 7.Altman BJ, Stine ZE, Dang CV. From Krebs to clinic: glutamine metabolism to cancer therapy. Nat Rev Cancer. 2016;16(10):619–34. [DOI] [PMC free article] [PubMed] [Google Scholar]
- 8.Davidson SM, Papagiannakopoulos T, Olenchock BA, Heyman JE, Keibler MA, Luengo A, Bauer MR, Jha AK, O’Brien JP, Pierce KA, Gui DY, Sullivan LB, Wasylenko TM, et al. Environment impacts the metabolic dependencies of ras-driven non-small cell lung cancer. Cell Metab. 2016;23(3):517–28. [DOI] [PMC free article] [PubMed] [Google Scholar]
- 9.Momcilovic M, Bailey ST, Lee JT, Fishbein MC, Braas D, Go J, Graeber TG, Parlati F, Demo S, Li R, Walser TC, Gricowski M, Shuman R, et al. The GSK3 signaling axis regulates adaptive glutamine metabolism in lung squamous cell carcinoma. Cancer Cell. 2018;33(5):905-921.e905. [DOI] [PMC free article] [PubMed] [Google Scholar]
- 10.Leone RD, Zhao L, Englert JM, Sun IM, Oh MH, Sun IH, Arwood ML, Bettencourt IA, Patel CH, Wen J, Tam A, Blosser RL, Prchalova E, et al. Glutamine blockade induces divergent metabolic programs to overcome tumor immune evasion. Science. 2019;366(6468):1013–21. [DOI] [PMC free article] [PubMed] [Google Scholar]
- 11.Li K, Shi H, Zhang B, Ou X, Ma Q, Chen Y, Shu P, Li D, Wang Y. Myeloid-derived suppressor cells as immunosuppressive regulators and therapeutic targets in cancer. Signal Transduct Target Ther. 2021;6(1):362. [DOI] [PMC free article] [PubMed] [Google Scholar]
- 12.Kumar M, Leekha A, Nandy S, Kulkarni R, Martinez-Paniagua M, Rahman Sefat KMS, Willson RC, Varadarajan N. Enzymatic depletion of circulating glutamine is immunosuppressive in cancers. iScience. 2024;27(6):109817. [DOI] [PMC free article] [PubMed] [Google Scholar]
- 13.Okayama H, Kohno T, Ishii Y, Shimada Y, Shiraishi K, Iwakawa R, Furuta K, Tsuta K, Shibata T, Yamamoto S, Watanabe S, Sakamoto H, Kumamoto K, et al. Identification of genes upregulated in ALK-positive and EGFR/KRAS/ALK-negative lung adenocarcinomas. Can Res. 2012;72(1):100–11. [DOI] [PubMed] [Google Scholar]
- 14.Botling J, Edlund K, Lohr M, Hellwig B, Holmberg L, Lambe M, Berglund A, Ekman S, Bergqvist M, Pontén F, König A, Fernandes O, Karlsson M, et al. Biomarker discovery in non-small cell lung cancer: integrating gene expression profiling, meta-analysis, and tissue microarray validation. Clin Cancer Res. 2013;19(1):194–204. [DOI] [PubMed] [Google Scholar]
- 15.Der SD, Sykes J, Pintilie M, Zhu CQ, Strumpf D, Liu N, Jurisica I, Shepherd FA, Tsao MS. Validation of a histology-independent prognostic gene signature for early-stage, non-small-cell lung cancer including stage IA patients. J Thorac Oncol. 2014;9(1):59–64. [DOI] [PubMed] [Google Scholar]
- 16.Kim N, Kim HK, Lee K, Hong Y, Cho JH, Choi JW, Lee JI, Suh YL, Ku BM, Eum HH, Choi S, Choi YL, Joung JG, et al. Single-cell RNA sequencing demonstrates the molecular and cellular reprogramming of metastatic lung adenocarcinoma. Nat Commun. 2020;11(1):2285. [DOI] [PMC free article] [PubMed] [Google Scholar]
- 17.Wang J, Song X, Wei M, Qin L, Zhu Q, Wang S, Liang T, Hu W, Zhu X, Li J. PCAS: An Integrated Tool for Multi-Dimensional Cancer Research Utilizing Clinical Proteomic Tumor Analysis Consortium Data. Int J Mol Sci. 2024;25(12):6690. [DOI] [PMC free article] [PubMed] [Google Scholar]
- 18.Wilkerson MD, Hayes DN. ConsensusClusterPlus: a class discovery tool with confidence assessments and item tracking. Bioinformatics. 2010;26(12):1572–3. [DOI] [PMC free article] [PubMed] [Google Scholar]
- 19.Wu T, Hu E, Xu S, Chen M, Guo P, Dai Z, Feng T, Zhou L, Tang W, Zhan L, Fu X, Liu S, Bo X, et al. clusterProfiler 4.0: a universal enrichment tool for interpreting omics data. Innovation. 2021;2(3):100141. [DOI] [PMC free article] [PubMed] [Google Scholar]
- 20.Zeng D, Ye Z, Shen R, Yu G, Wu J, Xiong Y, Zhou R, Qiu W, Huang N, Sun L, Li X, Bin J, Liao Y, et al. IOBR: multi-omics immuno-oncology biological research to decode tumor microenvironment and signatures. Front Immunol. 2021;12: 687975. [DOI] [PMC free article] [PubMed] [Google Scholar]
- 21.Díaz-Serrano A, Gella P, Jiménez E, Zugazagoitia J, Paz-Ares RL. Targeting EGFR in lung cancer: current standards and developments. Drugs. 2018;78(9):893–911. [DOI] [PubMed] [Google Scholar]
- 22.Schneider JL, Lin JJ, Shaw AT. ALK-positive lung cancer: a moving target. Nature cancer. 2023;4(3):330–43. [DOI] [PMC free article] [PubMed] [Google Scholar]
- 23.Liu J, Shen H, Gu W, Zheng H, Wang Y, Ma G, Du J. Prediction of prognosis, immunogenicity and efficacy of immunotherapy based on glutamine metabolism in lung adenocarcinoma. Front Immunol. 2022;13: 960738. [DOI] [PMC free article] [PubMed] [Google Scholar]
- 24.Zhang J, Wang X, Song C, Li Q. Identification of four metabolic subtypes and key prognostic markers in lung adenocarcinoma based on glycolytic and glutaminolytic pathways. BMC Cancer. 2023;23(1):152. [DOI] [PMC free article] [PubMed] [Google Scholar]
- 25.Loftus AW, Zarei M, Kakish H, Hajihassani O, Hue JJ, Boutros C, Graor HJ, Nakazzi F, Bahlibi T, Winter JM, Rothermel LD. Therapeutic implications of the metabolic changes associated with BRAF inhibition in melanoma. Cancer Treat Rev. 2024;129: 102795. [DOI] [PMC free article] [PubMed] [Google Scholar]
Associated Data
This section collects any data citations, data availability statements, or supplementary materials included in this article.
Supplementary Materials
Data Availability Statement
All data generated or analyzed during this study can be accessed in the TCGA and GEO databases and are included in the method section. Codes for analyses in the study are available upon reasonable request from the corresponding author.


