Abstract
A series of fire experiments in a 1/10 scale model tunnel with a lateral open shaft were conducted. Analysis was performed to explore the maximum excess temperature and longitudinal temperature decay under the influence of a mechanical exhaust system with a lateral open shaft. Three different pool sizes and numerous extraction rates were considered. The experimental results yielded intriguing insights into the correlations between the rate of smoke extraction and the ceiling temperature. The variations in the temperature distribution of ceiling smoke upstream and downstream the fire source is different under the induced longitudinal velocity, especially for the near the fire source area. An analysis of the maximum excess temperature was conducted by inducing the heat loss coefficient  . It is 0.85 (0.71) for the induced dimensionless longitudinal velocity
 , which indicates the effect of a large velocity on the smoke heat loss. Then, a modified model of the maximum excess temperature was given for a tunnel utilizing lateral open shaft smoke extraction. In addition, a simple model was proposed to capture ceiling temperature decay, where the decay coefficients
  upstream and downstream of the fire source are proportional to
  (
( ) for
) for 
 . The research results have certain guiding significance for the arrangement of fire protection, fire monitoring and early warning devices in mountain tunnels.
Keywords: Mechanical exhaust, Mountain tunnel fire, Lateral open shaft, Maximum excess temperature, Longitudinal decay
Subject terms: Environmental impact, Civil engineering
Introduction
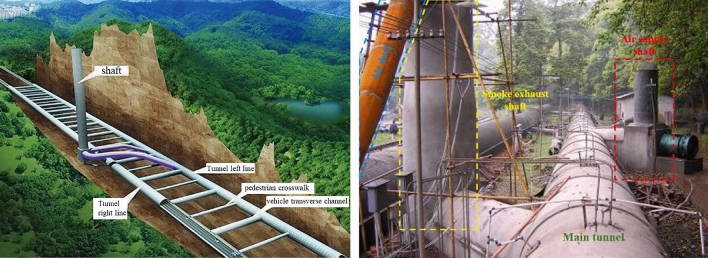
With the improvement in infrastructure, the number and scale of tunnels in China have ranked first in the world. In recent years, tunnels have been created with lateral opening shafts to accommodate the limitations imposed by existing buildings or topography. For example, mountain tunnels1–4, whose typical structural diagram can be seen in Fig. 1. There is an increasing concern regarding the potential fire hazard inside such types of tunnels with lateral opening shafts.
Fig. 1.
Schematic diagram of a mountain tunnel with a lateral open shaft3,4.
Tunnel fires have garnered significant interest5–8due to their potential for causing severe harm to human lives, property, and structures. Shaft mechanical ventilation systems are increasingly being recognized as reliable solutions for achieving effective smoke control in tunnels, particularly in two-way tunnels and extralong tunnels4,9. The distribution characteristics of ceiling temperatures serve as crucial indicators of fire occurrence and are a significant approach for investigating the movement behavior of smoke. The accuracy of estimating the ceiling temperature could greatly enhance the evaluation of fire danger and the optimization of rescue schemes. Previously, many correlations were proposed to reveal the mechanism of thermal temperature distribution in a tunnel fire. The widely accepted maximum excess temperature model was proposed by Li et al. (2011)10and Kurioka et al. (2003)11based on a typical single tunnel. Nevertheless, Kurioka’s methodology is not applicable in situations where there is insufficient ventilation during a fire. The ceiling temperature decay follows an exponential trend12–15. The abovementioned classical models established for a single tunnel promoted the development of tunnel fire dynamics. When the ceiling extraction system is activated in the event of a fire, smoke is instantly evacuated through the outlet. The concept of the induced velocity inside a tunnel was proposed by Hu et al. (2014)16to investigate the ceiling smoke temperature distribution. Consequently, a modified maximum excess temperature and longitudinal temperature decay model was developed, in which the fire source is located directly below the smoke vent. Thereafter, many experiments were performed by Tang to investigate the maximum excess temperature17, longitudinal temperature decay18, and air entrainment19.
Compared with ceiling centralized smoke exhaust systems (shaft mechanical ventilation systems or point extraction systems), there is a lateral channel connected to the shaft and the tunnel for tunnels with a laterally open shaft. In this situation, the resistance that needs to be overcome when smoke flows out of the shaft from the tunnel will increase. Therefore, the smoke movement behavior will be modified. Regarding the effect of lateral smoke exhaust systems on the smoke movement behavior, Chen et al. (2013)20, Xu et al. (2019)21and Zhu et al. (2022)22. investigated smoke exhaust efficiency by varying the shape and size of the vents. Zhang et al. (2019)23conducted a model-scale test to examine the temperature distribution in a tunnel under the combined effect of longitudinal ventilation and lateral smoke exhaust. The temperature of the ceiling upstream of the tunnel decreased with increasing longitudinal ventilation velocity, but the temperature downstream increased. The formation mechanism of air entrainment at the exhaust vent in a lateral smoke exhaust system was the subject of a multiscale experiment conducted by Liu et al. (2023)24–26. The researchers discovered that shear flow was generated downstream of the exhaust vent, and the intensity of this flow increased as the exhaust velocity increased. Consequently, the stratification of the smoke layer was obliterated, and air entrainment was bolstered. The above studies indicated the influence of lateral ventilation systems on smoke movement behavior. It should be noted that the above work was performed in an underwater tunnel where many mechanical exhaust smoke vents were installed on the tunnel sidewall. However, a lateral open shaft connected to a tunnel via a transverse channel will easily be found in the mountain tunnel. Wang et al. (2021)4 studied the smoke migration behavior and control strategy in a mountain tunnel with lateral open shaft mechanical ventilation by employing model experiments and numerical simulation. However, they did not provide a quantitative relationship between the temperature distribution and shaft mechanical ventilation.
In light of this, a series of tests were performed in this study to examine the distribution of ceiling smoke temperature when mechanical smoke exhaust was applied through a lateral open shaft. The maximum rise temperature of the ceiling under the mechanical smoke exhaust of the shaft and the longitudinal temperature distribution law upstream and downstream of the fire source will be mainly revealed. The modified maximum excess temperature model will be subsequently given by inducing two impact parameters. Theoretical analysis was also performed to quantify the longitudinal temperature decay, and a corresponding prediction model will be proposed.
Experiments
Tunnel model system
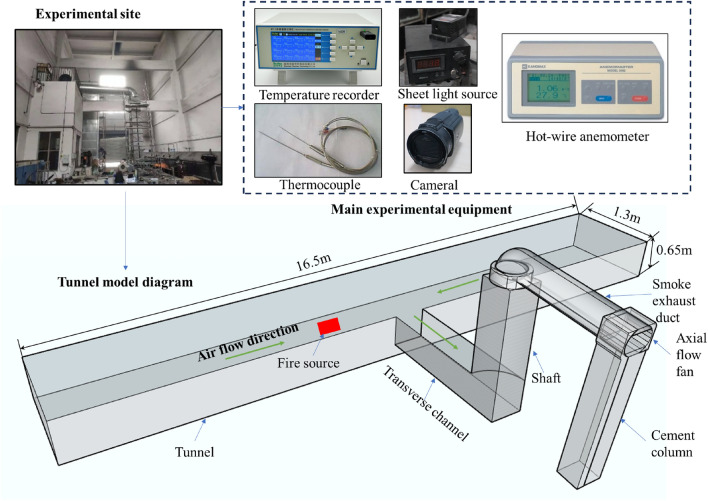
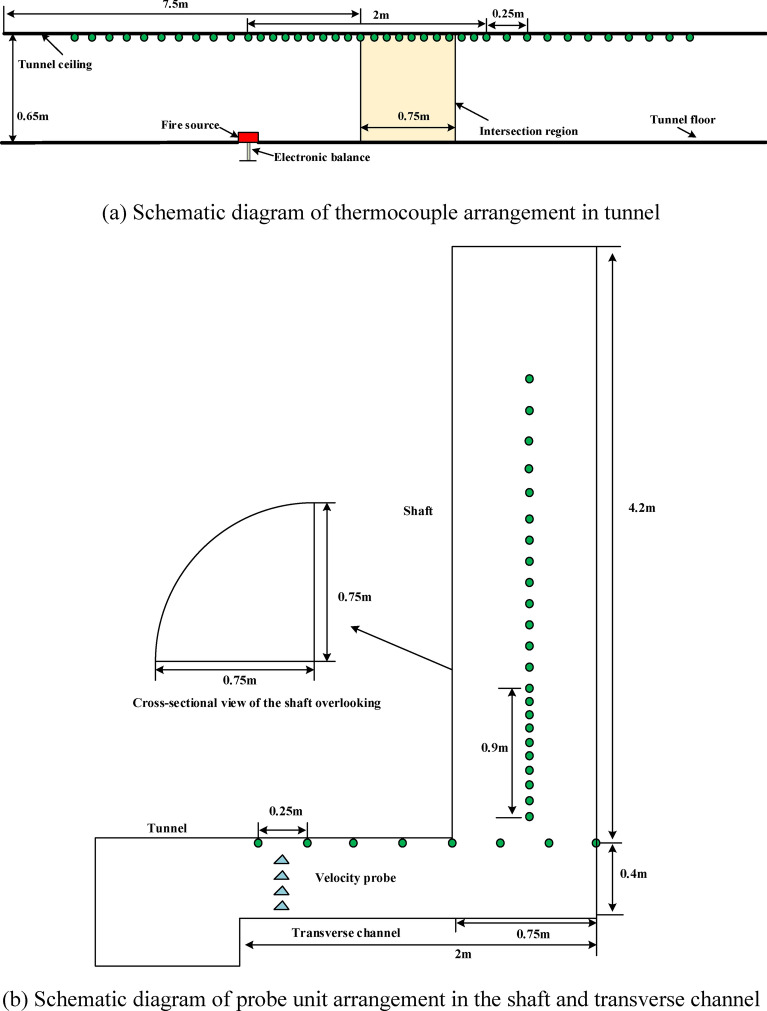
A total of 27 experimental burning experiments were carried out in a 1/10 model tunnel with a lateral opening vertical shaft, as shown in Fig. 2. The laboratory experimental tunnel measures 16.5 m in length, 1.3 m in width, and 0.65 m in height. Both ports of the tunnel were open. A rectangular mechanical exhaust pipe measuring 0.75 m in width and 0.4 m in height was placed 7.5 m from the tunnel’s left boundary. The lateral extension of the smoke exhaust channel was 2 m long and connected to the vertical shaft. The vertical shaft, with a cross-section of 1/4 circle (R = 0.75 m), was 4.2 m tall. A circular smoke exhaust duct was positioned at the far end, above the vertical shaft. One end of the circular exhaust duct was softly linked to the top of the shaft, while the other was connected to the axial flow fan. The detailed information of the tunnel model was described in previous reports1.
Fig. 2.
Experimental apparatus.
All thermocouples were 0.5 mm in diameter and had a response time of 0.03 s. The measurement range was 0 ~ 1000℃, with an accuracy of ± 3.0℃. 71 K-type thermocouples were placed 0.1 m below the tunnel ceiling, at intervals of 0.1 m near the shaft joint and 0.25 m far away, see Fig. 3(a). The horizontal channel and the shaft connecting section were separated by a thermocouple space of 0.25 m. The thermocouple spacings within the shaft were 0.1 m and 0.25 m, respectively (Fig. 3(b)). The air velocity inside the tunnel and shaft was measured with a hot-wire anemometer that had an accuracy of 0.01 m/s. The direction of the probe of the hot-wire anemometer was opposite to the direction of the air flow in the tunnel. The wind speed probes were positioned in the horizontal channel and the main tunnel to determine the induced wind speed in the tunnel and the exhaust velocity of the shaft.
Fig. 3.
Schematic diagram of measuring point arrangement in the experimental test.
The fire source was situated 1.375 m from the upstream side of the shaft center, and three-square basins with side lengths of 15 cm, 20 cm, and 23 cm were considered. Diesel was chosen as the fuel, with a combustion heat of 42 kJ/g2. The HRRs were calculated using the following equation.
 |
1 |
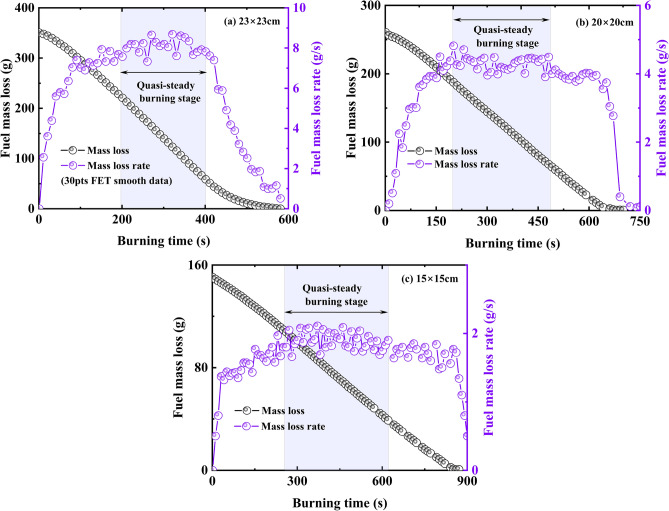
An electric balance was employed to measure the mass loss rate of fuel with an accuracy of 0.01 g. Figure 4 illustrates the evolution of the mass loss rate and fuel mass with time during the combustion process, with Vs = 0.36 m/s serving as illustrations. The mass loss rate that was evaluated during the quasi-steady state was averaged, as illustrated in the purple filling area of Fig. 4. Under the condition of the same fuel depth in the oil pool, the smaller the side length of the oil pool, the longer the stable combustion stage. The smoke behavior was visually displayed using a laser sheet with a thickness of 1 mm, which was arranged at the tunnel entrance on the downstream side of the shaft. The combustion behavior was captured in real-time using a high-definition camera that was situated on the side of the tunnel.
Fig. 4.
Data processing of the fuel mass loss rate with different pool sizes (Vs = 0.36 m/s).
Experimental conditions
Eight smoke exhaust velocities were chosen to investigate the impact of mechanical ventilation on the temperature distribution under the ceiling inside the tunnel. The direction of the probe of the hot-wire anemometer was opposite to the direction of the air flow in the tunnel. These velocities were 0 m/s, 0.36 m/s, 1.14 m/s, 2.029 m/s, 2.79 m/s, 3.53 m/s, 4.31 m/s, 4.97 m/s, and 5.61 m/s, respectively. The influence of the oil pool sizes on the induced wind speed was almost negligible due to the thinner thickness of smoke layer induced by the lower heat release rate. Such details will be shown later. The average value of four wind speed measuring points (Fig. 3(a)) were selected to determine the induced velocity. Consequently, a linear expression was easily obtained in Fig. 5 by fitting the induced velocity inside the tunnel and the velocity inside the shaft, where the slope equals 0.12. Three-square oil basins were chosen, and the range of the tested heat release rates (HRRs) were from 5.62 kW to 28.45 kW. The corresponding HRRs in a full-scale tunnel fire (Qf) were from 1.78 MW to 9.00 MW. The ambient pressure was 101.3 kPa, and the ambient temperature was approximately 14 ± 6℃. The experimental conditions were summarized in Table 1, and all of the experiments were conducted three times.
Fig. 5.
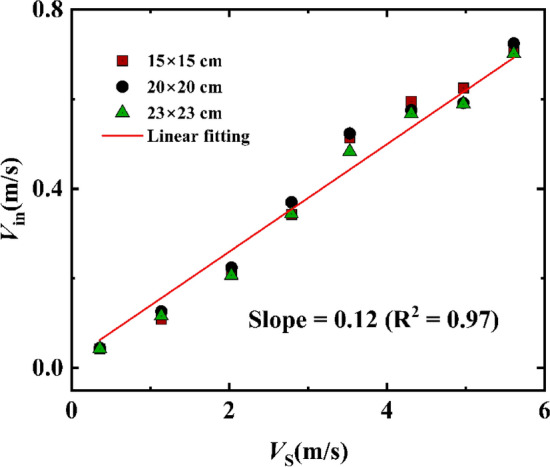
Relationships between Vin and Vs with different conditions.
Table 1.
Summary of the experimental conditions.
| Test | Fire source size (cm) | Vs (m/s) | Q (kW) | Qf(MW) |
|---|---|---|---|---|
| 1–9 | 15 × 15 | 0, 0.36, 1.14, 2.03, 2.79, 3.53, 4.31, 4.97, 5.61 | 6.26, 6.29, 5.62, 5.98, 7.97, 6.13, 8.03, 6.18, 6.51 | 1.98, 1.99, 1.78, 1.89, 2.52, 1.94, 2.54, 1.96, 2.06 |
| 10–18 | 20 × 20 | 0, 0.36, 1.14, 2.03, 2.79, 3.53, 4.31, 4.97, 5.61 | 10.81, 14.99, 17.13, 16.18, 15.91, 14.34, 16.09, 12.40, 15.19 | 3.42, 4.74, 5.42, 5.12, 5.03, 4.53, 5.09, 3.92, 4.80 |
| 19–27 | 23 × 23 | 0, 0.36, 1.14, 2.03, 2.79, 3.53, 4.31, 4.97, 5.61 | 21.43, 20.54, 22.89, 23.68, 24.04, 28.45, 28.45, 28.45, 23.53 | 6.78, 6.49, 7.24, 7.49, 7.60, 9.00, 9.00, 9.00, 7.44 |
Results and discussion
Experimental observation
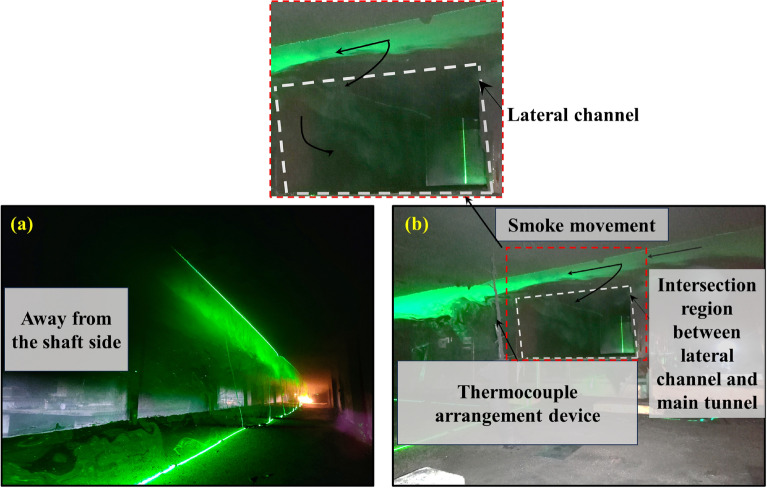
Figure 6 shows the representative smoke movement characteristics when utilizing a sheet light source (Test 13). The diffusion smoke downstream of the fire source was presented in Fig. 6(a), and the upwind smoke development near the shaft was shown in Fig. 6(b). The thickness of the smoke layer that diffuses along the upstream is relatively low, especially near the shaft region. In this situation, the fire plume behavior may be influenced by the mechanical smoke exhaust system. Therefore, a variation in the temperature distribution may be presented. Such details will be studied later.
Fig. 6.
Representative smoke migration behavior using sheet light source.
In tunnel fires, the temperature distribution is a key characteristic parameter reflecting the movement behavior of smoke. The characteristics of the smoke spread are highly dependent on the air velocity inside the tunnel. Different from longitudinal ventilated tunnel fires, the longitudinal wind speed induced by the negative pressure ventilation of the shaft makes the smoke movement much more complex, see Fig. 7. Under the action of shaft mechanical ventilation, the smoke flow direction upstream of the whole fire source and far downstream of the fire source (i.e., downstream of the shaft) is opposite to the direction of induced wind speed. However, the flow direction of the smoke near the downstream end of the fire source is the same as the direction of the induced velocity. Therefore, a varied smoke temperature distribution and decay behavior may be caused by the difference between the shear effect of induced airflow and smoke.
Fig. 7.
Schematic diagram of smoke movement under shaft mechanical smoke exhaust.
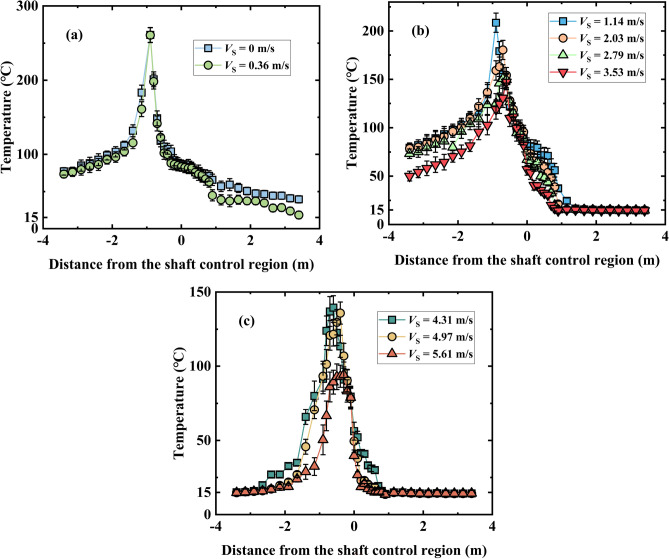
Figure 8 shows longitudinal smoke temperature distribution below the ceiling with various mechanical smoke exhaust wind speeds, taking the fire source side length of 0.2 m as an example. It can be seen from Fig. 8(a) that the smoke temperature downstream is greater than that upstream especially in the vicinity of the fire source, when the mechanical ventilation velocity is low. This situation can be explained by the cooling effect dominating the temperature in the near field. Hence, the stronger combustion effect downstream of the fire source may be caused due to more air entrainment. However, when the smoke is transported to the shaft control area, the smoke temperature downstream is lower than that upstream. The reason is that the smoke accumulation effect dominated the temperature in the far field. Part of the smoke migrating from the downstream side of the fire source flows out of the shaft, resulting in a lower smoke accumulation effect downstream compared with that upstream.
Fig. 8.
Longitudinal smoke temperature distribution with various mechanical ventilation velocities (0.2 m × 0.2 m).
However, when the applied mechanical velocity is large, the temperature distribution upstream of the fire source near the field is larger than that downstream (see Fig. 8(b) and (c)), which is different from that scenario with low velocity. The smoke movement behavior difference between upstream and downstream in a shaft-ventilated tunnel fire could lie in the enhanced resistance of fire plumes25. Moreover, under the interaction of the smoke layer and cold air, part of the smoke upstream of the fire source will experience backflow phenomena, while smoke from the far end downstream of the fire source will be discharged from the shaft (Fig. 7). Therefore, a decreasing temperature distribution downstream of the fire source occurred. Such above situation emphasizes the influence of ventilation velocity on the temperature difference between upstream and downstream of the fire source. The quantitative relationship of the ceiling smoke temperature excess will be revealed below.
The maximum excess temperature empirical correlation
The maximum temperature is a crucial factor for assessing the extent of fire damage. Over the past few decades, numerous studies have been conducted to examine the maximum excess temperature during a tunnel fire, considering various fire scenarios. Li et al. (2011)10 proposed the following formula for a fire burning under quiescent conditions,
 |
2 |
where  is the distance from the fire source to the tunnel ceiling,
  is longitudinal ventilation velocity,
  is the radius of the fire source, and the dimensional velocity
  can be expressed as,
 |
3 |
where  is the convective heat release rate.
Upon activation of the shaft mechanical ventilation system, the tunnel will experience an induced wind speed directed toward the shaft. The induced velocity can be mathematically represented as  16,17 based on the principle of air quantity balance. Thus, the induced velocity was substituted into Eq. (2), and a comparison of the tested maximum excess temperature with the value predicted by Li et al. (2011)10 can be found in Fig. 9. Most of the predicted result are lower than the tested values in this work. The reason why Li’s model overestimates the temperature likely because of the following reasons, (1) The existence of a shaft channel allows the high-temperature smoke to escape from the shaft. (2) Compared with the point exhaust system, the lateral open shaft exhaust system needs to overcome greater resistance (Local resistance and frictional resistance) to move the smoke when it is activated. When the fire source is placed upstream of the shaft (Fig. 7) and exhaust port16, there is a noticeable variation in the way smoke moves in response to the direction of airflow. This implies that when considering the resistance formed by the smoke layer, the air volume distribution on both sides of the shaft is inconsistent due to the difference in smoke movement behavior. Hence, it is insufficient to access the maximum excess temperature in a tunnel with a lateral open shaft. This necessitates the development of a new correlation for predicting the greatest excess temperature.
Fig. 9.
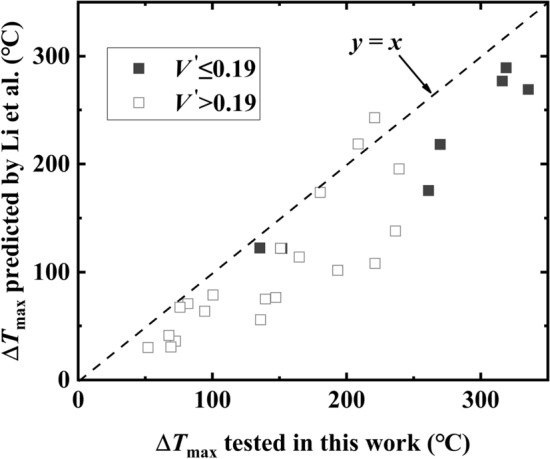
Comparison of the maximum excess temperature predicted by Li et al. (2011)10 with the tested result in this work.
In light of this, two parameters  were introduced to illustrate the influence of centralized smoke exhaust with a lateral open shaft on the maximum rise temperature of the ceiling. Accounting for the influence of Vin and Vsseparately under fire conditions is practically challenging due to the barrier of the smoke layer to airflow and the variation in smoke migration on both sides of the fire source. In reality, achieving a consistent airflow through the cross-section of a longitudinal ventilated tunnel is extremely challenging due to the presence of wall boundaries and viscosity27. Using a linear correlation approximation to determine the induced air velocity, taking into account the smoke extraction effect, has been demonstrated to be acceptable in practical-oriented research16,17,27. Therefore, the subsequent study utilized a linear representation of the induced velocity, denoted
  . The induced parameter
  was used to quantify the heat loss of smoke discharged from the shaft. Therefore, Eq. (2) can be modified as follows.
 |
4 |
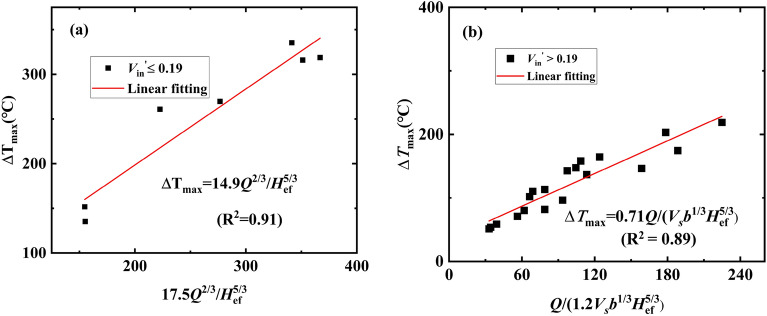
Revisiting such a linear expression between the induced longitudinal velocity and the mechanical exhaust velocity in Fig. 4, we find that the value of  is 0.12. Afterward, it was input into Eq. (4), and the measured maximum excess temperature data were subsequently fitted using Eq. (4). Consequently, the maximum excess temperature model in a tunnel with a lateral opening shaft was obtained, as shown in Fig. 10. Here,
  is 0.85 for
  and 0.71 for
  . This implies that the ceiling temperature responds to the increasing mechanical exhaust wind speed, due to the varied heat loss discharged from the shaft.
Fig. 10.
The maximum excess temperature model predicted in this work.
Longitudinal decay of smoke temperature
An empirical model
One of the most important aspects to consider when trying to maximize the effectiveness of escape routes in the event of a tunnel fire is the distribution of the ceiling temperature along the longitudinal centerline. Several classical studies have been suggested on this topic13,14, all of which forecast an exponential decrease in temperature along the ceiling by utilizing the dimensionless temperature ratio. Hu et al. (2005)13 devised a straightforward method to forecast the decay in ceiling temperature based on theoretical research and comprehensive burning experiments,
 |
5 |
 |
6 |
where  is the distance from the reference point,
  is the location of the reference point,
  represents the heat transfer coefficient, and
  represents the wetted perimeter.
Under the action of longitudinal wind and ceiling concentrated smoke exhaust where the extraction opening is directly above the fire source, the attenuation coefficient of the smoke temperature upstream and downstream of the tunnel fire can be written as Eq. (7).
 |
7.1 |
 |
7.2 |
where  represents the smoke mass discharged from the shaft,
  represents the critical velocity,
  and
and  are the fitting coefficients.
However, when the fire source is far from the smoke vents, the smoke migration behavior upstream and downstream of the fire source shows obvious differences, as discussed in Sect. 7. Moreover, part of the smoke migrating to the side of the shaft will be discharged from the shaft18, thereby causing a variation in the temperature decay behavior between upstream and downstream. Therefore, another decay correlation was suggested by Tang, where the fire source is located downstream of the shaft.
 |
8.1 |
 |
8.2 |
where an ideal expression of the smoke mass rate was used27.
 |
9 |
With only shaft mechanical ventilation and smoke exhaust, the first result on the right side of Eq. (7) equals 1. Thereafter, substituting Eq. (9) into Eq. (7), the attenuation coefficient of the smoke temperature upstream and downstream of the fire source can be expressed as Eq. (10).
 |
10.1 |
 |
10.2 |
 |
11 |
where  is the discharged mass flow rate from the shaft. However, it should be noted that the relationship between the attenuation coefficient and the wind speed is not reflected in Eq. (10.1). Assuming that all the smoke upstream and downstream of the fire source is discharged from the tunnel, the attenuation coefficient approaches infinity. A linear increasing relationship between the decay coefficient and the dimensionless velocity was proposed in a longitudinal ventilated tunnel fire28. However, the decay coefficient is only inversely proportional to 1/3 power of the dimensionless heat release rate when the air velocity is very low29. In addition, there are obvious differences in the temperature distribution between the upstream and downstream of the fire source under low wind speeds and high wind speeds, as discussed in Sect. 7. Hence, a dimensional-induced velocity was proposed by referring to Li et al. (2011)’s10work in this study. In addition, the longitudinal temperature decay relationship of the two-stage function was recognized in previous studies30,31. In this work, we attempt to provide a simple expression of longitudinal temperature decay. The heat loss discharged from the shaft was assumed to be proportional to the total heat. Therefore, the decay coefficient relationship can be expressed as follows,
 |
12 |
where the dimensionless heat release rate can be expressed as  . Finally, substituting Eq. (12) into Eq. (5), the global longitudinal temperature distribution can be obtained. This smoke decay coefficient law will be explored below.
Dimensionless smoke temperature decay law
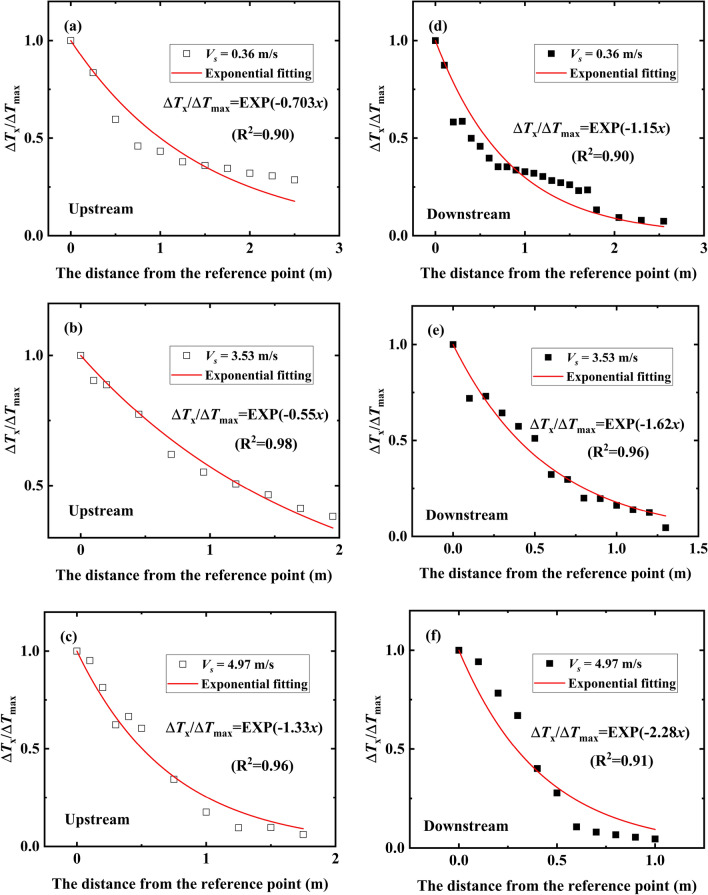
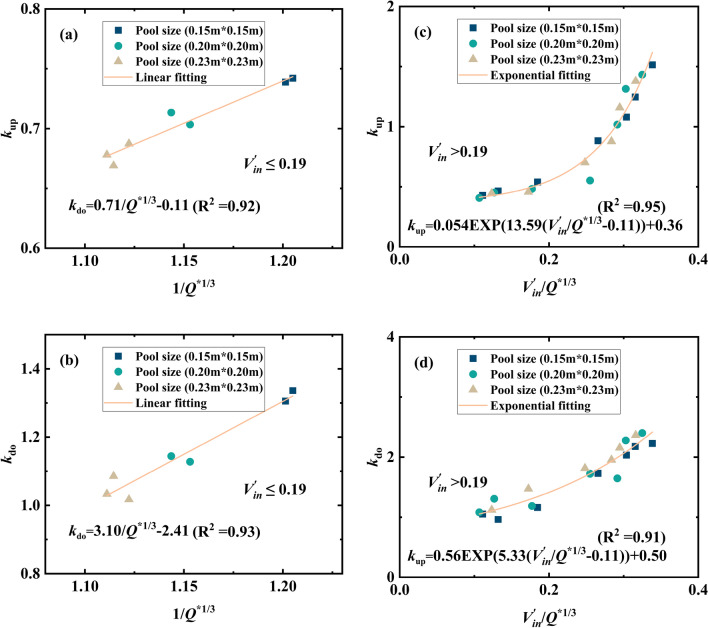
The smoke temperature attenuation upstream and downstream will be separately studied because they exhibit quite different responses to the smoke extraction rate as discussed above. Figure 11 shows the exponential fitting results of several typical conditions on the dimensionless smoke temperature distribution. All the correlation coefficients R2 were greater than 0.90, and the corresponding attenuation coefficients were summarized in Table 2. The attenuation coefficient k is related to the smoke extraction rate and the heat release rate. When the applied dimensionless induced velocity inside the tunnel is less than 0.19, the decay coefficients both upstream and downstream of the fire source are almost independent of the wind speed but are mainly determined by the heat release rate. However, such decay coefficients significantly increase with increasing wind velocity ( ). Moreover, the decay coefficients upstream are generally lower than that downstream. The factors that contribute to this situation are as follows, (1) Part of the smoke moving to the downstream side of the fire source flows out of the shaft, thereby a reduction of the smoke mass rate. Consequently, the decay coefficients increase, which can be easily understood according to Eq. (5). (2) The induced wind speed generated by the mechanical ventilation of the shaft has different effects on the smoke control behavior on both the upstream and downstream sides of the fire source. The primary factor may be the escalating fire resistance and frictional resistance in the vicinity of the fire plumes. The quantitative relationship of such attenuation coefficients, which will be revealed below.
Fig. 11.
Dimensionless longitudinal temperature of both upstream and downstream of the fire source (0.2 × 0.2 m).
Table 2.
All the decay coefficients upstream and downstream of the fire source.
| Test | V(m/s) | Pool size (m) | kup | kdo | Test | V(m/s) | Pool size (m) | kup | kdo |
|---|---|---|---|---|---|---|---|---|---|
| 1 | 0 | 0.15 × 0.15 | 0.687 | 1.011 | 10 | 0 | 0.20 × 0.20 | 0.703 | 1.128 |
| 2 | 0.36 | 0.660 | 1.008 | 11 | 0.36 | 0.723 | 1.144 | ||
| 3 | 1.14 | 0.428 | 1.052 | 12 | 1.14 | 0.407 | 1.081 | ||
| 4 | 2.03 | 0.465 | 0.961 | 13 | 2.03 | 0.451 | 1.307 | ||
| 5 | 2.79 | 0.540 | 1.162 | 14 | 2.79 | 0.482 | 1.187 | ||
| 6 | 3.53 | 0.882 | 1.731 | 15 | 3.53 | 0.552 | 1.724 | ||
| 7 | 4.31 | 1.079 | 2.033 | 16 | 4.31 | 1.018 | 1.648 | ||
| 8 | 4.97 | 1.246 | 2.178 | 17 | 4.97 | 1.314 | 2.277 | ||
| 9 | 5.61 | 1.514 | 2.226 | 18 | 5.61 | 1.433 | 2.403 | ||
| Test | V(m/s) | Pool size (m) | kup | kdo | Test | V(m/s) | Pool size (m) | kup | kdo |
| 19 | 0 | 0.23 × 0.23 | 0.739 | 1.217 | 24 | 3.53 | 0.23 × 0.23 | 0.701 | 1.814 |
| 20 | 0.36 | 0.742 | 1.306 | 25 | 4.31 | 0.876 | 1.954 | ||
| 21 | 1.14 | 0.758 | 1.336 | 26 | 4.97 | 1.158 | 2.156 | ||
| 22 | 2.03 | 0.446 | 1.121 | 27 | 5.61 | 1.379 | 2.367 | ||
| 23 | 2.79 | 0.457 | 1.474 |
The decay coefficients upstream and downstream obtained in Table 2 are plotted in Fig. 12 along with the values of the dimensionless heat release rate or the dimensionless induced longitudinal velocity. The plotted data and curves exhibit a linear or exponential reduction trend, where the decay coefficient relationship can be divided into two parts. For  , the attenuation coefficients both upstream and downstream decrease linearly with increasing
  . While for
  , such coefficients present an exponentially increasing trend with the increasing
  . All the fitting values of the Adj-R2 are greater than 0.93. This application result further verifies the rationality of the above theoretical analysis of the attenuation coefficient. Therefore, the expressions of the decay coefficient upstream and downstream of the fire source can be written as follows.
 |
13.1 |
 |
13.2 |
Fig. 12.
The empirical relationships of the decay coefficients upstream and downstream of the fire source.
Furthermore, a comparison was conducted to examine the accuracy of the proposed model of longitudinal temperature decay in this work, as shown in Fig. 13. Almost all the data are evenly distributed on both sides of the equivalent line (y = x), with a maximum error of ± 20%. The effect of smoke stratification in the far field of the fire source is poor in tunnel fires, which may lead to the deviation between the predicted results and the tested one. It is therefore the reason that several large data slightly exceed the error line. The similar situation also can be found in previous work28,30. It also can be seen that Liu 's model24overestimates the experimental results. The reason may be that the influence of shaft chimney effect on smoke migration was ignored. In Liu’s work, only smoke vents were set on the side of the tunnel, while the tunnel model in this work is connected by vertical shaft and tunnel through transverse channel. Whereas, the result obtained by Wang et al., 20214is lower than the test value in this paper, which may be due to the difference in tunnel structure. In addition, there is a strong mixing of smoke and air in the tunnel near the smoke outlet, for the lateral centralized smoke extraction system24. In this situation, the smoke flow re-circulation motion causes smoke to create a violent vortex that destabilizes the smoke layer and entrains large amounts of cold air. This may be another reason for the deviation of temperature distribution.
Fig. 13.
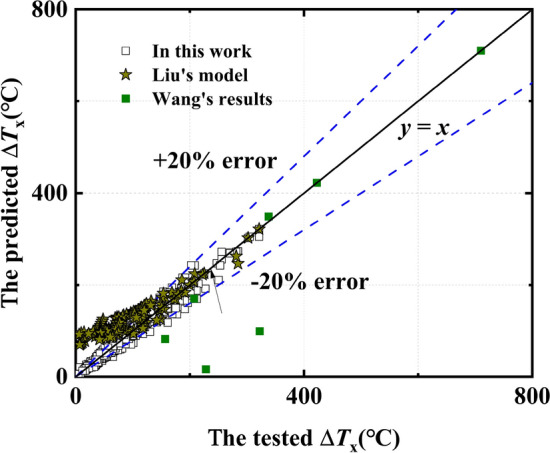
Comparison of the longitudinal smoke temperature excess tested with the predicted models in this work as well as previous results4,24.
Conclusions
A series of fire tests were carried out in a 1/10 scale model tunnel to investigate the effect of mechanical exhaust with a lateral open shaft on the ceiling temperature distribution. Three different pool sizes and numerous smoke extraction rates were utilized. Measurements were analyzed to gain insight into the influence of the extraction effect on the maximum temperature and ceiling temperature attenuation. Two empirical formulas were proposed to predict temperature distribution beneath the ceiling with an extraction effect. The main findings are summarized as follows.
(1) The smoke temperature downstream is greater than that upstream especially in the vicinity of the fire source, when the mechanical ventilation velocity is low. However, when the smoke is transported to the shaft control area, the smoke temperature downstream is lower than that upstream. When the applied mechanical velocity is large, the temperature distribution upstream of the fire source near the field is larger than that downstream.
(2) The parameter  was used to quantify the heat loss of smoke discharged from the shaft, where
  is 0.85 for
  and 0.71 for
  , respectively. Thus, a modified model of the maximum excess temperature was given under shaft mechanical ventilation.
(3) When the induced dimensionless longitudinal velocity is less than or equal to 0.19, the decay coefficients  upstream and downstream of the fire source are inversely proportional to
  . However,
  is proportional to
  , when the induced dimensionless longitudinal velocity is greater than 0.19. Finally, a longitudinal temperature distribution model under mechanical ventilation was proposed by performing a theoretical analysis and current measurements.
Acknowledgements
This work was supported by National Natural Science Foundation of China (NSFC) [Grant No. 52278415], National Key Research and Development Program of China [Grant No.2022YFC3801104], National and Regional Research Center of the " Belt and Road " of the National Ethnic Affairs Commission-Japan Emergency Management Research Center [Grant No. 2024RBYJGL-3], Innovation Fund Project of Hebei University of Engineering [Grant No. SJ2401002066], Sichuan Science and Technology Program (No.2022YFS0520), Natural Science Foundation of Hebei Province [Grant No. E2020402036], and Natural Science United Foundation of Hebei Province [Grant No. E2020402086]. The authors declare that there are no conflicts of interest regarding the publication of this paper.
List of symbols

Tunnel cross-sectional area (m2)

Thermal capacity of air (kJ/kg K)

Gravitational acceleration (m/s2)

Tunnel height (m)

Heat of combustion (kJ/g)

Longitudinal temperature decay coefficient upstream of fire source

Longitudinal temperature decay coefficient downstream of fire source

Smoke mass flow rate (kg/s)

Mass loss rate (g/s)

Total heat release rate (kW)

Dimensional heat release rate

Exhaust port cross-sectional area (m2)

The maximum excess temperature (℃)

Ambient temperature (℃)

Maximum rise temperature at a longitudinal distance x from fire source (℃)

Shaft smoke exhaust velocity (m/s)

Dimensional longitudinal velocity

Longitudinal induced velocity (m/s)

Dimensional longitudinal induced velocity

Smoke density (kg/m3)

Air density (kg/m3)

Combustion efficiency

Heat loss coefficient

The coefficient of induced velocity
Author contributions
Yuchun Zhang: Conceptualization, Formal analysis, Writing—originaldraft, Supervision, Project administration, Funding acquisition. Xinyu Liu: Resources, Formal analysis, Experiments, Data management analysis. Rui Tan: Resources, Formal analysis, Experiments, Data management analysis. Wei Hou:Conceptualization, Supervision, Project administration, Funding acquisition. Longfei Chen: Validation, Formal analysis. Shaoshuai Xing: Resources,Validation. Zhisheng Li: conceptualization, Formal analysis, Method, Writing—originaldraft, Supervision, Project administration, Funding acquisition. Yunhai Guo : Formal analysis, Validation. Xiaoqing Han:Formal analysis, Validation, Funding acquisition.
Funding
National Natural Science Foundation of China,52278415,National Key Research and Development Program of China,2022YFC3801104,Sichuan Science and Technology Program,2022YFS0520,Natural Science Foundation of Hebei Province,E2020402036,Innovation Fund Project of Hebei University of Engineering,SJ2401002066,National and Regional Research Center of the " Belt and Road " of the National Ethnic Affairs Commission-Japan Emergency Management Research Center,2024RBYJGL-3,Natural Science United Foundation of Hebei Province,E2020402086
Data availability
All data generated or analyzed during this study are included in this published article.
Competing interests
The authors declare no competing interests.
Footnotes
Publisher’s note
Springer Nature remains neutral with regard to jurisdictional claims in published maps and institutional affiliations.
References
- 1.Li, Z., Jiang, H., Cheng, Y., Gao, Y., Chen, L., Zhang, Y., Li, T., Xing, S., Effects of longitudinal fire source locations on the maximum temperature and longitudinal temperature decay in a mountain tunnel with vertical shaft, an experimental investigation and empirical model. J Therm Anal Calorim. 446 147(21), 12139–12154 (2022).
- 2.Li, Z. et al. Effect of Fire Source Elevation on the Smoke Spreading Characteristics in an Extra-Long Tunnel. Fire Technol.60(2), 1313–1332 (2022). [Google Scholar]
- 3.Li, Z. et al. Experimental Study on the fluence of Fire Source Elevation on Smoke Temperature Profile Driven by Buoyancy in a Full-scale Mountain Tunnel. CST.195(6), 1151–1168 (2021). [Google Scholar]
- 4.Wang, M., Guo, X., Yu, L., Zhang, Y. & Tian, Y. Experimental and numerical studies on the smoke extraction strategies by longitudinal ventilation with shafts during tunnel fire. Tunnel. Underground Space Technol.116, 104030 (2021). [Google Scholar]
- 5.Alarie, Y. Toxicity of fire smoke. Crit. Rev. Toxicol.32, 259–289 (2002). [DOI] [PubMed] [Google Scholar]
- 6.Beard, A. N. Fire safety in tunnels. Fire Saf. J.44, 276–278 (2009). [Google Scholar]
- 7.Carvel, R., Marlair, G., Handbook of Tunnel Fire Safety-A history of fire incidents in tunnels. (ICE 2005).
- 8.Mei, F., Tang, F., Ling, X. & Yu, J. Evolution characteristics of fire smoke layer thickness in a mechanical ventilation tunnel with multiple point extraction. Appl. Therm. Eng.111, 248–256 (2017). [Google Scholar]
- 9.Jiang, Y. et al. Full-scale fire tests in the underwater tunnel section model with sidewall smoke extraction. Tunnel. Underground Space Technol.122, 104374 (2022). [Google Scholar]
- 10.Li, Y. Z., Lei, B. & Ingason, H. The maximum temperature of buoyancy-driven smoke flow beneath the ceiling in tunnel fires. Fire Saf. J.46, 204–210 (2011). [Google Scholar]
- 11.Kurioka, H., Oka, Y., Satoh, H. & Sugawa, O. Fire properties in near field of square fire source with longitudinal ventilation in tunnels. Fire Saf. J.38, 319–340 (2003). [Google Scholar]
- 12.Gong, L. et al. Theoretical and experimental study on longitudinal smoke temperature distribution in tunnel fires. Int J Therm Sci.102, 319–328 (2016). [Google Scholar]
- 13.Hu, L.H., Huo, R., Chow, W.K., WANG, H.B., YANG, R.X., Decay of buoyant smoke layer temperature along the longitudinal direction in tunnel fires. J. Appl. Fire Sci. 13, 53–77 (2005).
- 14.Ingason, H., Li, Y. & Lönnermark, A. Tunnel Fire Dynamics (Springer, 2015). [Google Scholar]
- 15.Ji, J., Fan, C. G., Zhong, W., Shen, X. B. & Sun, J. H. Experimental investigation on influence of different transverse fire locations on maximum smoke temperature under the tunnel ceiling. Int J Therm Sci.55, 4817–4826 (2012). [Google Scholar]
- 16.Hu, L. H., Chen, L. F. & Tang, W. A global model on temperature profile of buoyant ceiling gas flow in a channel with combining mass and heat loss due to ceiling extraction and longitudinal forced air flow. Int J Therm Sci.79, 885–892 (2014). [Google Scholar]
- 17.Tang, F., He, Q., Mei, F., Wang, Q. & Zhang, H. Effect of ceiling centralized mechanical smoke exhaust on the critical velocity that inhibits the reverse flow of thermal plume in a longitudinal ventilated tunnel. Tunnel. Underground Space Technol.82, 191–198 (2018). [Google Scholar]
- 18.Tang, F., Gao, Z. L., He, Z., Liang, X. & Wang, Q. Thermal plume temperature profile of buoyancy driven ceiling jet in a channel fire using ceiling smoke extraction. Tunnel. Underground Space Technol.78, 215–221 (2018). [Google Scholar]
- 19.Tang, F. et al. Fire-induced temperature distribution beneath ceiling and air entrainment coefficient characteristics in a tunnel with point extraction system. Int J Therm Sci.134, 363–369 (2018). [Google Scholar]
- 20.Chen, J. j., Fang, Z., Yuan, J.p., Numerical Simulation about Smoke Vent Arrangement Influence on Smoke Control in Double-decked Tunnel. Procedia Engineering. 52, 48–55 (2013).
- 21.Xu, P., Xing, R. J., Jiang, S. P. & Li, L. J. Theoretical prediction model and full-scale experimental study of central smoke extraction with a uniform smoke rate in a tunnel fire. Tunnel. Underground Space Technol.86, 63–74 (2019). [Google Scholar]
- 22.Zhu, Y., Tang, F. & Huang, Y. Experimental study on the smoke plug-holing phenomenon and criteria in a tunnel under the lateral smoke extraction. Tunnel. Underground Space Technol.121, 104330 (2022). [Google Scholar]
- 23.Zhang, X. et al. Investigation on smoke temperature distribution in a double-deck tunnel fire with longitudinal ventilation and lateral smoke extraction. Case Stud Therm Eng.13, 100375 (2019). [Google Scholar]
- 24.Liu, Q. et al. A multi-scale experiment analysis of air entrainment and heat exhaust coefficient under lateral smoke exhaust in tunnel fires. Tunnel. Underground Space Technol.140, 105239 (2023). [Google Scholar]
- 25.Du, T., Yang, D. & Ding, Y. Driving force for preventing smoke backlayering in downhill tunnel fires using forced longitudinal ventilation. Tunnel. Underground Space Technol.79, 76–82 (2018). [Google Scholar]
- 26.Han, J. et al. Effect of ceiling extraction on the smoke spreading characteristics and temperature profiles in a tunnel with one closed end. Tunnel. Underground Space Technol.119, 104236 (2022). [Google Scholar]
- 27.Zukovski. E., K.T., Cetegen Baki, Entrainment in Fire Plumes. Fire Saf. J. 3, 107–121 (1981).
- 28.Huang, Y. et al. Experimental study on the temperature longitudinal distribution induced by a branched tunnel fire. Int J Therm Sci.170, 107175 (2021). [Google Scholar]
- 29.Liu, C., Zhong, M., Shi, C., Zhang, P. & Tian, X. Temperature profile of fire-induced smoke in node area of a full-scale mine shaft tunnel under natural ventilation. Appl. Therm. Eng.110, 382–389 (2017). [Google Scholar]
- 30.Li, Z., Zhang, Y., Gao, Y., Chen, L. & Li, T. Study the maximum temperature of diffusion smoke downstream in a longitudinal ventilated branched tunnel with different transverse fire locations. Tunnel. Underground Space Technol.146, 105663 (2024). [Google Scholar]
- 31.Zhang, T. et al. Study on temperature decay characteristics of fire smoke backflow layer in tunnels with wide-shallow cross-section. Tunnel. Underground Space Technol.112, 103874 (2021). [Google Scholar]
Associated Data
This section collects any data citations, data availability statements, or supplementary materials included in this article.
Data Availability Statement
All data generated or analyzed during this study are included in this published article.


