Abstract
This study aimed to investigate the correlation and predictive value of TyG and related parameters with metabolic dysfunction-associated fatty liver disease (MAFLD) MAFLD. This study retrospectively included individuals who underwent health examinations and abdominal ultrasound from July 2021 to June 2024 at the Affiliated Hospital of Southwest Medical University, Sichuan Province, China. A total of 71,299 subjects’ clinical and laboratory data were extracted, the correlation between TyG and related parameters and MAFLD was analyzed via univariate and multivariate logistic regression methods, and the nonlinear relationship between the TyG index and the risk of MAFLD was explored via restricted cubic spline (RCS) analysis. The predictive value of TyG and related parameters for MAFLD was assessed using the receiver operating characteristic (ROC) curves and the area under the ROC curve (AUC). TyG and related parameters were positively correlated with MAFLD, and the results remained unchanged after adjustment for the corresponding parameters. RCS analysis revealed a significant dose‒response relationship between TyG and related parameters and MAFLD. ROC curve analysis revealed AUC values of 0.83 (0.82–0.83), 0.92 (0.91–0.92), 0.90 (0.90–0.91), and 0.87 (0.87–0.88) for TyG, TyG-BMI, TyG-WC, and TyG-WHR, respectively. Subgroup analyses revealed that the TyG index and related parameters had greater predictive value in the female, younger, and BMI < 23.7 populations.
Keywords: TyG and related parameters, MAFLD, Correlation analysis
Introduction
In 2020, an international panel of experts proposed metabolic dysfunction-associated fatty liver disease (MAFLD), an umbrella term for the liver diseases steatosis, metabolic steatohepatitis (MeSH) (formerly known as nonalcoholic steatohepatitis), MAFLD-associated cirrhosis and hepatocellular carcinoma (HCC)1. According to previous studies, the global prevalence of MAFLD is 50.7%2, and the number of MAFLD cases and annual liver-related deaths are expected to increase significantly by 20303. In addition, MAFLD is associated with a variety of adverse clinical sequelae that may ultimately lead to increased mortality, including severe hepatic inflammation and fibrosis, metabolic and cardiovascular disease, and extrahepatic cancers. Therefore, early detection of MAFLD and intervention to slow its progression are essential.
Liver biopsy is the gold standard for diagnosing MAFLD, but it is unsuitable for large-scale population screening because of its invasive nature and complexity of operation. MAFLD is causally related to obesity and insulin resistance (IR), which are mutually reinforcing4. Homeostasis model assessment of insulin resistance (HOMA-IR) is the gold standard for IR and offers excellent diagnostic value for MAFLD. However, the HOMA-IR cannot be widely used in clinical practice because of its high cost and complexity5. In recent years, the triglyceride-glucose (TyG) index has been recommended as a simple alternative marker for IR6. Jing Wang et al. reported that the sensitivity of the TyG index for diagnosing MAFLD was 73%, the specificity was 67%, and the AUC was 0.75, indicating that the TyG index offers excellent diagnostic value for MAFLD7. TyG-BMI, TyG-WC, and TyG-WHR are obtained by combining the TyG index with obesity indicators such as BMI, WC, and WHR. Some studies have shown that the TyG-BMI, TyG-WC, and TyG-WHR achieve greater predictive performance than the TyG index for MAFLD in the overall population5,8. However, the sample sizes of these studies were small, so this study aimed to investigate the correlation and predictive value of TyG and related parameters with MAFLD.
Material and methods
Participants
This study retrospectively included people who underwent health examinations and completed abdominal ultrasonography from July 2021 to June 2024 at the Affiliated Hospital of Southwest Medical University, Sichuan Province, China. The exclusion criteria were major liver diseases such as primary hepatocellular carcinoma, cholangiocellular carcinoma, and giant liver cysts; a history of liver surgery; missing important data; and pregnancy.
A total of 95,075 subjects with perfect abdominal ultrasound data were included; 23,676 cases with missing data, 97 cases of significant liver disease, and 3 cases of pregnancy were excluded; 71,299 subjects were ultimately included. All methods were carried out in accordance with relevant guidelines and regulations. The Ethics Committee of the Affiliated Hospital of Southwest Medical University approved all the experimental protocols and waived informed consent because this was a retrospective study.
Data collection and measure
Variables collected included demographics (age, sex), anthropometrics (body mass index [BMI], systolic blood pressure [SBP], diastolic blood pressure [DBP], waist circumference [WC], waist-to-hip ratio [WHR]), laboratory tests (alanine aminotransferase [ALT], aspartate aminotransferase [AST], low-density lipoprotein cholesterol [LDL-C], high-density lipoprotein cholesterol [HDL-C], total cholesterol [TC], triglycerides [TG], fasting glucose [FPG]).
The participants rested for five minutes before both the systolic and diastolic blood pressure in the right arm were measured while the participants were in a seated position. Hypertension was defined as systolic blood pressure ≥ 140 mmHg, diastolic blood pressure ≥ 90 mmHg, or being on antihypertensive medication. Diabetes mellitus is defined by HbA1c ≥ 6.5%, fasting blood glucose > 7 mmol/L, or the use of antidiabetic medication9.
The triglyceride‒glucose index and related parameters were calculated via the following formula:10
 |
MAFLD
The ultrasound diagnosis of hepatic steatosis is based on the following ultrasound patterns: hepatic and renal echo contrast, liver parenchymal brightness, depth attenuation, and vascular blurring11. The diagnosis of MAFLD is based on the diagnosis of hepatic steatosis by abdominal ultrasound and one of the following three criteria: overweight or obesity, type 2 diabetes mellitus, or metabolic dysfunction. Metabolic dysfunction requires the presence of at least two of the following metabolic risks: (1) male WC ≥ 90 cm, female WC ≥ 80 cm; (2) blood pressure ≥ 130/85 mmHg or specific drug treatment; (3) hypertriglyceridemia (TG ≥ 1.70 mmol/L or on lipid-lowering therapy); (4) HDL-C < 1.0 mmol/L in men, < 1.3 mmol/L in women; (5) prediabetes (FPG 5.6–6.9mmol/L, HbA1c 5.7–6.4%)12.
Statistical analysis
Nonnormal continuous variables were analyzed via the Mann‒Whitney U test, categorical variables were analyzed via the Chi-square test for baseline characteristics, and differences between the two groups were compared. Continuous variables are described as medians and interquartile ranges, whereas categorical variables are expressed as frequencies or percentages.
Univariate and multivariate logistic regression methods were used to analyze the associations of TyG and related parameters with MAFLD. Restricted cubic spline (RCS) analyses were used to explore the nonlinear relationship between TyG indices and the risk of MAFLD. The predictive value of TyG and related parameters for MAFLD was assessed via receiver operating characteristic (ROC) curves and the area under the ROC curve (AUC), and subgroup analyses were performed according to sex, age, BMI, and the presence of comorbid diabetes. All analyses were performed in R (v.4.4.2, R Foundation), SPSS v.27.0, and MedCalc v.23.0 software. All p values are based on two-tailed tests, and p < 0.05 was considered statistically significant.
Results
Baseline characteristics
A total of 71,299 participants were enrolled in this study, and the baseline characteristics of the participants are shown in Table 1. Among the 71,299 participants, 24,283 (34.05%) had MAFLD, and 47,106 had non-MAFLD. The mean age of the patients with MAFLD was 49 years, and the prevalence of the disease was greater in men (72.01%) than in women (27.99%). There was a greater percentage of comorbid diabetes and hypertension in MAFLD patients than in non-MAFLD patients. In addition, biochemical indices such as AST/ALT, AST, ALT, SBP, DBP, TG, FPG, TC, GGT, HDL-C, LDL-C, BMI, WC, and WHR were significantly different between the two groups (P < 0.001).
Table 1.
Baseline characteristics.
| Variables | MAFLD (n = 24,283) | Without MAFLD (47,016) | P-value |
|---|---|---|---|
| Age | 49 (38, 56) | 41 (32, 52) | P < 0.001 |
| AST/ALT | 0.83 (0.66, 1.03) | 1.17 (0.93, 1.44) | P < 0.001 |
| ALT | 29.20 (20.70, 43.00) | 17.5 (13.00, 24.80) | P < 0.001 |
| GGT | 35.30 (23.30, 58.00) | 17.3 (12.7, 26.6) | P < 0.001 |
| LDL-C | 3.33 (2.81, 3.85) | 2.98 (2.51, 3.50) | P < 0.001 |
| AST | 24.20 (20.10, 30.30) | 20.60 (17.50, 24.70) | P < 0.001 |
| TC | 5.23 (4.59, 5.92) | 4.89 (4.30, 5.55) | P < 0.001 |
| HDL-C | 1.24 (1.08, 1.43) | 1.50 (1.29, 1.74) | P < 0.001 |
| FPG | 5.30 (4.89, 5.95) | 4.89 (4.59, 5.22) | P < 0.001 |
| TG | 173.55 (122.19, 253.24) | 92.97 (69.07, 129.28) | P < 0.001 |
| WHR | 0.91 (0.88, 0.95) | 0.83 (0.78, 0.88) | P < 0.001 |
| SBP | 127 (117, 137) | 115 (105, 126) | P < 0.001 |
| DBP | 78 (70, 85) | 70 (64, 77) | P < 0.001 |
| WC | 90 (85, 96) | 77 (71, 83) | P < 0.001 |
| BMI | 26.59 (24.92, 28.55) | 22.36 (20.62, 24.17) | P < 0.001 |
| TyG | 6.17 (5.79, 6.59) | 5.43 (5.11, 5.80) | P < 0.001 |
| TyG-WC | 558.26 (508.94, 614.99) | 418.15 (369.91, 473.25) | P < 0.001 |
| TyG-BMI | 164.82 (149.79, 182.71) | 121.79 (107.57, 137.40) | P < 0.001 |
| TyG-WHR | 5.63 (5.18, 6.15) | 4.50 (4.07, 4.99) | P < 0.001 |
| History of hypertension | P < 0.001 | ||
| No | 16,027 (66.00%) | 41,278 (87.80%) | |
| Yes | 8256 (34.00%) | 5738 (12.20%) | |
| History of diabetes | P < 0.001 | ||
| No | 21,257 (87.53%) | 45,959 (97.75%) | |
| Yes | 3026 (12.46%) | 1057 (2.25%) | |
| Sex | P < 0.001 | ||
| Males | 17,487 (72.01%) | 19,847 (42.21%) | |
| Females | 6796 (27.99%) | 27,169 (57.79%) | |
Continuous variables are presented as median with the IQR (M (P25, P75)).
Categorical variables are presented as frequencies (percentages).
ALT alanine aminotransferase, AST aspartate transaminase, BMI body mass index, DBP diastolic blood pressure, FPG fasting plasma glucose, GGT gamma-glutamyltransferase, HDL high-density lipoprotein, SBP systolic blood pressure, TC total cholesterol, TG serum triglyceride, TyG triglyceride–glucose, TyG-BMI triglyceride–glucose body mass index, TyG-WC triglyceride–glucose waist circumference, TyG-WHR triglyceride–glucose waist-to-hip ratio, WC waist circumference, WHR waist-to-hip ratio.
Correlation analysis of TyG and its related parameters with MAFLD
The correlations of TyG and related parameters with MAFLD were analyzed via univariate and multivariate logistic regression, and the results are shown in Supplementary Table S1. In the crude model, TyG, TyG-BMI, TyG-WC, and TyG-WHR were positively correlated with MAFLD. In Model 1, adjusted for sex and age, TyG and related parameters were still positively correlated with MAFLD. Model 2 was adjusted for sex, age, BMI, hypertension, and diabetes mellitus, and Model 3 was adjusted for sex, age, BMI, hypertension, diabetes mellitus, AST/ALT, AST, ALT, TC, GGT, HDL-C, and LDL-C. TyG and related parameters were still positively correlated with MAFLD in Model 2 and Model 3.
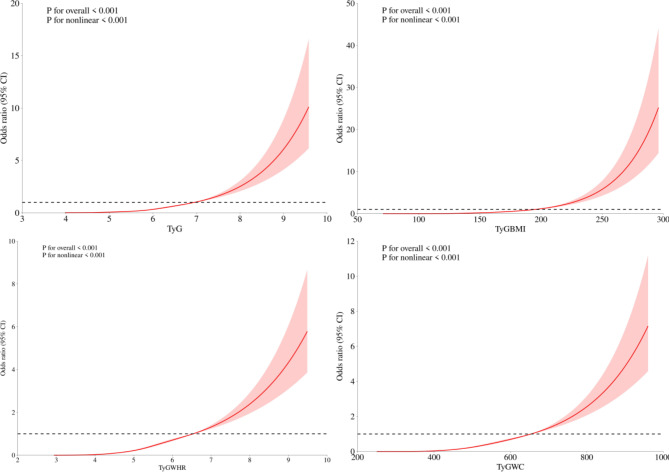
The dose‒response relationships of TyG and related parameters with MAFLD were analyzed via RCS. As shown in Fig. 1, the OR of MAFLD increased with increasing TyG, TyG-BMI, TyG-WC, and TyG-WHR, indicating a significant dose‒response relationship.
Fig. 1.
Restricted cubic spline modelling of TyG and associated parameters with MAFLD and associated parameters.
Predictive value of TyG and related parameters for MAFLD
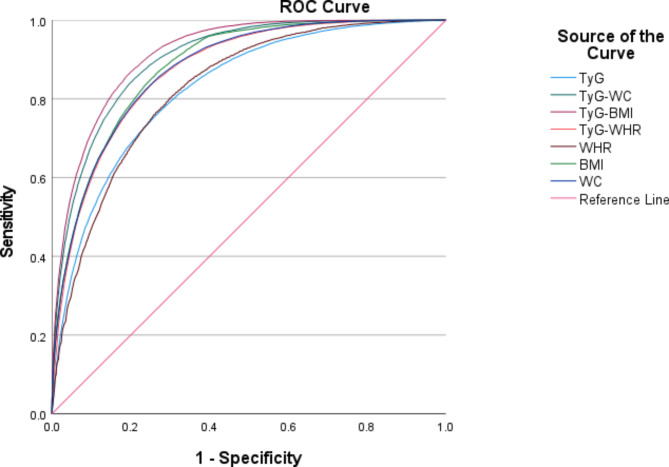
Figure 2 below shows the predictive value of traditional metrics, including WC, BMI, and WHR, with respect to TyG and related parameters for MAFLD, with a maximum AUC value of 0.92 (0.91–0.92) for TyG-BMI, 0.90 (0.90–0.91) for TyG-WC, 0.88 (0.88–0.89) for BMI, and 0.88 (0.87–0.88) for WC, and the AUC values of TyG-WHR, TyG, and WHR were 0.87 (0.87–0.88), 0.83 (0.82–0.83), and 0.83 (0.82–0.83), respectively. The results showed that TyG-BMI and TyG-WC had greater predictive value for MAFLD than did traditional indicators.
Fig. 2.
Receiver operating characteristic curves for TyG and related parameters and traditional metrics.
Value of MAFLD prediction by sex
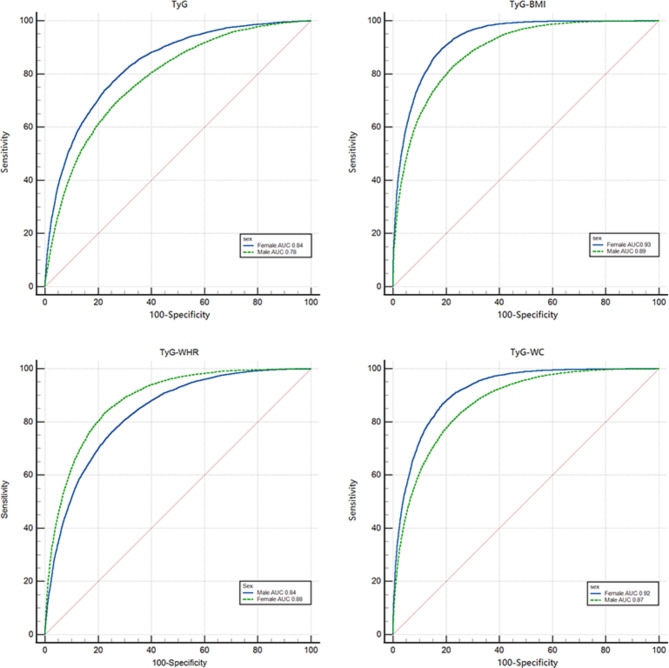
As shown in Fig. 3, TyG and related parameters had better predictive value for females in the gender subgroups, with AUCs of 0.84, 0.93, 0.92, and 0.88 for TyG, TyG-BMI, TyG-WC, and TyG-WHR in females, respectively, and AUC values of 0.78, 0.89, 0.87, and 0.84 for males, respectively. Among both the female and male subgroups, the TyG-BMI performed best overall, with sensitivity and specificity of 0.82 and 0.89, respectively, in the female subgroup and 0.77 and 0.83, respectively, in the male subgroup. The related results are shown in Supplementary Table S2.
Fig. 3.
Receiver operating characteristic curves with TyG and related parameters for different sexes.
Value of MAFLD prediction by BMI
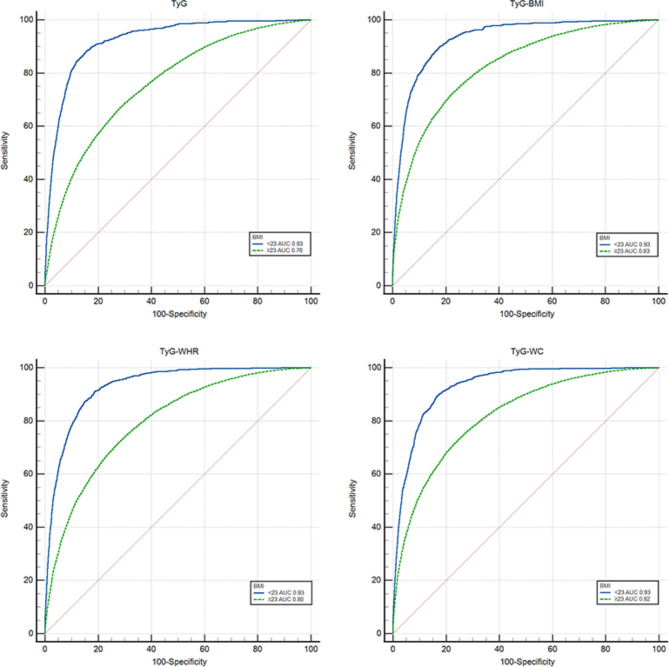
According to the diagnostic criteria for MAFLD, BMI ≥ 23 was defined as overweight/obese, and BMI < 23 was defined as lean/normal. As shown in Fig. 4, the results of the study revealed that TyG and related parameters had better predictive value for MAFLD with lean/normal body mass, and the AUCs of TyG, TyG-BMI, TyG-WC, and TyG-WHR were 0.93. The AUCs for TyG, TyG-BMI, TyG-WC, and TyG-WHR in the overweight/obese group were 0.76, 0.83, 0.82, and 0.80, respectively.
Fig. 4.
Receiver operating characteristic curves with TyG and related parameters for different BMI.
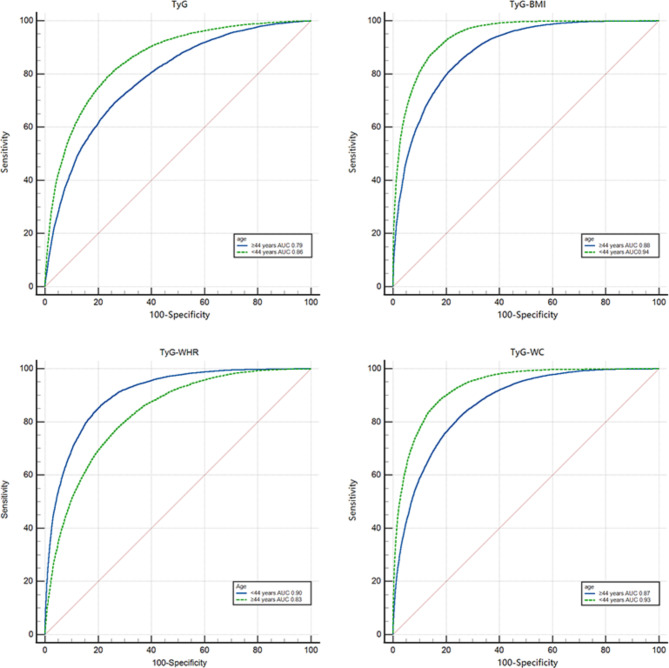
Value of MAFLD prediction by age
The results of the study, as shown in Fig. 5, revealed that the TyG score and related parameters had better predictive value for MAFLD at ages younger than 44 years, with AUCs of 0.86, 0.94, 0.93, and 0.90 for TyG, TyG-BMI, TyG-WC and TyG-WHR, respectively, and 0.79, 0.88, 0.87 and 0.83 for those aged older than 44 years. The best overall performance of the two groups was for TyG-BMI, with sensitivity and specificity of 0.83 and 0.90, respectively, for those aged younger than 44 years and sensitivity and specificity of 0.83 and 0.90, respectively, for those aged older than 44 years.
Fig. 5.
Receiver operating characteristic curves with TyG and related parameters for different age.
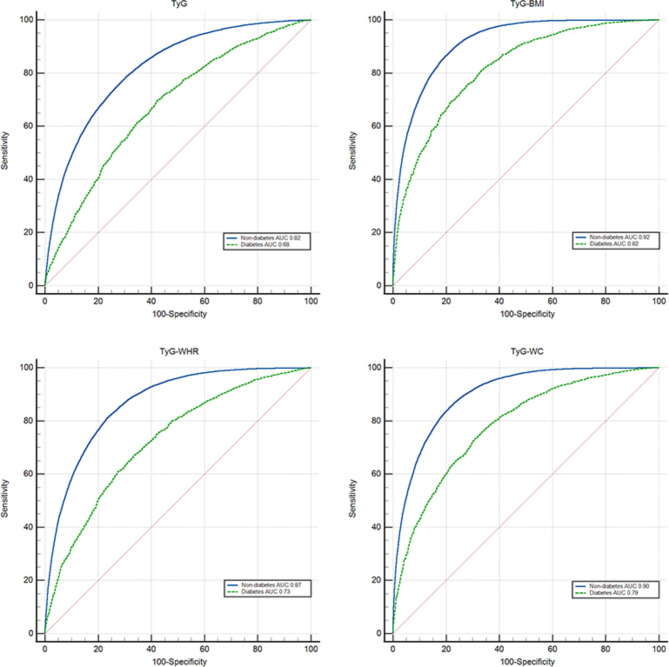
Predictive value of TyG and related parameters for MAFLD in diabetic and nondiabetic patients
The results of the present study, as shown in Fig. 6, revealed that TyG and related parameters had greater diagnostic value for MAFLD in nondiabetic patients, and the AUCs of TyG, TyG-BMI, TyG-WC, and TyG-WHR in nondiabetic patients were 0.82, 0.92, 0.90, and 0.87, respectively. In diabetic patients, the AUCs of TyG, TyG-BMI, TyG-WC, and TyG-WHR were 0.68, 0.82, 0.79, and 0.73, respectively. TyG-BMI performed best in both the diabetes and nondiabetes groups and offered better predictive value for MAFLD, with sensitivity and specificity of 0.80 and 0.86, respectively, in the diagnosis of MAFLD in nondiabetic patients and 0.72 and 0.76, respectively, in the diagnosis of MAFLD in diabetic patients.
Fig. 6.
Receiver operating characteristic curves with TyG and related parameters for diabetes.
Discussion
Studies have shown that the development of MAFLD is closely associated with insulin resistance and metabolic syndromes such as obesity, hyperlipidemia, hypertension, and hyperglycemia13. In recent years, with the increasing prevalence of obesity and type 2 diabetes mellitus (T2DM), the prevalence of MAFLD has rapidly increased14. However, the onset of MAFLD is insidious, and most patients are asymptomatic. By the time MAFLD is detected, the majority of patients have progressed to cirrhosis or even hepatocellular carcinoma, so early detection and intervention are particularly important.
The mathematical model of the TyG index, first derived by Simental and others, is a simple proxy for assessing IR. As the calculation of TyG and related parameters is based on triglycerides and fasting blood glucose, these methods are well suited for large-scale epidemiological studies7,15. Previous studies have shown that the TyG index and related parameters are good predictors of NAFLD/MAFLD16. However, unlike previous studies, the present study had a larger sample size and grouped age, sex, and BMI to more comprehensively analyze the ability of TyG and related parameters to screen for MAFLD in a healthy population.
The results of this study revealed that the OR values of TyG, TyG-BMI, TyG-WC, and TyG-WHR were greater than 1 after further parameter adjustment, indicating that TyG and related parameters were closely associated with MAFLD. The RCS analysis also revealed that the levels of TyG and related parameters had a significant dose‒response relationship with the OR values of MAFLD, which was consistent with the findings of previous studies5,6,17.
Xue et al. reported that the AUCs (95% CIs) of TyG-WC, TyG-WHR, and TyG-BMI for the prediction of MAFLD were 0.832 (0.814–0.850), 0.826 (0.808–0.844), and 0.822 (0.803–0.840), respectively, suggesting that TyG and related parameters have good predictive value for MAFLD17. In another study, which included 4241 Iranian people between the ages of 35–75 years, the results of the study revealed that TyG syndrome predicted MAFLD, with an AUC value of 0.862 and sensitivity and specificity of 81.66% and 75.36%, respectively, which indicated that TyG is a reliable indicator for screening NAFLD/MAFLD18. A study by Mohammad E Khamseh et al. confirmed that TyG-WC, TyG-BMI, and TyG-WHR are the best predictors of MAFLD19. Zheng et al. conducted a nine-year follow-up of 4539 patients without NAFLD, and the results of the study showed that TyG could effectively predict the risk of NAFLD for several years and that its AUC value exceeded those of traditional indicators such as TG and FPG20. In contrast to previous studies, we analyzed and compared the predictive value of the TyG score and related parameters with traditional indicators for MAFLD, and the results revealed that the TyG-BMI and TyG-WC scores offered high predictive value for MAFLD.
Our results showed that TyG and related parameters had higher AUC values in women aged < 44 years. This may be related to the complex sex differences with respect to obesity and other metabolic factors associated with MAFLD and the accumulation of excess body fat in young people with irregular diets and insufficient physical activity21,22.
Metabolic health is defined as the absence of cardiometabolic disease or risk factors that predict the future development of such disease, and total calories and diet quality may be independent determinants of metabolic health. MAFLD patients with normal BMI, which we refer to as those with lean/normal body mass23, have an unclear pathophysiological mechanism, but metabolic unhealthiness may be a key determinant24. Some studies have shown that metabolically unhealthy individuals are at high risk of developing MAFLD regardless of BMI. In contrast, the results of the present study showed that TyG and related parameters had greater predictive value for MAFLD in those with lean/normal body mass, which may be related to the fact that most of this population is metabolically unhealthy. In addition, we also found higher AUC values for TyG and related parameters for MAFLD in nondiabetic patients, which may be related to the higher prevalence of prediabetes in the nondiabetic subgroup.
The primary strengths of this study include the large sample size, the use of the latest international diagnostic standards to define MAFLD, and the use of strict screening criteria; secondly, this study comprehensively evaluated the correlation and predictive value of TyG and related parameters with MAFLD and performed subgroup analyses to demonstrate the general applicability of TyG and related parameters in predicting MAFLD. At the same time, there are several limitations in this study. First, this was a retrospective study, and the causal relationships between TyG and related parameters and MAFLD could not be determined. Second, this study was a single-center, cross-sectional analysis, which may be subject to selection bias. Therefore, a multicenter, prospective study is needed to further validate our findings. Third, this study used abdominal ultrasound to diagnose MAFLD, and the sensitivity of ultrasound examination may be reduced when hepatic steatosis is less than 30%25. Liver biopsy, although the gold standard for diagnosing MAFLD, cannot be applied for mass population screening.
Conclusions
TyG and related parameters were significantly associated with MAFLD, and there was a dose‒response relationship between OR and TyG and related parameters. TyG and related parameters, especially TyG-BMI, can be used to detect MAFLD early and guide interventions.
Supplementary Information
Author contributions
All authors participated in the study’s conception and design. Xin Yang and Huiting Rao designed the study, while Yi Yuan, Nan Hu, Xinmei Zhang, and Yingxin Zeng conducted it and analyzed the data. Guodong Xia provided a critical review of the study. Xin Yang and Huiting Rao wrote the first draft and the final version. All authors were involved in data interpretation, writing, and finalizing the manuscript.
Data availability
The datasets used and analysed during the current study available from the corresponding author on reasonable request.
Declarations
Competing interests
The authors declare no competing interests.
Footnotes
Publisher’s note
Springer Nature remains neutral with regard to jurisdictional claims in published maps and institutional affiliations.
Supplementary Information
The online version contains supplementary material available at 10.1038/s41598-024-84809-y.
References
- 1.Pinyol, R. et al. Molecular characterisation of hepatocellular carcinoma in patients with non-alcoholic steatohepatitis. J. Hepatol.75(4), 865–878 (2021). [DOI] [PubMed] [Google Scholar]
- 2.Pipitone, R. M. et al. MAFLD: a multisystem disease. Ther. Adv. Endocrinol. Metab.14, 20420188221145548 (2023). [DOI] [PMC free article] [PubMed] [Google Scholar]
- 3.Bae, S. D. W., George, J. & Qiao, L. From MAFLD to hepatocellular carcinoma and everything in between. Chin. Med. J.135(5), 547–556 (2022). [DOI] [PMC free article] [PubMed] [Google Scholar]
- 4.Hepatology, C. S. O. Guidelines for the prevention and treatment of metabolic dysfunction-associated (non-alcoholic) fatty liver disease (Version 2024). Chin. J. Hepatol.05, 418–434 (2024). [DOI] [PubMed] [Google Scholar]
- 5.Yu, R. et al. Diagnostic value of triglyceride-glucose index and related parameters in metabolism-associated fatty liver disease in a Chinese population: a cross-sectional study. BMJ Open13(9), e075413 (2023). [DOI] [PMC free article] [PubMed] [Google Scholar]
- 6.Zhang, R. et al. Association between triglyceride-glucose index and risk of metabolic dysfunction-associated fatty liver disease: a cohort study. Diabetes Metab. Syndr. Obes.15, 3167–3179 (2022). [DOI] [PMC free article] [PubMed] [Google Scholar]
- 7.Wang, J. et al. The diagnostic and prognostic value of the triglyceride-glucose index in metabolic dysfunction-associated fatty liver disease (MAFLD): a systematic review and meta-analysis. Nutrients14(23), 4969 (2022). [DOI] [PMC free article] [PubMed]
- 8.Peng, H. et al. Prediction of MAFLD and NAFLD using different screening indexes: A cross-sectional study in U.S. adults. Front. Endocrinol. (Lausanne) 14, 1083032 (2023). [DOI] [PMC free article] [PubMed]
- 9.Koh, S. M. et al. Comparison of the effects of triglyceride variability and exposure estimate on clinical prognosis in diabetic patients. Cardiovasc. Diabetol.21(1), 245 (2022). [DOI] [PMC free article] [PubMed] [Google Scholar]
- 10.Chang, M., Shao, Z. & Shen, G. Association between triglyceride glucose-related markers and the risk of metabolic-associated fatty liver disease: a cross-sectional study in healthy Chinese participants. BMJ Open13(5), e070189 (2023). [DOI] [PMC free article] [PubMed] [Google Scholar]
- 11.Yuan, Y. et al. Development and validation of a nomogram model for predicting the risk of MAFLD in the young population. Sci. Rep.14(1), 9376 (2024). [DOI] [PMC free article] [PubMed] [Google Scholar]
- 12.Eslam, M. et al. A new definition for metabolic dysfunction-associated fatty liver disease: An international expert consensus statement. J. Hepatol.73(1), 202–209 (2020). [DOI] [PubMed] [Google Scholar]
- 13.Sangro, P., De La Torre Aláez, M. Sangro, B, et al. Metabolic dysfunction-associated fatty liver disease (MAFLD): an update of the recent advances in pharmacological treatment. J. Physiol. Biochem.79(4), 869–879 (2023). [DOI] [PMC free article] [PubMed]
- 14.Khaznadar, F. et al. MAFLD pandemic: updates in pharmacotherapeutic approach development. Curr. Issues Mol. Biol.46(7), 6300–6314 (2024). [DOI] [PMC free article] [PubMed] [Google Scholar]
- 15.Zou, H. et al. Comparison of the diagnostic performance of twelve noninvasive scores of metabolic dysfunction-associated fatty liver disease. Lipids Health Dis.22(1), 145 (2023). [DOI] [PMC free article] [PubMed] [Google Scholar]
- 16.Sheng, G. et al. The usefulness of obesity and lipid-related indices to predict the presence of non-alcoholic fatty liver disease. Lipids Health Dis.20(1), 134 (2021). [DOI] [PMC free article] [PubMed] [Google Scholar]
- 17.Xue, Y. et al. Potential screening indicators for early diagnosis of NAFLD/MAFLD and liver fibrosis: Triglyceride glucose index-related parameters. Front. Endocrinol. (Lausanne)13, 951689 (2022). [DOI] [PMC free article] [PubMed] [Google Scholar]
- 18.Taheri, E. et al. The triglyceride-glucose index as a clinical useful marker for metabolic associated fatty liver disease (MAFLD): a population-based study among Iranian adults. J. Diabetes Metab. Disord.21(1) (2022). [DOI] [PMC free article] [PubMed]
- 19.Khamseh, M. E. et al. Insulin resistance/sensitivity measures as screening indicators of metabolic-associated fatty liver disease and liver fibrosis. Dig. Dis. Sci.69(4), 1430–1443 (2024). [DOI] [PubMed] [Google Scholar]
- 20.Zheng, R. et al. A longitudinal epidemiological study on the triglyceride and glucose index and the incident nonalcoholic fatty liver disease. Lipids Health Dis.17(1), 262 (2018). [DOI] [PMC free article] [PubMed] [Google Scholar]
- 21.Cheng, Z. et al. The different predictive effects of multiple body fat indexes on metabolic dysfunction-associated fatty liver disease. Diabetes Metab. Syndr. Obes.17, 3875–3890 (2024). [DOI] [PMC free article] [PubMed] [Google Scholar]
- 22.Kim, A. H., Son, D.-H. & Lee, Y.-J. Modified triglyceride-glucose index indices are reliable markers for predicting risk of metabolic dysfunction-associated fatty liver disease: a cross-sectional study. Front. Endocrinol. (Lausanne) 14, 1308265 (2023). [DOI] [PMC free article] [PubMed]
- 23.Alarabi, M. et al. Telomere length and mortality in lean MAFLD: the other face of metabolic adaptation. Hepatol. Int. 18(5), 1448–1458 (2024). [DOI] [PubMed]
- 24.Eslam, M. et al. Metabolic (dysfunction)-associated fatty liver disease in individuals of normal weight. Nat. Rev. Gastroenterol. Hepatol.19(10), 638–651 (2022). [DOI] [PubMed] [Google Scholar]
- 25.Hernaez, R. et al. Diagnostic accuracy and reliability of ultrasonography for the detection of fatty liver: a meta-analysis. Hepatology54(3), 1082–1090 (2011). [DOI] [PMC free article] [PubMed] [Google Scholar]
Associated Data
This section collects any data citations, data availability statements, or supplementary materials included in this article.
Supplementary Materials
Data Availability Statement
The datasets used and analysed during the current study available from the corresponding author on reasonable request.


