Abstract
A novel approach is introduced for designing a miniaturized wearable antenna. Utilizing Taguchi’s philosophy typically entails numerous experimentations runs, but our method significantly reduces these by employing a quasi-Newton approach with gradient descent to estimate process parameter ranges. This hybrid technique expedites convergence by streamlining experiments. Additionally, the Taguchi array ensures a balanced design, equalizing factor weights. Unlike conventional Taguchi methods, which risk trapping optimized results at local minima with increased repetitions, our modified technique mitigates this issue by adjusting level differences, aiming for global minima. Antenna design often involves competing objectives, such as size, impedance matching, cross-polarization, directivity, and frequency range. This study addresses these multiobjective challenges using a hybrid approach. The proposed method is applied to design and fabricate a biosafe miniaturized antenna for integration into clothing. The comparison of computed and measured antenna parameters confirms the accuracy of our solution while demonstrating a reduction in the required number of experiments. This innovative approach significantly advances the efficient design of wearable antennas. The biosafe wearable antenna demonstrated compliant specific absorption rate (SAR) (1.2 W/kg), robust mechanical performance (up to 40° bending), and underwent human body effect investigation. Comparison of computed and measured antenna parameters confirms solution accuracy. By implementing the proposed hybrid approach, computational time is significantly reduced by 98%, outperforming electromagnetic (EM) solvers’ built-in optimization.
Supplementary Information
The online version contains supplementary material available at 10.1038/s41598-024-83864-9.
Keywords: Microstrip antenna, Flexible antenna, Taguchi algorithm, Optimization
Subject terms: Physics, Engineering, Electrical and electronic engineering
Introduction
Designing contemporary antenna systems is challenging due to evolving requirements1. Global optimization methodologies are extensively employed in antenna design due to their ability to address complex specifications2. These methodologies become invaluable tools when closed-form solutions are unavailable for attributes like gain characteristics and impedance. Practical constraints, such as device profile and miniaturization needs, often restrict antenna design3. However, downsizing can compromise electrical and field performance, necessitating careful trade-offs4. Traditional approaches like equivalent network models or experience-based research are inadequate for managing multiple design objectives5–7. Thorough numerical optimization is recommended instead8. Nature-inspired algorithms are popular for global optimization9,10. Despite their ease of execution, they can be cost-ineffective. Alternatively, machine learning techniques have been explored, but they suffer from dimensionality issues and can alter antenna characteristics significantly11. Numerous studies have focused on synthesis and optimization to enhance antenna design efficacy. For example, Genetic Algorithms (GA) and moment concepts have been used to increase the bandwidth of patch antennas12. GA has also been employed to optimize miniaturized patch antenna for gain and bandwidth maximization13. Other techniques, such as Particle Swarm Optimization (PSO) with neighborhood redispatch, have been applied to design ultra-wideband slot antennas14. While various optimization techniques exist15,16, Taguchi’s method, based on orthogonal arrays17, is preferred for its systematic parameter selection, reducing experimentation time and resources18. However, Taguchi’s method has limitations, including overlooking certain parameter combinations and requiring expertise in experimental design and analysis. Quasi-Newton methods have shown fast convergence rates for local minima, but their impact on optimal parameter range generation in antenna design remains unexplored. This study aims to incorporate a technique for determining the ideal range of process parameters to minimize trial experiments, adhere to Taguchi’s philosophy, and ensure quick convergence in flexible antenna design.
Methodology
The characteristics of an antenna are closely tied to its application scenarios, with the antenna’s size determined by factors such as operating frequency, substrate thickness, and dielectric constant. However, reducing antenna size while maintaining performance parameters like bandwidth, gain, impedance matching, VSWR, directivity, and resonant frequency presents a challenge. After identifying independent parameters based on substrate choice and frequency, control parameters such as ground plane size, feed position, and width were identified as process parameters for experimentation. The range of these parameters was determined using the quasi-Newton approach, which involves moving in the gradient direction to locate maxima and in the opposite direction to find minima. Simulation was conducted for all process parameters using the HFSS tool to establish their ranges.
Trial and error approach
A flexible rectangular patch antenna was developed using textile polyester flexible substrate material, featuring a dielectric constant ( ) of 2.75 and a thickness (h) of 1.5 mm for 2.45 GHz frequency (fr). The antenna’s dimensions were calculated using conventional patch parameter formulas as shown in Eqs. (1) to (7)19, resulting in a size of 53.89 × 62.71 mm2. Achieving a resonant frequency of 2.43 GHz, the antenna demonstrated a |S11| of − 22.46 dB and a gain of 6.75 dBi. Given the importance of compactness in wearable applications, parametric modifications were necessary to attain the desired outcomes within a reduced size. The trial-and-error method adjusted antenna parameters, including patch width, ground plane size, and feed slot inset. Parameter variations spanned from the upper range determined by traditional formulas to 10% reductions, with step sizes ranging from 0.03 to 0.005 mm. 160 trial-and-error experiments were conducted, documented in an annexed table, and analyzed based on the desired resonant frequency, |S11|, and antenna gain. This iterative process allowed for fine-tuning antenna parameters to meet performance requirements while accommodating compactness constraints for wearable applications.
 |
1 |
 |
2 |
 |
3 |
 |
4 |
 |
5 |
 |
6 |
 |
7 |
Quasi-Newton method
The iterative process relies on gradient information to update an approximation of the Hessian matrix, enhancing optimization when combined with gradient descent. Unlike Newton’s method, the quasi-Newton algorithm doesn’t necessitate matrix inversion or equation system solutions, utilizing an estimated inverse Hessian matrix. The process initiates with formulating the objective function for controlling parameter minimization or maximization, along with setting the maximum iteration count, convergence criteria, and step size. Subsequently, quasi-Newton with Gradient Descent is implemented through the following steps:
Starting with an initial solution estimate, denoted as
 , the gradient of the objective function at the current estimate
  (where k denotes the current iteration) is computed.
-
The estimate using a combination of the gradient and an approximation of the Hessian matrix is updated as

8 where α is the step size, and
 approximates the Hessian matrix for kth iteration.
 Based on the estimated solution and variations in the gradient,
 is updated at each iteration. The Broyden-Fletcher-Goldfarb-Shanno (BFGS) approximation is employed. The iteration process continues until a small gradient magnitude is reached. The results are estimated based on the maximum and minimum values of the function. The technique potentially converges to a minimum point even if the starting guess for
  Is set. The only prerequisites for the initial approximation of the inverse Hessian, or
  , are that it must be symmetric, positive definite, and real.
Taguchi’s method for optimization
To initialize Taguchi’s method for optimization after deriving the control parameter range, the first step is to initialize the orthogonal array. The orthogonal array is represented in the form 
Where R—Number of orthogonal array rows, c—Number of design variables, l—levels of parameters, s—strength  .
.
Taguchi’s method of process flow includes the creation of the orthogonal array, Rao’s inequalities equation is used to decide the number of experiments to perform based on the finalized orthogonal array20. The orthogonal array parameters need to satisfy the following equations of existence/construction:
if s = 2x; x > 0 then:
 |
9 |
and if s = 2x + 1; x ≥ 0 then:
 |
10 |
Hybrid approach: quasi-Newton with Taguchi’s orthogonal array method
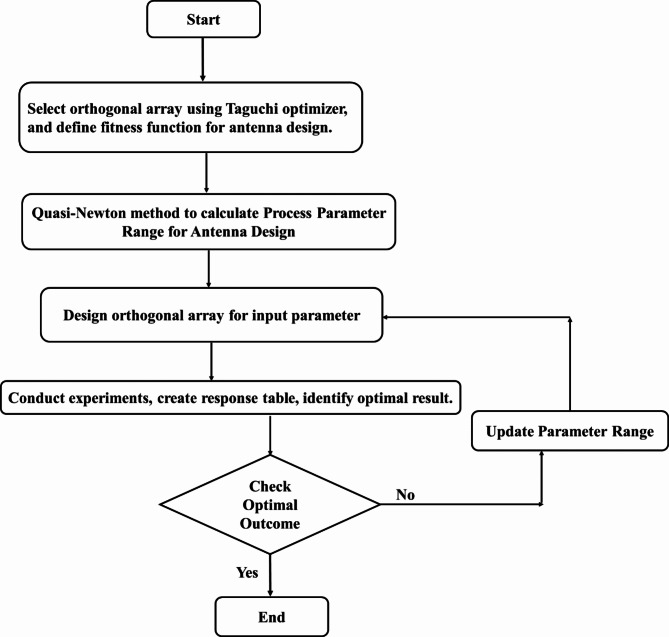
One of the significant limitations of Taguchi’s method is that it does not consider every possible combination of the orthogonal array’s parameters. Also, the Taguchi method has some other limitations for optimization, such as requiring a high level of expertise and knowledge in designing and analyzing experiments and optimizing the performance characteristics within the combination of the process parameters. The use of Taguchi’s philosophy requires more experimentation runs which is considerably reduced by using quasi-Newton with gradient descent approach to estimate the process parameter range. The effect of the quasi-Newton method, on the optimal generation of the process parameter range was applied to search local minimums. Hence, employing the Taguchi method integrated quasi-Newton algorithm for determining the ideal range of process parameters will decrease the number of trial experiments, and guarantee quick convergence to obtain the optimum results. The process flow of a proposed hybrid method of Taguchi with a quasi-Newton algorithm is shown in Fig. 1.
Fig. 1.
The flow of the proposed hybrid approach of Taguchi with the quasi-Newton method.
In the proposed work, the five control factors, including patch width, ground width, ground length, feed width, and feed slot, were identified with the sole objective of miniaturization, as given in Tables 1 and 2 for the first and second iterations, respectively. These five parameters were considered for five different levels, and the orthogonal array  is designed for R = 25, c = 5, l = 5, and s = 2, as shown in Tables 3 and 4 for the first and second iterations, respectively. Textile material, with a dielectric constant of 2.75- and 1.5-mm thickness, serves as the substrate for flexible antenna design.
Table 1.
Control factors of antenna for miniaturization for the first iteration.
| Factor levels | Patch width (mm) | Ground width (mm) | Ground length (mm) | Feed width (mm) | Feed slot (mm) |
|---|---|---|---|---|---|
| f1 | f2 | f3 | f4 | f5 | |
| (u) | (v) | (w) | (x) | (y) | |
| 1 | 44.71 | 62.71 | 53.89 | 0.25 | 8.97 |
| 2 | 39.12 | 57.12 | 49.39 | 0.37 | 8.22 |
| 3 | 33.53 | 51.53 | 44.89 | 0.5 | 7.47 |
| 4 | 27.94 | 45.94 | 40.39 | 0.62 | 6.72 |
| 5 | 22.35 | 40.35 | 36 | 0.75 | 5.98 |
Table 2.
Control factors of antenna for miniaturization for the second iteration.
| Factor levels | Patch width (mm) | Ground width (mm) | Ground length (mm) | Feed width (mm) | Feed slot (mm) |
|---|---|---|---|---|---|
| f1 | f2 | f3 | f4 | f5 | |
| (u) | (v) | (w) | (x) | (y) | |
| 1 | 44.71 | 62.71 | 53.89 | 0.25 | 8.97 |
| 2 | 41.91 | 57.12 | 51.64 | 0.37 | 8.22 |
| 3 | 39.12 | 51.53 | 49.39 | 0.5 | 7.47 |
| 4 | 36.32 | 45.94 | 47.14 | 0.62 | 6.72 |
| 5 | 33.53 | 40.35 | 44.89 | 0.75 | 5.98 |
Table 3.
Orthogonal array of first iteration designed for R = 25, c = 5, l = 5, s = 2.
| Experiment | Patch width (mm) | Ground width (mm) | Ground length (mm) | Feed width (mm) | Feed slot (mm) |
|---|---|---|---|---|---|
| f1 | f2 | f3 | f4 | f5 | |
| (u) | (v) | (w) | (x) | (y) | |
| D1 | 44.71 | 62.71 | 53.89 | 0.25 | 8.97 |
| D2 | 44.71 | 57.12 | 49.39 | 0.37 | 8.22 |
| D3 | 44.71 | 51.53 | 44.89 | 0.5 | 7.47 |
| D4 | 44.71 | 45.94 | 40.39 | 0.62 | 6.72 |
| D5 | 44.71 | 45 | 36 | 0.75 | 5.98 |
| D6 | 39.12 | 62.71 | 49.39 | 0.5 | 6.72 |
| D7 | 39.12 | 57.12 | 44.89 | 0.62 | 5.98 |
| D8 | 39.12 | 51.53 | 40.39 | 0.75 | 8.97 |
| D9 | 39.12 | 45.94 | 36 | 0.25 | 8.22 |
| D10 | 39.12 | 40.35 | 53.89 | 0.37 | 7.47 |
| D11 | 33.53 | 62.71 | 44.89 | 0.75 | 8.22 |
| D12 | 33.53 | 57.12 | 40.39 | 0.25 | 7.47 |
| D13 | 33.53 | 51.53 | 36 | 0.37 | 6.72 |
| D14 | 33.53 | 45.94 | 53.89 | 0.5 | 5.98 |
| D15 | 33.53 | 40.35 | 49.39 | 0.62 | 8.97 |
| D16 | 27.94 | 62.71 | 40.39 | 0.37 | 5.98 |
| D17 | 27.94 | 57.12 | 36 | 0.5 | 8.97 |
| D18 | 27.94 | 51.53 | 53.89 | 0.62 | 8.22 |
| D19 | 27.94 | 45.94 | 49.39 | 0.75 | 7.47 |
| D20 | 27.94 | 40.35 | 44.89 | 0.25 | 6.72 |
| D21 | 22.35 | 62.71 | 36 | 0.62 | 7.47 |
| D22 | 22.35 | 57.12 | 53.89 | 0.75 | 6.72 |
| D23 | 22.35 | 51.53 | 49.39 | 0.25 | 5.98 |
| D24 | 22.35 | 45.94 | 44.89 | 0.37 | 8.97 |
| D25 | 22.35 | 40.35 | 40.39 | 0.5 | 8.22 |
Table 4.
Orthogonal array of second iteration designed for R = 25, c = 5, l = 5, s = 2.
| Experiment | Patch width (mm) | Ground width (mm) | Ground length (mm) | Feed width (mm) | Feed slot (mm) |
|---|---|---|---|---|---|
| f1 | f2 | f3 | f4 | f5 | |
| (u) | (v) | (w) | (x) | (y) | |
| D1 | 44.71 | 62.71 | 53.89 | 0.25 | 8.97 |
| D2 | 44.71 | 57.12 | 51.64 | 0.37 | 8.22 |
| D3 | 44.71 | 51.53 | 49.39 | 0.5 | 7.47 |
| D4 | 44.71 | 45.94 | 47.14 | 0.62 | 6.72 |
| D5 | 44.71 | 45 | 44.89 | 0.75 | 5.98 |
| D6 | 41.91 | 62.71 | 51.64 | 0.5 | 6.72 |
| D7 | 41.91 | 57.12 | 49.39 | 0.62 | 5.98 |
| D8 | 41.91 | 51.53 | 47.14 | 0.75 | 8.97 |
| D9 | 41.91 | 45.94 | 44.89 | 0.25 | 8.22 |
| D10 | 41.91 | 40.35 | 53.89 | 0.37 | 7.47 |
| D11 | 39.12 | 62.71 | 49.39 | 0.75 | 8.22 |
| D12 | 39.12 | 57.12 | 47.14 | 0.25 | 7.47 |
| D13 | 39.12 | 51.53 | 44.89 | 0.37 | 6.72 |
| D14 | 39.12 | 45.94 | 53.89 | 0.5 | 5.98 |
| D15 | 39.12 | 40.35 | 51.64 | 0.62 | 8.97 |
| D16 | 36.32 | 62.71 | 47.14 | 0.37 | 5.98 |
| D17 | 36.32 | 57.12 | 44.89 | 0.5 | 8.97 |
| D18 | 36.32 | 51.53 | 53.89 | 0.62 | 8.22 |
| D19 | 36.32 | 45.94 | 51.64 | 0.75 | 7.47 |
| D20 | 36.32 | 40.35 | 47.14 | 0.25 | 6.72 |
| D21 | 33.53 | 62.71 | 44.89 | 0.62 | 7.47 |
| D22 | 33.53 | 57.12 | 53.89 | 0.75 | 6.72 |
| D23 | 33.53 | 51.53 | 51.64 | 0.25 | 5.98 |
| D24 | 33.53 | 45.94 | 49.39 | 0.37 | 8.97 |
| D25 | 33.53 | 40.35 | 47.14 | 0.5 | 8.22 |
Resonant frequency, high signal-to-noise ratio, and minimum fitness function which uses |S11| parameters are considered while evaluating optimization results. The fitness function used is the |S11| parameter, resonant frequency, and compactness. In comparison to the size of 53.89 × 62.71 mm2 that is obtained after considering the traditional method, the identified fifteenth design experiment (Table 1) from the first iteration gives the |S11| of − 17.39 dB at a resonant frequency of 2.46 GHz for a compact size of 49.39 × 40.35 mm2. This indicates a 41.02% reduction in the size. The optimization range for subsequent iterations is iteratively refined by scaling the current level difference by a reduction factor (ρ) between 0.5 and 1, tailored to specific requirements. The optimal level for each iteration serves as the centroid for the next iteration’s search space, ensuring convergence within the predefined bounded region. So, for the (i + 1)th iteration.
 |
11 |
Where  is called a level difference of the next iteration;
  is the level difference of the ith iteration;
  is the reduced rate of the ith iteration;
  =
=  termed the reduced function. Reducing the optimization range and performing the second iteration, the identified twenty-fifth design experiment (Table 3) from the second iteration the |S11| found is − 12.12 dB, the resonant frequency is 2.46 GHz with a reduced size of 47.14 × 40.35 mm2 with 43.71% reduction in the size. It is observed that the optimal fitness is located in a short time, with the use of the estimated parameter values derived using the quasi-Newton method with a reduced number of experiments as given in Tables 3 and 4 of the first and second iterations respectively.
Result and discussion
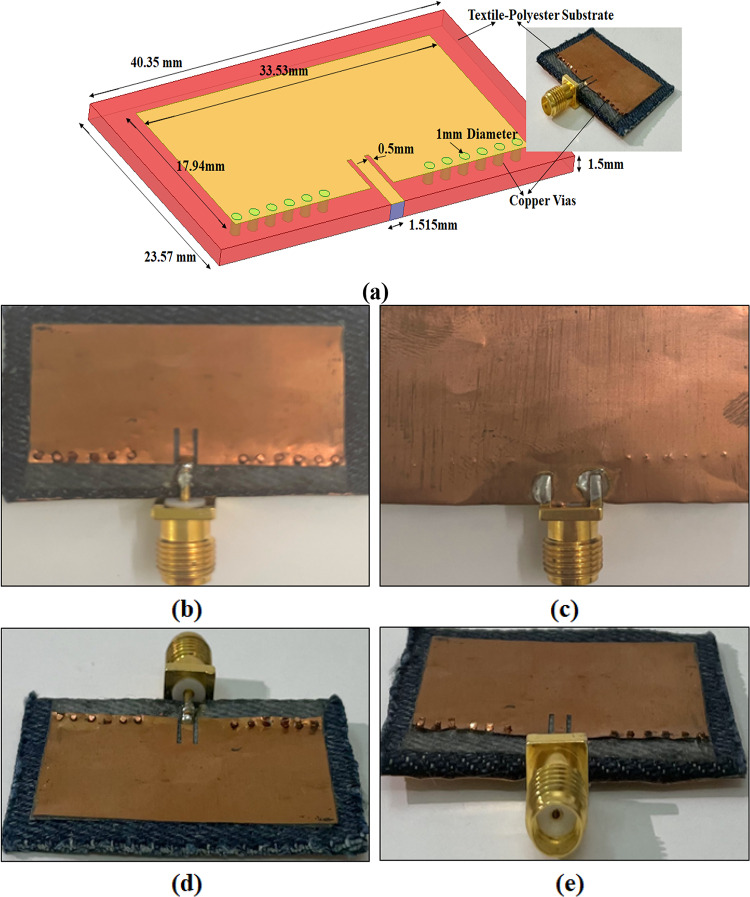
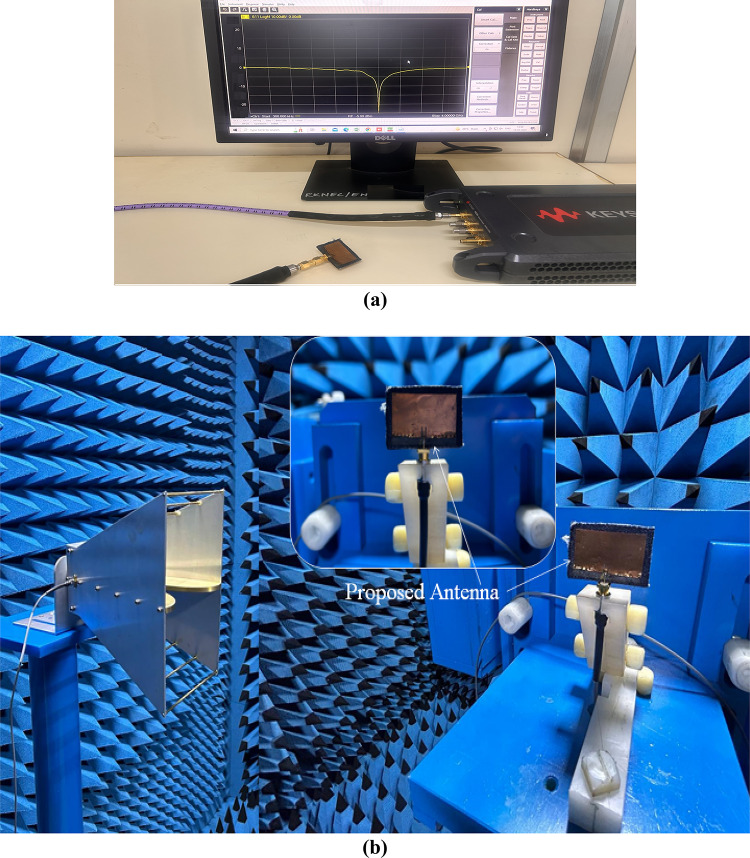
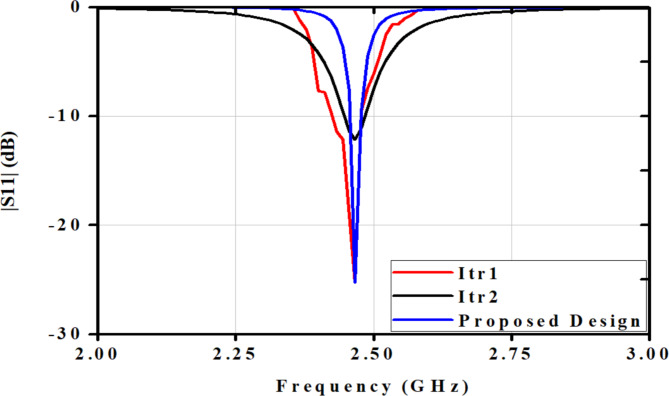
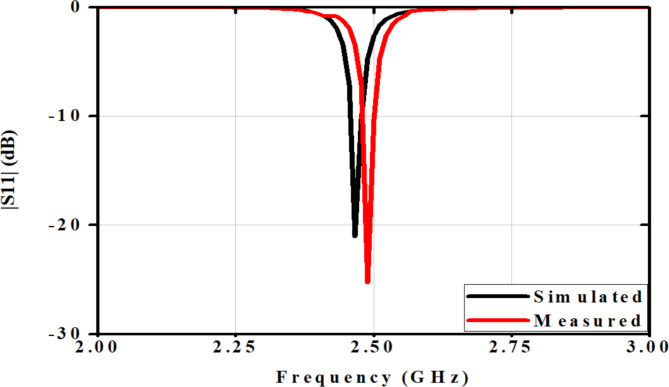
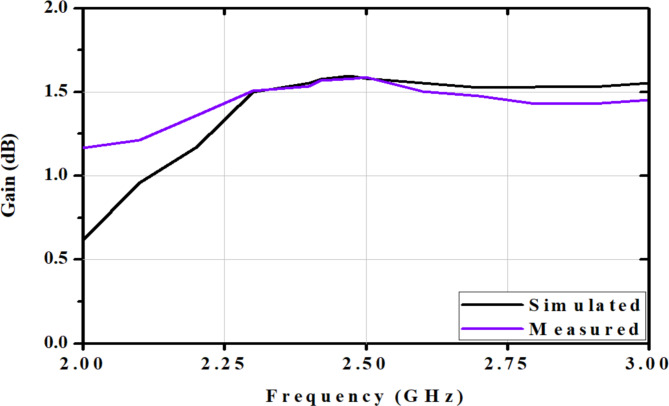
The preceding outcomes were a foundation for refining the design to align with predefined objectives. A modified design was formulated, featuring shorting posts across the patch width and a halved patch length compared to the optimized design, derived from the twenty-fifth design experiment of the second iteration. This modified design was utilized to validate the proposed hybrid concept, depicted in Fig. 2a. Fabrication of the antenna was executed using textile material, illustrated in Fig. 2b–e. This paper utilizes graphs generated using OriginPro software to visualize and analyze the data. Characterization of the fabricated antenna was conducted using a vector network analyzer (VNA) from the Keysight streamline series P9370A (300 MHz to 4 GHz), as illustrated in Fig. 3a. Additionally, testing was conducted in an anechoic environment, as Fig. 3b depicts. The analysis of frequency and |S11| for both iterations of the Taguchi method and the proposed design is presented in Table 5; Fig. 4, respectively. Observations show iterative size reduction in antenna design: Taguchi’s iterations achieved 41.02% and 43.71% reductions, while the proposed design with shorting vias achieved a substantial 71.85% reduction. The |S11| versus frequency plot and gain versus frequency plot were examined for the fabricated flexible antenna with shorting posts, illustrated in Figs. 5 and 6, respectively. A comparative analysis between the simulated and measured results of the proposed antenna design is provided in Table 6. The proposed antenna demonstrated close agreement between simulated and measured results, with resonant frequency at 2.466 GHz, |S11| of − 21.03 dB (simulated) and − 25.29 dB (measured), and gain of 1.83 dB (simulated) and 1.73 dB (measured). Additionally, the E/H-Co/Cross polarization plots for both simulated and measured designs were analyzed, as depicted in Figs. 7 and 8. Simulations were performed using High Frequency Structure Simulator (HFSS) EM solvers on an Intel Core i5-10210U (1.60 GHz, 8 GB RAM, 11 GB virtual memory, Windows 10). Table 7 presents a comparative analysis of convergence time and efficiency metric parameter for the Fast Frequency Sweep (FFS) solver at 2.45 GHz, employing a mesh density of λ/15. Conventional trial and error methods necessitate an indefinite number of attempts, quasi-Newton optimization demands 3125 experiments, the Taguchi method involves 225 trials. In contrast, the hybrid approach requires merely 50 experiments, effectively balancing optimization accuracy with computational efficiency. Furthermore, Table 8 compares the analysis of textile substrate material antennas reported in the literature and the proposed optimized design. From Table 8, it is clear that recently reported pioneer state of the art utilized flexible substrates with resonance frequencies ranging from 2.4 to 5.25 GHz and antenna sizes varying from 38.5 mm × 25 mm to 140 mm × 70 mm, exhibiting medium to high design complexity. In contrast, the proposed design achieves 2.49 GHz resonance with a smaller, simpler antenna size of 40.35 mm × 23.57 mm.
Fig. 2.
(a) Dimensional details of the optimized miniaturized antenna structure (b) Optimized miniaturized antenna front view (c) Optimized miniaturized antenna back view (d) Optimized miniaturized antenna front perspective view (e) Optimized miniaturized antenna back perspective view.
Fig. 3.
(a) Characterization of fabricated optimized miniaturized antenna using VNA (b) Fabricated optimized miniaturized antenna placed in an anechoic chamber for testing.
Table 5.
Comparative analysis of the proposed antenna and Taguchi’s iterations.
| Technique | Size of antenna (mm2) | Reduction in size with respect to size of antenna considering traditional method (%) |
|---|---|---|
| Taguchi’s first iteration (15th design experiment) | 49.39 × 40.35 | 41.02 |
| Taguchi’s second iteration (25th design experiment) | 47.14 × 40.35 | 43.71 |
| Proposed design with shorting vias | 23.57 × 40.35 | 71.85 |
Fig. 4.
|S11| and frequency graph.
Fig. 5.
|S11| and frequency graph of optimized miniaturized antenna for simulated and measured cases.
Fig. 6.
Gain versus frequency plot of optimized miniaturized antenna for simulated and measured cases.
Table 6.
Validation of optimized miniaturized antenna for simulated and experimental results.
| Proposed antenna | Resonant frequency (GHz) | |S11| (dB) | Gain (dB) |
|---|---|---|---|
| Simulated results | 2.46 | − 21.03 | 1.83 |
| Measured results | 2.49 | − 25.29 | 1.73 |
Fig. 7.
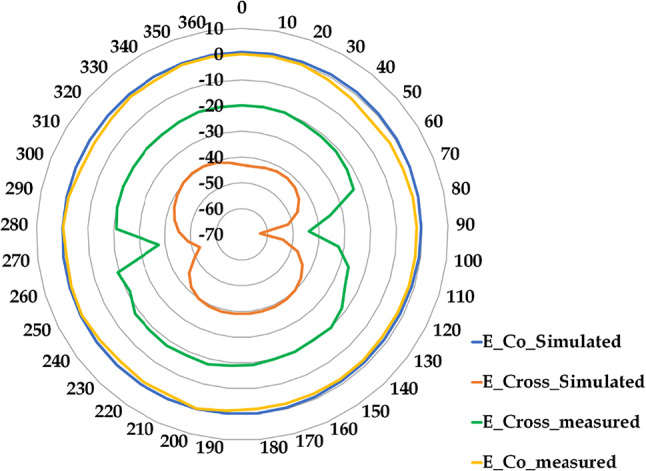
E-co/cross polarization plots of simulated and measured results of optimized miniaturized antenna.
Fig. 8.
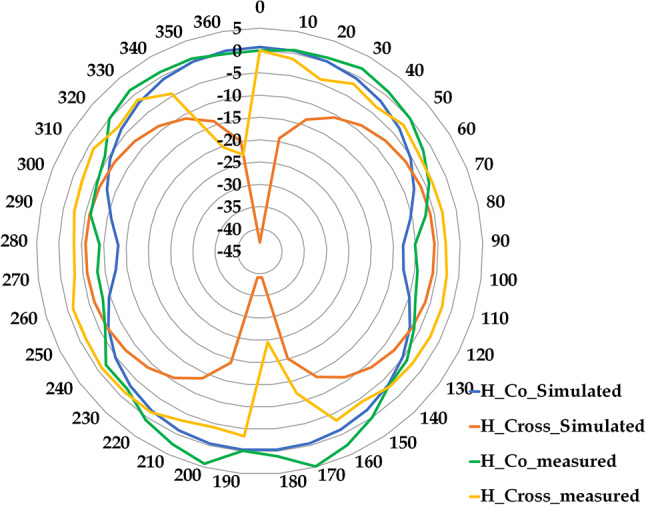
H-co/cross polarization plots of simulated and measured results of optimized miniaturized antenna.
Table 7.
Comparative analysis of convergence time and no. of experiments in different techniques.
| Technique | No. of experimentations | Convergence time and computation efficiency metric elements |
|---|---|---|
| Quasi-Newton (EM solvers build-in optimization) | 3125 (5 antenna parameters for five different levels) |
Mesh generation: 0.42 min Solver setup: 0.28 min Convergence time: 93.22 min Total convergence time: 93.92 min Simulation time/iteration: 0.03 min |
| Taguchi method | 225 (Nine iterations of 25 experiments each) |
Mesh generation: 0.42 min Solver setup: 0.28 min Convergence time: 9.50 min Total convergence time: 10.20 min Simulation time/iteration: 0.045 min |
| Hybrid approach: quasi-Newton + Taguchi orthogonal array | 50 (Two iterations of 25 experiments each) |
Mesh generation: 0.42 min Solver setup: 0.28 min Convergence time: 1.15 min Total convergence time: 1.85 min Simulation time/iteration: 0.037 min |
Table 8.
Comparative analysis of fabricated prototype with recent pioneer state of art.
| Refs. | Substrate material | Number of bands | Resonance frequency (GHz) | Gain (dB) | Size of antenna (mm2) | Design type | Design complexity |
|---|---|---|---|---|---|---|---|
| 21 | Textile | Single | 2.45 | 6.2 | 72.4 × 65.5 | Electromagnetically-coupled patch | Medium |
| 22 | Textile | Dual |
0.915 2.45 |
6.84 | 48 × 52 | Patch with monopole | Medium |
| 23 | Textile | Single | 2.45 | 4.7 | 140 × 70 | Dual Patch | Simple |
| 24 | Textile | Single | 2.4 | 1 | Patch size: 40.1 × 40.1 | Square patch | Medium |
| 25 | Textile | Single | 2.45 | 7.46 | 82.4 × 35.4 | EBG structure | Medium |
| 26 | Polyimide | Triple |
1.31 3.55 5.25 |
4.39 | 55 × 42 | Toroidal | Medium |
| 27 | Polyethylene | Single | 2.45 | – | 38.5 × 25 | Coplanar | High |
| 28 | Ultra-lam 3850 | Dual |
2.4 7.48 |
2.36 3.1 |
50 × 35 | Slotted circular disc patch with partial ground | Medium |
| Proposed design | Textile | Single | 2.5 | 1.73 | 40.35 × 23.57 | Rectangular | Simple |
The wearable flexible compact antenna is analyzed for working on the human body, its Specific Absorption Rate (SAR), and bending analysis.
Performance evaluation of the antenna on human body phantom
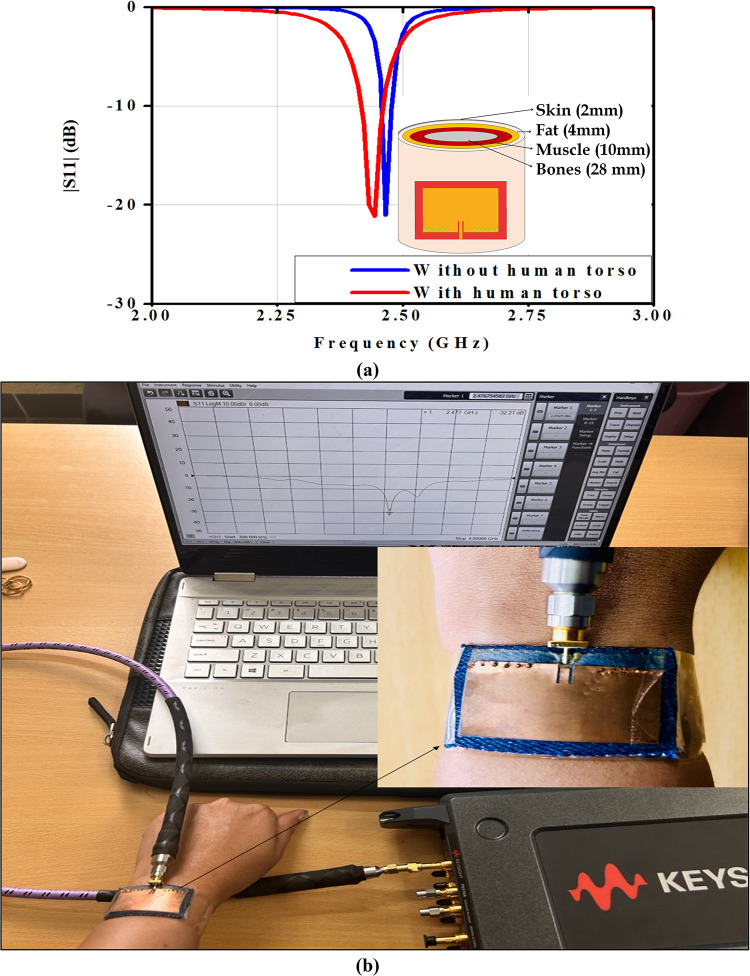
The human body’s presence substantially impacts antenna performance due to its complex and energy-absorbing properties. Human body effects on antenna performance were investigated using a four-layered phantom (muscle, fat, bone, and skin) and measurements on a human hand with VNA. Results, shown in Fig. 9a and b. The phantom’s electrical properties at 2.45 GHz were: Bone: ε = 11.41, σ = 0.385 S/m, thickness = 28 mm; Muscle: ε = 54.9, σ = 0.96 S/m, thickness = 10 mm; Fat: ε = 5.4, σ = 0.05 S/m, thickness = 4 mm; Skin: ε = 41.4, σ = 0.88 S/m, thickness = 2 mm.
Fig. 9.
(a) Performance analysis of the proposed antenna positioned to the equivalent human torso in simulation environment. (b) Performance analysis of the proposed antenna positioned on human hand.
Investigation of specific abortion rate of the antenna
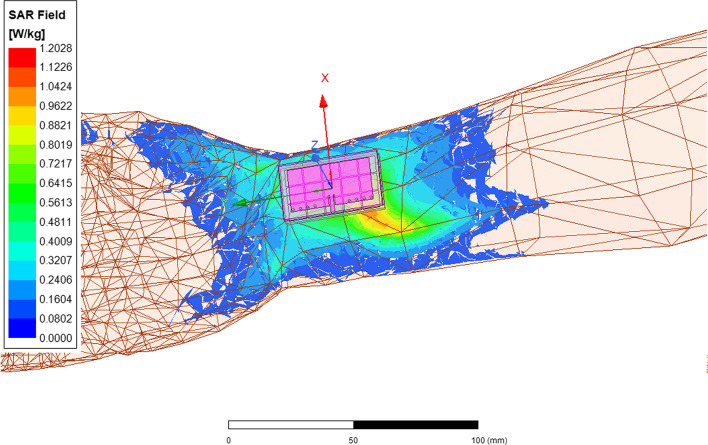
The proposed antenna’s SAR was simulated on the human torso hand using HFSS as shown in Fig. 10. Results show the antenna’s SAR (1.2 W/kg at 1 mm spacing) complies with International Commission on Non-ionizing Protection guidelines (ICNIRP) 2 W/kg limit for 10 g tissue.
Fig. 10.
SAR analysis of the proposed antenna positioned on the human torso.
Investigation of antenna conformality
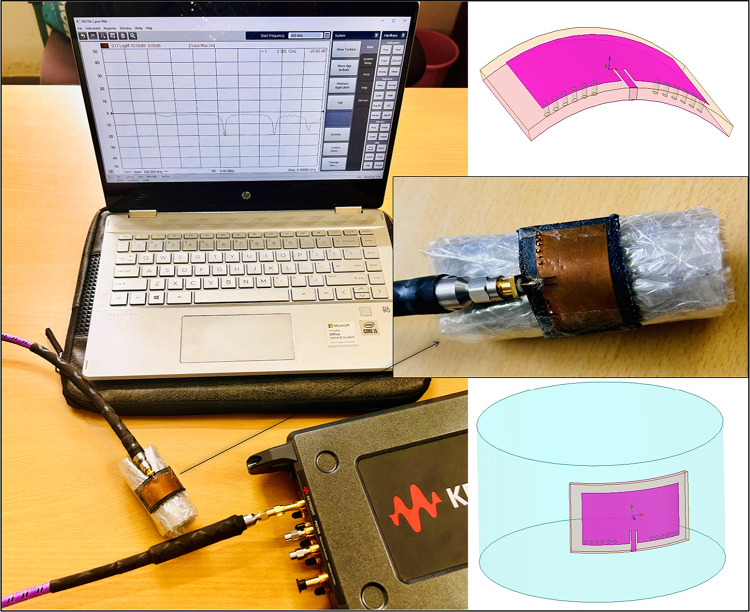
The proposed antenna’s performance was tested in wearable scenarios, including bending and flexing. Figure 11 shows the antenna wrapped around a cylinder. The results (Table 9) demonstrate that the antenna maintains its performance even when bent at angles up to 40°, making it suitable for wearable applications.
Fig. 11.
Investigation of antenna conformality.
Table 9.
Investigation of antenna conformality for different bending conditions.
| Bending angle in degrees | Frequency (GHz) | |S11| (dB) | Frequency deviation with respect to non-bend antenna (%) |
|---|---|---|---|
| 10 | 2.4493 | − 27.581 | 0.02 |
| 20 | 2.4432 | − 26.8468 | 0.28 |
| 30 | 2.4385 | − 25.3401 | 0.46 |
| 40 | 2.431 | − 24.0228 | 0.78 |
Benchmarking different optimization models
The optimization of antenna designs requires efficient computational methods to reduce design time and enhance performance. Various approaches have been explored as shown in Table 10, including deep learning surrogate models29, surrogate-assisted particle swarm optimization30, Taguchi methods31, fast global sensitivity analysis-based surrogate-assisted machine learning32, support vector machines33, and online data-driven enhanced-XGBoost34. While these methods demonstrate some computational efficiency, the proposed hybrid approach, combining Taguchi and quasi-Newton methods, achieves a remarkable 98% average cost reduction. This significant reduction corresponds to a substantial decrease in total computational time compared to EM solvers’ built-in optimization, as demonstrated using HFSS. The proposed hybrid approach reduces the initial computational effort required for building the training dataset, thereby accelerating the overall design optimization process for antenna designs. In contrast, existing methods exhibit varying degrees of computational efficiency, ranging from 39 to 85% reductions. The Proposed Hybrid approach offers a substantial advantage in reducing computational time and enhancing design optimization for antenna designs, making it an attractive solution for efficient antenna design.
Table 10.
Benchmarking different optimization models: results and insights.
| Refs. | Antenna type | Model used for optimization | EM simulator used | Average cost reduction | Details |
|---|---|---|---|---|---|
| Proposed hybrid approach | Patch with shorting posts | Hybrid method: Taguchi with quasi Newton metod | HFSS | 98% (corresponds to a total computational time of EM solvers build-in optimization and proposed hybrid approach) | The proposed approach can reduce the initial computational effort required for building the data set to be used for training the models thereby accelerating the overall design optimization process for antenna designs |
| 29 | Microstrip | Deep learning surrogate model | CST | 50% (corresponds to a total computational time of EM solvers build-in optimization and surrogate model) | The dataset is generated for a deep learning-based surrogate model using EM simulator |
| 30 | SIW cavity backed slot antenna | Surrogate-assisted particle swarm optimization with mixed prescreening | HFSS | 39% (60 Simulations for optimization considering best case of Surrogate-assisted particle swarm optimization with mixed pre-screening and 98.5 simulations of ten runs optimization) | |
| 31 | Microstrip patch antenna | Taguchi method | COMSOL | – | 81 (Three trials of 27) experiments required for Taguchi compared to the trial-and-error approach |
| 32 | Dipole antenna | Fast global sensitivity analysis-based surrogate-assisted machine-learning | CST | 85% (corresponds to the total computational duration required for EM solvers’ built-in optimization and surrogate model) | The dataset enables a surrogate-based optimization framework for antenna design, employing particle swarm optimization and kriging interpolation, with electromagnetic simulations providing the necessary data |
| 33 | Circular patch | Support vector machine (SVM) | CST | – | 1000 simulation are used to generate dataset for proposed SVM model |
| 34 | Resonator antenna |
Online data-driven enhanced-XGBoost (E-XGBoost) Method consists of input variable filter module (IVFM) and an antenna optimization module (AOM) |
HFSS | 80% (max) (Time overhead compared to ML methods) | The dataset is generated for a machine learning-based model using EM simulator. The enhanced-XGBoost method is used for antenna optimization model |
Conclusion
The proposed work presents a computationally efficient antenna design optimization technique using novel hybrid approach combining Taguchi philosophy and the quasi-Newton method. The technique is validated using a simple wearable flexible rectangular patch antenna geometry for easy modeling, simulation, and prototype development. Key innovations include methodology development, design space exploration, and multi-objective optimization. The technique offers efficient design space exploration and reduced computational cost, making it applicable to complex antenna geometries with multiple variables. Future research avenues could explore further enhancements in the effectiveness and efficiency of Machine Learning models through integrating quasi-Newton optimization and Taguchi methods, focusing on sustainability and resource conservation. Additionally, investigations into the synergistic use of these approaches with evolutionary or reinforcement strategies may provide valuable insights for addressing optimization challenges in real-world scenarios.
Electronic supplementary material
Below is the link to the electronic supplementary material.
Acknowledgements
The authors gratefully acknowledge the testing support provided by the institute’s DST-FIST level 0 supported laboratory during this research. Additionally, the authors would like to thank SVNIT, Surat, for their assistance in characterizing the fabricated antenna in the anechoic environment.
Author contributions
(1) Archna Tiwari: Wrote the main manuscript. (2) Aleefia A. Khurshid: Review and measurement (3) Kanhaiya Sharma: Supervision, analysis, and review.
Data availability
The datasets used and/or analyzed during the current study are available from the corresponding author upon reasonable request.
Declarations
Competing interests
The authors declare no competing interests.
Footnotes
Publisher’s note
Springer Nature remains neutral with regard to jurisdictional claims in published maps and institutional affiliations.
Contributor Information
Archana Tiwari, Email: tiwariar@rknec.edu.
Kanhaiya Sharma, Email: kanhaiya.sharma@sitpune.edu.in.
References
- 1.Rajesh, G. & Poonkuzhali, R. Design and analysis of CPW fed ultrathin flexible MIMO antenna for UWB and X-band applications. IEEE Access12, 1–14. 10.1109/ACCESS.2024.3426592 (2024). [Google Scholar]
- 2.Torun, H. M. & Swaminathan, M. High-dimensional global optimization method for high-frequency electronic design. IEEE Trans. Microw. Theory Tech.67(6), 2128–2142. 10.1109/TMTT.2019.2915298 (2019). [Google Scholar]
- 3.Liu, J., Esselle, K. P., Hay, S. G. & Zhong, S. Effects of printed UWB antenna miniaturization on pulse fidelity and pattern stability. IEEE Trans. Antennas Prop.62(8), 3903–3910. 10.1109/TAP.2014.2322885 (2014). [Google Scholar]
- 4.Jayasinghe, J. & Uduwawala, D. A novel multiband miniature planar inverted F antenna design for Bluetooth and WLAN applications. Int. J. Antennas Propag.6, 970152. 10.1155/2015/970152 (2015). [Google Scholar]
- 5.Tiwari, R. N., Sharma, D., Singh, P. & Kumar, P. Design of dual-band 4-port flexible MIMO antenna for mm-wave technologies and wearable electronics. IEEE Access12, 96649–96659. 10.1109/ACCESS.2024.3412712 (2024). [Google Scholar]
- 6.Hossain, A. R. et al. Inkjet printed flexible dual-band dual-sense circularly polarized patch antenna. IEEE Access12, 55424–55433. 10.1109/ACCESS.2024.3389706 (2024). [Google Scholar]
- 7.Sun, H., Hu, Y., Ren, R., Zhao, L. & Li, F. Design of pattern-reconfigurable wearable antennas for body-centric communications. IEEE Antennas Wirel. Propag. Lett.19(8), 1385–1389. 10.1109/LAWP.2020.3002016 (2020). [Google Scholar]
- 8.Kovaleva, M., Bulger, D. & Esselle, K. P. Comparative study of optimization algorithms on the design of broadband antennas. IEEE J. Multiscale Multiphys. Comput. Tech.5, 89–98. 10.1109/JMMCT.2020.3000563 (2020). [Google Scholar]
- 9.Abdel-Basset, M., Mohamed, R., Jameel, M. & Abouhawwash, M. Nutcracker optimizer: A novel nature-inspired metaheuristic algorithm for global optimization and engineering design problems. Knowl. Based Syst.262, 110248. 10.1016/j.knosys.2022.110248 (2023). [Google Scholar]
- 10.Rahmat-Samii, Y., Kovitz, J. M. & Rajagopalan, H. Nature-inspired optimization techniques in communication antenna designs. Proc. IEEE100(7), 2132–2144. 10.1109/JPROC.2012.2188489 (2012). [Google Scholar]
- 11.Du, X., Xu, H. & Zhu, F. Understanding the effect of hyperparameter optimization on machine learning models for structure design problems. Comput. Aided Des.135, 103013. 10.48550/arXiv.2007.04431 (2021). [Google Scholar]
- 12.Johnson, J. M. & Rahmat-Samii, Y. Genetic algorithms and method of moments (GA/MOM) for the design of integrated antennas. IEEE Trans. Antennas Propag.47, 1606–1614. 10.1109/8.805906 (1999). [Google Scholar]
- 13.Boudjerda, M. et al. Design and optimization of miniaturized microstrip patch antennas using a genetic algorithm. Electronics11(14), 2123. 10.3390/electronics11142123 (2022). [Google Scholar]
- 14.Li, Y.-L., Shao, W., You, L. & Wang, B.-Z. An improved PSO algorithm and its application to UWB antenna design. IEEE Antennas Wirel. Propag. Lett.12, 1236–1239. 10.1109/LAWP.2013.2283375 (2013). [Google Scholar]
- 15.Robinson, J. & Rahmat-Samii, Y. Particle swarm optimization in electromagnetics. IEEE Trans. Antennas Propag.52(2), 397–407. 10.1109/TAP.2004.823969 (2004). [Google Scholar]
- 16.Xu, L., Xu, J., Chu, Z., Liu, S. & Zhu, X. Circularly polarized implantable antenna with improved impedance matching. IEEE Antennas Wirel. Propag. Lett.19(5), 876–880. 10.1109/LAWP.2020.2983216 (2020). [Google Scholar]
- 17.Chen, Y.-S. & Ku, T.-Y. Efficiency improvements of antenna optimization using orthogonal fractional experiments. Int. J. Antennas Propag.2015, 708163. 10.1155/2015/708163 (2015). [Google Scholar]
- 18.Weng, W.-C. Design and optimization of compact microstrip wideband bandpass filter using taguchi’s method. IEEE Access10, 107242–107249. 10.1109/ACCESS.2022.3213067 (2022). [Google Scholar]
- 19.Balanis, C. A. Antenna Theory Analysis and Design 3rd edn. (Wiley, 2005). [Google Scholar]
- 20.Weng, W.-C., Yang, F. & Elsherbeni, A. Z. Linear antenna array synthesis using Taguchi’s method: A novel optimization technique in electromagnetics. IEEE Trans. Antennas Propag.55(3), 723–730. 10.1109/TAP.2007.891548 (2007). [Google Scholar]
- 21.Del-Rio-Ruiz, R. et al. Reliable lab-scale construction process for electromagnetically coupled textile microstrip patch antennas for the 2.45 GHz ISM band. IEEE Antennas Wirel. Propag. Lett.19(1), 153–157. 10.1109/LAWP.2019.2956238 (2020). [Google Scholar]
- 22.Wagih, M., Cetinkaya, O., Zaghari, B., Weddell, A. S. & Beeby, S. Real-world performance of sub-1 GHz and 2.4 GHz textile antennas for RF-powered body area networks. IEEE Access8, 133746–133756. 10.1109/ACCESS.2020.3011603 (2020). [Google Scholar]
- 23.Adam, I. et al. Investigation on wearable antenna under different bending conditions for wireless body area network (WBAN) applications. Int. J. Antennas Propag.2021, 9. 10.1155/2021/5563528 (2021). [Google Scholar]
- 24.Fernández, M., Vázquez, C. & Ver Hoeye, S. 2.4 GHz fully woven textile-integrated circularly polarized rectenna for wireless power transfer applications. IEEE Access12, 89836–89844. 10.1109/ACCESS.2024.3419553 (2024). [Google Scholar]
- 25.Ejaz, A. et al. A high performance all-textile wearable antenna for wristband application. Micromachines14, 1169. 10.3390/mi14061169 (2023). [DOI] [PMC free article] [PubMed] [Google Scholar]
- 26.Yu, Z. et al. Wearable portable flexible antenna covering 4G, 5G, WLAN, GPS applications. Wirel. Commun. Mob. Comput.2023, 11. 10.1155/2023/4667122 (2023). [Google Scholar]
- 27.Gallucci, S. et al. Human exposure assessment to wearable antennas: Effect of position and interindividual anatomical variability. Int. J. Environ. Res. Public Health19, 5877. 10.3390/ijerph19105877 (2022). [DOI] [PMC free article] [PubMed] [Google Scholar]
- 28.Taher, F. et al. Wireless insights into cognitive wellness: A paradigm shift in Alzheimer’s detection through ultrathin wearable antennas. IEEE Access12, 59318–59334. 10.1109/ACCESS.2024.3389814 (2024). [Google Scholar]
- 29.Gocen, C. et al. Knowledge-based methodology of CPW-fed open stub loaded C-shaped microstrip antenna by surrogate-based modeling. Int. J. RF Microw. Comput. Aided Eng.2024, 6247693. 10.1155/2024/6247693 (2024). [Google Scholar]
- 30.Fu, K., Cai, X., Yuan, B., Yang, Y. & Yao, X. An efficient surrogate assisted particle swarm optimization for antenna synthesis. IEEE Trans. Antennas Propag.70(7), 4977–4984. 10.1109/TAP.2022.3153080 (2022). [Google Scholar]
- 31.Alrashdan, M. H. S., Al-qudah, Z. & Al Bataineh, M. Microstrip patch antenna directivity optimization via Taguchi method. Ain Shams Eng. J.15(9), 102923. 10.1016/j.asej.2024.102923 (2024). [Google Scholar]
- 32.Koziel, S., Pietrenko-Dabrowska, A. & Leifsson, L. Antenna optimization using machine learning with reduced-dimensionality surrogates. Sci. Rep.14, 21567. 10.1038/s41598-024-72478-w (2024). [DOI] [PMC free article] [PubMed] [Google Scholar]
- 33.Shi, D., Lian, C., Cui, K., Chen, Y. & Liu, X. An intelligent antenna synthesis method based on machine learning. IEEE Trans. Antennas Propag.70(7), 4965–4976. 10.1109/TAP.2022.3182693 (2022). [Google Scholar]
- 34.Li, W. T., Tang, H. S., Cui, C., Hei, Y. Q. & Shi, X. W. Efficient online data-driven enhanced-XGboost method for antenna optimization. IEEE Trans. Antennas Propag.70(7), 4953–4964. 10.1109/TAP.2022.3157895 (2022). [Google Scholar]
Associated Data
This section collects any data citations, data availability statements, or supplementary materials included in this article.
Supplementary Materials
Data Availability Statement
The datasets used and/or analyzed during the current study are available from the corresponding author upon reasonable request.


