Abstract
Ferroptosis plays a role in tumorigenesis by affecting lipid peroxidation and metabolic pathways; however, its prognostic or therapeutic relevance in pancreatic adenocarcinoma (PAAD) remains poorly understood. In this study, we developed a prognostic ferroptosis-related gene (FRG)-based risk model using cohorts of The Cancer Genome Atlas (TCGA) and the International Cancer Genome Consortium (ICGC), proposing plausible therapeutics. Differentially expressed FRGs between tumors from TCGA-PAAD and normal pancreatic tissues from Genotype-Tissue Expression were analyzed to construct a prognostic risk model using univariate and multivariate Cox regression and LASSO analyses. A model incorporating AURKA, CAV1, and PML gene expression effectively distinguished survival differences between high- and low-risk groups among TCGA-PAAD patients, with validation in two ICGC cohorts. The high-risk group was enriched in gene sets involving mTOR, MAPK, and E2F signaling. The immune and stromal cells infiltration score did not differ between the groups. Analysis of PRISM datasets using our risk model to classify pancreatic cell lines suggested the dasatinib’s efficacy in the high-risk group, which was experimentally confirmed in four cell lines with a high- or low-risk signature. In conclusion, this study proposed a robust FRG-based prognostic model that may help stratify PAAD patients with poor prognoses and select potential therapeutic avenues.
Keywords: Pancreatic adenocarcinoma, Ferroptosis, Prognosis, Aurora kinase A, Caveolin 1, Promyelocytic leukemia
Subject terms: Computational biology and bioinformatics, Biomarkers, Risk factors
Introduction
Pancreatic adenocarcinoma (PAAD) is a malignant cancer that is typically asymptomatic until an advanced stage is attained1. Only 10–20% of patients present resectable tumors at diagnosis, whereas the vast majority exhibit metastases. The standard treatment for patients with locally advanced or metastatic disease remains a cytotoxic chemotherapy combination such as erlotinib with gemcitabine. Olaparib is employed only as maintenance therapy2. However, treatment resistance and poor outcomes are still common.
Multigene-based prognostic biomarkers can predict cancer patient prognoses, since linear combinations of the expression levels of several genes reflect heterogeneous but important variations in cancer progression3. The representative Oncotype DX test predicts the recurrence of early-stage breast cancer by evaluating the expression levels of 21 genes4. High-throughput data analysis has greatly aided the identification of common genetic changes in pancreatic cancers, including variations in KRAS, TP53, CDKN2A, and SMAD4 gene expression2,5. Despite such advances, universal guidelines that employ biomarkers prognostic for or predictive of PAAD remain elusive. Development of well-validated, clinically effective prognostic signatures for pancreatic cancer are still warranted.
Ferroptosis is a form of regulated cell death characterized by lipid peroxidation, iron dependence, and changes in multiple metabolic pathways. Ferroptosis plays a significant role in tumorigenesis across various types of tumors, including PAAD6,7. For example, conditional depletion of pancreatic Gpx4 accelerates the development of KrasG12D-driven pancreatic tumors in mice8. A study of ferroptosis may provide a useful alternative approach for the development of novel models that predict cell death, allowing the selection of reliable prognostic or therapeutic strategies following PAAD patient stratification. Some studies have constructed ferroptosis-related gene (FRG)-based risk models for pancreatic cancer9–12; however, further validation across different cohorts and evidence for clinical utility has not been fully demonstrated.
This study investigated the roles played by FRGs in prognostic risk stratification in a The Cancer Genome Atlas (TCGA)-PAAD cohort13 and validated an FRG-based risk model using two of the largest International Cancer Genome Consortium (ICGC) cohorts14, ensuring reliability and generalizability across diverse populations. We explored the potential underlying biological mechanisms and analyzed the associations between gene signatures of the risk groups with tumor immune microenvironments. In addition, recognizing that the Cancer Cell Line Encyclopedia (CCLE) and Profiling Relative Inhibition Simultaneously in Mixtures (PRISM) dataset provide a robust framework for identifying clinically relevant compounds based on gene signatures15,16, we integrated these resources with clinically derived gene signatures to identify plausible compounds effective in pancreatic cancer cell lines with high- or low-risk gene signatures and experimentally validated the efficacy of potential candidates.
Materials and methods
Data collection and preprocessing
RNA sequencing (RNA-seq) data and clinical information on a TCGA pancreatic cancer cohort and healthy donors from and Genotype-Tissue Expression (GTEx) cohort were retrieved from the UCSC Xena Database (http://xena.ucsc.edu/)13. Sequencing-based gene expression data, and corresponding clinical information on the ICGC-pancreatic cancer (PACA)-Australian (AU) and ICGC-PACA-Canadian (CA) cohorts were obtained from the ICGC data portal (https://dcc.icgc.org/)14. Only primary tumor samples were subjected to analysis. If survival data were lacking or overall survival was less than 1 day, the data were excluded. In total, 177 TCGA samples, 167 GTEx donor samples, 72 specimens from the ICGC-PACA-AU cohort, and 182 specimens from ICGC-PACA-CA donors were included in the analysis. The clinical characteristics of TCGA-PAAD, ICGC-PACA-AU, and ICGC-PACA-CA patients are presented in Supplementary Table 1.
Dose response data of 1,448 compounds for 33 pancreatic cell lines from the PRISM dataset (PRISM 2° Screen)15 and the basal RNA-seq data for each cell line from the CCLE project16 were downloaded from the DepMap portal (https://depmap.org/portal/).
Identification of differentially expressed FRGs and network analysis
Differentially expressed genes (DEGs) between the TCGA and GTEx gene expression data were analyzed using the DESeq2 package in R (R Core Team, Vienna, Austria) with the thresholds |log2(fold change)|> l and P < 0.05. FRGs which are listed in the FerrDb database (http://www.zhounan.org/ferrdb) and then, differentially expressed FRGs were defined as the genes that were both DEGs and FRG17. Visualization was performed with EnhancedVolcano package in R (R Core Team). Additionally, pathway enrichment and protein–protein interaction of differentially expressed FRGs were analyzed with Metascape (http://metascape.org/)18. The Molecular Complex Detection (MCODE) algorithm of Metascape was applied to identify closely connected functional units within the network.
Construction of an FRG-based risk model and assessment of its predictive power
To develop a quantitative signature for guiding the prognosis of pancreatic cancer, an ferroptosis-based risk model was constructed and validated. TCGA dataset was used as training cohort, while two ICGC datasets were used as the validation cohorts. Genes associated with overall survival were identified among the differentially expressed FRGs in the training set using univariate Cox proportional hazards regression analysis, implemented with survival and survminer R packages. Subsequently, a prognostic risk model was constructed using least absolute shrinkage and selection operator (LASSO) with glmnet R package and multivariate Cox regression analysis. LASSO regression was used to select optimal FRGs and minimize overfitting by applying penalties to the regression coefficients based on the partial likelihood deviance and selecting the lambda value that corresponds to the minimum partial likelihood deviance. Then, multivariate Cox regression analysis was conducted to identify independently prognostic FRGs, and the coefficients were used to calculate the risk score of each patient. The formula for risk score was constructed as follows:
 |
where Coefi represents the coefficients and xi represents the normalized count of each signature gene. The risk score corresponding to each sample was determined and the samples were stratified into high‐ and low‐risk groups according to median risk score of each cohort. Survival differences between the groups were assessed using the Kaplan–Meier method and the log-rank test, with significance determined at P < 0.05. The diagnostic accuracy was demonstrated by developing time-dependent receiver operating characteristic (ROC) curves and by computing the area under the curve (AUC) values using the survivalROC package in R.
Univariate and multivariate Cox regression analyses, combined with known clinical and pathological parameters (age, gender, grades, and stages), were conducted in the training set to assess whether the risk scores serve as independent prognostic indicators. The risk score’s performance was compared with the clinical parameters using ROC curves and AUC values. The performance of the risk score was validated in two ICGCs cohorts following the same procedure for risk score calculation, grouping into high- and low-risk groups, and subsequent Kaplan–Meier and AUC-ROC analyses.
Potential biological mechanisms imparting high-risk status
Gene set enrichment analysis (GSEA) was conducted using GSEA v4.3.2 software19 and hallmark gene sets from the Molecular Signatures Database. This analysis revealed pathways of significance in the high-risk group. Significantly enriched gene sets were identified as those with a false discovery rate (FDR) < 0.25.
Association between tumor immune microenvironment and FRG-based risk model
The association of tumor immune status in tumor tissues was analyzed and compared between high- and low-risk groups using Estimation of STromal and Immune cells in MAlignant Tumor Tissues using Expression Data (ESTIMATE) and Cell-type Identification By Estimating Relative Subsets Of RNA Transcripts (CIBERSORT) algorithms in the TCGA-PAAD dataset. The ESTIMATE algorithm analyzes the abundance of immune cells and stromal cells in tumor tissues as well as tumor purity, providing stromal scores, immune scores, and ESTIMATE scores20. The CIBERSORT algorithm estimates the relative proportions of immune cell types from gene expression profiles of mixed cell populations in tumors21. Additionally, the expression levels of known immune checkpoint genes (PDCD1, CD274, CTLA4, HAVCR2, CXCR4, and LAG3) were obtained from TCGA-PAAD transcriptome dataset and compared between two risk groups using R.
Next, the association between the three signature genes–AURKA, CAV1, and PML–and immune infiltration levels or immune checkpoint genes was analyzed in TCGA-PAAD. Tumor Immune Estimation Resource (TIMER) algorithm was used to calculate partial Spearman correlations between the expression levels of the signature genes and the numbers of infiltrated immune cells22, and the correlations were visualized as heatmap with R. Additionally, the correlation between the expression of the signature genes and immune checkpoint gene was analyzed and visualized as a heatmap using R.
Cell culture and viability
The SNU410, Capan2, MIAPaCa2, and AsPC1 cell lines were obtained from the Korean Cell Line Bank and their STR information was confirmed (Seoul, Republic of Korea). Cells were regularly assessed to confirm the absence of mycoplasma contamination. Cells were seeded in fresh medium in 96-well plates at 3000 cells/well. After 24 h, the cells were exposed to dasatinib, WHI-P154, or darapladib at various doses for 72 h. Paired control cells were treated with dimethyl sulfoxide (DMSO) as vehicle. All compounds were purchased from MedChemExpress (Monmouth Junction, NJ, USA). Cell viability was measured using the CellTiter-Glo assay (Promega, Madison, WI, USA), following the manufacturer’s instructions, using a BioTek Synergy H2 Multimode Reader (Agilent Technologies, Santa Clara, CA, USA).
Gene expression analysis
Basal expression of AURKA, CAV1, and PML1 mRNA in SNU410, Capan2, MIAPaCa2, and AsPC1 cell lines was measured by real-time quantitative polymerase chain reaction (RT-qPCR) reaction as previously described23. Briefly, total RNA was extracted using TRIzol reagent (Thermo Fisher Scientific, Waltham, MA, United States) and then 2-µg aliquots were reverse-transcribed in a mixture containing AMV Reverse Transcriptase (Promega, Madison, WI, USA), deoxynucleoside triphosphates, and oligo(dT)16. The resulting cDNA was amplified by RT-PCR using Power SYBR™ Green PCR Master Mix with QuantStudio3 (Thermo Fisher Scientific). The specificity of the amplicon was verified with a melting curve analysis and the relative quantification was analyzed using the ΔΔCT method. To normalize the expression of the three signature genes across 4 cell lines, the arithmetic means of Ct values for the three housekeeping genes: β-actin, β-2-microglobulin, and α-tubulin were used. Finally, the relative mRNA level of AURKA, CAV1, and PML genes across 4 cell lines were used to calculate arbitrary risk scores for each cell line. All experiments were performed independently in triplicate. The following primers were supplied from Bioneer (Daejeon, Korea): human AURKA, 5′-CCTGCCCCCTGAAATGATT-3′ (sense); 5′-GGCTCCAGAGATCCACCTTCT-3′ (antisense); human CAV1, 5′-AGGCCAGCTTCACCACCTT-3′ (sense); 5′-GCAGACAGCAAGCGGTAAAAC-3′ (antisense); human PML1, 5′-CCTACGCTGACCAGCATCTACTG-3′ (sense); 5′-GCGCTGATGTCGCACTTG-3′ (antisense); human β-actin, 5′-AGCGGGAAATCGTGCGTG-3′ (sense); and 5′-CAGGGTACATGGTGGTGCC-3′ (antisense); human β-2-microglobulin, 5′-GTCTCGCTCCGTGGCCTTA-3′ (sense); and 5′-AATCTTTGGAGTACGCTGGA-3′ (antisense) human α-tubulin, 5′-TGACCTTGTGTTGGACCGAA-3′ (sense); and 5′-GAAAACGAAGAAGCCCTGAAGA-3′ (antisense).
Statistical analyses
All statistical analyses were performed using R v4.4.0 software (R Core Team) and RStudio v2024.4.2.764 (Posit Team, Boston, MA, USA), unless otherwise specified. Spearman correlation analysis was conducted to explore relationships between paired variables. Student’s t-test or the Wilcoxon signed-rank test was used as appropriate to evaluate differences among variables, with significance determined at a level of P < 0.05. Dose–response curves and AUC values were analyzed with GraphPad Prism v10.0.0 (GraphPad Software, Boston, MA, USA).
Results
Identification of differentially expressed FRGs and network analysis
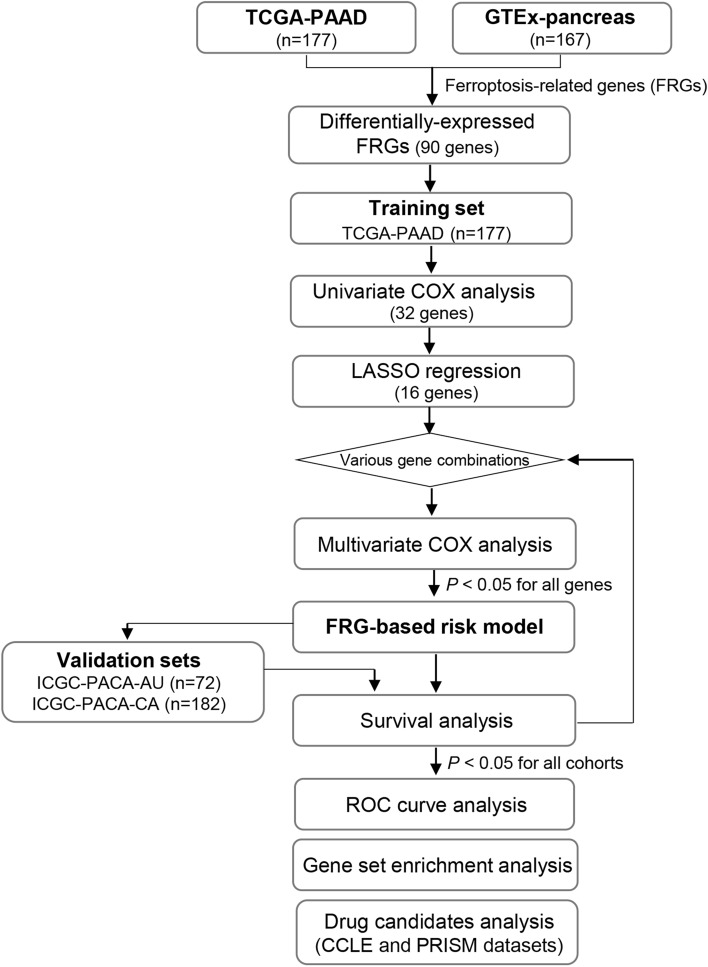
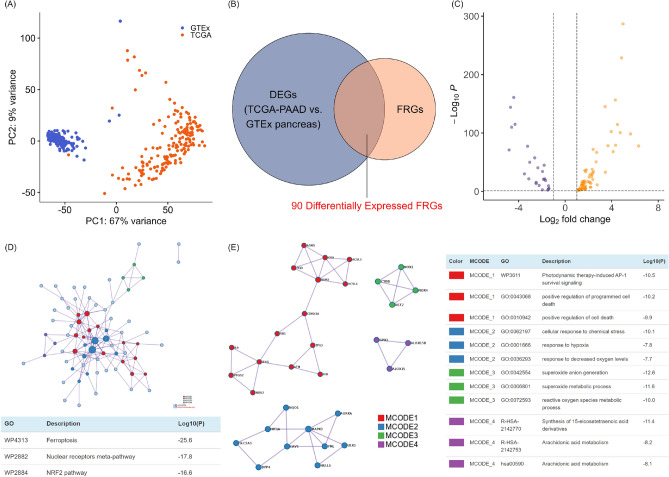
A study flow chart is shown in Fig. 1. Gene expression levels in 177 TCGA-PAAD donors and 167 GTEx pancreatic donors were subjected to principal component analysis (Fig. 2A). Differentially expressed FRGs were identified by comparing the gene expression levels of the two datasets, followed by filtering to confine DEGs to those that were also FRGs. A total of 90 differentially expressed FRGs were identified (Fig. 2B and C).
Fig. 1.
Flow chart of data collection and processing. Data from the TCGA-PAAD cohort were used for univariate Cox regression, LASSO regression, and multivariate Cox regression to identify a candidate risk model. The model’s performance in predicting survival (P < 0.05) was evaluated in the TCGA-PAAD cohort and validated in two independent cohorts, ICGC-PACA-CA and ICGC-PACA-AU. After iterative testing of various gene combinations, a final three-gene-based risk model was selected. Subsequent analyses included ROC curve analysis, GSEA, and drug candidates analysis in cancer cell lines.
Fig. 2.
Differentially expressed ferroptosis-related genes (FRGs) and network analyses. (A) Principal component analysis showing the distribution and clustering of gene expression patterns in The Cancer Genome Atlas (TCGA)-pancreatic adenocarcinoma (PAAD) and Genotype-Tissue Expression (GTEx) pancreatic samples. (B) Venn diagram of genes that are both DEGs and FRGs. (C) Volcano plot of the distribution of 90 differentially expressed FRGs based on the thresholds |log2(fold change)|> 1 and P < 0.05. (D) The Metascape protein–protein interaction network shows potential interactions and functional associations among differentially expressed FRGs. (E) The most highly enriched network pathways and biological processes identified by their Metascape Molecular Complex Detection (MCODE) descriptors, and the most closely connected network functional modules.
To confirm the biological functions of differentially expressed FRGs in the pancreatic cancer context, pathway enrichment and protein–protein interaction analyses were performed using Metascape running the MCODE algorithm. This analysis confirmed the enrichment of ferroptosis and ferroptosis-related pathways, including the nuclear receptor meta-pathway and the NRF2 pathway (Fig. 2D). The top four MCODE components were those associated with cell death, responses to hypoxia and oxidative stress, and fatty acid metabolism, suggesting that these ferroptosis pathway subsets contributed to pancreatic cancer progression (Fig. 2E).
Construction and assessment of an FRG-based prognostic risk model for the TCGA-PAAD cohort
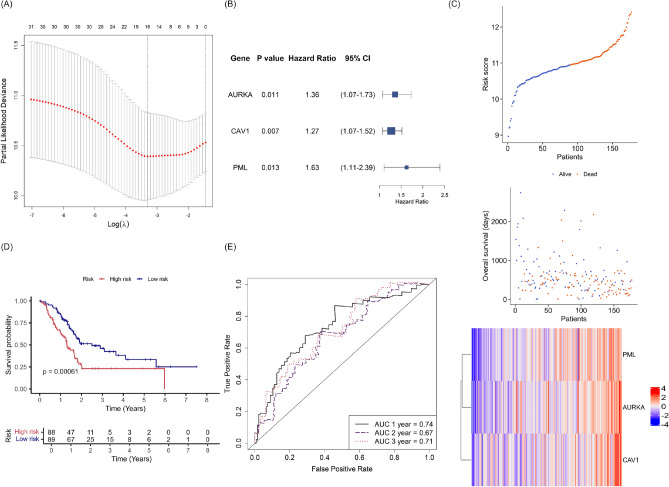
To assess the prognostic significance of differentially expressed FRGs in the pancreatic cancer context, we constructed a prognostic risk model using the TCGA-PAAD dataset as a training set. The 90 differentially expressed FRGs were subjected to univariate Cox regression analysis, yielding 32 differentially expressed FRGs associated with survival. These genes were subjected to LASSO regression analysis, which identified 16 genes with minimal partial likelihood deviance (Fig. 3A).
Fig. 3.
Construction of an FRG prognostic model using the TCGA-PAAD training set. (A) Least absolute shrinkage and selection operator (LASSO) analysis identified key differentially expressed FRGs according to minimal lambda values. (B) Forest plot illustrating the P values, hazard ratios and 95% confidence intervals (CIs) derived from multivariate Cox analysis, showing that three signature FRGs of the training set are independent risk factors for overall survival. (C) Stratification of patients into high- and low-risk groups based on median risk scores, with survival outcomes and heatmap showing the expression levels of three signature FRGs. (D) Kaplan–Meier curves and log-rank test comparing overall survival between the high- and low-risk groups. (E) Receiving operator curves (ROCs) showing the predictive capacity of the risk score for 1-, 2-, and 3-year overall survival. Model accuracy was evaluated using the area under the curve (AUC).
Next, multivariate Cox regression analysis was employed to identify independently prognostic FRGs and determine the coefficients for the risk models. Since the 16 genes derived from LASSO regression were not all independently prognostic, we iteratively tested various combinations of these 16 genes through multivariate COX analysis and survival analysis in TCGA-PAAD cohort. The resulting models were then validated in the ICGC-PACA-AU and the ICGC-PACA-CA cohort to ensure generalizability and robustness (Fig. 1). A novel risk signature, based on the expression levels of the Aurora kinase A (AURKA), Caveolin 1 (CAV1), and Promyelocytic leukemia (PML) genes, was found to be independently prognostic in TCGA-PAAD cohort. The hazard ratios were 1.36 for AURKA (95% confidence interval [CI]: 1.07–1.73, P = 0.011), 1.27 for CAV1 (95% CI 1.07–1.52, P = 0.007), and 1.63 for PML (95% CI 1.11–2.39, P = 0.013) (Fig. 3B). Each pancreatic cancer sample was assigned a risk score based on the expression levels of the three signature genes and their corresponding coefficients: (0.308 × AURKA gene expression) + (0.242 × CAV1 gene expression) + (0.487 × PML gene expression).
To explore the utility of the risk score, patients of the TCGA cohort were divided into high‐ and low‐risk groups based on the median risk score, and survival probability was assessed by Kaplan–Meier analysis. The risk score distribution, overall survival, and expression profiles of the three genes in both risk groups are shown in Fig. 3C. The Kaplan–Meier curve showed that the survival probability was significantly lower in the high-risk group than in the low-risk group (P = 0.00061) (Fig. 3D), indicating that the model reliably predicted survival of the training set. The time-dependent ROC curve for the TCGA cohort also demonstrated the accuracy of the model’s predictive power (Fig. 3E). The AUCs for 1-, 2-, and 3-year overall survival were 0.74, 0.67, and 0.71, respectively.
Validation of the FRG-based risk score in two ICGC-PACA cohorts
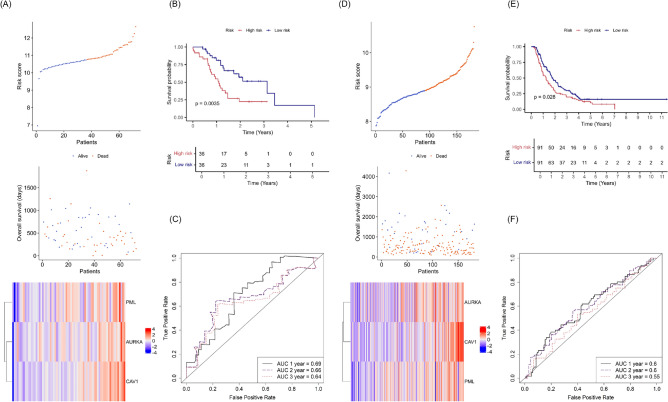
Prognostic model performance was validated in 72 patients of the ICGC-PACA-AU cohort and 182 patients of the ICGC-PACA-CA cohort. Patients were divided into high- or low-risk groups as described above. The risk score distribution, overall survival, and signature gene expression data are shown in Fig. 4A for ICGC-PACA-AU cohort and in Fig. 4D for ICGC-PACA-CA cohort. Kaplan–Meier curves revealed higher survival probability for low-risk patients, with log-rank test P values of 0.0035 for the ICGC-PACA-AU cohort (Fig. 4B) and 0.028 for the ICGC-PACA-CA cohort (Fig. 4E). The AUCs for 1-, 2-, and 3-year survival were 0.69, 0.66, and 0.64 in the ICGC-PACA-AU cohort (Fig. 4C) and 0.60, 0.60, and 0.55 in the ICGC-PACA-CA cohort, respectively (Fig. 4F). Overall, the FRG risk model demonstrated good diagnostic performance and significantly positive, prognostic predictive value in both independent cohorts.
Fig. 4.
Validation of the FRG-based risk score in the Australian and Canadian ICGC pancreatic cancer cohorts (ICGC-PACA-AU and ICGC-PACA-CA, respectively). (A) Stratification of ICGC-PACA-AU patients into high- and low-risk groups based on median risk scores, with survival outcomes and heatmap showing the expression levels of three signature FRGs. (B) Kaplan–Meier survival analysis comparing overall survival between the high- and low-risk groups in the ICGC-PACA-AU cohort. (C) ROC curves illustrating the predictive performance of the risk score for 1-, 2-, and 3-year overall survival in the ICGC-PACA-AU cohort. (D) Stratification of ICGC-PACA-CA patients into high- and low-risk groups based on median risk scores, with survival outcomes and heatmap showing the expression levels of three signature FRGs. (E) Kaplan–Meier survival analysis comparing overall survival between the high- and low-risk groups of the ICGC-PACA-CA cohort. (F) ROC curves demonstrating the predictive performance of the risk score for 1-, 2-, and 3-year overall survival in the ICGC-PACA-CA cohort.
Prognostic utility of the risk score independent of clinical features
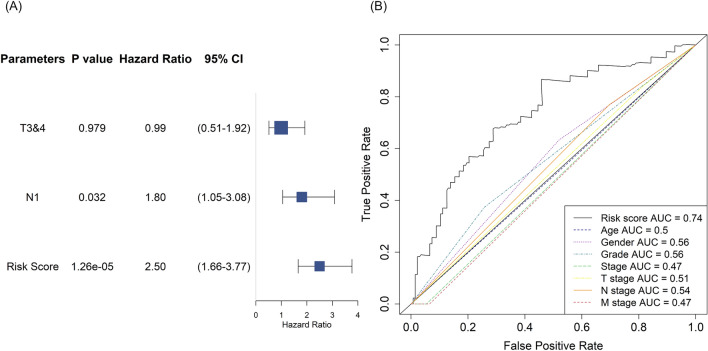
Next, we examined whether the FRG-based prognostic model predicted prognosis independent of conventional clinical and pathological variables. Univariate Cox analysis revealed that the T stage, N stage, and risk score were significantly associated with the prognosis of TCGA-PAAD patients (Table 1). Further multivariate Cox analysis of these three features revealed that the N stage and risk score were independently prognostic, with hazard ratios of 1.80 (95% CI 1.05–3.08, P = 0.032) and 2.50 (95% CI 1.66–3.77, P = 0.0000126), respectively (Fig. 5A). The AUC of the risk score was 0.74, greater than that of any clinicopathological parameter (Fig. 5B).
Table 1.
Univariate Cox analysis of risk score and clinical features in TCGA-PAAD cohort.
| Parameters | Regression coefficient | Hazard ratio | 95% confidence interval | P value |
|---|---|---|---|---|
| Age (≥ 65 vs 65) | 0.3409 | 1.4062 | 0.9284–2.13 | 0.108 |
| Gender (female vs. male) | − 0.1942 | 0.8235 | 0.5478–1.238 | 0.35 |
| Tumor grade (G3&4 vs G1&2) | 0.4166 | 1.5168 | 0.9832–2.34 | 0.0596 |
| Tumor stage (stage III&IV vs stage I&II) | − 0.2198 | 0.8027 | 0.2531–2.545 | 0.709 |
| T stage (T3&4 vs T1&2) | 0.7192 | 2.0527 | 1.089–3.871 | 0.0263* |
| N stage (N1 vs N0) | 0.7484 | 2.1137 | 1.259–3.549 | 0.00465** |
| M stage (M1 vs M0) | 0.04887 | 1.05009 | 0.2513–4.388 | 0.947 |
| Risk score | 1.0000 | 2.7183 | 1.87–3.951 | 1.59e-07*** |
*P < 0.05; **P < 0.01; ***P < 0.001.
Fig. 5.
Independent prognostic performance of the risk score. (A) Forest plot illustrating the P values, hazard ratios and 95% confidence intervals (CIs) derived from multivariate Cox analysis for the risk score and significant clinical parameters (T3 and T4 stage, N1 stage). (B) ROC curves comparing the prognostic accuracy of the risk score to that of other clinical parameters. Model accuracy was evaluated using the AUC.
Analysis of gene sets enriched in the high-risk group
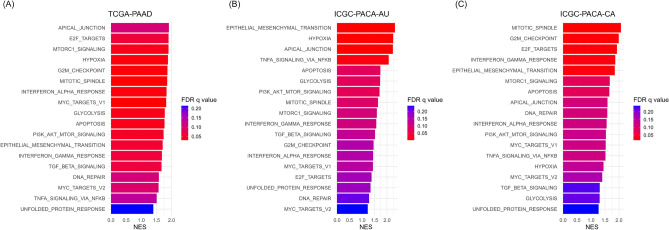
To understand why the risk model predicted poor prognosis, RNA-seq data of stratified TCGA-PAAD, ICGC-PACA-AU, and ICGC-PACA-CA patients were subjected to GSEA of the hallmark gene sets, and pathways enriched in the high-risk group were assessed. Eighteen hallmark signatures significantly enriched across all three cohorts are listed in Fig. 6. Pathways that were more strongly expressed in the high-risk group were associated with cancer cell aggressiveness and proliferation, including genes of the apical junction, epithelial-to-mesenchymal transition, hypoxia, and mTORC1 signaling. The mitotic spindle, G2M checkpoint, DNA repair, tumor necrosis factor α signaling, and interferon response signatures were enriched in the high-risk group, suggesting the involvement of DNA damage and inflammatory and immune signaling in pancreatic cancer progression.
Fig. 6.
Gene set enrichment analysis of two risk groups from TCGA and ICGC cohorts. Bar plots show the top 18 hallmark gene sets that commonly enriched in the high-risk groups of the (A) TCGA-PAAD, (B) ICGC-PACA-AU, and (C) ICGC-PACA-CA cohorts.
Tumor immune environments of the two risk groups
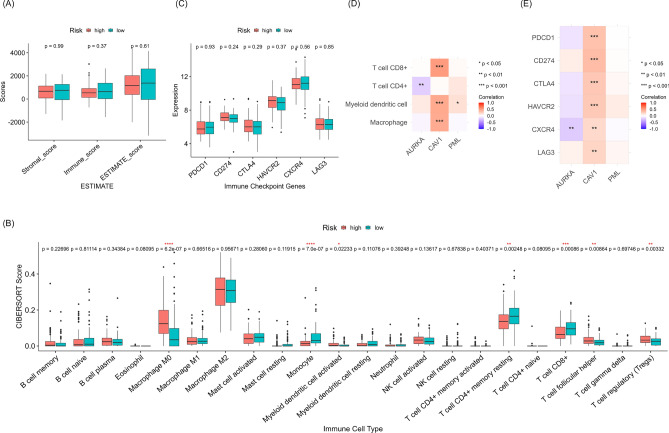
As inflammation and immune signaling pathways were prominent in the gene profiles of the high-risk group, we further examined the impact of the FRG-based risk score on the tumor microenvironment in TCGA-PAAD dataset. The abundance of immune cells and stromal cells in tumor tissues were analyzed with The ESTIMATE algorithm. However, the stromal, immune, and ESTIMATE scores did not differ between the two groups (Fig. 7A). Next, the CIBERSORT algorithm was used to analyze the infiltration of specific immune cell classes. Compared to the low-risk group, the high-risk group had significantly more M0 macrophages, activated myeloid dendritic cells, follicular helper T cells, and regulatory T cells, but fewer monocytes, resting CD4+ memory T cells, and CD8+ T cells (Fig. 7B). Given the expression levels of immune checkpoint genes influence the therapeutic response to immune checkpoint inhibitors, we subsequently assessed whether the expression level of PDCD1, CD274, CTLA4, HAVCR2, CXCR4, or LAG3 differed between our risk groups. But the mRNA levels of these genes from TCGA-PAAD transcriptome dataset were not significantly different between the two risk groups (Fig. 7C), indicating that our risk signature is not associated with the benefit from immune checkpoint inhibitors.
Fig. 7.
Tumor immune environments in two risk groups from TCGA-PAAD cohort. (A) Stromal, immune, and ESTIMATE score differences between the high- and low-risk groups according to the FRG-based risk score using the ESTIMATE algorithm. (B) Analysis of immune cell infiltration using the CIBERSORT algorithm. (C) The expression levels of immune checkpoint genes in the high- and low-risk groups. (D) Partial spearman correlations between signature gene expression levels and the numbers of infiltrated immune cells by TIMER2.0 analysis. (E) Correlation analysis of immune checkpoint gene expression levels and three signature genes.
Next, we determined whether our signature genes were individually associated with the tumor immune environment. TIMER2.0 examines partial Spearman correlations between the expression levels of signature genes and numbers of infiltrated immune cells. This analysis revealed that CAV1 expression was strongly correlated with infiltration in CD8+ T cells, dendritic cells, and macrophages (Fig. 7D). Correlation analysis of mRNA levels between our signature genes and immune checkpoint genes further showed that CAV1 were positively correlated with all immune checkpoint genes (Fig. 7E). Taken together, CAV1, among our signature genes, was related to tumor immune microenvironment, and some subsets of immune cells may differ between the two groups; however, the overall tumor immune status or immunotherapy response was not different between high- and low-risk groups.
Possible therapeutic targets based on the FRG-based risk scores
As these risk groups did not differ in tumor immune and stromal scores, we speculated that the expression of signature genes might be mainly contributed by tumor cells. Therefore, we explored the potential therapeutic options for our FRG-based risk groups using datasets for transcriptome and drug response in pancreatic cell lines and evaluated their efficacies with experiments. We used the CCLE dataset to obtain basal mRNA expression level of 33 pancreatic cell lines and PRISM datasets to acquire AUC data of 1448 compounds. Risk scores for these 33 cell lines were calculated with our risk formula using normalized count of AURKA, CAV1, and PML genes from CCLE dataset. Then we designated the top and bottom nine cell lines in the high and low-risk group, respectively, and compared the AUC values of PRISM 2° Screen dataset between the two groups for each compound. Finally, we identified 40 compounds which are expected to have significantly different between-group responses (P < 0.05) (Supplementary Table 2).
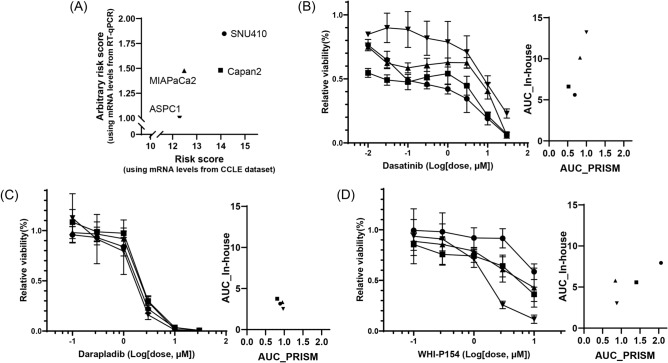
For experimentally validate risk model-dependent effect of compound, we chose three compounds and four pancreatic cancer cell lines based on their selectivity and availability. According to CCLE and PRISM datasets, dasatinib has lower AUCs in cell lines group with high-risk, darapladib have similar AUCs across cell lines, while WHI-P154 has a lower AUC in cell lines group with low-risk (Supplementary Table 2 and Fig. 8B–D). ASPC1 and MIAPaCa cells were used for the low-risk signature, and SNU410 and Capan2 cells were used for the high-risk signature (Fig. 8A).
Fig. 8.
Responses of candidate drugs in pancreatic cancer cell lines. (A) Risk scores using signature genes expression levels from CCLE dataset and in-house RT-qPCR for SNU410 (closed circle), Capan2 (closed square), MIAPaCa2 (closed triangle) and AsPC1 (closed inverted triangle) cell lines. The changes of cell viability after 3-day treatment of dasatinib (B), darapladib (C), and WHI-P154 (D) were measured using the CellTiter-Glo® assay (left). The AUC values derived from PRISM 2° Screen dataset and CellTiter-Glo® assay for each compound are indicated (right).
We confirmed the risk scores of the cell lines based on CCLE dataset by measuring the arbitrary risk scores using in-house RT-qPCR experiments (Fig. 8A). The arbitrary risk score was calculated with relative mRNA levels of AURKA, CAV1, and PML expression normalized with three housekeeping genes levels across 4 cell lines. The risk scores derived from the CCLE dataset followed the order of ASPC1 < MIAPaCa2 < Capan2 < SNU410, while the arbitrary risk scores from RT-qPCR results followed the order of ASPC1 < MIAPaCa2 ≒ Capan2 < SNU410. In both analyses, ASPC1 and SNU410 cells exhibited the lowest and highest risk score, respectively.
Cell viability assay revealed that dasatinib significantly reduced the survival rates of SNU410 and Capan2 cells, followed by MIAPaCa2 and AsPC1 cells (Fig. 8B). Darapladib dose-dependently reduced the viability of all cell lines with equivalent efficacy (Fig. 8C). Conversely, WHI-P154 was most effective on ASPC1 cells, moderately effective on MIAPaCa2 and Capan2 cells, and least effective on SNU410 cells (Fig. 8D). Collectively, we experimentally validated that dasatinib was selectively active in SNU410 cells with high-risk score, while WHI-P154 was selectively active in AsPC1 cells with low-risk score.
Discussion
Genetic and transcriptomic data have been employed to develop molecular subtype classification systems predicting survival rates and treatment responses2,6. The prognostic significance of FRGs in various malignant tumors has gained increasing attention. Our FRG-based risk model was developed and validated in three of the largest international datasets, encompassing multiple centers and multiple racial groups, which enhanced its robustness and minimize the risk of overfitting compared to previous studies. Remarkably, our risk model successfully predicted prognosis across three international cohorts, despite significant differences in mean survival time among them (Supplementary Table 1). Additionally, we identified enriched pathways, analyzed the association with the tumor immune environment in the high-risk group. Furthermore, leveraging clinically derived gene signatures, we utilized the PRISM and CCLE datasets to identify plausible candidates effective in pancreatic cancer cell lines with high- or low-risk gene signatures, and experimentally validated the efficacy of a potential therapeutic candidates.
Although risk models that use polygenic signatures can capture the effects of specific biological pathways using core regulatory genes, training data can become overfitted, reducing model applicability to new datasets24,25. Models incorporating fewer genes are less computationally demanding but may be associated with underfitting and may overlook important genes. LASSO regression is commonly used to both optimize prognostic gene selection and shrink models, although its effectiveness depends on the dataset size, noise level, and correlations among independent variables10,12. Previous pancreatic cancer risk models were based on 4, 6, or 14 FRGs9–12; our prognostic risk model used three signature genes: AURKA, CAV1, and PML. Notably, no prior risk model has employed the ICGC-PACA-CA cohort, which is one of the largest publicly available pancreatic cancer cohorts. Our model successfully predicted poorer outcomes for high-risk patients in all three international cohorts. The log-rank P values from survival analysis were 0.00061 for TCGA-PAAD, 0.0035 for ICGC-PACA-CA and 0.028 for ICGC-PACA-AU cohorts. These findings highlight the robustness of our FRG-based model and validate its generalizability across diverse patient populations.
Our signature genes play crucial roles in ferroptosis regulation and pancreatic cancer progression. AURKA is a mitotic serine/threonine kinase that promotes pancreatic cancer progression by inducing the epithelial-to-mesenchymal transition and chemoresistance via the phosphorylation/activation of Twist126–28. Elevated AURKA levels inhibit ferroptosis by regulating GPX4 levels, thereby protecting the cells of upper gastrointestinal tract cancers29. Thus, AURKA-mediated ferroptosis regulation increases pancreatic cancer risk. CAV1 is the main component of caveolar plasma membranes and acts as both a tumor suppressor and promoter30. CAV1 overexpression increases tumor growth in pancreatic cancer and is associated with poor patient outcomes31. CAV1 knockdown aggravated liver ferroptosis32, suggesting that CAV1 inhibits ferroptosis and promotes cancer progression. PML plays a complex role in cancer progression33. PML sequesters MDM2, thereby stabilizing p53, and localizes the pro-apoptotic protein Daxx to nuclear bodies34. On the other hand, PML can support cancer cell survival under hypoxia or radiation stress and impart high-level ferroptosis resistance to human fibroblasts35. The utility of PML status in the prognosis of ferroptosis and pancreatic cancer status is not well understood; however, our results provide insight into how PML promotes pancreatic cancer progression.
Ferroptosis stimulates immune system-mediated antitumor responses by releasing HMGB1, followed by activation of the innate and adaptive immune systems in tumor contexts36. A previous study developed an FRG-based risk model that incorporated an immune system score and the expression levels of immune checkpoint genes10. In our risk model, overall immune and stromal scores determined by the ESTIMATE algorithm did not differ between the two risk groups; only certain immune cell types identified by the CIBERSORT algorithm exhibited distinct distributions between the two groups. The high-risk group showed lower levels of monocytes, resting CD4+ memory T cells, and CD8+ T cells, but higher levels of regulatory T cells, indicating suppression of the immune response. However, the former group exhibited more activated myeloid dendritic cells and follicular helper T cells, rendering it difficult to define the immune status of the high-risk group. Overall, these risk groups may have different populations of immune cells, however, did not show differences in overall tumor immune cell score or immunotherapy response. Additionally, our risk model did not show significant differences in the expression levels of immune checkpoint genes between the two risk groups. Given that higher expression of immune checkpoint genes in tumors is associated with better response to immune checkpoint inhibitors37, our risk model is unlikely to be related to the response to these therapies. Notably, among the three signature genes, only CAV1 expression is primarily correlated with immune cell infiltration and immune checkpoint gene expression. CAV1 is also expressed in cancer-associated fibroblasts (CAFs), which has been linked to poor patients’ prognosis38, metabolic reprogramming39 and inflammation associated with ferroptosis40. The interplay between tumor-infiltrated immune cells and CAFs in the context of the prognostic ferroptosis signature warrants further investigation in future studies.
A prognostic model that yields potential treatment strategies for defined subtypes is particularly valuable3,41. Using CCLE gene expression and PRISM cell viability datasets, we selected cell lines with high and low-risk signature and identified plausible compounds that may affect each group differently. Subsequently, we validated the risk status of four cell lines by measuring mRNA level of three signature genes and evaluated the efficacies of three compounds. Dasatinib, an Alb, Src, and c-Kit inhibitor, was more effective in SNU410 cells with high-risk gene signature as predicted. WHI-P154, a JAK inhibitor, afforded the expected outcomes in ASPC1 cells with low-risk gene signature. Dasatinib may repress signaling pathways that target E2F and MYC, and mTORC1 signaling; all were enriched in the high-risk group according to GSEA. Our bioinformatic and experimental approach offers a valuable framework for identifying plausible candidates relevant to the risk model. However, we acknowledge the limitation that risk score calculation using cell lines may differ qualitatively from those derived from tumor tissues. The cell lines used in this study may not fully capture the mutational profiles or tumor microenvironment factors present in patient tumors, which limits the external validity of our findings. To address this, the effects observed in this study should therefore be validated in larger cell line panels, clinical samples, or in vivo models incorporating the tumor microenvironment and pharmacokinetic factors for a more comprehensive understanding.
In conclusion, we developed an FRG-based prognostic model using the TCGA-PAAD cohort and validated its performance in ICGC-PACA-CA and ICGC-PACA-AU cohorts. Our risk model will contribute to the identification of patients with poor prognoses, to select potential therapeutic avenues, and to enhance our understanding of pancreatic cancer progression.
Supplementary Information
Acknowledgements
This work was supported by the National Research Foundation of Korea (NRF) grant funded by the Korea government (No. NRF-2021R1A2C2014145).
Author contributions
S.J.L. designed the overall project and supervised the study; T.T.C. designed, conducted bioinformatic analysis and measured cell viability; Z.P. analyzed gene expression; S.J.L. and T.T.C. analyzed, interpreted and visualized the data; S.J.L. and T.T.C. wrote the paper with input from other authors; All authors have read and agreed to the published version of the manuscript.
Data availability
The datasets presented in this study can be found in online repositories. TCGA and GTEx datasets are available on GEPIA2. The RNASeq and clinical data for TCGA-LIHC are available on UCSC Xena Browser (http://xena.ucsc.edu/). The RNASeq and clinical data for ICGC-LIRI-JP and ICGC-LICA-FR were downloaded from the ICGC data portal (https://dcc.icgc.org/). All other data supporting the findings of this study are available within the article.
Declarations
Competing interests
The authors declare no competing interests.
Footnotes
Publisher’s note
Springer Nature remains neutral with regard to jurisdictional claims in published maps and institutional affiliations.
Supplementary Information
The online version contains supplementary material available at 10.1038/s41598-024-84607-6.
References
- 1.Huang, J. et al. Worldwide burden of, risk factors for, and trends in pancreatic cancer. Gastroenterology160, 744–754. 10.1053/j.gastro.2020.10.007 (2021). [DOI] [PubMed] [Google Scholar]
- 2.Hu, H. F. et al. Mutations in key driver genes of pancreatic cancer: molecularly targeted therapies and other clinical implications. Acta Pharmacol. Sin.42, 1725–1741. 10.1038/s41401-020-00584-2 (2021). [DOI] [PMC free article] [PubMed] [Google Scholar]
- 3.Heus, P. et al. Transparent reporting of multivariable prediction models in journal and conference abstracts: TRIPOD for abstracts. Ann. Intern. Med.10.7326/M20-0193 (2020). [DOI] [PubMed] [Google Scholar]
- 4.Paik, S. et al. A multigene assay to predict recurrence of tamoxifen-treated, node-negative breast cancer. N. Engl. J. Med.351, 2817–2826. 10.1056/NEJMoa041588 (2004). [DOI] [PubMed] [Google Scholar]
- 5.Mizrahi, J. D., Surana, R., Valle, J. W. & Shroff, R. T. Pancreatic cancer. Lancet395, 2008–2020. 10.1016/S0140-6736(20)30974-0 (2020). [DOI] [PubMed] [Google Scholar]
- 6.Chen, X., Zeh, H. J., Kang, R., Kroemer, G. & Tang, D. Cell death in pancreatic cancer: from pathogenesis to therapy. Nat. Rev. Gastroenterol. Hepatol.18, 804–823. 10.1038/s41575-021-00486-6 (2021). [DOI] [PubMed] [Google Scholar]
- 7.Liu, J., Kang, R. & Tang, D. The art of war: ferroptosis and pancreatic cancer. Front. Pharmacol.12, 773909. 10.3389/fphar.2021.773909 (2021). [DOI] [PMC free article] [PubMed] [Google Scholar]
- 8.Dai, E. et al. Ferroptotic damage promotes pancreatic tumorigenesis through a TMEM173/STING-dependent DNA sensor pathway. Nat. Commun.11, 6339. 10.1038/s41467-020-20154-8 (2020). [DOI] [PMC free article] [PubMed] [Google Scholar]
- 9.Jiang, P. et al. The construction and analysis of a ferroptosis-related gene prognostic signature for pancreatic cancer. Aging13, 10396–10414. 10.18632/aging.202801 (2021). [DOI] [PMC free article] [PubMed] [Google Scholar]
- 10.Yu, X. et al. A prognostic model of pancreatic cancer based on ferroptosis-related genes to determine its immune landscape and underlying mechanisms. Front. Cell Dev. Biol.9, 746696. 10.3389/fcell.2021.746696 (2021). [DOI] [PMC free article] [PubMed] [Google Scholar]
- 11.Xu, F. et al. Bioinformatic mining and validation of the effects of ferroptosis regulators on the prognosis and progression of pancreatic adenocarcinoma. Gene795, 145804. 10.1016/j.gene.2021.145804 (2021). [DOI] [PubMed] [Google Scholar]
- 12.Qiu, C. J. et al. Development and validation of a ferroptosis-related prognostic model in pancreatic cancer. Invest. New Drugs39, 1507–1522. 10.1007/s10637-021-01114-5 (2021). [DOI] [PubMed] [Google Scholar]
- 13.Goldman, M. J. et al. Visualizing and interpreting cancer genomics data via the Xena platform. Nat. Biotechnol.38, 675–678. 10.1038/s41587-020-0546-8 (2020). [DOI] [PMC free article] [PubMed] [Google Scholar]
- 14.Zhang, J. et al. The International Cancer Genome Consortium data portal. Nat. Biotechnol.37, 367–369. 10.1038/s41587-019-0055-9 (2019). [DOI] [PubMed] [Google Scholar]
- 15.Corsello, S. M. et al. Discovering the anti-cancer potential of non-oncology drugs by systematic viability profiling. Nat. Cancer1, 235–248. 10.1038/s43018-019-0018-6 (2020). [DOI] [PMC free article] [PubMed] [Google Scholar]
- 16.Ghandi, M. et al. Next-generation characterization of the cancer cell line encyclopedia. Nature569, 503–508. 10.1038/s41586-019-1186-3 (2019). [DOI] [PMC free article] [PubMed] [Google Scholar]
- 17.Zhou, N. & Bao, J. FerrDb: a manually curated resource for regulators and markers of ferroptosis and ferroptosis-disease associations. Database10.1093/database/baaa021 (2020). [DOI] [PMC free article] [PubMed] [Google Scholar]
- 18.Zhou, Y. et al. Metascape provides a biologist-oriented resource for the analysis of systems-level datasets. Nat. Commun.10, 1523. 10.1038/s41467-019-09234-6 (2019). [DOI] [PMC free article] [PubMed] [Google Scholar]
- 19.Subramanian, A. et al. Gene set enrichment analysis: a knowledge-based approach for interpreting genome-wide expression profiles. Proc. Natl. Acad. Sci. USA102, 15545–15550. 10.1073/pnas.0506580102 (2005). [DOI] [PMC free article] [PubMed] [Google Scholar]
- 20.Yoshihara, K. et al. Inferring tumour purity and stromal and immune cell admixture from expression data. Nat. Commun.4, 2612. 10.1038/ncomms3612 (2013). [DOI] [PMC free article] [PubMed] [Google Scholar]
- 21.Newman, A. M. et al. Robust enumeration of cell subsets from tissue expression profiles. Nat. Methods12, 453–457. 10.1038/nmeth.3337 (2015). [DOI] [PMC free article] [PubMed] [Google Scholar]
- 22.Li, T. et al. TIMER2.0 for analysis of tumor-infiltrating immune cells. Nucleic Acids Res.48, W509–W514. 10.1093/nar/gkaa407 (2020). [DOI] [PMC free article] [PubMed] [Google Scholar]
- 23.Kim, D. H., Kim, W. D., Kim, S. K., Moon, D. H. & Lee, S. J. TGF-beta1-mediated repression of SLC7A11 drives vulnerability to GPX4 inhibition in hepatocellular carcinoma cells. Cell Death Dis.11, 406. 10.1038/s41419-020-2618-6 (2020). [DOI] [PMC free article] [PubMed] [Google Scholar]
- 24.Ahluwalia, P., Kolhe, R. & Gahlay, G. K. The clinical relevance of gene expression based prognostic signatures in colorectal cancer. Biochim. Biophys. Acta Rev. Cancer1875, 188513. 10.1016/j.bbcan.2021.188513 (2021). [DOI] [PubMed] [Google Scholar]
- 25.Collins, G. S. et al. TRIPOD+AI statement: updated guidance for reporting clinical prediction models that use regression or machine learning methods. BMJ385, e078378. 10.1136/bmj-2023-078378 (2024). [DOI] [PMC free article] [PubMed] [Google Scholar]
- 26.Furukawa, T. et al. AURKA is one of the downstream targets of MAPK1/ERK2 in pancreatic cancer. Oncogene25, 4831–4839. 10.1038/sj.onc.1209494 (2006). [DOI] [PubMed] [Google Scholar]
- 27.Gomes-Filho, S. M. et al. Aurora A kinase and its activator TPX2 are potential therapeutic targets in KRAS-induced pancreatic cancer. Cell Oncol.43, 445–460. 10.1007/s13402-020-00498-5 (2020). [DOI] [PubMed] [Google Scholar]
- 28.Wang, J. et al. The Aurora-A-Twist1 axis promotes highly aggressive phenotypes in pancreatic carcinoma. J. Cell Sci.130, 1078–1093. 10.1242/jcs.196790 (2017). [DOI] [PMC free article] [PubMed] [Google Scholar]
- 29.Gomaa, A. et al. Epigenetic regulation of AURKA by miR-4715-3p in upper gastrointestinal cancers. Sci. Rep.9, 16970. 10.1038/s41598-019-53174-6 (2019). [DOI] [PMC free article] [PubMed] [Google Scholar]
- 30.Kamposioras, K. et al. Prognostic significance and therapeutic implications of Caveolin-1 in gastrointestinal tract malignancies. Pharmacol. Ther.233, 108028. 10.1016/j.pharmthera.2021.108028 (2022). [DOI] [PubMed] [Google Scholar]
- 31.Chatterjee, M. et al. Caveolin-1 is associated with tumor progression and confers a multi-modality resistance phenotype in pancreatic cancer. Sci. Rep.5, 10867. 10.1038/srep10867 (2015). [DOI] [PMC free article] [PubMed] [Google Scholar]
- 32.Deng, G. et al. Caveolin-1 dictates ferroptosis in the execution of acute immune-mediated hepatic damage by attenuating nitrogen stress. Free Radic. Biol. Med.148, 151–161. 10.1016/j.freeradbiomed.2019.12.026 (2020). [DOI] [PubMed] [Google Scholar]
- 33.Tessier, S., Martin-Martin, N., de The, H., Carracedo, A. & Lallemand-Breitenbach, V. Promyelocytic leukemia protein, a protein at the crossroad of oxidative stress and metabolism. Antioxid. Redox Signal.26, 432–444. 10.1089/ars.2016.6898 (2017). [DOI] [PubMed] [Google Scholar]
- 34.Brazina, J. et al. DNA damage-induced regulatory interplay between DAXX, p53, ATM kinase and Wip1 phosphatase. Cell Cycle14, 375–387. 10.4161/15384101.2014.988019 (2015). [DOI] [PMC free article] [PubMed] [Google Scholar]
- 35.Saint-Germain, E. et al. SOCS1 regulates senescence and ferroptosis by modulating the expression of p53 target genes. Aging9, 2137–2162. 10.18632/aging.101306 (2017). [DOI] [PMC free article] [PubMed] [Google Scholar]
- 36.Li, G. et al. Targeting the MCP-GPX4/HMGB1 axis for effectively triggering immunogenic ferroptosis in pancreatic ductal adenocarcinoma. Adv. Sci.11, e2308208. 10.1002/advs.202308208 (2024). [DOI] [PMC free article] [PubMed] [Google Scholar]
- 37.Suzanne, L. et al. Safety, activity, and immune correlates of anti-PD-1 antibody in cancer. N. Engl. J. Med.366, 2443–2454. 10.1056/NEJMoa1200690 (2012). [DOI] [PMC free article] [PubMed] [Google Scholar]
- 38.Takanobu, Y. et al. Cellular senescence, represented by expression of caveolin-1, in cancer-associated fibroblasts promotes tumor invasion in pancreatic cancer. Ann. Surg. Oncol.26, 1552–1559. 10.1245/s10434-019-07266-2 (2019). [DOI] [PubMed] [Google Scholar]
- 39.Fanglong, W. et al. Signaling pathways in cancer-associated fibroblasts and targeted therapy for cancer. Signal Transduct. Target Ther.6, 218. 10.1038/s41392-021-00641-0 (2021). [DOI] [PMC free article] [PubMed] [Google Scholar]
- 40.Lu, X. et al. Fibroblast ferroptosis is involved in periodontitis-induced tissue damage and bone loss. Int. Immunopharmacol.114, 109607. 10.1016/j.intimp.2022.109607 (2023). [DOI] [PubMed] [Google Scholar]
- 41.Subramanian, J. & Simon, R. Gene expression-based prognostic signatures in lung cancer: ready for clinical use?. J. Natl. Cancer Inst.102, 464–474. 10.1093/jnci/djq025 (2010). [DOI] [PMC free article] [PubMed] [Google Scholar]
Associated Data
This section collects any data citations, data availability statements, or supplementary materials included in this article.
Supplementary Materials
Data Availability Statement
The datasets presented in this study can be found in online repositories. TCGA and GTEx datasets are available on GEPIA2. The RNASeq and clinical data for TCGA-LIHC are available on UCSC Xena Browser (http://xena.ucsc.edu/). The RNASeq and clinical data for ICGC-LIRI-JP and ICGC-LICA-FR were downloaded from the ICGC data portal (https://dcc.icgc.org/). All other data supporting the findings of this study are available within the article.


