Abstract
We have blended MgO QDs with poly (methylmethacrylate) (PMMA) thin films using solution-casting method. MgO QDs were doped at 5 wt %, 10 wt %, and 15 wt % in PMMA film and annealed for 02, 04, 06, 08, 10, 12, 14, 20, 24, and 28 h at 130 degree Celsius. We have comprehensively investigated the molecular-scale restructuring and morphological evolution of the composite films and have accounted for the reasons based on the observations made on chemical bonding, crystallinity, bandgap, Urbach energy, and fluorescence and Raman spectra. We observe that the film loses its overall crystallinity in the initial stages of annealing, which improves slightly owing to the temperature-induced limited diffusion of MgO QDs (sizes in the range of 7.0603–9.5647 nm). MgO QDs undergo coarsening at temperatures as low as 130 0C. The limited diffusion of MgO QDs allows for the formation of larger clusters, which in turn affects the local crystallinity of the composite films. We report local-scale re-crystallization driven by dispersion forces acting globally. As far as the quantum nature of forces is concerned, this work clearly demonstrates some unique energy dissipation mechanism of charge carriers in QDs via overlapping with long-range dispersion forces. The morphological evolution of the films is the outcome of the reconciliation of forces. We discuss the role of competing forces. The evolution of nano-micro scale structures inside films is governed by the reconciliation between inter- and intra-molecular forces. The temperature of the film plays an important role in facilitating the entire process. To obtain molecular-scale insights, we have estimated the crystallinity, bandgap, and Urbach energy of the pure and hybrid films. MgO QDs diffuse locally and coalesced to form larger spherical clusters. The anchoring of MgO QDs on the PMMA surface and vice-versa appears to provide thermal stability and mechanical strength to the nanocomposite films, as the MgO QDS-doped PMMA film form nanometer-sized particulates of PMMA. In contrast, the overall crystallinity of the hybrid film drastically decreases as the formation of boundaries, interfaces, and voids overwhelmed the entire process. The formation of larger nanoaggregates at later stages of annealing slightly improves the crystallinity of the films. The estimation of the bandgap and Urbach energy calculations confirm the same. The micro-level phenomenological understanding of the diffusion process of nanodots in a nearly solid film is technically important for ensuring the sustainability of such nanocomposites that undergo a heating process.
Supplementary Information
The online version contains supplementary material available at 10.1038/s41598-024-80652-3.
Keywords: Bandgap, Urbach Energy, Diffusion in solid films, Nucleation, Local crystallization
Subject terms: Materials science, Nanoscience and technology, Physics
Introduction
Composite materials have attracted significant interest over the past few decades. They are formed through the assembly of two or more materials. They are classified into three categories: metallic, organic, and mineral. Examples of organic composites are resins and cellulose fibres, laminated tires composed of rubber, organic resins, steel, glass fibres, boron and carbon, and reinforced plastics (short fibres and resins). Concrete, carbon-carbon composites, and ceramic composites are examples of mineral composites, whereas aluminium/boron and aluminium/carbon fibres are examples of metallic composites. Composite materials are used in a variety of applications such as packaging, automotive and civil engineering, aerospace engineering, sports, and biomedicine. They show excellent thermal and mechanical stability, high impact and abrasion resistance, and high electrical insulation1. In nanocomposites, one component has at least one dimension in the range of 1–100 nm e.g. a polymer film matrix hosting organic or inorganic nanoparticles (NPs), nanorods (NRs), and nanotubes (NTs). Nanocomposites have opened new avenues for applications. Nanoscience and nanotechnology has emerged as a major thrust area of research, leading to significant advancements in all disciplines, including polymer science in recent past. It has been discovered that materials demonstrate significantly distinct behavior at nanoscales compared to their bulk counterparts. This has led to the discovery of novel functional materials that can be used for the design and creation of new features and structures, resulting in improved performance, lower maintenance costs, and better functionality. QDs have received a lot of attention because, when mixed with polymers, they produce environmentally friendly polymer nanocomposites that may be used in various applications, particularly in the field of biotechnology. Polymer nanocomposites possess significantly improved mechanical and electrical characteristics and heat and radiation resistance owing to the dispersion of nanosized inorganic fillers in the organic polymer matrix. Extensive research has been conducted to estimate the physical, mechanical, optical, electrical, and electronic properties of these materials. Owing to their importance in device fabrication, the optical, thermal, and electrical properties of polymer nanocomposites have attracted significant interest over the past few decades. The optical characteristics of polymer nanocomposites can be significantly altered by the addition of QDs, owing to the extremely large surface area of the QDs. Dispersed QDs have an extremely large surface area compared to macro/microparticles, enabling them to interact well with the host matrix. Therefore, their incorporation into a polymer matrix can be used to modify the optical properties of polymers. This material must be versatile and useful for a variety of commercial and industrial applications. Polymers can be used in fuel tanks, military applications, food packaging, electronics, gas sensors, and a variety of other industrial applications. Polyvinyl-chloride, poly-vinyl-alcohol, polymethylacrylate, polymethylmethacrylate, polyacrylic acid, and other polymers are commonly used in this sector. Polymethylmethacrylate (PMMA) is one of the most attractive and intriguing polymers because of its appealing physical and optical properties. PMMA is an environmentally friendly thermoplastic polymer with outstanding hardness, tensile strength, transparency, high stiffness, excellent insulating qualities, and thermal stability. PMMA is frequently used as a glass substitute. PMMA has a density of nearly half that of organic glass2. PMMA has turned out to be an excellent substitute to replace inorganic glasses used in auto-mobiles not only because of its reduced weight but because of excellent mechanical strength and thermal stability2.Doping metal oxide QDs into PMMA can further enhance its mechanical and thermal strengths. Doping metals and their oxide QDs allows for bandgap engineering of the nanocomposites, which can be exploited to make them UV-resistant. PMMA is also frequently used in skeletal surgery to connect prosthetic implants and to treat soft tissue infections. It is also widely used in antibiotic delivery for the treatment of osteomyelitis and osseous infections3.
Micron-sized BaTiO3 particles offer a versatile method to tune the dielectric and piezoelectric properties of polyvinylidene fluoride trifluoroethylene P (VDF-TrFE) polymers4. Many investigations of the thermal, optical, and electrical properties of inorganic QDs-doped PMMA polymers have been published. El-Zaher et al.5 investigated the impact of TiO2 on the structure and thermal properties of PMMA polymeric material for technological applications in the field of medical science. Convertino et al. also studied the effect of surface chemistry and the morphology of TiO2 nanocrystals on the absorption properties of PMMA/TiO2 nanocomposite materials. Saraswat et al. reported the relationship between doping concentrations and the structural morphology and thermal properties of PMMA-TiO2 nanocomposite materials. We studied the effect of annealing on the structural and optical properties of the MgO-doped thin PMMA films. Composite films annealed for several hours were characterized using Fourier Transform Infrared Spectroscopy (FTIR), high-resolution X-ray diffraction (HR-XRD), Fluorescence Spectroscopy (FL), and scanning electron microscopy (SEM).
The blending of miscible and immiscible polymers is important for their technological applications6. Phase separation in thin films composed of two immiscible polymers and the physicochemical properties of the substrates govern the morphological properties of the thin films. The incorporation of QDs into homopolymer and polymer blend films has led to a fascinating area of research. The presence of QDs in a polymer matrix has been found to significantly enhance its mechanical, optical, conducting, thermal, and other properties. The addition of QDs to thin polymer films and their mixtures greatly improves the mechanical and thermal stability of the films. The doping concentration can influence film morphology and functional properties6. Poly-methyl-methacrylate (PMMA) doped with iron oxide QDs is used for electromagnetic shielding and magnetically induced hyperthermia in cancer treatment7. PMMA is an amorphous linear thermoplastic film. It has good mechanical and thermal stabilities. They are chemically and biologically inert. The nanocomposites are mechanically deformable. PMMA nanocomposite films combine the unique properties of QDs as well as polymer films. Homogenously dispersed QDs help retain the properties of both the QDs and the film7. Apart of the above properties, PMMA shows high resistance to sunshine exposure. PMMA films can withstand temperatures in the range 70 0C to 100 0C. It has a refractive index between 1.3 and 1.7. Colourless PMMA is widely used as a substitute for inorganic glass8.
The incorporation of metal oxide QDs, such as ZnO, CuO, ZnS, CdS, SiO2, TiO2, and Al2O3, into a polymer matrix has demonstrated excellent electrical, optical, and mechanical properties9,10. Owing to their enhanced and unique functional properties, polymer nanocomposites have been used in optical lenses, UV shields, light-emitting diodes, photodetectors, solar cells, sensors, super capacitors, random lasers, anti-corrosion, and protective layers9. Spiropyran-doped poly(methylmethacrylate) is a light-responsive material that can be used as UV-sensors11.Palladium QDs-doped polymer microfibers function as hydrogen probes for use in hydrogen sensors12. PMMA Membrane-Coated Pd QDs/Single-Layer Graphene Hybrid can function as a highly sensitive and selective hydrogen sensor13. Silver QDs-poly(methyl methacrylate)–based colorimetric sensor was designed for the detection of hydrogen peroxide14. The incorporation of QDs into the polymer matrix results in the properties of both the QDs and polymers. The integration of inorganic QDs composed of metals and their oxides (II-VI) and halides (III-V) may also introduce novel functional properties into composite systems, which may open doors for new applications15–17.
Bulk MgO exhibits face-centered cubic crystals with rock-slat type of structure. Its (100) face is the most stable one. MgO compounds possess high melting (2800 0C) and boiling points (3200 0C)18. They have high bandgap values in the range of 6–7 eV19. It is used as an additive in refractory paints for the catalysis and remediation of toxic water. Ultra-fine powders are used as bactericides, absorbents, and disintegrators for toxic chemical agents. It is widely used as a scrubber for atmospheric pollutants such as NOx, SOx, and CO219. It works as an effective catalyst for the ozonation of dyes, phenols, and formaldehyde. MgO QDs are used for the decomposition of fluorinated and chlorinated compounds19. These unique properties of nanostructured MgO nanomaterials are attributed to their high specific area, high surface charge, and adsorption capabilities. Owing to their wide bandgap, they are widely used in electronic and photonic applications and can generate reactive oxygen species, such as O2− and · OH−, which have antibacterial properties20. It exhibits photocatalytic properties. The shape and characteristics of MgO vary depending on the synthesis route and the processing conditions. In this work, we have synthesized MgO QDs by the sol-gel method and doped them into PMMA to alter its optical and thermal properties and to study the effect of annealing time and composition.
Methodology
Preparation of MgO QDs
MgO QDs were synthesized using the sol-gel method. The different steps involved in the preparation of MgO QDs using the sol-gel method are illustrated in the flowchart in Fig. 1. We used magnesium acetate tetrahydrate [Mg(CH3COO)2.4H2O; 99.5% purity], oxalic acid dehydrate [(COOH)2.2H2O; 99.9% purity], and methanol [CH3OH; 99.9% purity] purchased from Avantor Performance Materials India Limited and SDFCL to synthesize MgO QDs. Ethanol (C2H5OH; 99.9% purity] was purchased from Changshu Hongsheng Fine Chemical Co., Ltd., to wash the precipitates. First, 50 g of M(CH3COO)2.4H2O was dissolved in 150 ml methanol by continuous stirring for 30 min using a magnetic stirrer at 800 RPM. Stirring was performed at room temperature. We maintained a pH of 5 by adding 1.0 M oxalic acid solution dropwise and stirring until the solution became clear. The mixture was further stirred until a white gel appeared. The solution was maintained at room temperature overnight to allow the gelation process to complete. The solution was then centrifuged at 4000 RPM in order to filter heavier MgO nanoparticles. The solution was then filtered and washed to 3–4 times with ethanol. The filtered precipitate was then stored at 200 0C for 24 h to remove water and other volatile organic contaminants. The dried product was then crushed using a mortar and pestle to produce a fine powder. We then dissolve the fine powder in deionized water and filter the solution using ultra-fine-mesh of nylon 25 mm 0.2 μm (AXIVA). The final powder was annealed at 550 0C for 06 h in a muffle furnace. We then obtained fine MgO quantum dots of nearly uniform size. MgO QDs have a high crystallinity.
Fig. 1.
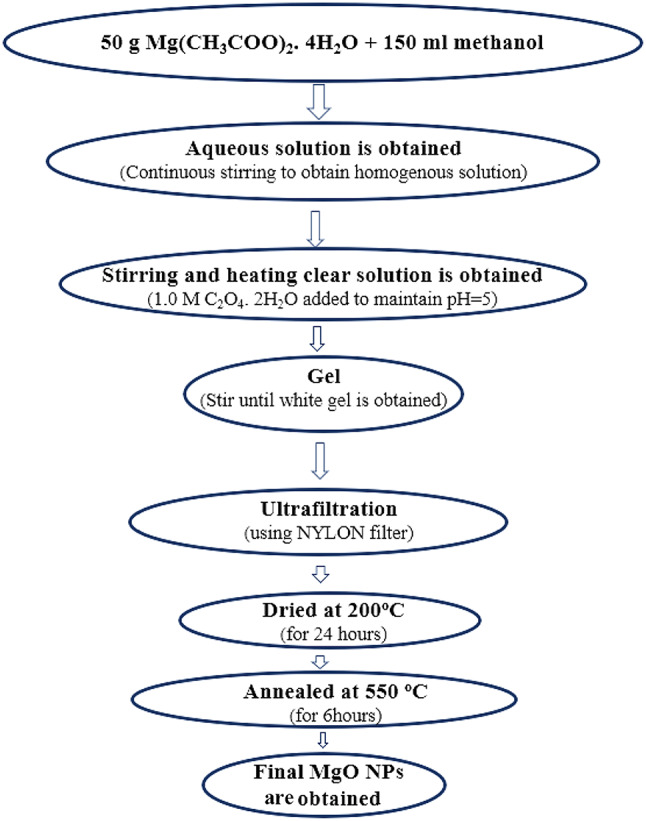
Shows schematic flowchart for preparing MgO QDs using sol-gel method.
Preparation of MgO QDs doped PMMA films
Composite membranes were synthesized using a solution-casting method. First, MgO QDs were mixed with 40 ml chloroform at different concentrations (5, 10, and 15 wt %) and ultrasonicated for 1 h. Subsequently, PMMA polymer (Avg. Molecular Weight 15000 with 99% purity) was added in appropriate amounts to the solution in the form of a salt to maintain the desired doping concentrations. The solution was stirred at 300 RPM at room temperature for 3 h to completely dissolve PMMA, forming a homogenous solution. The solution was then cast over a mercury column kept in a Petri dish overnight, the chloroform was evaporated, and a composite film was formed. A mercury column in a glass Petri dish was used to maintain a uniform thickness of the PMMA film. Finally, the dried films were peeled off the mercury surface to obtain self-standing membranes. The thickness of the pure film after annealing for 4 h at 130 0C was found to be approximately 80–90 μm, which falls to 40–50 μm after annealing for 28 h. The thicknesses of the other films were also within this range.
Results and discussions
The glass transition temperature of pure PMMA has been found to be close to 102 0C, which may vary up to 10–15 0C upon doping with metals and their oxide QDs, depending on the dopant concentration21–23. The annealing temperature of the nanocomposite films as 130 0C for two reasons: We wish to skip over its glass-transition temperature as well as ensure that the film degradation does not start. This allowed for a safer temperature window of 20–30 0C only. The glass transition temperature is an important parameter when films are exposed to heat to study the effects of annealing. The variations in films subjected to annealing below the glass transition temperature can yield unpredictable results, as metastable states trapping molecules within it may form. To observe smooth molecular-scale variations and kinetic changes within the film, the film must be heated above the glass transition temperature. Now, we discuss our results with an emphasis on correlating the internal molecular-scale changes with the observed physical quantities one by one.
High resolution X-Ray diffraction (HR-XRD) analysis
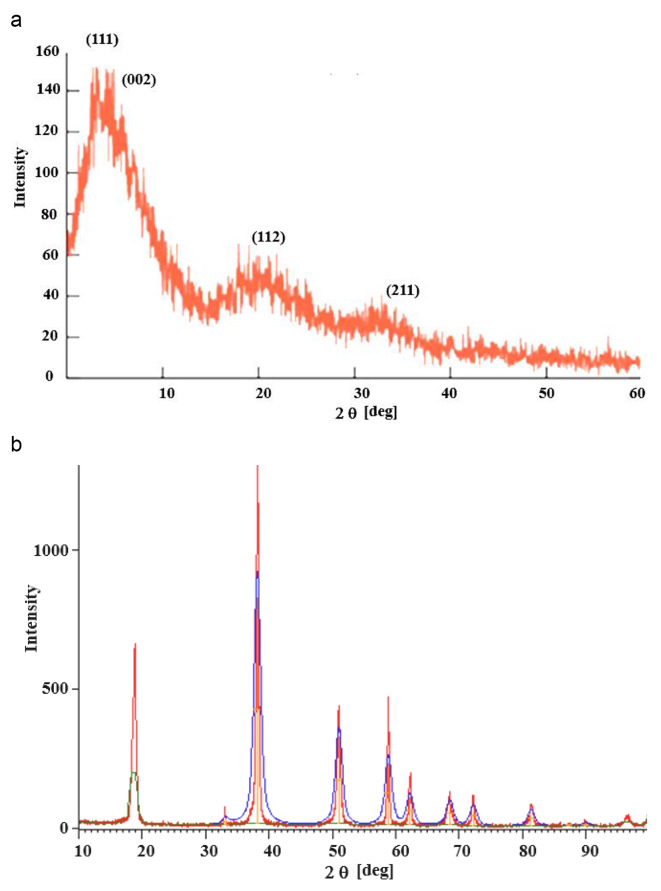
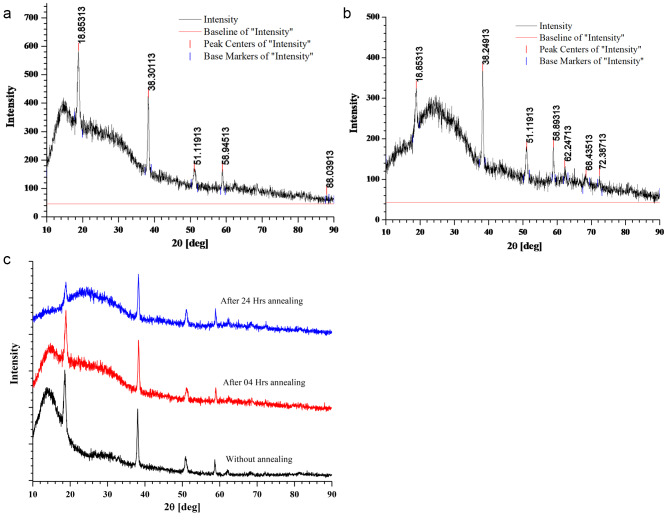
We have obtained HR-XRD data using obtained using Rigaku SmartLab 9 kW Powder type (without χcradle) with a HyPix-3000 high-energy-resolution X-ray machine. Figure 2(a) depicts the X-ray diffractions of the pure PMMA film. Pure PMMA has a dominating and broad peak with a maximum at 2θ = 08.20°, as well as a broad but low-intensity peak at 21° and 33°. The amorphous nature of the polymer is indicated by the large diffuse peaks. The peaks arise at 2 θ: 08.20°, 09.25°, 21.04°, and 33.0° correspond to the diffraction patterns of the (111), (002), (112), and (211)23. The XRD data of the pure MgO QDs are shown in Fig. 2 (b)24. The XRD data were compared with a normal JCPDS (card no. 89-7746) file, which confirmed the production of a cubic structure. The XRD data confirmed the highly crystalline nature of the samples. The polycrystalline cubic phase of MgO QDs is confirmed by the sharp peaks detected at 38.1312°, 50.9804°, 58.793°, 72.196°, and 81.2994°, which can be referred to as the (111), (200), (220), (311), and (222) crystal planes, respectively. Using the Scherrer formula, we obtained MgO QDs sizes in the range of 7.0603–9.5647 nm. We have observed the temperature effect upon the crystallinity of the MgO doped PMMA thin film. If the nanocrystals are free from defects and microstrains, the peak broadening depends only upon crystallite sizes and diffractometer characteristics. Assuming the ideal condition, we have used Scherrer formula to calculate the crystallite size of MgO QDs. Crystallinity of the material is calculated by using formula-.
Fig. 2.
XRD of (a) pure PMMA thin film and (b) pure MgO QDs. Figures are reproduced with permission from references20] and [21.
 |
1 |
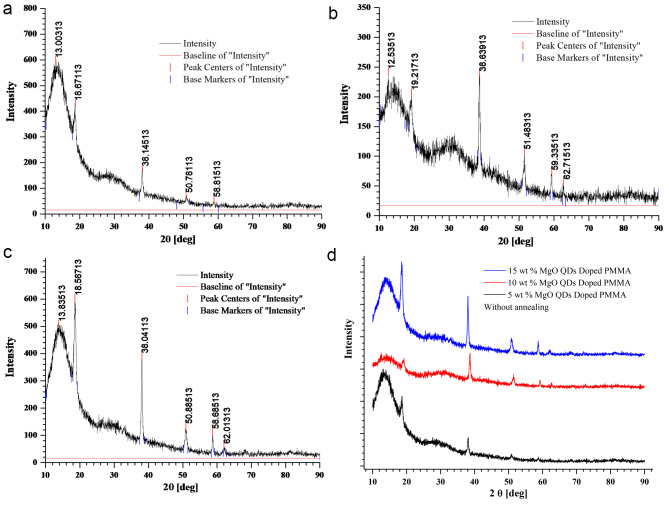
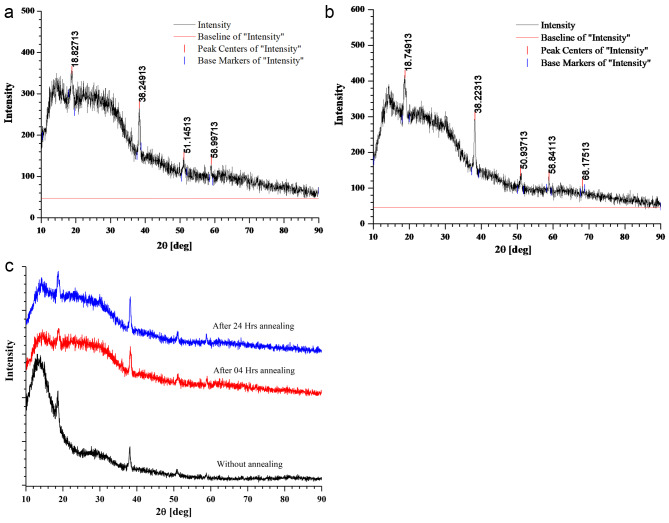
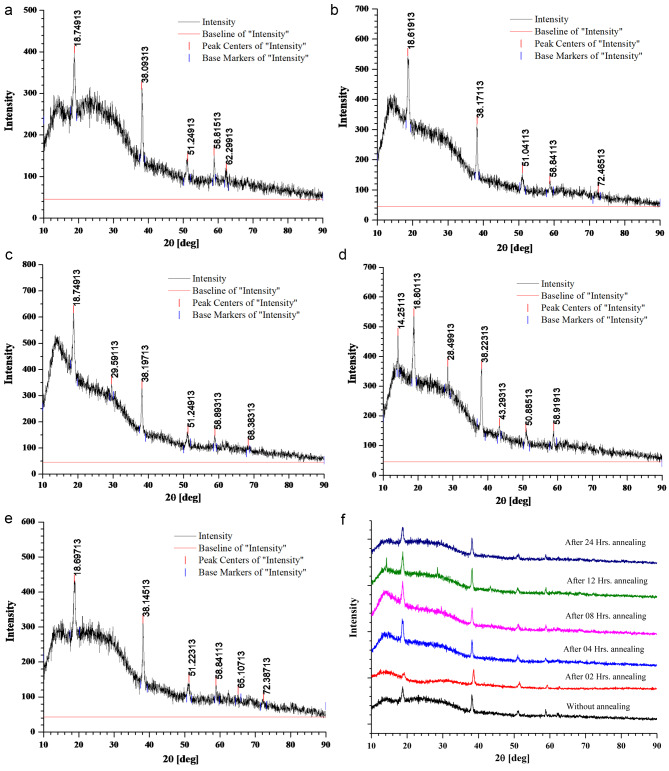
The area of the crystalline peaks was calculated using the original software, and the data are presented in Table 1. In the initial phase of annealing of the 5 wt % MgO NP-doped PMMA film, the crystallinity drastically decreased upon heating at 130 °C owing to the limited diffusion of PMMA beads. The HR-XRD spectra of pure PMMA without annealing for 5, 10, and 15 wt % MgO QD-doped PMMA are presented in Fig. 3. (a) (b) and (c). The combined graph for PMMA doped with 5, 10, and 15 wt% MgO QDs doped PMMA are presented in Fig. 3 (d).The MgO QDs were dispersed in the PMMA matrix; therefore, the peaks corresponding to the MgO QDs were not pronounced. After 04 h of annealing, the crystallinity falls from 48.63 to 8.78% Fig. 4 (a). The crystallinity of the hybrid PMMA film again improves with increasing annealing time as the MgO QDs and the polymer film get more time to reorganize. Thus, the hybrid film was found to undergo restructuring and modification. The MgO QDs tended to agglomerate, which in turn enhanced the overall crystallinity of the hybrid film. The interaction of the PMMA beads with the MgO QDs provides stability to films, but a larger size of the MgO QDs or its higher concentration locally may tear the PMMA film, forming its particulates. The annealing time, composition of the film and annealing temperature are the key parameters for maintaining the molecular scale balance inside the film. Agglomeration and a greater number of QDs in PMMA locally cause damage to the film upon annealing. In the 5 wt % film, the crystallinity of the composite film was slightly improved to a higher value of 12.49% when the film was subjected to 24 h of annealing at 130 0C Fig. 4(b). To show the annealing effect, a combined graph for 5 wt % MgO QD-doped PMMA is presented in Fig. 4(c).The appearance of the peaks corresponding to the MgO QDs improved with increasing annealing time, which confirms their diffusion and agglomeration. In the case of 10 wt % MgO QDs, the crystallinity decreased from 37.56 to 11.91% after annealing for 04 h Fig. 5 (a). Similar reasons can be accounted for in the case of 5 wt %. Owing to the diffusion of MgO QDs and their agglomeration, crystallinity is increased; however, owing to their enhanced surface area, these QDs may gather more muscle to form PMMA particulates. While tearing inside the films may decrease crystallinity, making the film more amorphous in nature, the particulates and larger clusters of MgO QDs improve the crystallinity of the hybrid film. Thus, the overall crystallinity of the hybrid film is the cumulative influence of all these competing factors. The crystallinity in the 10 wt % sample further decreased to 10.99% after annealing for 08 h Fig. 5(b). The crystallinity gradually improved to 14.46% and 19.56% after annealing for 12 h Fig. 5(c), 16 h Fig. 5(d), and 24 h Fig. 5(e), respectively. To compare the annealing effects in different cases, a combined graph for PMMA doped with 10 wt % MgO QDs doped PMMA are presented in Fig. 5(f).This can be understood and explained on the basis of the delicate balance between key parameters such as annealing hours, doping concentration of MgO QDs and their sizes, etc., and agglomeration of MgO QDs and formation of PMMA particulates. The effect of annealing time in the case of 10 wt % doping is relatively more pronounced in comparison to the case of 5 wt % MgO NP-doped PMMA film as a direct consequence of the higher concentration of MgO QDs. The overall crystallinity of 15 wt % MgO NP doped PMMA decreased from 49.19 to 13.84% after 04 h of annealing Fig. 6 (a), which is slightly improved to 15.37% after annealing for 24 h Fig. 6(b). To show the annealing effect, a combined graph for the 15 wt % MgO QD-doped PMMA is presented in Fig. 6(c).Thus, we find specific trends in all three cases that are more similar to each other. These results are consistent with those of previous researchers25–27.Annealing for longer hours may further improve the quality of the films or slightly degrade it, depending on the critical and delicate balance between the key parameters discussed above. This cumulative effect resulted in the formation of a hybrid film with lower free energies.
Table 1.
Variation in crystallinity with annealing hours for different PMMA samples.
| S. No. | Sample Details MgO@PMMA Nanocomposites |
Annealing Hours | Crystallinity (in Percentage) |
|---|---|---|---|
| 1. | 5wt% MgO doped PMMA | 00 | 48.6339 |
| 2. | 02 | 8.7806 | |
| 3. | 24 | 12.4989 | |
| 4. | 10wt% MgO doped PMMA | 00 | 37.5646 |
| 5. | 02 | 11.9129 | |
| 6. | 04 | 10.9886 | |
| 7. | 08 | 14.4636 | |
| 8. | 12 | 19.5582 | |
| 9. | 24 | 15.5985 | |
| 10. | 15wt% MgO doped PMMA | 00 | 49.1870 |
| 11. | 04 | 13.8362 | |
| 12. | 24 | 15.3727 |
Fig. 3.
HR-XRD plots for (a) 5 wt% (b) 10 wt %, and (c) 15 wt % doped PMMA films without annealing and (d) the combined graph for all three.
Fig. 4.
HR-XRD plots for 5 wt % MgO NP doped PMMA film after annealing for (a) 04 h and (b) 24 h, and (c) comparative graph.
Fig. 5.
HR-XRD plots for 10 wt % MgO NP doped PMMA film after annealing for (a) 02 h, (b) 04 h, (c) 08 h, (d) 12 h (e) 24 h, and (f) the comparative graph.
Fig. 6.
HR-XRD plots for 15 wt % MgO NP doped PMMA film after annealing for (a) 04 h (b) 24 h, and (c) the comparative graph.
FTIR Spectroscopy
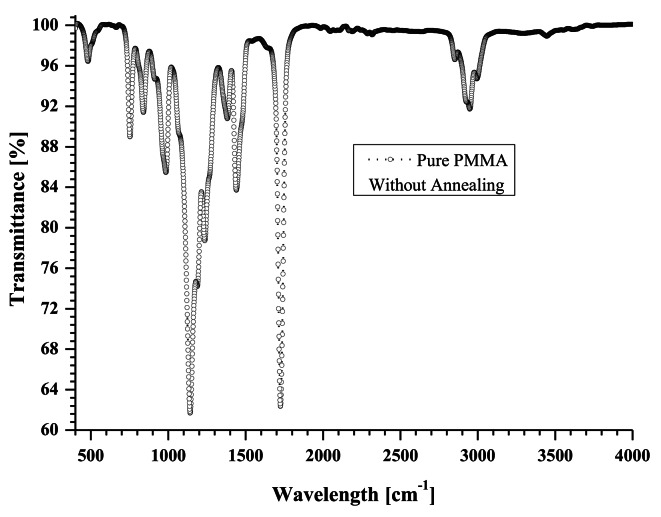
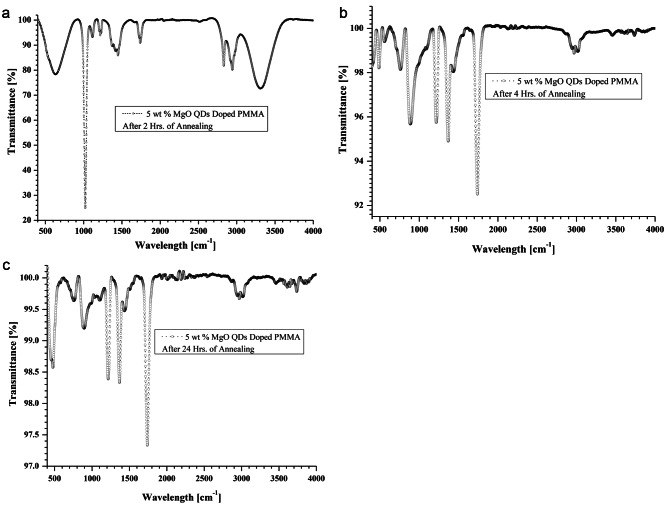
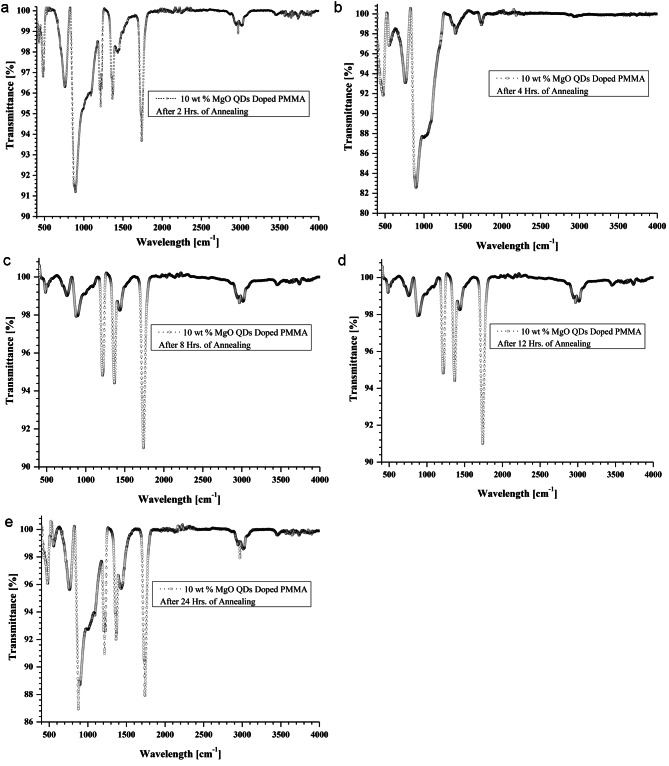
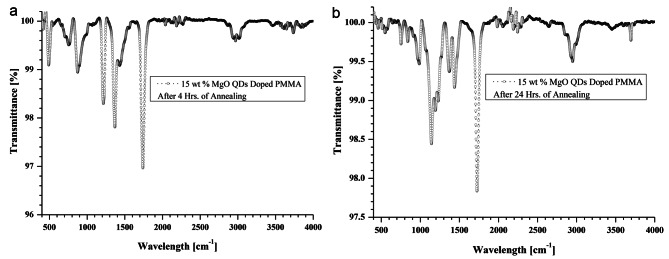
FTIR spectra are observed using ShimadazuIRSprirt FTIR-8000 apparatus. FTIR spectra of MgO doped PMMA thin films are shown in Fig. 7.for pure PMMA, Fig. 8 for 5 wt % MgO QDs doped PMMA, Fig. 9 for 10 wt % MgO QDs doped PMMA, and Fig. 10 for 15 wt % MgO QDs doped PMMA films. Dominant peaks were observed in the transmission mode in the wavelength range of 400 cm− 1− 4000 cm− 1. FTIR spectra of the 5wt% MgO-doped PMMA thin films without annealing are shown in Fig. 7. The prominent peaks are listed in Table 2. The vibrational band located near 667 cm− 1 can be attributed to C-O vibrations. The band near 753 cm− 1 can be attributed to the vibration mode of C-H8. The vibrational band near 1213 cm− 1 is credited to C–O bond stretching. The band close to 1726 cm− 1 can be assigned to the stretching modes of carbonyl groups (C = O)8,28. A broad band was observed near 2950 cm− 1. This is due to the C-H and O-H stretching vibrations, as shown in Fig. 7. The peaks observed between 1142 cm− 1 and 1237 cm− 1 were assigned to C-O bond stretching. The peaks observed close to 1725 cm− 1 and 1595 cm− 1 were attributed to the stretching of C = O and C = C bonds, respectively. The peaks appearing in the range of 1382–1441 cm− 1 are associated with the vibration modes of -CH3 and -CH2. The bands in the range of 2800–3100 cm− 1 correspond to different CH3 and CH2 vibration modes9. Additionally, peaks close to 1368.68 cm− 1 and 1216.50 cm− 1 suggest the presence of -OH groups, indicating potential interactions with moisture or other hydroxyl-containing species28–31. It can be observed that the transmission intensities corresponding to these vibrations generally fall in the later stages of annealing because of the removal of non-volatile impurities. Notably, the appearance of peaks near 875.12 cm− 1(Mg-O-Mg) and 484.88 cm− 1(Mg-O) provide clear evidence of the incorporation of magnesium oxide (MgO) as a dopant28. We observed pronounced transmission intensity peaks near these wavelengths in the case of MgO QDs doping. The wavelengths corresponding to these transmission peaks shift owing to exposure to heat, causing deformation and reorganization. The Mg-O-Mg peak signifies the stretching vibration of Mg-O bonds, whereas the Mg-O peak represents bending vibrations, confirming the successful integration of MgO into the PMMA matrix. The annealing process may influence the arrangement of MgO within the thin film, thereby affecting its structural characteristics and interactions. This FTIR analysis sheds light on the distinctive vibrational modes associated with both PMMA and MgO in MgO-doped PMMA thin films. The FTIR spectra of the 5wt% MgO-doped PMMA thin films shown in Figs. 8, 9 and 10, reveal noteworthy changes in the vibrational modes. Peaks near 2970.15 cm− 1 indicate the presence of -CH stretching vibrations, which are characteristic of the methyl groups in PMMA32. The C = O stretching vibrations near 1740.13 cm− 1 persist, affirming the PMMA matrix. Hydroxyl groups were still evident, as observed at 1368.69 cm− 1 and 1216.80 cm− 1. It should be noted that an annealing temperature of 130 0C is not sufficient to completely remove volatile impurities, and merely increasing the annealing time cannot help one out. Importantly, MgO-related peaks at 887.55 cm− 1(Mg-O-Mg) and 488.18 cm− 1 (Mg-O) persisted, demonstrating the resilience of the MgO dopant after annealing. Additionally, the appearance of a peak near 761.92 cm− 1 indicates C-H bending vibrations, suggesting alterations in the polymer molecular structure due to the annealing process. Thus, FTIR analysis performed at different annealing times provides insights into the evolution of vibrational modes, which confirm the thermal stability of MgO within the PMMA thin film and highlight the structural changes induced by the annealing effect. After 24 h annealing period, the FTIR spectra of the MgO-doped PMMA thin films exhibited distinctive changes in the vibrational modes. The C = O stretching vibrations at 1740.14 cm− 1 persist, indicative of the PMMA matrix. Notably, the hydroxyl groups’ peaks at 1368.01 cm− 1 and 1216.10 cm− 1 are still present, suggesting that interactions with water or hydroxyl-containing species endure after the extended annealing process. The MgO-related peak at 476.92 cm− 1 (Mg-O) remained, emphasizing the robustness of the MgO dopant even after prolonged annealing. The observed FTIR peaks provide valuable information about the stability of the MgO-doped PMMA thin film and its molecular characteristics following extended thermal treatment, laying the groundwork for understanding the evolution of the material’s internal structures under annealing conditions. After doping with 5 wt %, 10 wt%, and 15 wt% MgO in PMMA, shifts in the positions of the peaks as well as in their intensities can be observed in Table 2, owing to intermolecular bonding between PMMA and MgO QDs.
Fig. 7.
Shows FTIR spectra of pure PMMA without annealing.
Fig. 8.
Shows FTIR spectra of 5 wt% MgO doped thin PMMA film (a) after 02 h of annealing (b) after 04 h of annealing and (c) after 24 h of annealing, respectively.
Fig. 9.
Shows FTIR spectra of 10 wt% MgO doped thin PMMA film (a) after 02 h of annealing (b) after 04 h of annealing and (c) after 08 h of annealing (d) after 12 h of annealing and (e) after 24 h of annealing, respectively.
Fig. 10.
Shows FTIR spectra of 15 wt% MgO doped thin PMMA film (a) 04 h of annealing and (c) after 24 h of annealing, respectively.
Table 2.
Shows positions of the intense peaks in FTIR spectra of pure PMMA and MgO QDs doped PMMA without and during annealing.
| S. No. |
Sample Composition |
I-1 | I-2 | I-3 | I-4 | I-5 | I-6 | I-7 | I-8 | I-9 | |
|---|---|---|---|---|---|---|---|---|---|---|---|
| 1. | Pure PMMA without annealing |
2948.97 (91.73%) (-CH) |
1725.88 (62.34%) (C = O) |
1440.69 (83.72%) (CH3 bending) |
1382.58 (90.27%) (-OH) |
1236.68 (78.71%) 1142.07 (61.69%) (-OH) |
985.01 (85.47%) 840.36 (91.40%) (Mg-O-Mg) |
753.22 (88.98%) (C-H) |
481.45 (96.44%) |
||
| 2. | 5.0wt % MgO NP doped PMMA | After 2 h Annealing |
2943.70 (80.03%) (-CH) |
1739.18 (90.62%) (C = O) |
1459.31 (86.13%) (CH3 bending) |
1368.68 (88.98%) (-OH) |
1213.29 (93.47%) (-OH) |
1019.94 (24.86%) (Mg-O-Mg) |
484.88 (99.23%) (Mg-O) |
||
| After 4 h annealing |
2970.15 (98.88%) (-CH) |
1740.13 (92.51%) (C = O) |
1368.69 (94.90%) (-OH) |
1216.80 (95.74%) (-OH) |
887.55 (95.68%) (Mg-O-Mg) |
761.92 (98.14%) (C-H) |
488.18 (98.21%) (Mg-O) |
||||
| After 24 h annealing |
2968.74 (99.65%) (-CH) |
1740.14 (97.33%) (C = O) |
1368.01 (98.33%) (-OH) |
1216.10 (98.39%) (-OH) |
892.69 (99.18%) (Mg-O-Mg) |
759.55 (99.62%) (C-H) |
476.92 (98.57%) (Mg-O) |
||||
| 3. | 10.0wt % MgO NP doped PMMA | After 2 h Annealing |
2976.80 (98.84%) (-CH) |
1739.18 (93.64%) (C = O) |
1439.75 (97.92%) (CH3 bending) |
1220.06 (95.31%) (-OH) |
1228.76 (94.06%); 1216.94 (92.90%) (-OH) |
893.54 (91.13%) (Mg-O-Mg) |
760.38 (96.28%) (C-H) |
481.25 (96.76%) (Mg-O) |
|
| After 4 h annealing |
1739.59 (98.90%) (C = O) |
1406.62 (98.02%) (CH3 bending) |
897.72 (82.59%) (Mg-O-Mg) |
551.20 (96.83%) (C-H) |
475.28 (91.80%) (Mg-O) |
||||||
| After 08 h annealing |
2970.28 (98.64%) (-CH) |
1739.18 (90.92%) (C = O) |
1368.31 (94.41%) (-OH) |
1216.66 (94.81%) (-OH) |
878.20 (97.92%) (Mg-O-Mg) |
759.24 (99.01%) (C-H) |
485.29 (99.00%) (Mg-O) |
||||
| After 12 h annealing |
2970.18 (98.8%) (-CH) |
1740.11 (91.70%) (C = O) |
1368.28 (94.8%) (-OH) |
1216,75 (95.12%) (-OH) |
885.92 (97.86%) (Mg-O-Mg) |
759.55 (98.96%) (C-H) |
486.48 (99.19%) (Mg-O) |
||||
| After 24 h annealing |
2970.41 (97.92%) (-CH) |
1738.58 (87.92%) (C = O) |
1434.88 (95.70%) (CH3 bending) |
1365.78 (91.99%) (-OH) |
1228.54 (92.62%) 1216.89 (90.96%) (-OH) |
877.77 (86.93%) (Mg-O-Mg) |
763.08 (95.62%) (C-H) |
558.85 (98.79%) (C-H) |
478.90 (96.07%) (Mg-O) |
||
| 4. | 15.0wt % MgO NP doped PMMA | After 4 h annealing |
2970.03 (99.57%) (-CH) |
1740.20 (96.96%) (C = O) |
1439.75 (95.07%) (CH3 bending) |
1366.02 (97.80%) (CH3 bending) |
1216,38 (98.29%) (-OH) |
874.39 (98.94%) (Mg-O-Mg) |
763.38 (99.47%) (C-H) |
491.18 (99.09%) (Mg-O) |
|
| After 24 h annealing |
2950.0 (99.50%) (-CH) |
1725.86 (97.84%) (C = O) |
1437.48 (99.17%) (CH3 bending) |
1399.3 (99.2%) 1367.8 (99.4%) (-OH) |
1142.49 (98.44%) (-OH) |
989.73 (99.4%) (Mg-O-Mg) |
841.78 (99.7%) (C-H) |
751.37 (99.6%) (C-H) |
454.17 (99.90%) (Mg-O) |
||
Fluorescence spectroscopic analysis
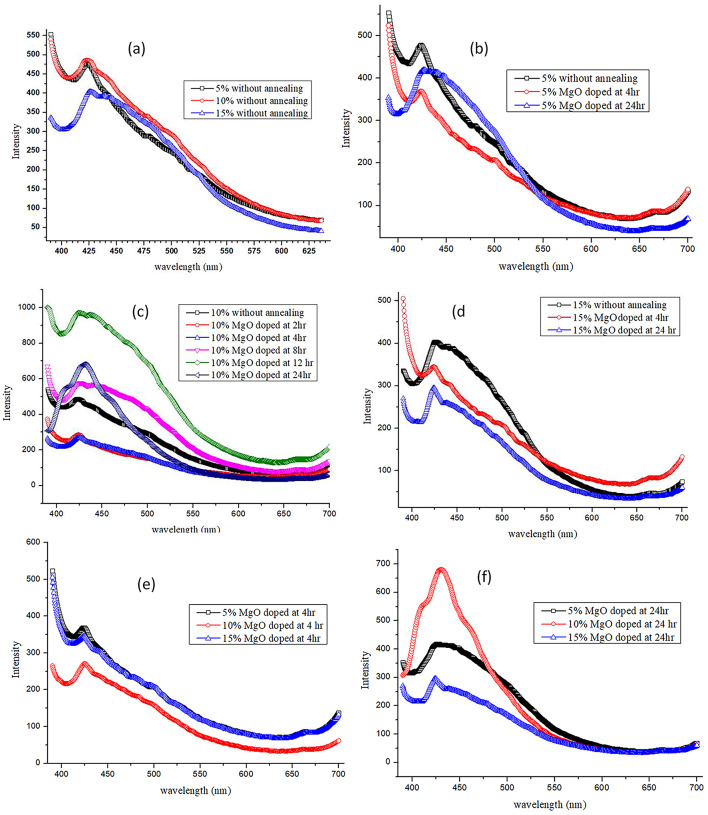
The fluorescence spectrum for a pure PMMA film does not exist because it is in the form of a uniform film and does not possess any crystallites or nanoaggregates. Because MgO possesses permanent dipole moments, its dipoles produce fluorescence. When radiation is incident, its molecular arrangement is disturbed, leading to a small change in its dipole moment. The molecule then moved to the excited state. Energy is released and the molecular arrangement is retained. Particulate matter, particularly nanosized particles, shows distinct peaks in their fluorescence spectra. We observed the fluorescence spectra for different compositions of MgO NP-doped PMMA films Fig. 11 (a)–(f). Figure 11 (a) shows the fluorescence spectra of PMMA films doped with 5, 10, and 15 wt % MgO QDs without annealing. Diffuse peaks occur near 430 nm for all three concentrations, but a gradually descending long plateau after the maxima of the diffused peak were formed. For the 10 wt % MgO NP-doped PMMA film, the maximum intensity was slightly higher, indicating that the overall crystallinity was better in this case. The reason behind the origin of diffused peaks with a gradually descending plateau due to anchoring on MgO QDs is that the PMMA film is broken into small nanosized PMMA particulates, which also contributes to the intensity of the fluorescence spectra, which does not appear in the pure bulk case of PMMA films. The spectrum corresponding to the 15 wt % MgO NP-doped PMMA film showed relatively poor crystallinity compared to the 5 wt % and 10 wt % samples. We studied the effect of the concentration of MgO QDs as well as that of annealing time. The films were annealed for 4, 8, 12, and 24 h at 130 0C to explore the underlying structural modifications in the hybrid system. The information hidden in the FTIR spectra serves as a tool to understand the internal modifications due to the physiochemical interactions of the MgO QDs with the PMMA films. Figure 11 (b) shows the fluorescence spectra of the 5 wt % doped PMMA films without annealing, after annealing for 4 h, and after annealing for 24 h. We observed that the intensity after annealing for 04 h falls and then increased when the film was annealed for 24 h. This clearly indicates that internal structural changes and modifications occur in the film due to annealing. The film softens when it is placed at a high temperature below its melting point. The annealing temperature was chosen to be 130 °C, which is above the glass temperature of the bulk pure PMMA film. The hybrid system tends to reorganize itself to minimize its free energy by finding new pathways, for example, by local ordering and restructuring itself, and by forming particulates of PMMA anchored over MgO QDs and supported by them. These molecular-scale events show a non-trivial dependence on the composition and annealing hours. Figure 11 (c) shows the effect of the annealing time on the 10 wt % MgO NP-doped PMMA film. The highest peak is observed for the original hybrid film without annealing. The fluorescence peaks fell drastically after annealing for two hours and a small diffuse peak emerged from the nearly flat line. This clearly indicates that annealing causes homogenous dispersion of MgO QDs throughout the film, supporting the bulk structure of the PMMA film, rather than forming particulates of the PMMA films in close proximity to the QDs because of their mutual attraction. This behavior remained almost the same for annealing for 04 h. The maximum intensity of the fluorescence spectra occurs for the sample annealed for 12 h, confirming the contribution of the PMMA particulates anchored over the MgO QDs surface and vice versa. Furthermore, the diffusion of MgO QDs may help them form larger QDs aggregates, resulting in a better fluorescence yield. Modification of the MgO QD-doped PMMA films was confirmed from the fluorescence spectra obtained after annealing the samples for 8 and 12 h. The spectra obtained for the cases of 8 h and 12 h annealing represent intermediate phases. A relatively narrow and sharp peak was observed for the sample annealed for 24 h. This clearly indicates the agglomeration of the dispersed MgO QDs, forming larger aggregates. Larger MgO NP aggregates gain more muscle to tear the PMMA film, forming PMMA particulates owing to the adhering properties of its surface. This phenomenological process yielded a higher intensity with a relatively narrow peak. The formation of larger nanoaggregates of MgO QDs due to annealing was also confirmed from the HR-XRD data. The intensities of the peaks increased with annealing time, but the particle size of the MgO QDs remained more or less unchanged. The MgO QDs formed aggregates, yielding high intensity without any significant variations in the sizes of the MgO QDs. Since, the sizes estimated are a result of cumulative average of QDs having different sizes, significant variations are not observed, when sizes of MgO QDs are calculated using Scherrer formula, though SEM images clearly show and confirm formation of relatively much larger size QDs. The background noise is also suppressed owing to the formation of larger aggregates of MgO QDs as the number of active anchoring sites is reduced, which serve as active sites forming PMMA particulates of different sizes. Figure 11 (d) represents the fluorescence spectra of PMMA film doped with 15 wt % MgO QDs. We observe that the highest intensity is in the case of the original sample that was not annealed. The hybrid films annealed for 4 and 24 h indicate the dispersion of MgO QDs and the formation of PMMA particulates anchored over the MgO NP surface, as discussed earlier. The intensities decrease for the cases of 4 h and 24 h annealing, although the relative areas under the two curves are relatively smaller. This indicates that the crystallinity is increased because of the formation of PMMA particulates rather than the aggregation of MgO QDs for which the peak has been assigned. When we compared the fluorescence spectra of 5 wt %, 10 wt %, and 15 wt % annealed for 04 h, we observed that the highest intensity occurred for the 5 wt % MgO NP-doped PMMA film Fig. 11 (e). The 15 wt % composition case closely followed the case with 5 wt %. The curve corresponding to the 10 wt% sample indicates the formation of MgO QDs aggregates. In this case, the peak had a relatively higher intensity. A narrower and clearer peak was observed at approximately 430 nm. The curve also suggests that less noise is produced owing to the formation of PMMA particulates. The maximum contribution comes from the MgO QDs. No such distinct peak appears in case of 5 wt % and 15 wt % MgO NP doped films, which have also been subjected to annealing for 24 h Fig. 11 (f). The intensities in these two cases are found to be lower than the case of 10 wt % MgO NP doped PMMA film. The distinct high intensity narrower peak indicates for the aggregation of MgO QDs and formation of their clusters, which cumulatively result into high yield Fig. 11 (f).
Fig. 11.
(a-f) Shows comparison of fluorescence spectra for different compositions and annealing time.
UV-vis-nir analysis
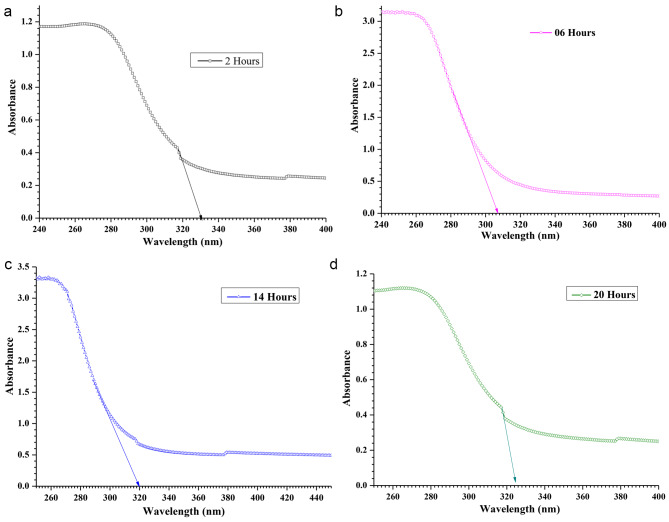
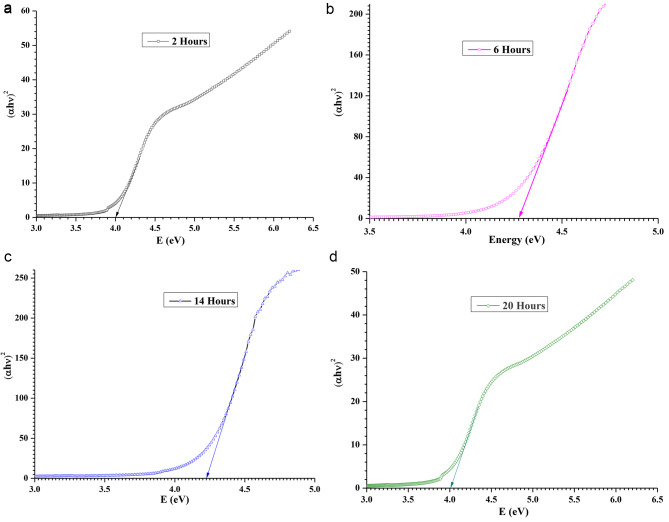
We performed UV-vis-NIR characterization of pure and MgO QDs doped PMMA samples. The UV-vis-vir data are of vital importance as the absorption edge wavelengths provide bandgap values. We obtained bandgap values using both the absorption edge wavelengths and Tauc plots. The bandgap values of pure PMMA and MgO@PMMA composites, without annealing and after annealing for 02, 06, 14, and 20 h, are presented in Table 3. The bandgap values obtained using the absorption edge method and Tauc plots were found to be in close agreement. The bandgap values can provide very good insights into the internal molecular structures, as they are a direct consequence of the size, shape, and composition of the nanostructures formed inside the MgO@PMMA nanocomposites. We plotted absorbance against wavelength as shown in Fig. 12 for the case of the 10 wt % doped PMMA film. Figure 12 (a), (b), (c), and (d) are plotted for PMMA doped with 10 wt% MgO QDs without annealing and after annealing for 2, 6, 14, and 20 h, respectively. The absorption edge wavelength The values of bandgaps for pure PMMA, 5 wt% MgO QDs doped PMMA, 10 wt % MgO QDs doped PMMA and 15 wt% MgO QDs doped PMMA are found to be 5.45 eV, 5.26 eV, 5.42 eV and 5.23 eV, respectively. The bandgap values of the MgO@PMMA nanocomposite increased with increasing doping concentration of MgO QDs, with the exception of the 10wt % doping case. Higher metal-oxide QDs are expected to yield relatively lower bandgap values owing to their conducting properties. The bandgap values for the pure PMMA film after annealing for 2, 6, 14, and 20 h were 4.06 eV, 4.25 eV, 4.30 eV and 4.27 eV, respectively. This trend indicates that the crystalline behavior improves with an annealing time of up to 14 h. Heating after 14 h may slightly deform the crystalline behavior, resulting in a slight increase in the bandgap of the MgO@PMMA nanocomposite, as in the case of annealing for 20 h. The bandgap values of 5 wt % MgO QDs doped PMMA are found to be 4.18 eV, 4.30 eV, 4:31 eV and 4.01 eV. The bandgap values increased with increasing annealing time up to 14 h. This indicates the dispersion of MgO QDs in the PMMA matrix. Smaller QDs have higher bandgaps. Annealing for a longer duration (20 h) yielded significantly lower values. This can be attributed to the better crystallinity of the Mgo@PMMA film, as well as the formation of larger nano-sized aggregates of MgO QDs embedded in the PMMA film. The dispersion of MgO QDs is followed by a self-aggregation process, referred to as nucleation. Furthermore, the PMMA, when annealed, interplays with the MgO QDs and adhere to their surface. It has been found that the adherence of PMMA on QDs seems to improve the mechanical and thermal and mechanical stability of QDs doped PMMA films2. Although PMMA adheres to the MgO QDs surface weakly and vice versa, this process plays an intermediate role in the entire physical process during annealing. The cumulative effect of weak particle-particle interactions can play major roles in some cases. The bandgap values for 10 wt % MgO QDs doped PMMA hybrid systems annealed for 2, 6, 14 and 20 h are found the be 4.00 eV, 4.28 eV, 4.22 eV and 4.00 eV, respectively. Because higher concentrations of MgO QDs resulted in a more dispersed phase of MgO QDs embedded in the PMMA film, the dispersion phase of the MgO QDs switched off after 6 h of annealing. The bandgap values increases from 4.0 eV to 4.28 eV. The bandgap value after annealing for 14 h leads to 4.22 eV, which further falls 4.00 eV. This indicates larger aggregates of MgO QDs as well as better crystallinity of the MgO@PMMA composite. This can be further explained by the formation of nanocrystalline particulates of PMMA adhering to the MgO QDs surface and vice versa. In the case of the 15 wt % MgO QD-doped PMMA film, the opposite trend was observed. The bandgap values for 15 wt % MgO QDs doped PMMA films annealed for 2, 6, 14 and 20 h are found to be 4.33 eV, 4.03 eV, 3.92 eV and 3.98 eV, respectively. A higher concentration of 15 wt % MgO QDs yielded a relatively lower bandgap value, as is evident for the MgO@PMMA nanocomposites without annealing. The bandgap values further decreases to 4.03 eV and 3.92 eV upon annealing for 6 and 14 h, respectively. This indicates that the MgO QDs formed nanoclusters owing to the diffusion of MgO QDs in the PMMA film, yielding lower bandgap values. As discussed earlier, this process is followed by the formation of PMMA nanoparticles that adhere to the MgO QDs surfaces. There is a gradual rise from 3.92 eV to 3.98 eV after annealing for 20 h. This indicates further modification and reorganization of the PMMA thin films. Representative Tauc plots are shown in Fig. 13 (a), (b), (c), and (d) for 10 wt % MgO QD-doped PMMA films annealed for 2, 6, 14, and 20 h, respectively. We have analyzed UV-vis-NIR and Tauc plots to obtain bandgap values, as given in Table 3, although all of these plots are not presented for the sake of brevity. Only the 10 wt% MgO QD-doped PMMA cases are shown to illustrate the process of the calculations. It is clear from the above discussion that pure PMMA and MgO QD-doped PMMA (5 wt%, 10wt%, 15wt% MgO@PMMA) have bandgaps in the range of insulators. Owing to annealing and re-crystallization and molecular scale restructuring inside the PMMA films, the bandgap values of nanocomposite films vary in the range of 3.92 to 4.41 eV, which fall into the category of wide bandgap semiconductors opposite to the case of pure PMMA film.
Table 3.
Shows bandgap values evaluated from edge wavelength and tauc plots of pure PMMA and MgO QDs doped PMMA without and during annealing.
| S. No. | Sample Details MgO@PMMA Nanocomposites |
Annealing Hours | Edge Wavelength λ (nm) |
Bandgap (eV)
|
Bandgap (eV) [Tauc Plot] |
Urbach Energy eV |
|---|---|---|---|---|---|---|
| 1. | Pure PMMA | 00 | 240 | 5.17 | 5.45 | -- |
| 2. | 5wt% MgO doped PMMA | 00 | 243 | 5.10 | 5.26 | 2.13 |
| 3. | 10wt% MgO doped PMMA | 00 | 250 | 4.96 | 5.42 | 1.89 |
| 4. | 15wt% MgO doped PMMA | 00 | 241 | 5.14 | 5.23 | -- |
| 5. | Pure PMMA | 02 | 324 | 3.83 | 4.06 | 0.43 |
| 6. | Pure PMMA | 06 | 312 | 3.97 | 4.25 | 0.40 |
| 7. | Pure PMMA | 14 | 310 | 4.00 | 4.30 | 0.34 |
| 8. | Pure PMMA | 20 | 312 | 3.97 | 4.27 | 0.29 |
| 9. | 5wt% MgO doped PMMA | 02 | 318 | 3.90 | 4.18 | 0.38 |
| 10. | 5wt% MgO doped PMMA | 06 | 308 | 4.03 | 4.30 | 0.41 |
| 11. | 5wt% MgO doped PMMA | 14 | 310 | 4.00 | 4.31 | 0.39 |
| 12. | 5wt% MgO doped PMMA | 20 | 332 | 3.73 | 4.01 | 0.44 |
| 13. | 10wt% MgO doped PMMA | 02 | 330 | 3.76 | 4.00 | 0.44 |
| 14. | 10wt% MgO doped PMMA | 06 | 308 | 4.03 | 4.28 | 0.34 |
| 15. | 10wt% MgO doped PMMA | 14 | 320 | 3.87 | 4.22 | 0.41 |
| 16. | 10wt% MgO doped PMMA | 20 | 324 | 3.83 | 4.00 | 0.47 |
| 17. | 15wt% MgO doped PMMA | 02 | 308 | 4.03 | 4.33 | 0.46 |
| 18. | 15wt% MgO doped PMMA | 06 | 334 | 3.71 | 4.03 | 0.59 |
| 19. | 15wt% MgO doped PMMA | 14 | 336 | 3.69 | 3.92 | 0.61 |
| 20. | 15wt% MgO doped PMMA | 20 | 330 | 3.76 | 3.98 | 0.46 |
Fig. 12.
Shows UV-vis-nir spectra of 10 wt % MgO@ PMMA films after annealing for (a) 02 h (b) 06 h (c) 14 h and (d) 20 h, respectively.
Fig. 13.
Shows Tauc plots for 10 wt % MgO@ PMMA film after annealing for (a) 02 h (b) 06 h (c) 14 h and (d) 20 h, respectively.
Urbach Energy Calculations
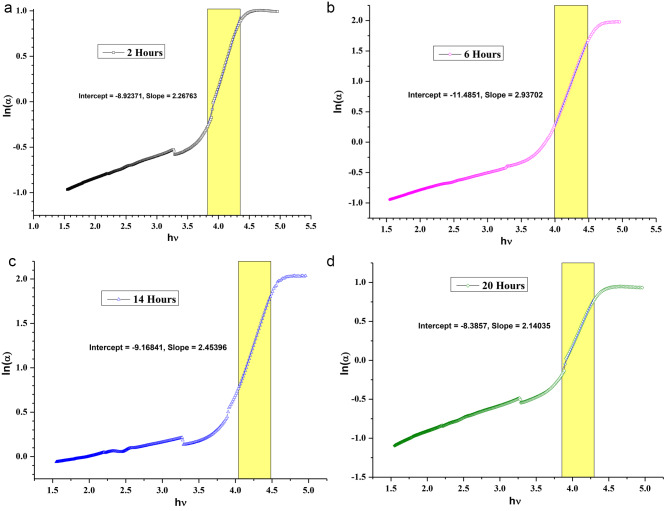
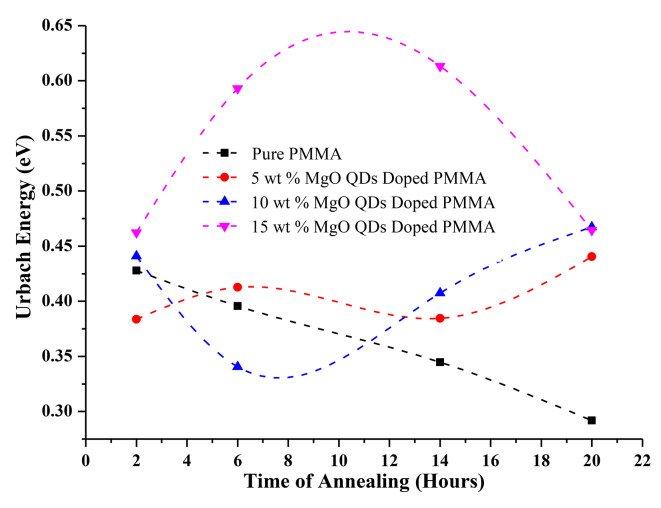
The Urbach energy is a measure of the localized density of states extended into the bandgap region, owing to the presence of defects, impurities, and non-crystalline energy. Urbach energy was obtained by plotting ln(α) against hv8. The slope of the curve in the linear region gives the value of the Urbach energy (Fig. 14 (a), (b), (c), and (d), respectively, for 10 wt% annealed for 02, 06, 14, and 20 h. The increase in the Urbach energy indicates the presence of defects and impurities. Dopants are also considered to be impurities. In the case of the MgO@PMMA film, the Urbach energy contribution comes from the reorganization of MgO QDs embedded in the PMMA film as well as from the re-crystallization of the PMMA film. We observed a higher value of Urbach energy for the 15 wt % MgO QD-doped PMMA film Table 3. The Urbach energy is plotted against annealing hours for different doping concentrations of MgO QDs: 0 wt %, 5 wt %, 10 wt%, and 15 wt% Fig. 15. The maximum Urbach energy of 0.61 eV is obtained for 15 wt % MgO QD-doped PMMA film annealed for 14 h. Figure 15 clearly shows the molecular-scale restructuring and recrystallization process of the MgO-doped PMMA nanocomposite films. The Urbach energies gradually and monotonically fall from 0.43 eV after 2 h annealing to 0.29 eV after 20 h of annealing for the case of pure PMMA film. This confirms that the presence of defects decreases partly due to the re-crystallization of the pure PMMA film, mainly due to the removal of contaminants in the form of water or other volatile molecules within and from the film surface. Since the bandgap values gradually increases from 4.06 eV to 4.30/4.27 eV, the decrease in Urbach energy can be mainly accounted on the basis of removal of water and other volatile molecules present in the form of impurity or contaminants. In the case of the 5 wt% MgO-doped PMMA film, the Urbach energy shows a slight oscillatory behavior, which indicates the competing effect of the dispersion of MgO QDs followed by the formation of MgO QDs clusters and recrystallization of the PMMA film, as well as the removal of water and other volatile contaminants. Structural disorder, crystal imperfection, defect concentration, and passivation at the surface contribute to the Urbach energy. The greater their presence, the greater is the Urbach energy. Because crystallization improves the quantity of the film by reducing crystal imperfections and defects, it reduces the value of the Urbach energy. The oscillatory behavior of the 5 wt% MgO–QD-doped PMMA film indicates the commutative influence of these factors. We observe that the Urbach energy in the case of 10 wt% doped PMMA film first decreases with annealing time and then increases Fig. 15. Thus, we infer that in the initial stages of annealing, water and other volatile molecules were removed from the surface. The dispersion of MgO QDs slightly deformed the crystal structure, yielding slightly higher bandgap values for annealing times of up to 14 h. The bandgap value again drop to 4.0 eV which indicating that the crystallinity of the composite film improved and MgO nanoclusters were formed, yielding a lower bandgap value. The 15wt% MgO@PMMA nanocomposite showed the opposite trend to that of the 10 wt% case. Despite the fact that the overall bandgap values indicate a better crystalline behavior of the hybrid film of 15 wt% MgO QD-doped PMMA film annealed for 14 h, the corresponding Urbach energy increases drastically, and The Urbach energies of 10 wt% and 15 wt% MgO QD-doped PMMA are very close to each other after the film is annealed for 20 h. The higher Urbach energy in the case of 15 wt% MgO-doped PMMA can be attributed to the higher doping concentration of the MgO QDs. The contribution of the MgO QDs overwhelms the crystallization and other reducing effects because of their exceedingly high concentrations. The absorption caused by the MgO QDs plays a dominant role in this case. Interestingly, the HR-XRD data suggest that the bandgap values increased upon annealing the pure PMMA sample, and the Urbach energy monotonically decreased. The presence of contaminants, defects, and deformation of the PMMA crystal structure due to annealing contribute to the Urbach energy. The deformation sites created by annealing may lead to the formation of dangling bonds in structurally disordered semiconductors, thereby increasing the Urbach energy value. Since there is no MgO QDs doping in the case of the pure PMMA film, a significant decrease in Urbach energy can be attributed to the removal of contaminants in the form of volatile molecules such as water and organic solvents (here, chloroform) used as precursors in making the film. This is clearly evident and reflected from the bandgap values as well in the XRD spectra of the pure PMMA samples without annealing and those after annealing. A careful analysis of the HR-XRD spectra for the 5 wt %, 10 wt %, and 15 wt % MgO QD-doped PMMA films indicated that the crystallinity drastically decreased when the samples were annealed in comparison to the samples that did not undergo any annealing. After annealing for a few hours (say 8–14 h), the overall crystallinity improved slightly. This is because in all cases of annealing, the crystalline MgO@PMMA film underwent dispersion of MgO QDs, which deformed the PMMA composite films. The gradual improvement in the overall crystallinity of the films at later stages can be attributed to the formation of MgO nanoclusters, as larger MgO QDs have lower bandgap values. Although the presence of MgO QDs is far too small, the effect of changes in the confinement of electrons in MgO QDs due to size variations and anchoring of polymer molecules on their surface significantly alters the bandgap values at later stages (see Table 3).
Fig. 14.
Shows ln (α) vs. hν plot for 10 wt % MgO@PMMA films after annealing for (a) 02 h (b) 06 h (c) 14 h and (d) 20 h, respectively. The Urbach energy is calculated from the shaded region. The steep variations indicate for lower Urbach energy. Urabach energy is obtained by taking inverse of the slope.
Fig. 15.
Shows Urbach Energy vs., annealing hours for pure and 5 wt %, 10 wt % and 15 wt % MgO@PMMA.
Raman Spectroscopic Analysis
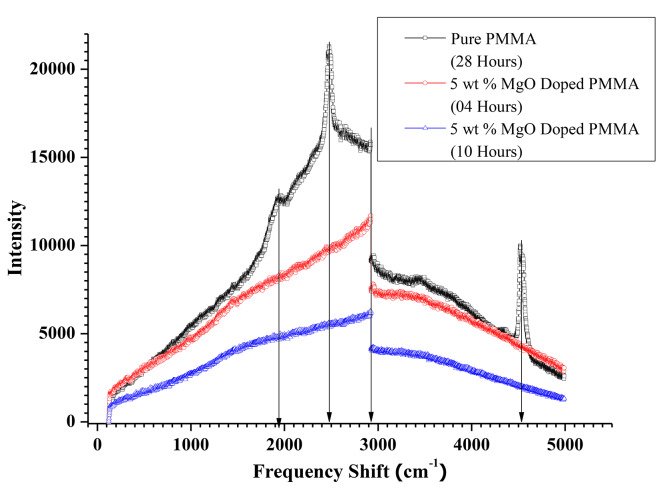
Figure 16 shows the Raman spectra of the pure PMMA film after annealing for 28 h and those of the 5 wt % MgO QD-doped PMMA films annealed for 04 and 08 h. In the case of the pure PMMA film annealed for 28 h, we observed four distinct peaks at frequency shifts of 1950 cm− 1, 2500 cm− 1, 2950 cm− 1 and 4550 cm− 1. The emergence of these sharp peaks with a broader background signal indicates that the film underwent a local recrystallization process. Annealing at 130 0C leaves the other parts of the film in the stranded semi-crystalline phase. This can be attributed to the intrinsic properties of these polymers. Beads in all polymers initially diffuse locally when subjected to heat, especially at lower temperatures. If the temperature is maintained sufficiently high, especially close to the melting point, the entire chain moves. Because we maintained the annealing temperature at a relatively low value of 130 0C, the polymer underwent local segmental movements. The limited diffusion of the beads can lead to local crystallization, yielding sharp and distinct peaks. The peaks indicate that the film gradually modifies its crystalline nature locally, whereas the majority of the films remain in the energetically stranded phase away from its semi-crystalline phase as a result of the reconciliation between molecular forces. Temperature plays an important role as it facilitates the entire process of deformation and modifications inside the films, driving the hybrid system towards the minimization of free energy. The peaks at 2950 cm− 1 were predominantly found to be present in all the studies, which were assigned to the asymmetric bond stretching of the -CH3 group33. The frequency at 1950 cm− 1 corresponds to symmetric stretching of the -CH2 group. A string peak at 2500 cm− 1 in the case of pure PMMA films, between 1950 cm− 1 and 2950 cm− 1, may arise because of the superposition of the shifts in the latter two frequencies as annealing appears to cause folding of the polymer chains, bringing them closer to form nano- and micro-particulates of PMMA. This is also observed in the SEM images, as discussed in the next section. The Raman spectra also emphasize and affirm the inferences drawn above. The sharp distinct peak arising at 4550 cm− 1 may be attributed to the presence of hydroxyl groups present in the contact of silica glass34, since the films are supported by glass, and heating causes the film to adhere weakly to it.
Fig. 16.
Shows Raman spectra of pure PMMA after 28 h annealing and 5 wt % MgO QDs doped PMMA annealed for 04 and 10 h.
SEM analysis
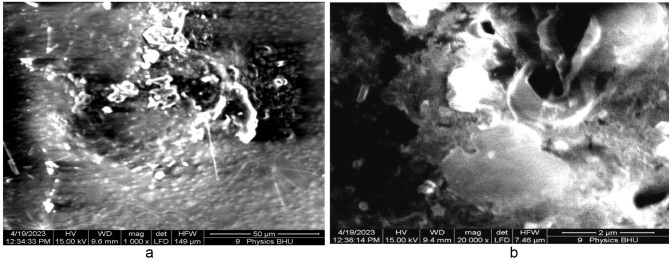
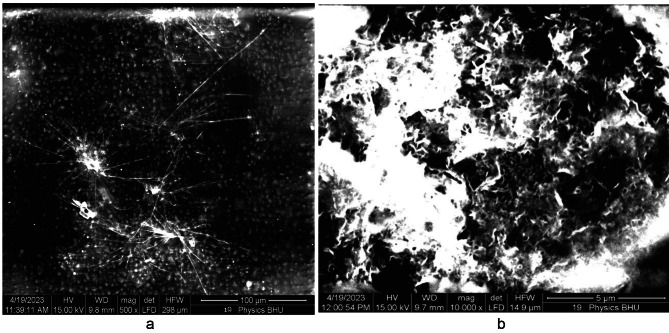
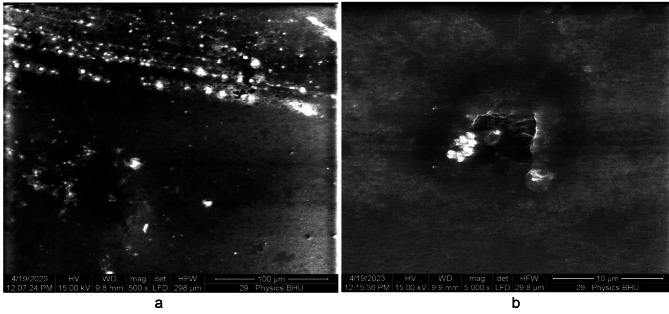
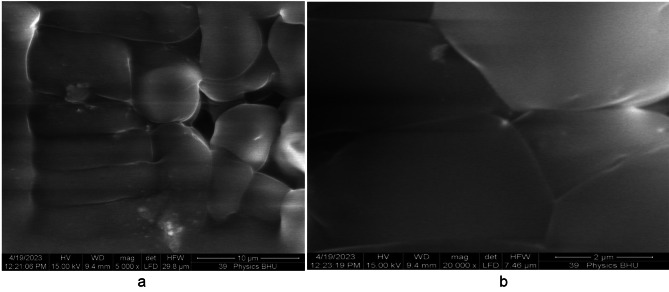
The SEM image of the pure PMMA film without annealing is shown in Fig. 17 (a). The white regions in the SEM image were produced because of the two regions in our case: 1. Because of the high reflection from MgO QDs and the presence of micropores, which produces no reflection at all, the electrons are reflected from the glass surface, which supports the film. Generally, dark regions indicate soft regions formed by PMMA, which allows for penetration to some extent. The reduced reflected intensity produces shaded regions, indicating the presence of the PMMA film. We observed white regions in the case of pure PMMA films, which can be attributed to the presence of micropores within the PMMA film in a definite manner. The morphologies of the shaded and dark regions clearly indicate the presence of a rough surface on the PMMA film. When the pure PMMA film was subjected to heating for 24 h at 130 0C, we observed quite smooth regions due to the modification of the surface by the annealing effect Fig. 17 (b), although we could still observe micropores of sizes extending up to one micron. Figure 18 (a) shows MgO QDs dispersed inside the PMMA film doped with 5 wt % MGO QDs annealed for 24 h. Micropores could still be identified in the bright regions. At higher resolutions, snow-flake-like microstructures formed inside the PMMA film Fig. 18 (b). Aggregation of MgO QDs was also observed. In the case of the 10 wt %-doped PMMA film annealed for 24 h, self-assembled MgO nanodots formed arrays. These MgO nanodots could be arranged at the grain boundaries and interface regions formed by PMMA Fig. 19 (a). We also observed a large, smooth PMMA film in which MgO QDs remained in the dispersed phase (low-contrast regions). Clustering of MgO QDs was also observed, indicating their nucleation within the PMMA film. The formation of microsized aggregates of MgO QDs can be clearly seen on an extended terrace of the PMMA film when observed at higher resolutions Fig. 19 (b). Interestingly, a completely different scenario was observed for the 15 wt % MgO–QD-doped PMMA film Fig. 20 (a) and (b).We observed particulates of PMMA extending up to a few microns in size. These particulates were separated by the interface regions and voids Fig. 20 (a). The smooth micron-sized regions indicate the formation of polycrystalline structures with micron-sized grains. But, this process could not improve the overall crystallinity to a reasonably high extent. This process also leads to the formation of large interface regions that serve as defect sites Fig. 20 (a). This may also produce voids within adjacent interfacial regions. Dangling bonds are formed at these interfaces, which effectively increases the bandgap. Aggregates of MgO QDs were also observed near these regions. The same observation can be made at higher resolutions, as shown in Fig. 20 (b).
Fig. 17.
Shows SEM image of pure PMMA film (a) without annealing and (b) after 24 h of annealing.
Fig. 18.
Shows SEM image of 5wt% MgO doped thin PMMA film after 24 h of annealing.
Fig. 19.
Shows SEM image of 10 wt% MgO doped thin PMMA film after 24 h of annealing.
Fig. 20.
Shows SEM image of 15 wt% MgO doped thin PMMA film after 24 h of annealing.
Thermogravimetric (TGA) analysis
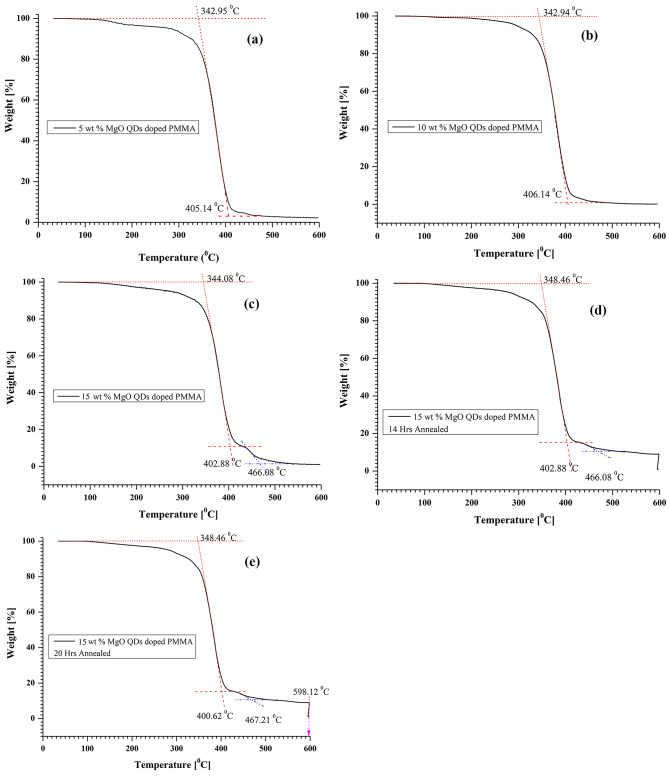
We performed TGA analysis for the 5 wt %, 10 wt %, and 15 wt % MgO QD-doped PMMA films at a heating rate of 200C/min. The MgO@PMMA nanocomposite films underwent two to three steps of weight loss owing to different physical processes. In the first step, the absorbed water and volatile traces absorbed in the sample are removed, and the second step of weight loss occurs because of the breakage of intra-and intermolecular chemical bonds. The thermal instability starts with the rupture of the end groups with unsaturated bonds at lower temperatures, ranging between 230 0C and 300 0C. Stronger bonds break away at relatively elevated temperatures of 300 0C or even higher35,36. Pure PMMA begins to degrade gradually at approximately 220 0C. Polymer degradation of 40–50% occurred in the temperature range of 220 0C to 270 0C. Subsequent heating from 300 0C to 400 0C, causes 100% degradation of the pure polymer35,36. TGA thermograms of 5 wt %, 10 wt %, and 15 wt % MgO QD-doped PMMA without annealing and 15 wt % MgO QD-doped PMMA nanocomposite films annealed for 14 h and 20 h are shown in Fig. 21 (a), (b), (c), (d), and (e), respectively. The first step causes approximately 20% weight loss owing to the release of adsorbed water and volatile molecules, for example, organic solvents. In the second step, the weight loss was increased from 20 to 80%. The first step is the onset at approximately 98 degree Celsius and ends at approximately 202 0C. The second step, followed by the first, ended at a temperature of approximately 300 0C. The onset and end temperatures of the different steps in all the cases are summarized in Table 4. Although we have performed all the experiments either at room temperature or at 130 0C, the thermograms recorded between 300 0 C and 600 0C, fully support and validate the ideas discussed in the earlier sections, as these provide further valuable insights into the chemical compositions and thermal instabilities of the MgO@PMMA nanocomposite films. The introduction of metal oxide QDs into PMMA films enhances the strength of the nanocomposite films owing to the physiochemical bonding density present in the polymer films36. Chemical bond density includes covalent bonds formed owing to the sharing of electrons as well as weaker non-bonding interactions. The latter includes ion-based interactions per unit of volume. The effect of chemical bond density is evident in our case studies. For higher doping concentrations such as 10 wt % and 15 wt %, the thermal degradation of PMMA starts at a relatively higher temperature, which means that MgO QDs are chemically bonded with the polymer chains and vice-versa. Increasing the concentration above 10 wt % yielded saturated bonding states with no further increase at the start of thermal degradation of the PMMA polymer. This stage also indicates that the covalently bonded interactions between the two species have already passed the non-bonding stage. A comparison of the TGA curves also indicates that higher concentrations of MgO QDs hold the polymer for a longer time or at relatively higher temperatures, as a third step appears evident from the kinks in the curves in Fig. 21. The TGA plots completely support our comments given in the justification of the variations in energy bandgaps, as well as in the Urbach energies. For more details on the quantitative changes in mass with temperature, the readers may see Annexure-1.
Fig. 21.
Shows thermograms of (a) 5 wt % MgO QDs doped PMMA (b) 10 wt % MgO QDs doped PMMA (c) 15 wt % MgO QDs doped PMMA without annealing (d) 15 wt % MgO QDs doped PMMA after 14 h of annealing and (e) 15 wt % MgO QDs doped PMMA after 20 h of annealing.
Table 4.
Variation in transition temperatures for various physiochemical processes associated with different compositions of MgO@ PMMA samples.
| S.No. | Sample Name | Annealing Hours | Transition Temperatures | ||
|---|---|---|---|---|---|
| T1 (0C) | T2 (0C) | T3 (0C) | |||
| 1 | 5 wt % MgO QDs Doped PMMA | 0 | 342.95 | 405.14 | --- |
| 2 | 10 wt % MgO QDs Doped PMMA | 0 | 342.94 | 406.14 | --- |
| 3 | 15 wt % MgO QDs Doped PMMA | 0 | 344.08 | 402.88 | 466.08 |
| 4 | 15 wt % MgO QDs Doped PMMA | 14 | 348.46 | 402.88 | 466.08 |
| 5 | 15 wt % MgO QDs Doped PMMA | 20 | 348.46 | 400.62 | 467.21 |
Conclusions
The results obtained using HR-XRD, FTIR, UV-vis-nir, Fluorescence, Raman and SEM spectroscopic methods clearly indicate molecular-scale re-organization in pure and MgO QD-doped PMMA films, which leads to local re-crystallization of the film. The dispersion of MgO QDs by limited diffusion and their agglomeration leads to the formation of larger spherical clusters of MgO QDs, which play an important role in determining the crystallinity of the hybrid films. Annealing at 130 0C, allows for limited diffusion of polymer beads, resulting in local-scale re-crystallization of the PMMA film. A higher concentration of MgO QDs results in the formation of nano-microscale PMMA particulates, but this does not improve the overall crystallinity of the film as interfaces and voids between crystallites are formed. This was also confirmed by the bandgap values obtained using UV-vis-NIR data. The bandgap values obtained using the edge wavelength and Tauc plots were found to be in close agreement, making the data highly reliable. The bandgap values and Urbach energies obtained for different compositions of the films annealed for different times clearly agree with each other and are found to be in close agreement with the theory. This analysis provides molecular-scale insights into the structural variations inside the film. The optoelectronic properties depend on the molecular-scale structural variations inside the films and correlate very well with the theory. Dispersed MgO QDs tended to diffuse locally and form larger spherical clusters. Anchoring of MgO QDs with the PMMA surface and vice-versa appears to provide thermal stability and mechanical strength to the nanocomposite films, as MgO QD-doped PMMA film appears to form nanometer-sized particulates of PMMA, as confirmed by FTIR and HR-XRD data analysis, as evident from the SEM images. In contrast, the overall crystallinity of the hybrid film drastically decreases because of the formation of boundaries, interfaces, and voids, which appears to overwhelm the entire process. However, the formation of larger nanoaggregates at later stages of annealing appeared to slightly improve the crystallinity of the film. Our estimation of the bandgap and Urbach energy calculations confirmed this. The scalability of the measurement of the crystallinity of the film from the nano-to-micro and micro-to-macro-scales requires more attention and phenomenal understanding. The micro-level understanding of phenomenology associated with the diffusion process of nanodots in a solid film atmosphere appears to be re-addressed and is technically important for ensuring the sustainability of such nanocomposites, which undergo a heating process. Size-induced phase transition (SIPT) is a new type of phenomenon that occurs when crystal sizes decrease below a critical value, for example, nanomaterials with grain sizes below 5 nm are found to be amorphous in nature37. X-ray diffraction analysis is generally valid for the size determination of nanocrystals; thus, it would provide inappropriate data if used for very small crystals. The crystallite size for crystals with sizes > 100 nm was not accurately determined as the peaks became very narrow. Nanocrystals prepared using different methods yielded particles of different shapes and sizes. Sizes generally varied in a single sample. The samples may have contained QDs with irregular shapes and sizes. Therefore, the use of computer algorithms and software is essential for finding a mean value38–40. Owing to differences in the technical definition of particle size, especially of irregular shapes, different methods and software may produce significantly different size data. Thus, particle size estimations are subject to the intrinsic properties of the crystals and depend on the analytical tools and software used to determine it. Various methods have been used to analyze the XRD data in last hundred years, of which Scherrer Eq. (1918/1920), Williamson-Hall method (1942) and Warren-Averbach (1949/1950) have been the most popular ones37. The broadening of the diffraction lines also arises for instrumental reasons, for example, the instrumental broadening depends on the breadth of the X-ray source, axial divergence of the X-ray beams, and use of one or more diffraction lines. X-ray diffractometers have built-in software to deconvolute the instrumental broadening of diffraction lines. Although our work does not focus on any of the issues discussed above, we believe that the qualitative inferences drawn using the data obtained from the latest version of the X-ray machine are qualitatively unambiguous. Quantitative descriptions may vary slightly depending on the use of different methods and algorithms. Although published reports41 suggest that MgO QDs undergo coarsening at temperatures as low as 970 0C (i.e., one-third of their melting point of bulk magnesium oxide), our work reveals the onset of MgO QDs even at a much lower temperature of 130 0C. The melting points of QDs fall drastically when sizes reduce below 10–15 nm, because of the relatively easy cleavage of the surface atoms, which have unsaturated bonds. Last, but not the least, this work also reports and highlights the unique QDs organization in a relatively viscous media or say nearly solid. As far as the quantum nature of forces is concerned, this work also indicates a unique energy-dissipation mechanism of charge carriers in QDs via overlapping with long-range dispersion forces. Although the nucleation process and organization of quantum dots have been known from the past decade, this kind of physical process at high temperatures has not yet been reported to the best of the author’s knowledge. The molecular-scale fundamental understanding of high-temperature quantum dot correlations needs to be explored further. The existence of many-one quantum dipole appears to be a remote possibility, because of the existence of such molecular interactions and their interplay resulting into unique re-organizations of QDs. The first author of this work reported some clues in a model with a binary mixture with a conserved case, in which the spatial correlations in a mesoscopic cell have shown unique oscillatory behavior due to long-range correlations partially owing to the formation of small domains but at relatively very low temperatures42,43. We hope that this work will provide valuable insights into the tailored crystalline and optoelectronic properties of MgO@PMMA nanocomposites, which are necessary for making sustainable cutting-edge devices.
Electronic supplementary material
Below is the link to the electronic supplementary material.
Acknowledgements
Acknowledgements: Authors are thankful to Dr. K. Awasthi, Soft Matter Physics Laboratory, MNIT, Jaipur, India and Prof. A. K. Singh, Department of Physics, BHU, Varansi, UP, India for extending support to the work. They are thankful to CIF IIT(BHU), Varansi, India for providing XRD and SEM data and MRC, MNIT, Jaipur, India for providing fluorescence, FTIR and UV-vis-nir data. They are thankful to School of Advanced Sciences, VIT, Vellore, India for providing TGA data.
Author contributions
Satya Pal Singh: Dr. Singh has proposed and conceptualized the work . He has written the original manuscript , reviewed, proofread and edited the manuscript. He has performed experiment and has done formal analysis of the data acquired from different centers for material characterizations in India and paid for availing the characterization services. He has plotted all curves excluding HR-XRD. Dr. Singh has analyzed the data and has validated the ideas.Archana Kumari Singh: Dr. Archana Singh has partially performed experiment with Dr. Singh and has performed analysis of HR-XRD data to quantify crystallization in films under supervision of Dr. Satya Pal Singh. She has partially contributed to the analysis of the of the data and writing of the original manuscript.Suraj Vishwakarma: Suraj has helped Dr. Satya Pal Singh to acquire characterization data and partially plotted fluorescence spectra and helped in its analysis and presentations.
Data availability
“Data is provided within the manuscript or supplementary information files”.
Declarations
Competing interests
The authors declare no competing interests.
Footnotes
Publisher’s note
Springer Nature remains neutral with regard to jurisdictional claims in published maps and institutional affiliations.
Suraj Vishwakarma is Contributing author.
References
- 1.Rachid, H. et al. Polymer composite materials: a comprehensive review. Compos. Struct.262, 113640 (2021). [Google Scholar]
- 2.Lijun et al. Effect of strain rate and temperature on the mechanical behavior of polymethyl methacrylate (PMMA). Polym. Bull.80, 8685–8702 (2023). [Google Scholar]
- 3.Laura, S. et al. Biocompatible metal-oxide QDs: nanotechnology improvement of conventional prosthetic acrylic resins. J. Nanomaterials 2011 Article Id941561, 10.1155/2011/941561
- 4.Christine, R. et al. Spatially-resolved in-situ/operando structural study of screen-printed BaTiO3/P(VDF-TrFE) flexible piezoelectric device. Sens. Actuators: Phys.377, 115738 (2024). [Google Scholar]
- 5.El-Zaher, N. A. et al. Thermal and structural analyses of PMMA/TiO2 QDs composites. Nat. Sci.6, 859–870 (2014). [Google Scholar]
- 6.Das, A. et al. QDs induced morphology modulation in spin coated PS/PMMA blend thin films. Langmuir36 (50), 15270–15282 (2020). [DOI] [PubMed] [Google Scholar]
- 7.Saso, G. et al. Nanocomposites comprised of homogenously dispersed magnetic iron-oxide QDs and poly(methyl methacrylate). Beilstein J. Nanotechnol.9, 1613–1622 (2018). [DOI] [PMC free article] [PubMed] [Google Scholar]
- 8.Ahmad, A. et al. Synthesis and characterization of polymeric (PMMA-PVA) hybrid thin films doped with TiO2 QDs using dip-coating technique. Crystals11, 99 (2021). [Google Scholar]
- 9.Al-Bataineh, Q. M. et al. Optical characterizations of PMMA/metal oxide QDs thin films: bandgap engineering using a novel derived model. Heliyon, 7, e05952, 2021, 10.1016/j.heliyon.2021.e05952 [DOI] [PMC free article] [PubMed]
- 10.Lewis, S. et al. Surface characterization of poly(methylmethacrylate) based nanocomposite thin films containing Al2O3 and TiO2 QDs. Thin Solid Films. 518 (1), 2683–2687 (2010). [Google Scholar]
- 11.Askirka, V., Miluski, P. & Kochanowicz, M. A spiropyron doped poly(methyl methacrylate) matrix for sensor applications. Electronics12, 4497. 10.3390/electronics12244997 (2023). [Google Scholar]
- 12.Ning Gao, Z., Mu & Li, J. Palladium QDs doped polymer microfiber functioned as a hydrogen probe. Int. J. Hydrog. Energy. 44, 14085–14091 (2019). [Google Scholar]
- 13.Hong, J. et al. A highly sensitive hydrogen sensor with gas selectivity using a PMMA membrane-coated pd QDs/Single-Layer GrapheneHybrid. ACS Appl. Mater. Interfaces. 7, 3554–3561 (2015). [DOI] [PubMed] [Google Scholar]
- 14.Carbone, G. G. et al. A silver QDs-poly(methyl methacrylate) based colorimetric sensor for the detection of hydrogen peroxide. Heliyon 5:e02887, 2019, 10.1016/j.heliyon.2019.e02887 [DOI] [PMC free article] [PubMed]
- 15.Guo, Y. & Moffitt, M. G. Smart self-assembled quantum dots regulate and stabilize structure in phase-separated polymer blends. Chem. Mater.19, 6581–6587 (2007). [Google Scholar]
- 16.Lyly Nyl, I. et al. Influence of doping concentration on dielectric, optical, and morphological properties of PMMA thin films, Advances in Materials Science and Engineering, Article Id.605673, 2012, (2012). 10.1155/2012/605673
- 17.Shanghua et al. Nanocomposites of polymer and inorganic QDs for optical and magnetic applications. Nano Reviews. 1 (5214). 10.3402/nano.v1i0.5214 (2010). [DOI] [PMC free article] [PubMed]
- 18.Selvam et al. A biodegradable silver oxide-treated hydroxyapatite QDs (AgO@HA)-interlaced poly(etherimide)/poly(methylmethacrylate) membrane for blood purification: an in vitro study. Mater. Adv.3, 4667–4683 (2022). [Google Scholar]
- 19.Diana, C., Prado, I., Fernández, Jorge, E. & Rodríguez-Páez MgO nanostructures: synthesis, characterization and tentative mechanisms of QDs formation. Nano-Structures Nano-Objects. 23, 100482 (2020). [Google Scholar]
- 20.Todan, L. et al. Comparative study of MgO Nanopowders prepared by different chemical methods. Gels9 (8), 624. 10.3390/gels9080624 (2023). [DOI] [PMC free article] [PubMed] [Google Scholar]
- 21.Hajduk, B. et al. Thermal and optical propertiesof PMMA films reinforcedwith Nb2O5 QDs. Sci. Rep.11, 22531 (2021). [DOI] [PMC free article] [PubMed] [Google Scholar]
- 22.Dallas, P. et al. Synthesis, characterization and thermalproperties of polymer/magnetite nanocomposites. Nanotechnology17, 2046–2053 (2006). [Google Scholar]
- 23.Rameshkumar, C., Sarojini, S. & Subalaskhmi, R. Preparation and characterization of pristine PMMA and PVDF thin Film using solution casting process for Optoelectronic devices. J. Surf. Sci. Technol.33 (1–2), 12–18 (2017). [Google Scholar]
- 24.Singh, A. K. & Singh, S. P. Formation of nano and micro scale hierarchical structures in MgO and ZnO quantum dots doped LCmedia: the role of competitive forces. Condens. Matter Phys.26 (4), 43602: 1–22. 10.5488/CMP.26.43602 (2023). [Google Scholar]
- 25.Mohammed, M. I. Controlling the optical properties and analyzing mechanical, dielectric characteristics of MgO doped (PVA–PVP) blend by altering the doping content for multifunctional microelectronic devices. Opt. Mater. ,133,2022,112916, 10.1016/j.optmat.2022.112916
- 26.Horti, N. C. et al. Investigation of Structural, Optical and Mechanical properties of Poly (methyl methacrylate) / zirconium oxide (PMMA / ZrO2) nanocomposite films, 1–26. (2024).
- 27.Kumari, S. et al. Fabrication, structural, and enhanced mechanical behavior of MgO substituted PMMA composites for dental applications. Sci. Rep. 1–20. 10.1038/s41598-024-52202-4 (2024). [DOI] [PMC free article] [PubMed]
- 28.Balamurugan, S. R. A. et al. V.S. and, a Development and Spectral Characterization of Poly(Methyl Methacrylate) /Hydroxyapatite Composite for Biomedical Applications, Trends Biomater. Artif. Organs. 18 41–45. (2004).
- 29.Ahmed, R. M. Optical study on poly(methyl methacrylate)/poly(vinyl acetate) blends. Int. J. Photoenergy. 200910.1155/2009/150389 (2009).
- 30.El-Bashir, S. M. et al. Improving photostability and efficiency of polymeric luminescent solar concentrators by PMMA/MgO nanohybrid coatings. Int. J. Green. Energy. 14, 270–278. 10.1080/15435075.2016.1233422 (2017). [Google Scholar]
- 31.Raghavendra, M., Lalithamba, H. S., Sharath, B. S. & Rajanaika, H. Synthesis of Nα-protected formamides from amino acids using MgO nano catalyst: study of molecular docking and antibacterial activity. Sci. Iran.24, 3002–3013. 10.24200/sci.2017.4491 (2017). [Google Scholar]
- 32.Aziz, S. B., Abdullah, O. G., Hussein, A. M. & Ahmed, H. M. From insulating PMMA polymer to conjugated double bond behavior: Green chemistry as a novel approach to fabricate small band gap polymers. Polym. (Basel). 9, 1–15. 10.3390/polym9110626 (2017). [DOI] [PMC free article] [PubMed] [Google Scholar]
- 33.Chen, J. et al. The glass-transition temperature of supported PMMA thin films with hydrogen bond/plasmonic interface. Polymer11, 601. 10.3390/polym11040601 (2019). [DOI] [PMC free article] [PubMed] [Google Scholar]
- 34.Malfait, W. J. The 4500 cm– 1infrared absorption band in hydrous aluminosilicate glasses in a combination band of the fundamental)Si, Al)-OH and O-H vibrations. Am. Mineral.94, 849–852 (2009). [Google Scholar]
- 35.Chen, Y. H. H. C. Y. The effect of end groups on the thermal degradation of poly (methyl methacrylate). Polym. Degrad. Stab.82, 81–88 (2003). [Google Scholar]
- 36.Qais, M. et al. Optical characterizations of PMMA/metal oxide QDs thin films: bandgap engineering using a novel derived model. Heliyon7, e05952 (2021). [DOI] [PMC free article] [PubMed] [Google Scholar]
- 37.Paweł, E. & Tomaszewski The uncertainty in the grain size calculation from X-ray diffraction data. Phase Transitions: Multinational J.86, 2–3 (2013). [Google Scholar]
- 38.Uvarov, V. & Popov, I. Metrological characterization of X-ray diffraction methods for determination of crystallite size in nano-scale materials. Mater. Charact.58, 883–891 (2007). [Google Scholar]
- 39.Uvarov, V. & Popov, I. Metrological characterization of X-ray diffraction methods at different acquisition geometries for determination of crystallite size in nano-scale materials. Mater. Charact.85, 111–123 (2013). [Google Scholar]
- 40.Uvarov, V. & Popov, I. An estimation of the correctness of XRD results obtained from the analysis of materials with bimodal crystallite size distribution. CrystEngComm17, 8300–8306 (2015). [Google Scholar]
- 41.S., Kleiman, R. & Chaim Thermal stability of MgO QDs. Mater. Lett.61, 4489–4491 (2007).
- 42.Singh, S. P. & Theory, S. A common RupturingMechanism in Spinodal Dewetting and Surface Directed phase separation (some Technological aspects: spatial correlations and the significance of Dipole-Quadrupole Interaction in Spinodal Dewetting), advances in condensed Matter Physics. Article ID. 526397, 14. 10.1155/2011/526397 (Volume 2011).
- 43.Singh, S. P. Spatial correlation in 2D and 3D thin films of conserved binary mixtures in the presence of wetting of substrates by the preferred majority component: interpretation in real scenario. Appl. Nanosci.2, 365–369. 10.1007/s13204-012-0094-8 (2012). [Google Scholar]
Associated Data
This section collects any data citations, data availability statements, or supplementary materials included in this article.
Supplementary Materials
Data Availability Statement
“Data is provided within the manuscript or supplementary information files”.


