Abstract
Chronic hyperglycemia, a hallmark of diabetes, can trigger inflammatory responses in the kidney, leading to diabetic nephropathy (DN). Follistatin-like protein 1 (FSTL1) has emerged as a potential therapeutic target in various kidney diseases. This study investigated the effect of high glucose on FSTL1 expression and its role in oxidative stress and cellular transdifferentiation injury in HK-2 human proximal tubule epithelial cells, a model of DN. We investigated FSTL1’s level in HK-2 cells exposed to high glucose using Western blotting and quantitative real-time polymerase chain reaction (qRT-PCR). FSTL1 was manipulated using recombinant human FSTL1 (rhFSTL1) or lentiviral shFSTL1. We then analyzed proliferation, oxidative stress, transdifferentiation, cell migration, and the nuclear factor kappa-B (NF-κB) signaling pathway potentially involved in FSTL1 effects. Finally, we blocked the NF-κB pathway to see its influence on these cellular processes. High glucose exposure significantly increased FSTL1 in HK-2 cells, with longer/higher glucose further amplifying this effect. Silencing of FSTL1 ameliorates cellular damage by promoting proliferation, enhancing superoxide dismutase (SOD) and glutathione (GSH) activity, and reducing malondialdehyde (MDA) production, inhibiting cell migration. Furthermore, it prevented the harmful conversion of HK-2 cells from epithelial to myofibroblast-like phenotypes, evidenced by decreased fibronectin (FN) and α-smooth muscle actin (α-SMA) and preserved E-cadherin. Notably, silencing FSTL1 also inhibited the NF-κB signaling pathway. Conversely, rhFSTL1 exhibited opposite effects. Importantly, blocking NF-κB reversed the detrimental effects of FSTL1. These findings suggest that FSTL1 contributes to high glucose-induced kidney injury by promoting oxidative stress and cellular transdifferentiation potentially via the NF-κB pathway. Targeting FSTL1 may represent a novel therapeutic strategy for preventing or mitigating DN progression.
Supplementary Information
The online version contains supplementary material available at 10.1038/s41598-024-84462-5.
Keywords: Diabetic nephropathy, Follistatin-like protein 1, Oxidative stress, Transdifferentiation
Subject terms: Diseases, Endocrinology, Nephrology
Introduction
Diabetic nephropathy (DN) is a common and severe complication of diabetes that significantly worsens patient outcomes. Statistics show that roughly 30% of diabetics develop DN1,2. Therefore, effective prevention and treatment strategies for DN are urgently needed. The causes of DN are complex and multifaceted. Current understanding suggests that genetic predisposition, abnormalities in glucose and lipid metabolism, dysfunctional blood flow regulation, oxidative stress, and inflammation play a role. Among these factors, inflammation has gained increasing attention due to its involvement throughout the entire course of DN, and research suggests that inhibiting inflammation can be protective3,4.
FSTL1, also known as follistatin-related protein (FRP) and transforming growth factor-β1-stimulated clone 36 (TSC-36), is expressed in various organs except for blood cell lines. FSTL1 regulates various biological processes, including cell differentiation, apoptosis, proliferation, metabolism, and hormone function. FSTL1 expression increases in fibrotic lung, liver, kidney, and skin conditions. Notably, FSTL1 is induced and regulated by TGF-β1 in the fibrotic processes of the lung, liver, and heart, contributing to the pro-fibrotic effects of TGF-β1. However, the role of FSTL1 in the development of renal interstitial fibrosis caused by different factors appears inconsistent. For instance, blocking FSTL1 with an antibody after unilateral ureteral obstruction (UUO) surgery worsened kidney injury and fibrosis5. Conversely, a study using the Col4a3-/- mouse model of renal interstitial fibrosis found that fibroblast-derived FSTL1 promoted the expression of genes associated with fibrosis, inflammation, and apoptosis through paracrine signaling6.
Due to these conflicting findings on the role of FSTL1 in various models of renal fibrosis and the lack of comprehensive research on its role in DN, we designed this study. We investigated the effects of high glucose on FSTL1 expression in kidney cells (HK-2 cells) using Western blotting and qRT-PCR to assess protein and mRNA levels, respectively. We then employed rhFSTL1 and lentiviral shFSTL1 transfection in HK-2 cells to explore the function and mechanisms by which FSTL1 influences high glucose-induced proliferation, oxidative stress, cell transdifferentiation, and migration.
Materials and methods
Cell culture and transfection
Human renal proximal tubular cells (HK-2) were obtained from the Beijing Beina Chuanglian Biotechnology Research Institution (BNCC339833). These cells were cultured in DMEM medium (Hyclone) supplemented with 15% fetal bovine serum (FBS) (11011-8611, Zhejiang Tianhang Biological, China) under an atmosphere of 5% CO2 at 37 °C.
The empty vector (LV-NC, negative control) plasmid and FSTL1 lentiviral vector (LV-shFSTL1) plasmid were obtained from Miaoling Bio, China. HK-2 cells were homogeneously inoculated in a 6-well plate. At 50 ~ 60% confluence, 5 μl of LV-shFSTL1 or LV-NC and 5 μl of polystyrene (co-transfection reagent, QT0030, MiaoLingBio, China) were mixed in 1 ml of basal medium and then used to transfect HK-2 cells. After 6 h of incubation at 37 °C, 1 ml of complete medium was added and incubation was continued. After 18 h, the virus-containing medium was aspirated, and the serum-containing complete medium was added. Incubation then continued for 48 h. The old medium was then replaced with a complete medium containing 2.5% puromycin (QT0003, MiaoLingBio, China).
Cells were inoculated in 90 mm dishes. When the degree of cell fusion was 70%, the culture medium was changed to high-glucose DMEM medium containing the recombinant human FSTL1 (1694-FN-050, R&D Systems, America) at a concentration of 300 ng/ml, and incubation was continued at 37℃ for 48 h.
Cell counting kit-8 (CCK-8)
7 × 10³ HK-2 cells were seeded per well in a 96-well plate and incubated at 37 °C for 2 days. Subsequently, 10% CCK-8 solution (AR1160, Boster Biological Technology) was added to each well, followed by a 40-min incubation at 37 °C according to the CCK-8 kit protocol. The optical density (OD) value of each well was measured at a wavelength of 450 nm using an enzyme-linked immunosorbent assay (ELISA) reader.
qRT-PCR
Total RNA was extracted from HK-2 cells using Trizol (B511311, Sangon Biotech). The RNA was then reverse-transcribed into cDNA using the AMV First Strand cDNA Synthesis Kit (B532445, Sangon Biotech). The reverse transcription reaction involved incubation steps at 65 °C for 5 min, followed by an ice bath for 30 s, 42 °C for 45 min, 85 °C for 5 min, and finally storage at 4 °C. Subsequently, the cDNA was mixed with primers and 2X SYBR Green Abstart PCR Mix (B110031, Sangon Biotech) for qRT-PCR. Primer sequences are shown in Table 1, and the qRT-PCR program is shown in Table 2. The relative expression levels of FSTL1 were quantified using the 2-ΔΔCT method and normalized to the endogenous reference gene β-actin. Data are shown as fold change.
Table 1.
Primer sequences for qRT-PCR.
| Primer | Sequences |
|---|---|
| FSTL1 (human) | Forward: 5’-TGGTGATTCTCGCCTGGACTCC-3’ |
| Reverse: 5’-CTGGTCATCTCCTCCTCTGTCTGG-3’ | |
| β-actin (human) | Forward: 5’-TCGTGCGTGACATTAAGGAGAAGC-3’ |
| Reverse: 5’-GGCGTACAGGTCTTTGCGGATG-3’ |
Table 2.
qRT-PCR program.
| Steps | Temperature | Time | Number of cycles |
|---|---|---|---|
| Initial denaturation | 95 °C | 2.5 min | |
| Denaturation | 94 °C | 15 s | 40 cycles |
| Annealing | 60 °C | 60 s |
Western blot
Total protein was extracted from cells using RIPA buffer (AR0102, Boster Biological Technology) supplemented with PMSF (AR0102, Boster Biological Technology) and protease inhibitors. Protein concentration was determined using a BCA protein assay kit (P0012, Beyotime Biotechnology). The proteins were then denatured by heating at 95 °C for 5 min. Proteins were separated by SDS-PAGE electrophoresis on a 12% separating gel and transferred to a PVDF membrane (Millipore). The membrane was subsequently blocked with 5% non-fat dry milk in TBST for 1 h at room temperature on a shaking platform. The membrane was then incubated with primary antibodies against FSTL1 (1:7000, DF12274, Affinity Biosciences), E-cadherin (1:2000, AF0131, Affinity Biosciences), FN (1:1500, 15613-1-AP, Proteintech), α-SMA (1:1000, AF1032, Affinity Biosciences), NF-κB p65 (1:800, AF5006, Affinity Biosciences), phosphorylated-NF-κB p65 (p-p65) (1:1800, AF2006, Affinity Biosciences), and β-actin (1:2000, AF7018, Affinity Biosciences) overnight at 4 °C. The membrane was then incubated with goat anti-rabbit IgG HRP conjugate (1:8000, BA1054, Boster Biological Technology) for 1 h at room temperature, followed by four washes with TBST. Protein bands were visualized using ECL reagent (KF8005, Affinity Biosciences) and analyzed using Image Lab software. β-actin was used as a loading control.
Oxidative stress
The cells were scraped off directly by a cell scraper, and the cell precipitates were collected into centrifuge tubes after cell counting. Cells were crushed using a cell ultrasonic crusher after adding the appropriate lysates according to the kit protocols (A001; A006; A003, Nanjing Jianjian Bioengineering Institute). Subsequently, the protein concentration was determined using a protein concentration assay kit (P0009, Beyotime Biotechnology). The samples and reagents were added into 96-well plates according to the kit protocol, and the OD of each well was measured using an enzyme-linked immunosorbent assay reader at the corresponding wavelengths (SOD: 450 nm; GSH: 405 nm; MDA: 530 nm).
Cell cycle
Inoculate the cells into a 6-well plate and add the appropriate medium for culture. Cell concentration was collected and adjusted to 1 × 10⁶/ml. 1 ml of single-cell suspension was taken, centrifuged, supernatant removed, and fixed in 500 μl of 70% ice ethanol in the cells overnight. The reagents were added according to the instructions of the Cell Cycle Kit (KGA9101, Keygen Biotechnology), and the samples were prepared and tested on a flow cytometer. The results were analyzed by Modfit LT5, and the proliferation index (PI) = (S phase + G2/M phase)/(G0/G1 phase + S phase + G2/M phase) × 100%, which was used to determine the cell proliferation according to the size of PI.
Cell migration
Inoculate the cells into a 6-well plate and add the appropriate medium for culture. When the degree of cell fusion was 90 ~ 100%, the cells were scribed with a 200 μl tip at a uniform speed perpendicular to the plate surface, and this time was recorded as 0 h. A photo of the same field of view was taken and stored under the light microscope at 0 h and 24 h. The cell migration area of each group at 24 h was analyzed by Image J processing. The 24-h cell migration rate of each group was analyzed by Image J processing according to the formula: cell migration rate (%) = (area of the 0 h scratch - area of the 24 h scratch)/initial area of the scratch × 100%.
Statistical analysis
Outcomes were shown in means and standard deviation. Data were at least three replicates. When comparing the two groups, we employed unpaired student t-tests for analysis. When evaluating more than two groups, we employed the one-way ANOVA. GraphPad Prism 10.0 was approached for analysis, and a P < 0.05 indicates significance.
Results
Effect of high glucose induction on FSTL1 expression in HK-2 cells
To investigate the expression of FSTL1 in high glucose-induced HK-2 cells, we examined the expression level of FSTL1 in HK-2 cells under different glucose concentrations and different times of high glucose action using Western blotting and qRT-PCR, respectively.
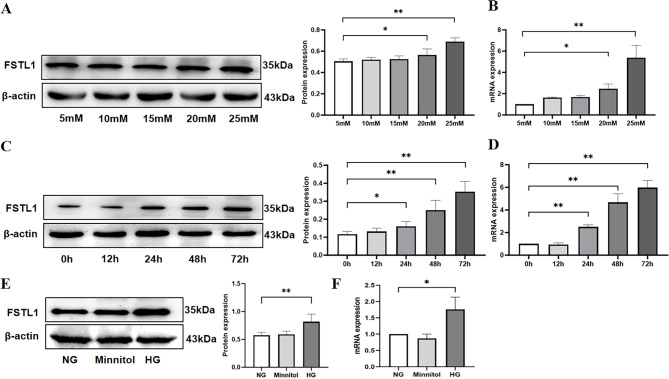
HK-2 cells were incubated in a DMEM medium containing different D-glucose values (5, 10, 15, 20, 25 mM) for 48 h. Western blot and qRT-PCR were used to analyze the effect of glucose concentration on FSTL1 expression in HK-2 cells. FSTL1 expression was significantly higher in the 20 mM (P < 0.05) and 25 mM groups (P < 0.01) compared to the 5 mM group (Fig. 1A, B).
Fig. 1.
Effect of high glucose induction on FSTL1 expression in HK-2 cells. (A, B) Effect of high glucose concentration on FSTL1 expression in HK-2 cells. (A) FSTL1 protein expression (Western blotting); (B) FSTL1 mRNA expression (qPCR). (C, D) Effect of high glucose duration of action on FSTL1 expression in HK-2 cells. (C) FSTL1 protein expression (Western blotting); (D) FSTL1 mRNA expression (qPCR). (E, F) Effect of osmotic pressure on FSTL1 expression in HK-2 cells. (E) FSTL1 protein expression (Western blotting); (F) FSTL1 mRNA expression (qPCR). *P < 0.05 and **P < 0.01. NG, normal glucose; HG, high glucose; Mannitol, high osmolarity.
FSTL1 expression was then studied in HK-2 cells cultivated in 25 mM D-glucose DMEM media for 0, 12, 24, 48, and 72 h of high glucose stimulation. Compared to the 0 h group, FSTL1 expression was considerably greater in the 24 h (P < 0.05, P < 0.01), 48 h (P < 0.01), and 72 h groups (P < 0.01) (Fig. 1C, D).
Finally, HK-2 cells were separated into three groups: the NG group was given 5 mM D-glucose DMEM medium, the HG group was given 25 mM D-glucose DMEM medium, and the Minnitol group was given high osmolarity medium (20 mM D-mannitol (Sigma Aldrich) was mixed with 5 mM D-glucose DMEM medium to adjust the osmolarity to match that of the 25 mM D-glucose group) as an osmotic pressure control group. The expression of FSTL1 was shown to be greater in the HG than the NG group (P < 0.01, P < 0.05), but not with Minnitol (P > 0.05), according to Western blotting and qRT-PCR analyses (Fig. 1E, F).
These results indicate that FSTL1 expression in high glucose-induced HK-2 cells was significantly elevated with increasing glucose concentration and incubation time in a time- and concentration-dependent manner.
Effect of FSTL1 on high glucose-induced HK-2 cell injury
Effect of FSTL1 on proliferation of high glucose-induced HK-2 cells
Silencing FSTL1 by shRNA ameliorates high glucose-mediated suppression of HK-2 cell proliferation
To investigate the effect of FSTL1 on HK-2 cell proliferation, we performed CCK-8 and cell cycle assays. HK-2 cells were divided into four groups: NG (normal glucose), HG (high glucose), LV-shFSTL1 + HG (shRNA-mediated FSTL1 knockdown with high glucose), and LV-NC + HG (negative control lentivirus with high glucose). Cells were cultured in DMEM medium containing either 5 mM D-glucose (NG) or 25 mM D-glucose (HG, LV-shFSTL1 + HG, LV-NC + HG) for further analysis.
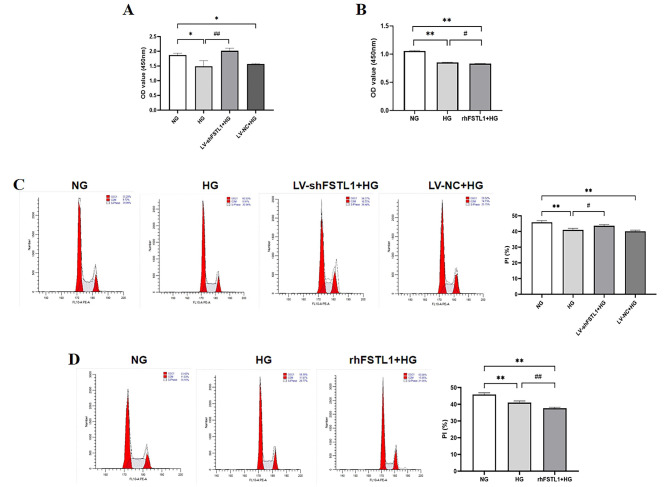
CCK-8 assay revealed that OD values were significantly decreased in the HG and LV-NC + HG groups compared to the NG group (P < 0.05) (Fig. 2A). However, silencing FSTL1 using shRNA (LV-shFSTL1 + HG group) resulted in a significantly higher OD value compared to the HG group (P < 0.01) (Fig. 2A).
Fig. 2.
Effect of FSTL1 on proliferation of high glucose-induced HK-2 cells. (A, B) CCK-8 assays for cell proliferation. (C, D) Flow cytometry assays for cell proliferation. (A, C) Silencing FSTL1 expression; (B, D) Giving rhFSTL1. Compared to the NG group, *P < 0.05 and **P < 0.01. Compared to the HG group, #P < 0.05 and ##P < 0.01. shFSTL1, silencing of FSTL1; rhFSTL1, recombinant human FSTL1.
Flow cytometry results showed that the proportion of cells in S-phase and G2/M-phase was significantly lower in the HG and LV-NC + HG groups compared with the NG group (P < 0.01) (Fig. 2C), and the proportion of cells in S-phase and G2/M-phase was significantly higher in the LV-shFSTL1 + HG group compared to the HG group (P < 0.05) (Fig. 2C).
In summary, indicating that FSTL1 knockdown alleviated the suppressive effect of high glucose on HK-2 cell proliferation.
rhFSTL1 exacerbates high glucose-mediated suppression of HK-2 cell proliferation
HK-2 cells were divided into three groups: NG (normal glucose), HG (high glucose), and rhFSTL1 + HG (recombinant human FSTL1 with high glucose). Cells were cultured in DMEM medium containing either 5 mM D-glucose (NG) or 25 mM D-glucose (HG, rhFSTL1 + HG) for further analysis.
CCK-8 assay demonstrated that the OD value of the HG group was significantly lower compared to the NG group (P < 0.01) (Fig. 2B). Furthermore, the OD value of the rhFSTL1 + HG group was significantly lower than that of the HG group (P < 0.05) (Fig. 2B).
Flow cytometry results showed that the proportion of cells in S-phase and G2/M-phase was significantly lower in the HG and rhFSTL1 + HG groups compared with the NG group (P < 0.01) (Fig. 2D), and the proportion of S-phase and G2/M-phase cells in the rhFSTL1 + HG group was lower than that in the HG group (P < 0.01) (Fig. 2D).
This suggests that rhFSTL1 exacerbates the inhibitory effect of high glucose on HK-2 cell proliferation.
Effect of FSTL1 on oxidative stress in high glucose-induced HK-2 cells
When the organism is in a high glucose environment, the elevated glucose concentration will stimulate the cells and then trigger oxidative stress 7. HK-2 cells will be damaged in such a harsh microenvironment. To investigate the role of FSTL1 in the oxidative stress response of HK-2 cells stimulated by high glucose, we examined the levels of SOD, GSH, and MDA in HK-2 cells stimulated by high glucose using oxidative stress-related kits.
Silencing of FSTL1 by shRNA attenuated high glucose-induced oxidative stress
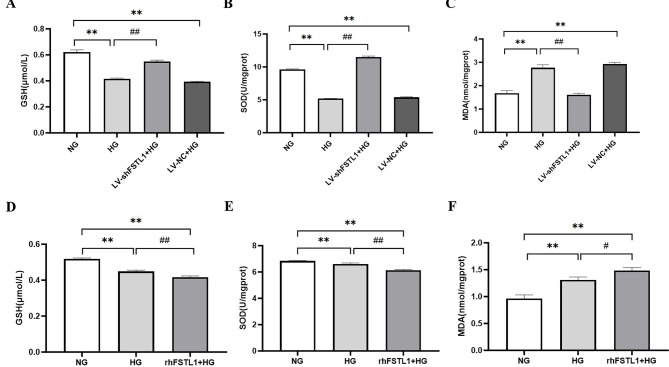
Compared with the NG group, the GSH and SOD levels were decreased more remarkably in HG and LV-NC + HG groups (P < 0.01) (Fig. 3A, B), but the MDA level was considerably greater (P < 0.01) (Fig. 3C). When we silenced FSTL1 expression, GSH and SOD levels were increased more remarkably in LV-shFSTL1 + HG group than HG group (P < 0.01) (Fig. 3A, B), and MDA level was considerably lower (P < 0.01) (Fig. 3C).
Fig. 3.
Effect of FSTL1 on oxidative stress in high glucose-induced HK-2 cells. (A, B, C) Silencing of FSTL1 by shRNA attenuated HG-induced oxidative stress. (A) GSH level; (B) SOD level; (C) MDA level. (D, E, F) rhFSTL1 aggravated HG-induced oxidative stress. (D) GSH level; (E) SOD level; (F) MDA level. Compared to the NG group, **P < 0.01. Compared to the HG group, #P < 0.05 and ##P < 0.01. GSH, glutathione; SOD, superoxide dismutase; MDA, malondialdehyde.
This suggests that downregulating FSTL1 attenuates high glucose-induced oxidative stress in HK-2 cells.
rhFSTL1 exacerbates high glucose-induced oxidative stress
Compared with the NG group, the GSH and SOD levels were decreased significantly in HG and rhFSTL1 + HG groups (P < 0.01) (Fig. 3D, E), but MDA level was considerably greater (P < 0.01) (Fig. 3F). Furthermore, the GSH and SOD levels decreased more significantly in rhFSTL1 + HG group than HG group (P < 0.01) (Fig. 3D, E), and MDA levels increased more significantly (P < 0.05) (Fig. 3F).
This suggests that rhFSTL1 exacerbates high glucose-induced oxidative stress in HK-2 cells.
Effect of FSTL1 on transdifferentiation of high glucose-induced HK-2 cells
A series of pathological changes triggered by hyperglycemia can induce renal tubular epithelial cells to undergo transdifferentiation8. Transdifferentiation of renal tubular epithelial cells to myofibroblasts stimulated by high glucose can lead to fibrotic lesions in the kidney. To investigate the effect of FSTL1 on the transdifferentiation of high glucose-induced HK-2 cells, we examined cell transdifferentiation indicators, including E-cadherin, FN, and α-SMA, using Western blotting.
Silencing of FSTL1 by shRNA attenuated high glucose-induced transdifferentiation of HK-2 cells
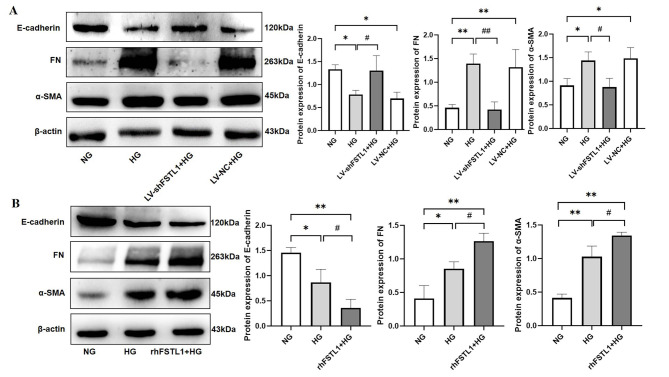
Compared with the NG group, FN and α-SMA expressions were significantly higher (P < 0.01 and P < 0.05, respectively), whereas E-cadherin expression was significantly lower (P < 0.05) in both the HG and LV-NC + HG groups. After silencing FSTL1 expression, FN expression was significantly lower (P < 0.01), α-SMA was significantly lower (P < 0.05), and E-cadherin expression was significantly higher (P < 0.05) in the LV-shFSTL1 + HG group compared with the HG group (Fig. 4A). This shows that downregulation of FSTL1 attenuates high glucose-induced transdifferentiation of HK-2 cells.
Fig. 4.
Effect of FSTL1 on transdifferentiation of high glucose-induced HK-2 cells. (A) Silencing FSTL1 expression; (B) Giving rhFSTL1. Compared to the NG group, *P < 0.05 and **P < 0.01. Compared to the HG group, #P < 0.05 and ##P < 0.01.
rhFSTL1 exacerbates high glucose-induced transdifferentiation of HK-2 cells
Compared with the NG group, FN and α-SMA expressions were significantly higher (P < 0.05 and P < 0.01, respectively), whereas E-cadherin expression was significantly lower (P < 0.05) in the HG group. rhFSTL1 + HG group showed significantly higher (P < 0.01) expression of both FN and α-SMA, and significantly lower expression of E-cadherin (P < 0.01). Furthermore, FN and α-SMA expression was significantly higher (P < 0.05), and E-cadherin expression was significantly lower (P < 0.05) in the rhFSTL1 + HG group than in the HG group (Fig. 4B). This suggests that rhFSTL1 incorporation exacerbates high glucose-induced transdifferentiation of HK-2 cells.
Effect of FSTL1 on cell migration of high glucose-induced HK-2 cells
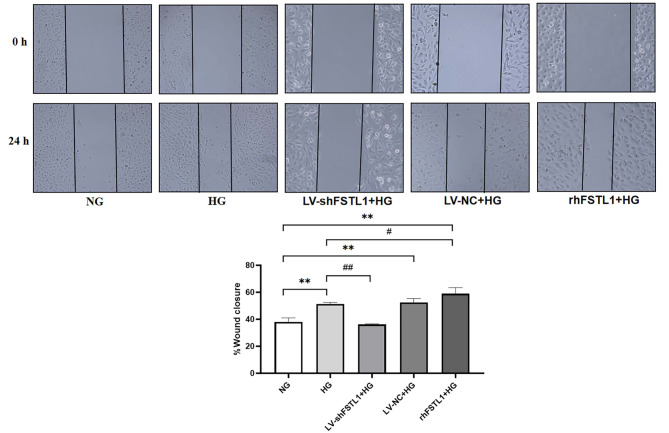
Under hyperglycemia, glucose and other sugar molecules in the body undergo non-enzymatic glycation reactions with proteins, lipids, and other macromolecules, generating a large number of glycation end-products (AGEs). These AGEs accumulate in the extracellular matrix, altering its normal physical and chemical properties9. For example, they can make the extracellular matrix more rigid, affecting cell adhesion, spreading, and other behaviors, thus interfering with the normal steps of cell migration. From the above experiments, we know that FSTL1 can affect the expression of transdifferentiation-related factors in high glucose-induced HK-2 cells. Therefore, to investigate the effect of FSTL1 on the migration of high glucose-induced HK-2 cells, we performed a wound-healing assay.
As shown in Fig. 5, the cell migration rate was significantly higher in the HG, LV-NC + HG, and rhFSTL1 + HG groups compared with the NG group (P < 0.01). Compared with the HG group, the cell migration rate was significantly lower in the LV-shFSTL1 + HG group (P < 0.01). In contrast, it was significantly higher in the rhFSTL1 + HG group (P < 0.05). This suggests that silencing FSTL1 expression reduces the high glucose-induced enhancement of HK-2 cell migration, whereas rhFSTL1 treatment promotes it.
Fig. 5.
Effect of FSTL1 on cell migration of high glucose-induced HK-2 cells. Compared to the NG group, **P < 0.01. Compared to the HG group, #P < 0.05 and ##P < 0.01.
Role of NF-κB signaling pathway in FSTL1-mediated injury of high glucose-induced HK-2 cells
Effect of FSTL1 on NF-κB activation in high glucose-induced HK-2 cells
Under a hyperglycemic environment, the NF-κB signaling pathway is activated due to factors such as increased advanced AGEs and enhanced oxidative stress. Factors such as hyperglycemia-induced generation of reactive oxygen species (ROS) can activate IκB kinase (IKK), which in turn initiates the activation process of NF-κB, prompting its nuclear translocation and regulating the expression of related genes10. p65 is an important component of NF-κB heterodimer, and the formation of p-p65 is often associated with further enhancement of NF-κB activity. In the present study, we learned from the above experiments that FSTL1 is involved in high glucose-induced proliferation, oxidative stress, transdifferentiation, and migration in HK-2 cells. However, the exact signaling pathway is unknown. Therefore, we detected the expression levels of p65 and p-p65 in each group using Western blotting. To clarify the effect of FSTL1 on NF-κB activation in high glucose-induced HK-2 cells.
Silencing of FSTL1 by shRNA inhibits NF-κB phosphorylation
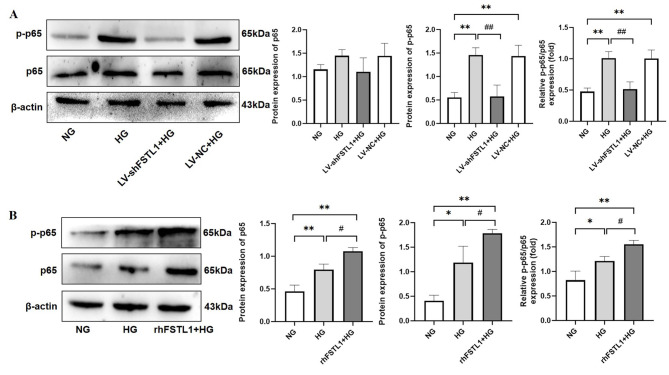
Western blotting analysis revealed no statistically significant difference in total p65 protein expression between the four groups (NG, HG, LV-shFSTL1 + HG, LV-NC + HG) (P > 0.05). However, the levels of p-p65 and the relative ratio of p-p65 to total p65 (p-p65/p65) were significantly higher in both the HG and LV-NC + HG groups compared with the NG group (P < 0.01). In contrast, silencing FSTL1 expression using shRNA (LV-shFSTL1 + HG group) resulted in a significant decrease in both p-p65 and p-p65/p65 levels compared to the HG group (P < 0.01) (Fig. 6A).
Fig. 6.
Effect of FSTL1 on NF-κB expression in high glucose-induced HK-2 cells. (A) Silencing FSTL1 expression; (B) Giving rhFSTL1. Compared to the NG group, *P < 0.05 and **P < 0.01. Compared to the HG group, #P < 0.05 and ##P < 0.01.
These findings suggest that FSTL1 silencing inhibits NF-κB phosphorylation in high glucose-induced HK-2 cells.
rhFSTL1 promotes NF-κB phosphorylation
Compared to the NG group, the HG group displayed a significant increase in total p65 protein expression (P < 0.01), as well as significantly higher levels of p-p65 and the p-p65/p65 ratio (P < 0.05). The rhFSTL1 + HG group also exhibited a significant increase in p65, p-p65, and p-p65/p65 relative expression compared to the NG group (P < 0.01). Furthermore, the rhFSTL1 + HG group showed a significant increase in all three measures (p65, p-p65, and p-p65/p65) compared to the HG group (P < 0.05) (Fig. 6B).
These results indicate that rhFSTL1 treatment promotes NF-κB phosphorylation in high glucose-induced HK-2 cells.
Effect of FSTL1 on high glucose-induced HK-2 cell injury after blocking the NF-κB signaling pathway
After identifying changes in the expression of p65 and p-p65, we added the NF-κB signaling pathway inhibitor PDTC. We then used Western blotting, CCK8, flow cytometry, and oxidative stress kits to further clarify the role of the NF-κB signaling pathway in FSTL1-mediated injury to high glucose-induced HK-2 cells.
Inhibition of NF-κB signaling pathway ameliorates the effects of FSTL1 on proliferation of high glucose-induced HK-2 cells
HK-2 cells were divided into four groups: LV-shFSTL1 + HG (HK-2 cells with shRNA-mediated knockdown of FSTL1 were treated with 25 mM DMEM complete medium for 48 h), LV-shFSTL1 + HG + PDTC (HK-2 cells with shRNA-mediated knockdown of FSTL1 were pretreated with PDTC (100 μM) for 6 h, and then cultured in 25 mM DMEM complete medium for 48 h), rhFSTL1 + HG (normal HK-2 cells were treated with 25 mM DMEM complete medium containing 300 ng/mL rhFSTL1 for 48 h), and rhFSTL1 + HG + PDTC (normal HK-2 cells were first pretreated with PDTC (100 μM) for 6 h, and then incubated with 25 mM DMEM complete medium containing 300 ng/mL rhFSTL1 for 48 h).
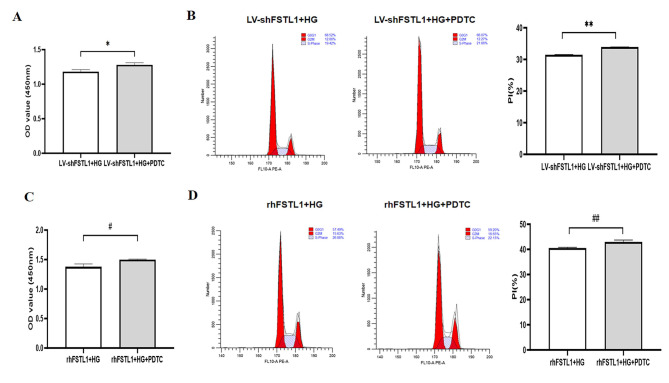
The CCK-8 assay results showed a significant increase in OD values in the LV-shFSTL1 + HG + PDTC group compared to the LV-shFSTL1 + HG group (P < 0.05) (Fig. 7A). Flow cytometry results showed that the proportion of cells in the LV-shFSTL1 + HG + PDTC group was significantly higher in the S and G2/M phases compared with the LV-shFSTL1 + HG group (P < 0.01) (Fig. 7B). This indicates that blocking the NF-κB pathway further enhanced the proliferative effect of FSTL1 silencing on HK-2 cells exposed to high glucose.
Fig. 7.
Effect of FSTL1 on HK-2 cell proliferation after blocking the NF-κB signaling pathway. (A, C) CCK-8 assays for cell proliferation. (B, D) Flow cytometry assays for cell proliferation. Compared to the LV-shFSTL1 + HG group, *P < 0.05. Compared to the rhFSTL1 + HG group, #P < 0.05. PDTC, NF-κB signaling pathway inhibitor.
Similarly, CCK-8 results showed a significant increase in OD value in the rhFSTL1 + HG + PDTC group compared with the rhFSTL1 + HG group (P < 0.05) (Fig. 7C). Flow cytometry results showed a significantly higher proportion of cells in S-phase and G2/M-phase in the rhFSTL1 + HG + PDTC group compared with the rhFSTL1 + HG group (P < 0.01) (Fig. 7D). These results suggest that NF-κB inhibition also ameliorated the suppressive effect of rhFSTL1 treatment on high glucose-induced HK-2 cell proliferation.
Inhibition of NF-κB signaling pathway ameliorates FSTL1-mediated oxidative stress in high glucose-induced HK-2 cells
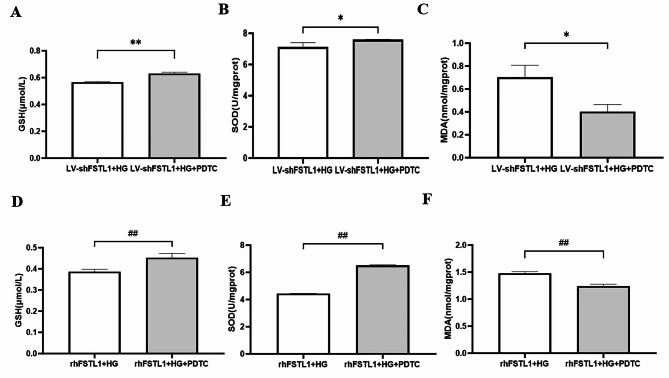
HK-2 cells pretreated with the NF-κB inhibitor PDTC (LV-shFSTL1 + HG + PDTC group) exhibited significantly higher levels of the antioxidant GSH (P < 0.01) (Fig. 8A) and the antioxidant enzyme SOD (P < 0.05) (Fig. 8B) compared to cells with only FSTL1 knockdown (LV-shFSTL1 + HG group). Conversely, MDA, a marker of oxidative stress, was significantly lower (P < 0.05) (Fig. 8C) in the LV-shFSTL1 + HG + PDTC group. Similarly, compared to the rhFSTL1 + HG group, the rhFSTL1 + HG + PDTC group displayed significantly increased levels of GSH (P < 0.01) (Fig. 8D) and SOD (P < 0.01) (Fig. 8E), indicating enhanced antioxidant activity. MDA levels were also significantly lower (P < 0.01) (Fig. 8F) in the rhFSTL1 + HG + PDTC group, suggesting reduced oxidative stress. These data show that inhibition of the NF-κB signaling pathway ameliorates FSTL1-mediated oxidative stress in high glucose-induced HK-2 Cells.
Fig. 8.
Effect of FSTL1 on oxidative stress in HK-2 cells after blocking the NF-κB signaling pathway. (A, B, C) Silencing FSTL1 expression. (A) GSH level; (B) SOD level; (C) MDA level. (D, E, F) Giving rhFSTL1. (D) GSH level; (E) SOD level; (F) MDA level. Compared to the LV-shFSTL1 + HG group, *P < 0.05 and **P < 0.01. Compared to the rhFSTL1 + HG group, ##P < 0.01.
Inhibition of NF-κB signaling pathway ameliorates FSTL1-mediated transdifferentiation
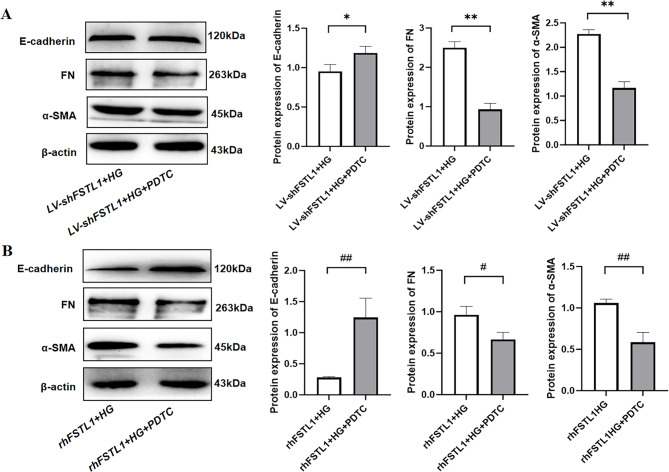
Compared with the LV-shFSTL1 + HG group, FN and α-SMA expression were significantly lower (P < 0.01) (Fig. 9A), but E-cadherin expression was significantly higher (P < 0.05) (Fig. 9A) in the LV-shFSTL1 + HG + PDTC group. Compared with the rhFSTL1 + HG group, FN expression was significantly lower in the rhFSTL1 + HG + PDTC group (P < 0.05) (Fig. 9B), and α-SMA expression was significantly lower (P < 0.01) (Fig. 8B), but E-cadherin expression was significantly increased (P < 0.01) (Fig. 9B). This result reveals that inhibition of NF-κB signaling pathway ameliorates FSTL1-mediated transdifferentiation.
Fig. 9.
Effect of FSTL1 on transdifferentiation in HK-2 cells after blocking the NF-κB signaling pathway. (A) Silencing FSTL1 expression; (B) Giving rhFSTL1. E-cadherin, FN, and α-SMA expression levels were examined by Western blotting. Compared to the LV-shFSTL1 + HG group, *P < 0.05 and **P < 0.01. Compared to the rhFSTL1 + HG group, #P < 0.05 and ##P < 0.01.
Inhibition of NF-κB signaling pathway ameliorates the effects of FSTL1 on cell migration of high glucose-induced HK-2 cells
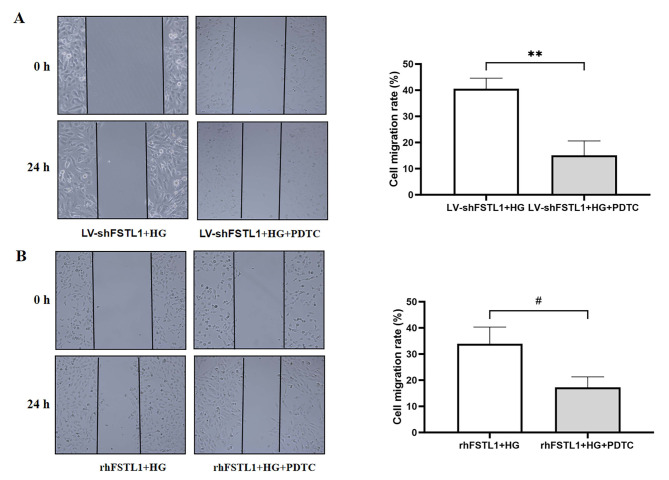
The cell migration rate was significantly lower in the LV-shFSTL1 + HG + PDTC group compared to the LV-shFSTL1 + HG group (P < 0.01) (Fig. 10A). Similarly, the cell migration rate was significantly diminished in the rhFSTL1 + HG + PDTC group compared with the rhFSTL1 + HG group (P < 0.05) (Fig. 10B). This result shows that inhibition of NF-κB signaling pathway ameliorates the effects of FSTL1 on cell migration of high glucose-induced HK-2 cells.
Fig. 10.
Effect of FSTL1 on cell migration in HK-2 cells after blocking the NF-κB signaling pathway. (A) Silencing FSTL1 expression; (B) Giving rhFSTL1. Compared to the LV-shFSTL1 + HG group, **P < 0.01. Compared to the rhFSTL1 + HG group, #P < 0.05.
Discussion
Studies have shown that FSTL1 expression is aberrantly elevated in various inflammatory and fibrotic conditions11–16. Patients with rheumatoid arthritis, Sjogren’s syndrome, and osteoarthritis all have significantly increased serum FSTL1 concentrations11–13. Similarly, increased FSTL1 expression has been observed in idiopathic pulmonary fibrosis, bleomycin-induced lung injury, and carbon tetrachloride-induced liver damage14–16.
Hyperglycemia, a hallmark of diabetes, is the initiating factor of diabetic complications. It triggers a cascade of events, including the release of ROS, stimulation of the body’s neurohumoral response, and induction and activation of cell growth factors (like platelet-derived growth factors (PDGFs) and transforming growth factor-β1 (TGF-β1))17. Hyperglycemia also stimulates pro-inflammatory cytokines (like tumor necrosis factor-α (TNF-α) and interleukin-1β (IL-1β)), promotes AGEs formation, and induces surface integrins and secretory matricellular proteins (connective tissue growth factor 2 (CCN2) and thrombospondin-1 (TSP-1))17,18. These factors contribute to increased extracellular matrix (ECM) accumulation and glomerular injury, ultimately leading to tubulointerstitial inflammation and interstitial fibrosis19–22. Furthermore, high glucose can exacerbate the impact of ROS-induced DNA damage and disrupt DNA repair, thus accelerating fibrosis, inflammatory activation, and cellular senescence10,23,24.
Inflammation plays a critical role in the development of DN3,4. Inflammatory factors trigger a cascade of events within the kidney. In the glomerulus, they stimulate podocytes to secrete extracellular matrix proteins like collagen IV, laminin, and fibronectin, leading to glomerulosclerosis. In the tubules, inflammation stimulates epithelial cells to secrete inflammatory mediators, cytokines, and chemokines. This attracts monocytes/macrophages to the area, further intensifying the inflammatory response and creating a vicious cycle. Moreover, inflammation can induce the transformation of epithelial cells at the injury site into myofibroblasts, which are similar to fibroblasts and produce excessive extracellular matrix material. This uncontrolled deposition of matrix during tissue repair leads to fibrosis, ultimately causing loss of normal kidney structure and function25–29.
Our study demonstrated a significant increase in FSTL1 expression in HK-2 cells exposed to high glucose, and this increase correlated with both glucose concentration and incubation time. These findings are consistent with previous research on non-diabetic models of kidney injury. In mice with UUO or FA-induced interstitial fibrosis, RNA sequencing of kidney lysates revealed a significant upregulation of FSTL130. Furthermore, FSTL1 expression was localized to renal fibroblasts and tubular epithelial cells in these models5,31. Similarly, studies in mice with subtotal nephrectomy showed a correlation between increased renal damage and elevated plasma FSTL1 levels32. Bioinformatics analysis of DN patients revealed a positive correlation between FSTL1 expression and proteinuria levels in tubular injury33. Additionally, a study has shown that serum FSTL1 levels are elevated in newly diagnosed type 2 diabetes mellitus (T2DM) patients and are associated with glucose metabolism and insulin resistance (IR)34. Another study in DN mice found that FSTL1 expression was significantly upregulated and positively correlated with serum creatinine levels while negatively correlating with glomerular filtration rate (GFR), indicating its potential role in disease severity35.
To investigate FSTL1’s role in DN, we silenced FSTL1 expression in HK-2 cells using lentiviral transfection. These shFSTL1-HK-2 cells exhibited greater resistance to high glucose stimulation than the high glucose group, with improved cell proliferation and reduced oxidative stress, transdifferentiation, and cell migration. Conversely, when HK-2 cells were treated with both rhFSTL1 and high glucose, they displayed weaker resistance to high glucose, further inhibited proliferation, and enhanced oxidative stress, transdifferentiation, and cell migration compared to the HG group. These findings suggest that FSTL1 aggravates renal injury in DN.
Previous studies have shown that NF-κB is a key transcription factor activated by hyperglycemia and ROS in DN36,37. Activated NF-κB regulates the expression of factors involved in inflammation and fibrosis, thereby accelerating diabetic kidney injury and worsening oxidative stress, apoptosis, inflammation, and epithelial-to-mesenchymal transition (EMT)10,37–43. Our study revealed that silencing FSTL1 decreased NF-κB phosphorylation in HK-2 cells, while rhFSTL1 application increased phosphorylation. Interestingly, inhibition of the NF-κB signaling pathway further potentiated the protective effects of silencing FSTL1 on cell proliferation and the inhibitory effects on oxidative stress, transdifferentiation, and cell migration in HK-2 cells exposed to high glucose. Conversely, it attenuated the detrimental effects of rhFSTL1 on these cellular processes. These findings suggest that FSTL1 inhibits HK-2 cell proliferation and aggravates oxidative stress, cell transdifferentiation, and migration in a high-glucose environment by activating the NF-κB signaling pathway.
Conclusion
Our study revealed a critical role for FSTL1 in high glucose-induced injury to HK-2 cells, a model of diabetic nephropathy. FSTL1 expression was significantly elevated in these cells, and its presence inhibited cell proliferation, exacerbated oxidative stress, and promoted cell transdifferentiation and migration. Furthermore, our findings suggest that FSTL1 may exert these detrimental effects through activation of the NF-κB signaling pathway. These results highlight FSTL1 as a potential therapeutic target for DN. Additional research is necessary to elucidate the mechanisms through which FSTL1 interacts with NF-κB and to assess the therapeutic potential of FSTL1 inhibition in animal models.
Electronic supplementary material
Below is the link to the electronic supplementary material.
Acknowledgements
We would like to acknowledge the present study was supported by Heilongjiang Provincial Higher Education Institutions’ Basic Research Operating Expenses Project, Jiamusi University project, Jiamusi University Science and Technology Innovation Team Building Program Project, Jiamusi University National Foundation Cultivation Program and Chinese Medicine Research Program in Heilongjiang Province.
Author contributions
All authors have contributed in a meaningful way. H. L. had the original idea for the study. B. Z. conducted the analyses supported by S. L. and made the first draft of the manuscript. H. G., K. Z. and M. O. revised the article. All authors (B. Z., H. G., K. Z., M. O., S. L., Z. Y., F. Z., H. L., X.Z.) contributed substantially to the analyses and interpretation of the findings, commented on the manuscript and, likewise, all authors read and approved the final manuscript.
Funding
The study was supported by a grant from the Heilongjiang Provincial Higher Education Institutions’ Basic Research Operating Expenses Project, China (Agreement No. 2022-KYYWF-0656), Jiamusi University Key Project, China (Agreement No. Sz2013-003), Jiamusi University Science and Technology Innovation Team Building Program Project, China (Agreement No. CXTD202102); Jiamusi University National Foundation Cultivation Program, China (Agreement No. JMSUGPZR2023-019), Chinese Medicine Research Program in Heilongjiang Province, China (Agreement No. ZHY2024-104).
Data availability
The data sets used and analyzed during the current study are available from the corresponding author upon reasonable request. We have presented all data in the form of Tables and Figures.
Competing interests
The authors declare no competing interests.
Footnotes
Publisher’s note
Springer Nature remains neutral with regard to jurisdictional claims in published maps and institutional affiliations.
Baoyuan Zhang and Hang Geng contributed equally and first authorship.
Contributor Information
Haiyan Luan, Email: luanhaiyan@jmsu.edu.cn.
Xuesong Zhang, Email: 18603683456@163.com.
References
- 1.Samsu, N. Diabetic nephropathy: Challenges in pathogenesis, diagnosis, and treatment. BioMed Res. Int.2021, 1–17 (2021). [DOI] [PMC free article] [PubMed] [Google Scholar]
- 2.Hu, Q. et al. Diabetic nephropathy: Focusing on pathological signals, clinical treatment, and dietary regulation. Biomed. Pharmacother.159, 114252 (2023). [DOI] [PubMed] [Google Scholar]
- 3.Matoba, K. et al. Unraveling the role of inflammation in the pathogenesis of diabetic kidney disease. Int. J. Mol. Sci.20, 3393 (2019). [DOI] [PMC free article] [PubMed] [Google Scholar]
- 4.Navarro-González, J. F., Mora-Fernández, C., De Fuentes, M. M. & García-Pérez, J. Inflammatory molecules and pathways in the pathogenesis of diabetic nephropathy. Nat. Rev. Nephrol.7, 327–340 (2011). [DOI] [PubMed] [Google Scholar]
- 5.Zhang, Y. & Xia, Y. Role of follistatin-like 1 (Fstl1) in chronic kidney disease. Kidney Int. Rep.4, S387 (2019). [Google Scholar]
- 6.Maksimowski, N. A. et al. Follistatin-like-1 (FSTL1) is a fibroblast-derived growth factor that contributes to progression of chronic kidney disease. Int. J. Mol. Sci.22, 9513 (2021). [DOI] [PMC free article] [PubMed] [Google Scholar]
- 7.González, P., Lozano, P., Ros, G. & Solano, F. Hyperglycemia and oxidative stress: An integral, updated and critical overview of their metabolic interconnections. Int. J. Mol. Sci.24, 9352 (2023). [DOI] [PMC free article] [PubMed] [Google Scholar]
- 8.Zhang, L. et al. High glucose induces transdifferentiation of HK-2 human renal tubular epithelial cells by activating reactive oxygen species-mediated NF-kappa B signaling pathway. Chin. J. Cell Mol. Immunol.35, 313–319 (2019) (In Chinese). [PubMed] [Google Scholar]
- 9.Raghav, A., Ahmad, J. & Alam, K. Nonenzymatic glycosylation of human serum albumin and its effect on antibodies profile in patients with diabetes mellitus. PLOS ONE12, e0176970 (2017). [DOI] [PMC free article] [PubMed] [Google Scholar]
- 10.Ma, X. et al. Advances in oxidative stress in pathogenesis of diabetic kidney disease and efficacy of TCM intervention. Ren. Fail.45, 2146512 (2023). [DOI] [PMC free article] [PubMed] [Google Scholar]
- 11.Li, D. et al. Follistatin-like protein 1 is elevated in systemic autoimmune diseases and correlated with disease activity in patients with rheumatoid arthritis. Arthritis Res. Ther.13, R17 (2011). [DOI] [PMC free article] [PubMed] [Google Scholar]
- 12.Shi, D., Shi, G., Xie, J., Du, X. & Yang, H. MicroRNA-27a inhibits cell migration and invasion of fibroblast-like synoviocytes by targeting follistatin-like protein 1 in rheumatoid arthritis. Mol. Cells39, 611–618 (2016). [DOI] [PMC free article] [PubMed] [Google Scholar]
- 13.Wang, Y. et al. Follistatin-like protein 1: A serum biochemical marker reflecting the severity of joint damage in patients with osteoarthritis. Arthritis Res. Ther.13, R193 (2011). [DOI] [PMC free article] [PubMed] [Google Scholar]
- 14.Pardo, A. et al. Up-regulation and profibrotic role of osteopontin in human idiopathic pulmonary fibrosis. PLoS Med.2, e251 (2005). [DOI] [PMC free article] [PubMed] [Google Scholar]
- 15.Murphy, N. et al. Altered expression of bone morphogenetic protein accessory proteins in murine and human pulmonary fibrosis. Am. J. Pathol.186, 600–615 (2016). [DOI] [PubMed] [Google Scholar]
- 16.Xu, X.-Y. et al. Targeting follistatin like 1 ameliorates liver fibrosis induced by carbon tetrachloride through TGF-β1-miR29a in mice. Cell Commun. Signal18, 151 (2020). [DOI] [PMC free article] [PubMed] [Google Scholar]
- 17.Yuan, Y., Sun, H. & Sun, Z. Advanced glycation end products (AGEs) increase renal lipid accumulation: A pathogenic factor of diabetic nephropathy (DN). Lipids Health Dis.16, 126 (2017). [DOI] [PMC free article] [PubMed] [Google Scholar]
- 18.Tuleta, I. & Frangogiannis, N. G. Diabetic fibrosis. Biochim. Biophys. Acta BBA - Mol. Basis Dis.1867, 166044 (2021). [DOI] [PMC free article] [PubMed] [Google Scholar]
- 19.Banba, N. et al. Possible relationship of monocyte chemoattractant protein-1 with diabetic nephropathy. Kidney Int.58, 684–690 (2000). [DOI] [PubMed] [Google Scholar]
- 20.Guo, W., Li, H., Li, Y. & Kong, W. Renal intrinsic cells remodeling in diabetic kidney disease and the regulatory effects of SGLT2 inhibitors. Biomed. Pharmacother.165, 115025 (2023). [DOI] [PubMed] [Google Scholar]
- 21.Amorim, R. G., Guedes, G. D. S., Vasconcelos, S. M. D. L. & Santos, J. C. D. F. Kidney disease in diabetes mellitus: Cross-linking between hyperglycemia, redox imbalance and inflammation. Arq. Bras. Cardiol. (2019). [DOI] [PMC free article] [PubMed]
- 22.Franko, B. et al. Differential impact of glucose levels and advanced glycation end-products on tubular cell viability and pro-inflammatory/profibrotic functions. Biochem. Biophys. Res. Commun.451, 627–631 (2014). [DOI] [PubMed] [Google Scholar]
- 23.Yamamoto, H., Uchigata, Y. & Okamoto, H. Streptozotocin and alloxan induce DNA strand breaks and poly (ADP-ribose) synthetase in pancreatic islets. Nature294, 284–286 (1981). [DOI] [PubMed] [Google Scholar]
- 24.Singh, A., Kukreti, R., Saso, L. & Kukreti, S. Mechanistic insight into oxidative stress-triggered signaling pathways and type 2 diabetes. Molecules27, 950 (2022). [DOI] [PMC free article] [PubMed] [Google Scholar]
- 25.Lei, Y. et al. Interleukin-1β inhibition for chronic kidney disease in obese mice with type 2 diabetes. Front. Immunol.10, 1223 (2019). [DOI] [PMC free article] [PubMed] [Google Scholar]
- 26.Ma, J. et al. Interleukin 17A promotes diabetic kidney injury. Sci. Rep.9, 2264 (2019). [DOI] [PMC free article] [PubMed] [Google Scholar]
- 27.Jin, Q. et al. Oxidative stress and inflammation in diabetic nephropathy: Role of polyphenols. Front. Immunol.14, 1185317 (2023). [DOI] [PMC free article] [PubMed] [Google Scholar]
- 28.Pérez-Morales, R. E. et al. Inflammation in diabetic kidney disease. Nephron143, 12–16 (2019). [DOI] [PubMed] [Google Scholar]
- 29.Anders, H.-J., Vielhauer, V. & Schlöndorff, D. Chemokines and chemokine receptors are involved in the resolution or progression of renal disease. Kidney Int.63, 401–415 (2003). [DOI] [PubMed] [Google Scholar]
- 30.Feng, D., Ngov, C., Henley, N., Boufaied, N. & Gerarduzzi, C. Characterization of matricellular protein expression signatures in mechanistically diverse mouse models of kidney injury. Sci. Rep.9, 16736 (2019). [DOI] [PMC free article] [PubMed] [Google Scholar]
- 31.Li, L. et al. Follistatin-like 1 (FSTL1) expression is upregulated in unilateral ureteral ligation-induced interstitial fibrosis in the mouse kidney. Acta Sci. Nat. Univ. Nankaiensi47, 95–101 (2014) (In Chinese). [Google Scholar]
- 32.Hayakawa, S. et al. Cardiac myocyte-derived follistatin-like 1 prevents renal injury in a subtotal nephrectomy model. J. Am. Soc. Nephrol.26, 636–646 (2015). [DOI] [PMC free article] [PubMed] [Google Scholar]
- 33.Jia, M. S. et al. Identification of genes related to tubulointerstitial injury in type 2 diabetic nephropathy based on bioinformatics and machine learning. J. Hainan Med. Coll.28, 1558–1566+1578 (2022) (In Chinese). [Google Scholar]
- 34.Xu, X. et al. Follistatin-like 1 as a novel adipomyokine related to insulin resistance and physical activity. J. Clin. Endocrinol. Metab.105, e4499–e4509 (2020). [DOI] [PubMed] [Google Scholar]
- 35.Chen, Y., Liao, L., Wang, B. & Wu, Z. Identification and validation of immune and cuproptosis - related genes for diabetic nephropathy by WGCNA and machine learning. Front. Immunol.15, 1332279 (2024). [DOI] [PMC free article] [PubMed] [Google Scholar]
- 36.Malik, S. et al. Apigenin ameliorates streptozotocin-induced diabetic nephropathy in rats via MAPK-NF-κB-TNF-α and TGF-β1-MAPK-fibronectin pathways. Am. J. Physiol.-Ren. Physiol.313, F414–F422 (2017). [DOI] [PubMed] [Google Scholar]
- 37.Zoccali, C. & Mallamaci, F. Nonproteinuric progressive diabetic kidney disease. Curr. Opin. Nephrol. Hypertens.28, 227–232 (2019). [DOI] [PubMed] [Google Scholar]
- 38.Sun, H.-J. et al. Polysulfide-mediated sulfhydration of SIRT1 prevents diabetic nephropathy by suppressing phosphorylation and acetylation of p65 NF-κB and STAT3. Redox Biol.38, 101813 (2021). [DOI] [PMC free article] [PubMed] [Google Scholar]
- 39.Vallon, V. The proximal tubule in the pathophysiology of the diabetic kidney. Am. J. Physiol.-Regul. Integr. Comp. Physiol.300, R1009–R1022 (2011). [DOI] [PMC free article] [PubMed] [Google Scholar]
- 40.Imig, J. D. & Ryan, M. J. Immune and inflammatory role in renal disease. Compr. Physiol.3, 957–976 (2013). [DOI] [PMC free article] [PubMed] [Google Scholar]
- 41.Shao, Y., Gong, Q., Qi, X.-M., Wang, K. & Wu, Y. Paeoniflorin ameliorates macrophage infiltration and activation by inhibiting the TLR4 signaling pathway in diabetic nephropathy. Front. Pharmacol.10, 566 (2019). [DOI] [PMC free article] [PubMed] [Google Scholar]
- 42.Ying, Q. & Wu, G. Molecular mechanisms involved in podocyte EMT and concomitant diabetic kidney diseases: An update. Ren. Fail.39, 474–483 (2017). [DOI] [PMC free article] [PubMed] [Google Scholar]
- 43.Liu, X. et al. Effects of curcumin on high glucose-induced epithelial-to-mesenchymal transition in renal tubular epithelial cells through the TLR4-NF-κB signaling pathway. Diabetes Metab. Syndr. Obes. Targets Ther.14, 929–940 (2021). [DOI] [PMC free article] [PubMed] [Google Scholar]
Associated Data
This section collects any data citations, data availability statements, or supplementary materials included in this article.
Supplementary Materials
Data Availability Statement
The data sets used and analyzed during the current study are available from the corresponding author upon reasonable request. We have presented all data in the form of Tables and Figures.


