Abstract
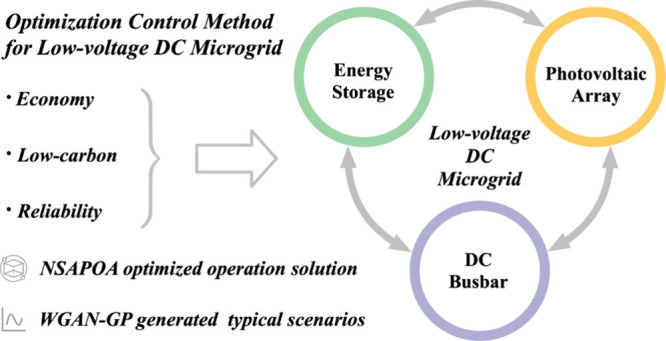
From the perspectives of economy, low carbon, and safety in DC microgrids, a multiscenario optimization control method of low-voltage DC microgrids based on the nondominant sorting arctic puffin optimization algorithm (NSAPOA) is proposed in this paper. The Wasserstein generative adversarial network with gradient penalty (WGAN-GP) is used to generate typical output scenarios of photovoltaic and loads that are reduced by the K-means clustering method to deal with the uncertainty of photovoltaic and load. Based on the time of use electricity price, the operating modes of the low-voltage DC microgrid system are divided to formulate relevant energy exchange strategies. The equivalent electricity weight method is used to evaluate the service life of energy storage systems, and a multiobjective optimization control model of low-voltage DC microgrid for multiple scenarios is established with the objective functions of maximizing daily net income, minimizing equivalent charging and discharging capacity of energy storage systems, and minimizing carbon dioxide emissions. The NSAPOA is used to iteratively obtain the Pareto solution set, and the final optimal solution is determined by employing the multiattributive border approximation area comparison (MABAC) algorithm. Analysis results show that this can achieve economic and low-carbon optimization operation of the system throughout the whole life cycle of energy storage systems.
1. Introduction
Microgrids have garnered significant focus to enhance the efficiency of using renewable energy sources.1 Primarily functioning as an alternating-current (AC) system, the microgrid system aids in the transfer of energy and the provision of power for AC loads. However, as the proportion of direction current (DC) load steadily rises and technology evolves, the development of DC power supply technology is steadily advancing toward full maturity.2 Currently, the bus voltage in DC microgrids predominantly operates at a low voltage state, and these low voltage microgrids are highly reliable in providing electricity to domestic consumers.3 In DC microgrids, energy storage is crucial due to its benefits such as two-way output and adaptable configuration. The cost of investing in DC microgrid energy storage devices is relatively low at present due to their DC output character. As energy storage technology progresses and renewable energy becomes more prevalent, an increasing number of users are likely to switch to a low-voltage DC microgrid mode, incorporating energy storage devices for future power provision.4
Nonetheless, the operational optimization of each component in DC microgrids varies from that in AC microgrids. Within AC microgrids, busbars are capable of direct grid connection via switches, whereas in DC microgrids, the busbars’ current output is DC, preventing a direct link to the AC grid. The transfer of energy between the busbars and the AC grid must be facilitated by converters connected to the grid. Currently, the literature on optimizing low-voltage DC microgrids is quite limited. AlDavood et al.(5) used a sturdy scheduling framework for isolated microgrids, taking into account the demand response. Utilizing sturdy optimization techniques, they simulated the unpredictability of generating renewable energy and its demand reaction, addressing the dual-layer optimization issue with a combined approach involving genetic algorithms and mixed integer programming; Liu Dan et al.(6) employed the multifaceted particle swarm optimization algorithm to address microgrid optimization issues, considering factors like power equilibrium and solar energy production, aiming to reduce daily operational expenses and enhance the rate of solar energy usage. Hayashi R et al.(7) employed a mix of particle swarm optimization and quadratic programming techniques to perform numerical simulations aimed at reducing the combined initial and operational expenses of microgrids; Liu Yong et al.(8) employed a refined particle swarm optimization technique to enhance the financial efficiency of microgrids. Altering the particle swarm algorithm’s velocity and positional development using various normal random numbers, which confirmed the enhanced particle swarm’s optimization capabilities and boosted the microgrid’s economic productivity. Rodriguez M et al.(9) used a refined system for managing islanded microgrids, utilizing fuzzy control to modify the parameters of fuzzy logic control via particle swarm optimization and a cuckoo search algorithm, aiming to lower the operational expenses of microgrids.
As microgrid power supply technology evolves and China actively pursues the “dual carbon goals″,10 microgrids operators must take into account not just economic effectiveness but also the environmental effects of carbon emissions and the longevity of different components in the system, like energy storage systems. Fan Zixiao et al.(11) unveiled an enhanced third-generation multiobjective genetic algorithm designed to address the economic challenges faced by microgrids, focusing on reducing operational expenses, energy storage and discharge capacities, and pollution. Factoring in limitations like the power equilibrium and each unit’s output, they implemented quantum local search to address the issue, enhancing the overall search capability; Wang Shizhen et al.(12) examined various operational tactics for microgrid clusters, focusing on reducing investment expenses and factoring in the lifespan of energy storage services. The particle swarm optimization algorithm was employed to enhance efficiency, reduce operational expenses, and prolong the lifetime of energy storage facilities; Xiao Hao et al.(13) suggested a two-tiered optimization approach for microgrids, taking into account operational expenses and the longevity of energy storage. This model employs a grid-adaptive direct search and particle swarm optimization algorithm to enhance performance, decreasing the depth of charging and discharging for energy storage batteries in order to extend their longevity, and boost the system’s overall efficiency.
The existing research results indicate that both economic benefits and low-carbon factors are crucial in optimizing the operation of low-voltage DC microgrids, and an effective optimization method can significantly improve the operational efficiency and reliability of microgrids. In response to the above issues, a diverse approach for optimizing control in low-voltage DC microgrids, utilizing the Nondominated Sorting Arctic Puffin Optimization Algorithm (NSAPOA) under given photovoltaic and energy storage capacities is proposed in this paper. In order to eliminate the uncertainty of output, Wasserstein Generative Adversarial Network with Gradient Penalty (WGAN-GP) and K-means clustering method are used to generate typical output scenarios of photovoltaic and loads. By analyzing the correlation relationship between various system operation modes and electricity prices, relevant energy exchange strategies are formulated. With the objectives of minimizing daily operating costs, equivalent battery charging and discharging capacity, and reducing carbon dioxide emissions, an optimization operation model of the low-voltage DC microgrid that takes into account battery lifespan is established to improve the reliability of the microgrid is established. In the optimization process, the Non-Dominated Sorting Arctic Puffin Optimization Algorithm (NSAPOA) is used to obtain the Pareto optimal solution set, and the final optimal solution is derived using the Multi Attribute Boundary Approximate Area Comparison (MABAC) algorithm, which can further improve the operational efficiency of the microgrid system. Due to the consideration of DC loads connected to the grid and power limitations of converters, the technique suggested in this document significantly enhances the system’s energy efficiency, reduces carbon dioxide emissions, and maintains the reliability of the power supply.
2. Typical Scenarios of Photovoltaic and Load Generated by WGAN-GP
2.1. The Structure of Low-Voltage DC Microgrid System with Photovoltaic and Energy Storage
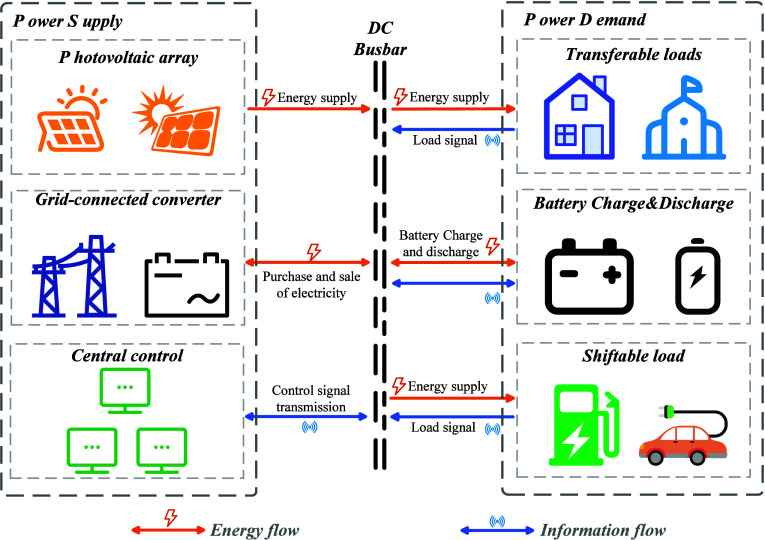
The low-voltage DC microgrid system consists of distributed photovoltaics, energy storage batteries, control systems, grid connected converters, and user loads. The aspect of power generation encompasses solar energy production, power grids, and energy storage devices; The central distribution system consists of a DC bus and a central control system, in which the DC bus is responsible for the flow of energy, and the control system is responsible for collecting signals and executing control instructions; The user loads include smart meters, household loads, electric vehicle DC loads, etc.; Smart meters serve the purpose of collect, measure, and transmit energy information from user data, equipped with smart features like two-way multirate measurement and user management. The structure of low-voltage DC microgrid system with photovoltaic and energy storage is shown in Figure 1.
Figure 1.
Structure of low-voltage DC microgrid system with photovoltaic and energy storage.
In Figure 1, energy storage and photovoltaic power generation systems coordinate with each other to achieve efficient energy utilization and stable system operation. When the photovoltaic power is greater than the load power, a portion of the photovoltaic power is converted into AC power by the inverter to supply power to the load, and the remaining inverter stores the electrical energy in the energy storage system; When the photovoltaic power cannot meet the load demand, the inverter will convert the stored energy in the energy storage system to supply the load, ensuring the continuity and stability of the entire system operation.
2.2. Typical Scenario Generation of Photovoltaic and Loads
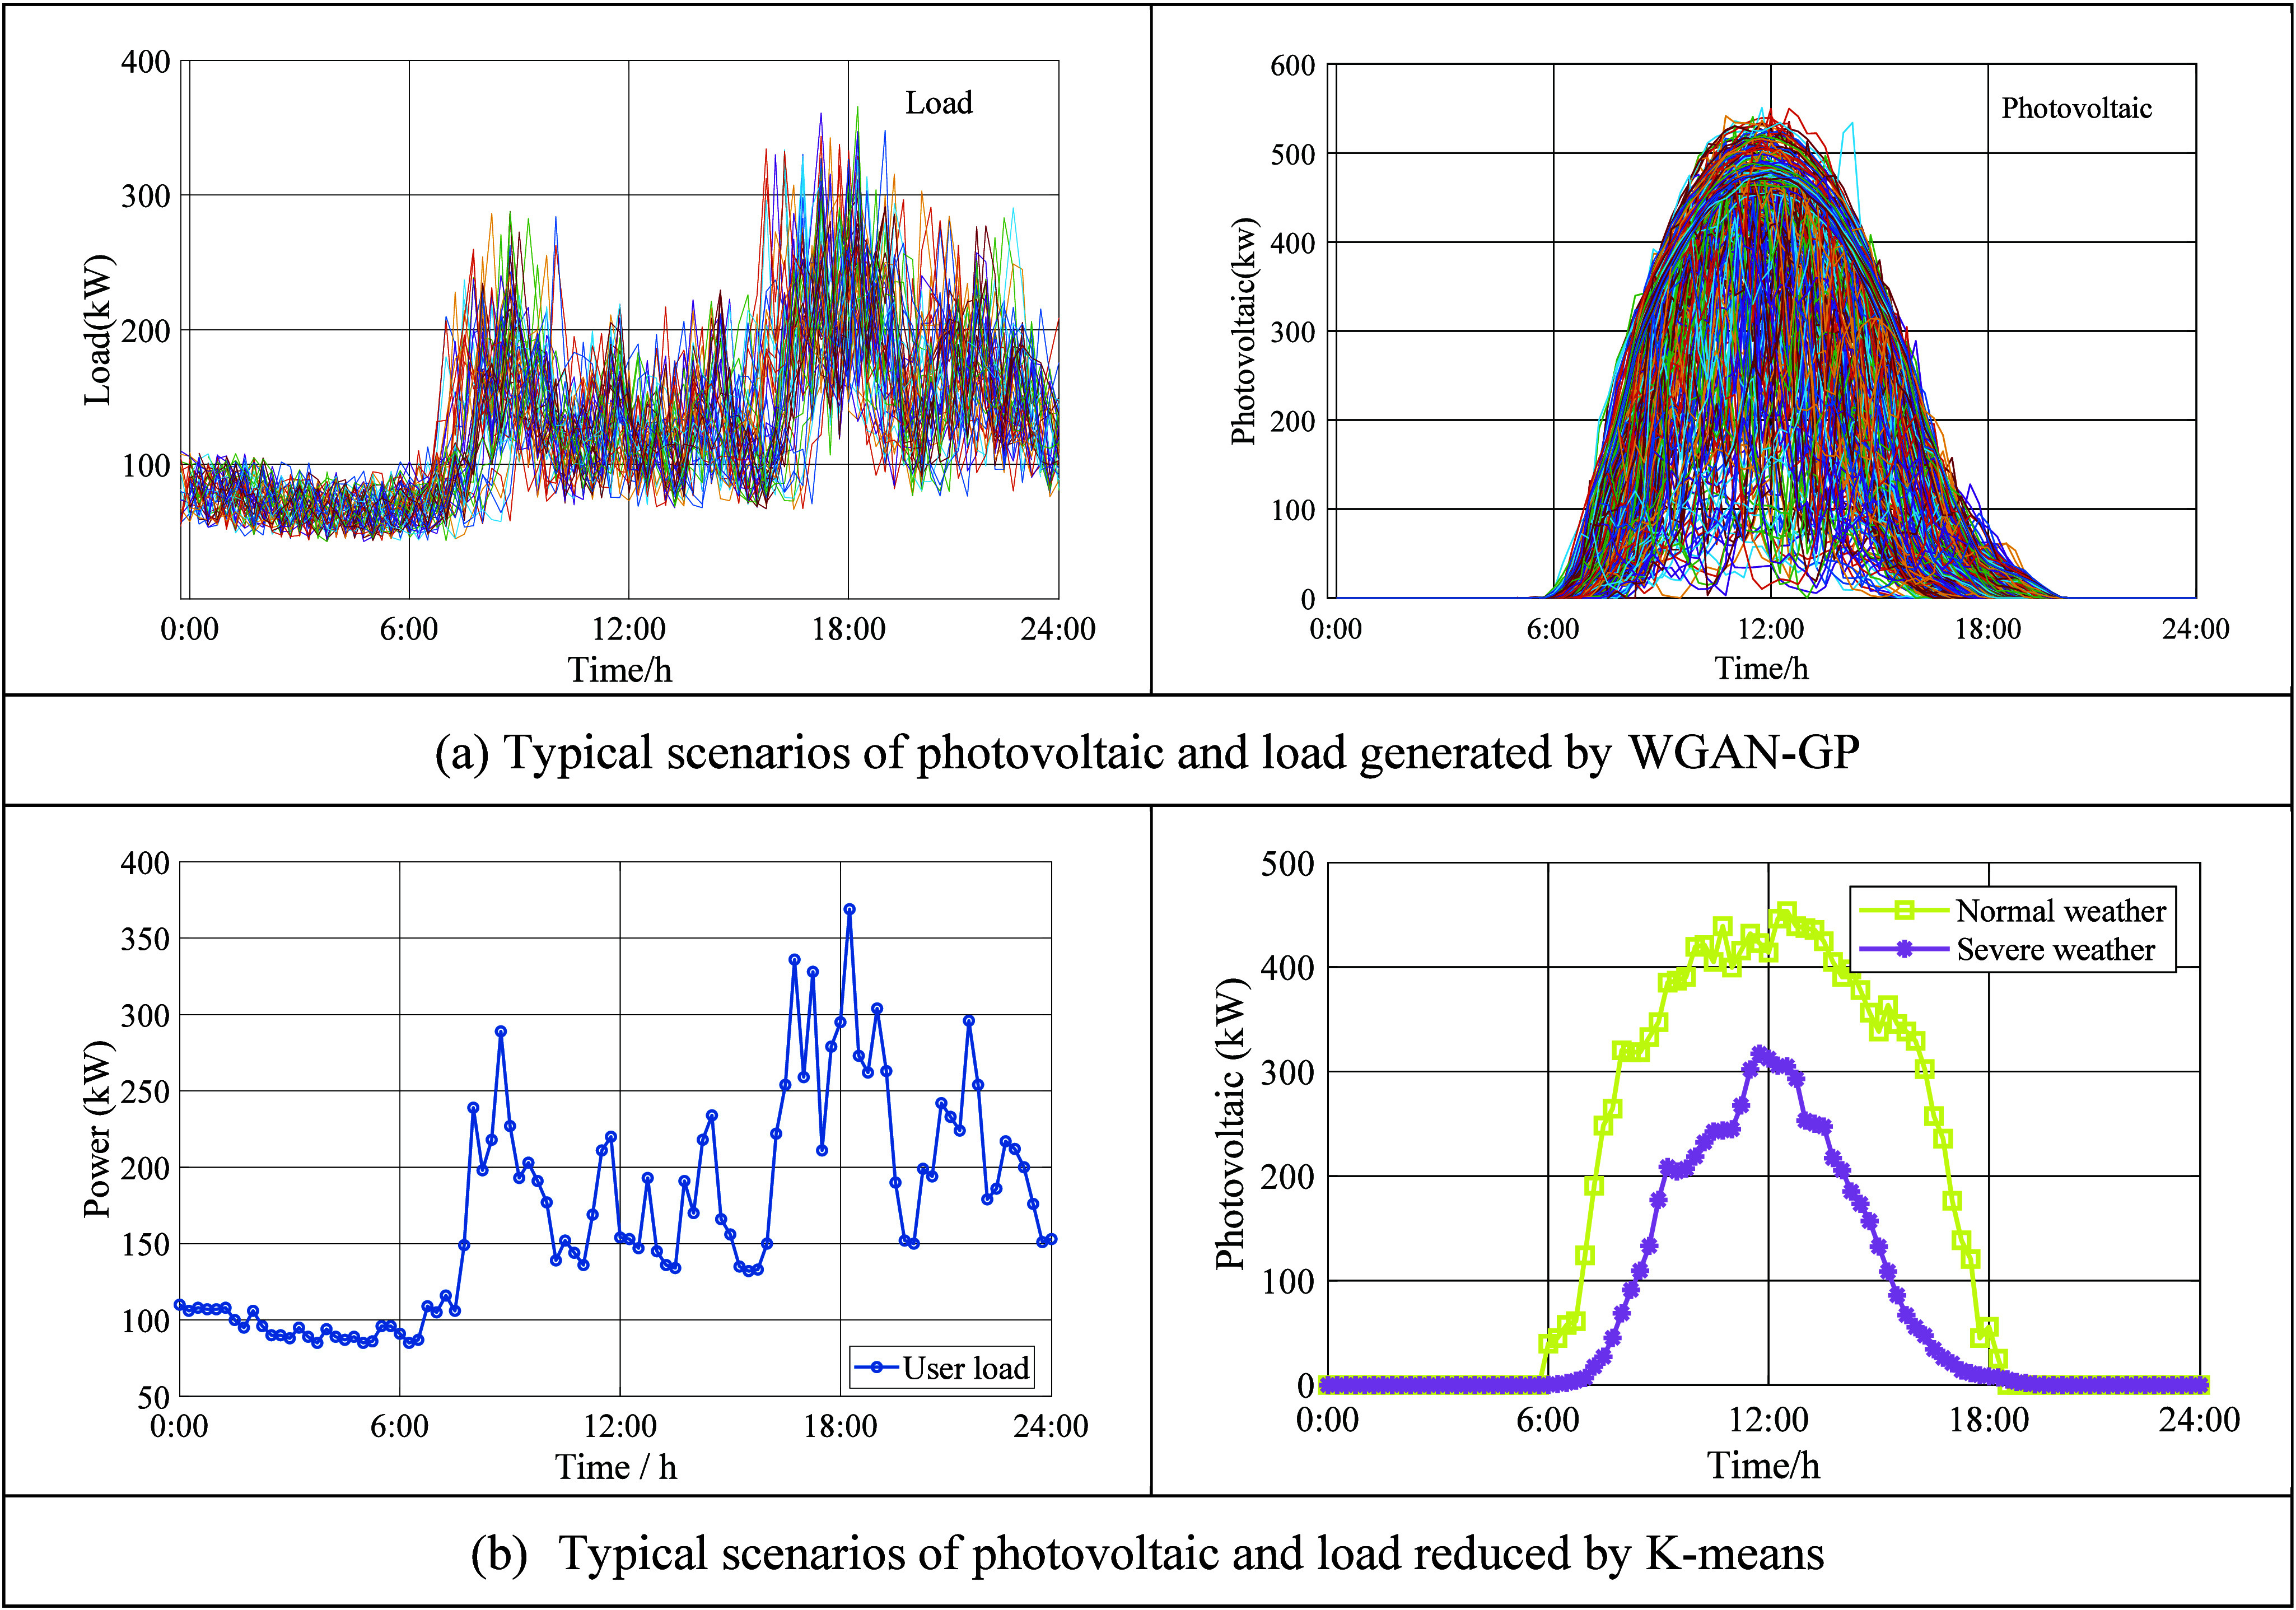
Due to factors such as weather, photovoltaic and load output have strong uncertainty. To address the above issues, the Wasserstein Generative Adversarial Networks with Gradient Penalty (WGAN-GP14) is used to generate typical output scenarios for photovoltaics and loads, and the K-means clustering method is applied to reduce the dimensionality of the generated scenarios. WGAN-GP enhances algorithmic efficiency by penalizing the gradient norm of the critic’s inputs, rather than clipping weights. Compared to traditional WGAN, WGAN-GP demonstrates superior performance and facilitates a stable training process. Additionally, when using WGAN-GP, almost no hyperparameter adjustments are necessary.
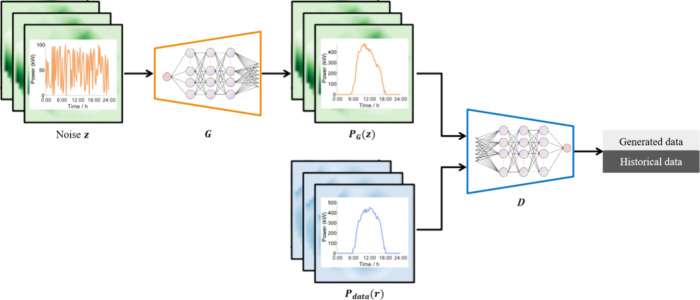
Figure 2 illustrates the core structure of WGAN-GP used for generating renewable energy and load scenarios. Figure 2 primarily consists of a pair of deep neural network models, with generator G and discriminator D. Both G and D may include convolutional neural networks or fully connected neural networks. The generator G, through understanding the possible distribution of past renewable energy photovoltaic or load data, analyzes the noise signal z, adhering to the probability distribution Pz(z) (like Gaussian distributions), to derive the resultant data f = G(z) in line with the probability distribution PG(z). G’s objective is to align the probability distribution G(z) of the produced data with that of the historical data. The discriminator evaluates both the generator’s generated data G(z) and the historical data r which aligns with the probability distribution Pdata(r) and calculates the likelihood D(G(z)) of the produced data G(z) mirroring the actual distribution Pdata(r). D’s aim is to ascertain as precisely as possible if the input data is historical or generated.
Figure 2.
Structure of WGAN-GP
Once the training goals of G and D are established, constructing the loss functions LG and LD of G and D respectively, is essential for training purposes. In the case of G, a reduced LG indicates an increased likelihood of the produced data adhering to Pdata(r). In the case of D, a lesser LD indicates D’s enhanced capability to differentiate among various data sources. LG and LD can be depicted in the following manner:
| 1 |
| 2 |
where Original discriminator
loss =  , Gradient penalty =
  ,x̂ = ξx + (1 – ξ)G(z), ξ
∼ U[0,1],λ symbolizes the gradient penalty
term’s weight coefficient, while ∥ · ∥2 signifies the ι2-norm.
To facilitate concurrent game training for G and D, we merge eqs 1 and 2 to develop a minimum-maximization game model focusing on the value function V(D, G):
| 3 |
As iterations advance, G modifies the generator network’s weight to increasingly resemble the actual sample, while the discriminator network enhances its discriminant capacity via learning. The process involves continuous cycles until the discriminator network fails to precisely identify the origin of the input data sample, after which the generator undergoes training to create photovoltaic and load situations. The load and PV data used for WGAN-GP model training both come from North China. Figure 3 (a) displays the outcomes of creating photovoltaic and load scenarios via WGAN-GP, while Figure 3 (b) illustrates the effects of scenario reduction using the k-means clustering technique.
Figure 3.
Typical scenarios generation of photovoltaic and load.
2.3. Operation Mode and Working Condition Division of the System
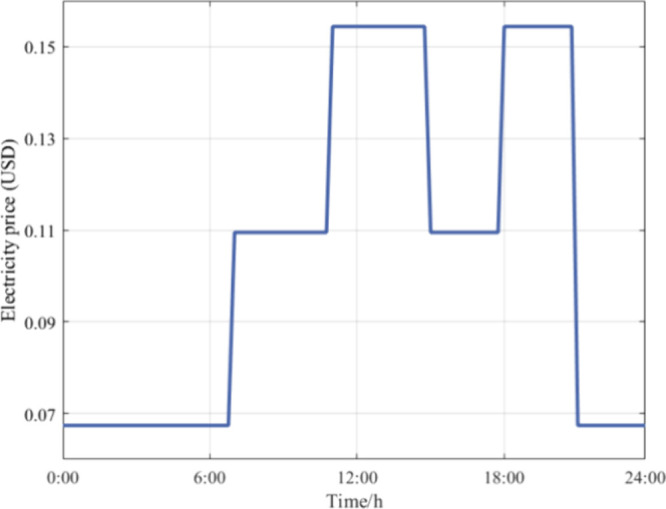
The electricity of low-voltage DC microgrids in multiple scenarios comes from photovoltaic power generation and electricity purchased from the large grid. The principle of energy exchange is to prioritize the consumption of photovoltaics, the energy storage system charges when the load is low, the energy storage system discharges when the load is high, and the purchase of electricity is reduced from the grid in the peak period. Figure 4 displays the spot electricity pricing graph for a specific day, with the data from the time-of-use electricity prices in northern China.
Figure 4.
Curve of time-of-use electricity prices
It can be seen from Figure 4 during 1:00–7:00 and 22:00–24:00, the time-of-use electricity price belongs to the valley period, with a minimum of 0.0674 USD in the whole day; during 8:00–11:00 and 16:00–18:00, the time-of-use electricity price belongs to the flatting period, with a tariff of 0.1095 USD; during 12:00–15:00 and 19:00–21:00, the time-of-use electricity price belongs to the peek period, with the highest tariffs of 0.1544 USD in the whole day.
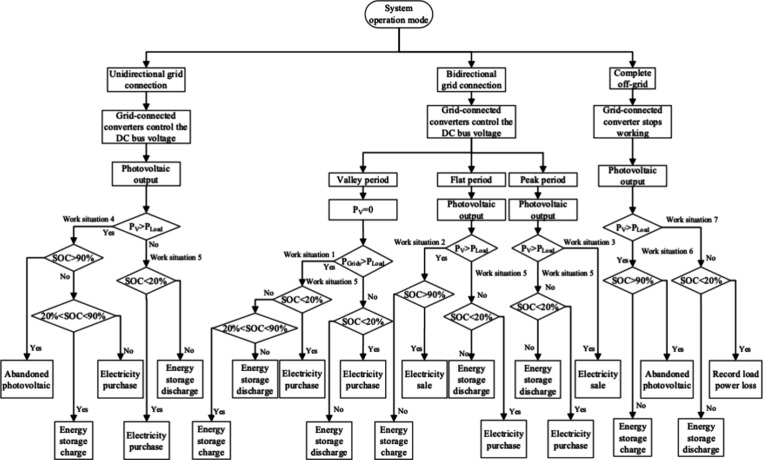
Compared to traditional AC microgrids, the energy flow of DC microgrids is achieved with the grid through grid-connected converters. Therefore, the different operating modes of the system are determined by the different working states of grid-connected converters.15 The working states of grid-connected converters mainly include stop working, unidirectional connection, and bidirectional connection. The corresponding operating modes of DC microgrids are off-grid, unidirectional connection, and bidirectional connection. The grid-connected operation mode is divided into operating conditions 1–5, and the off-grid operation mode is divided into operating conditions 6–7. The different operating modes and operating conditions of the system combined with the time of use electricity price are shown in Figure 5.
Figure 5.
Operation mode and working condition division of the system.
2.3.1. Bidirectional Grid Connection Mode
The system purchases and sells electricity from the grid through grid-connected converters to meet the load demand, achieving bidirectional energy flow with the grid and reducing load shortage caused by insufficient power generation.
Condition 1
In the valley period, when the output of photovoltaic power PV is 0, the output of the DC microgrid is sufficient, that is, Pgrid > Pload. If the SOC of the energy storage system is less than 20%, the energy storage system is charged by purchasing electricity from the grid; If the SOC of the energy storage system is between 20% and 90%, the energy storage system is in a charging state; If the SOC of the energy storage system is greater than 90%, the system will switch to a discharge state and supply power together with the DC microgrid to meet the load demand; When Pgrid < Pload, switch to Condition 5.
Condition 2
In the flat period, when PV > Pload, if the SOC of the energy storage system is greater than 90%, the excess electricity is sold to the grid through grid-connected converter, and the grid-connected interface is in an inverter state; If the SOC of the energy storage system is less than 90%, the energy storage system is in a charging state. When PV < Pload, switch to working Condition 5.
Condition 3
In the peak period, when PV > Pload, except for supplying the load, all excess electrical energy is sold to the grid through grid-connected converters, and the grid-connected interface is in an inverter state; When PV < Pload, switch to Condition 5.
2.3.2. Unidirectional Grid Connection Mode
The energy flow of grid-connected converters operates in a unidirectional manner, meaning that the system can only purchase electricity from the grid through grid-connected converters and cannot sell electricity, resulting in the abandoned photovoltaic.
Condition 4
When PV > Pload, if the SOC of the energy storage system is greater than 90%, it is in a state of the abandoned photovoltaic; If the SOC of the energy storage system is between 20% and 90%, the energy storage system switches to the charging state; If the SOC of the energy storage system is less than 20%, the system is charged by purchasing electricity from the grid through grid-connected converters; When PV < Pload, switch to Condition 5.
Condition 5
When PV < Pload or Pgrid < Pload, if the SOC of the energy storage system is greater than 20%, the energy storage system discharges to meet the load demand; If the SOC of the energy storage system is less than 20%, the load demand can be met by purchasing electricity from the grid through grid-connected converters.
2.3.3. Off-Grid Mode
The grid-connected converter stops working and only relies on the output of photovoltaic and energy storage system for power supply. The DC microgrid operates as an independent system in off grid mode, achieving independent generation and distribution of electricity.
Condition 6
When PV > Pload, if the SOC of the energy storage system is greater than 90%, it enters the abandoned photovoltaic state; If the SOC of the energy storage system is less than 90% and the energy storage system is charging, then the energy storage system will be charged by all excess energy.
Condition 7
When PV < Pload, When the SOC of an energy storage system exceeds 20%, it remains in a state of discharge to satisfy the load requirements; conversely, if the SOC falls below 20%, the insufficient power will be recorded as load loss of power.
In summary, through the analysis of energy exchange strategies, in the bidirectional grid connected operation mode, due to the bidirectional energy flow between the low-voltage DC microgrid and the power grid, the system has advantages such as good economy, high reliability, and low abandoned photovoltaic. Therefore, this paper mainly focuses on the research of optimization control methods for low-voltage DC microgrid systems in connected-grid operation mode.
3. Estimation of Battery Life Using the Equivalent Electric Quantity Weighting Method
When lithium iron phosphate batteries participate in the optimization operation of low-voltage DC microgrids as energy storage links, their capacity progressively diminishes from the rated level, correlating with the rise in full charging and discharging cycles and alterations in discharge depth. The main methods for evaluating battery life include curve fitting method,16 rain flow counting method,17 and equivalent power weight method.18 In contrast to the other two methods, the equivalent electricity weight method considers the equivalent discharge amount during battery charging and discharging cycles. In the optimized operation of low-voltage DC microgrids, batteries have different charging and discharging powers and depths at different times, and the equivalent electricity weight method can effectively evaluate the battery life and calculate the battery life loss based on the equivalent cumulative discharge amount. The calculation formula can be described as eq 4.
| 4 |
where Atotal represents a battery’s total discharge capacity over its entire life cycle (kW·h), equivale to the product of the number of cycles of the battery and its rated capacity; Ac is the equivalent cumulative discharge of the battery during the period (kW·h).
The equivalent cumulative discharge of the battery can be yielded by eq 5.
| 5 |
where λsoc is the weight factor; As is the actual discharge capacity (kW·h).
The weight factor can be obtained by eq 6.
| 6 |
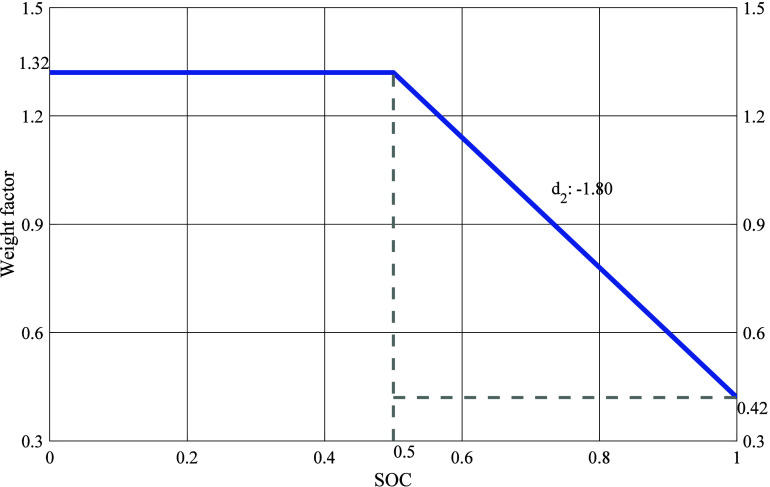
The relationship between weight factor values and SOC is shown in Figure 6.19
Figure 6.
Relationship between weight factor values and SOC.
It can be seen from Figure 6 that when 0 < SOC(t) ≤ 0.5, the weight factor is only related to d1, here d1 = 1.32. When 0.5 < SOC(t) ≤ 1, the weight factor is related to the values of d2 and d3, where here d2=-1.8, d3 = 2.22. During operation, the life loss of the battery is accumulated to obtain the battery life at time t, as shown in eq 7.
| 7 |
4. Optimization Control Model for Low-Voltage DC Microgrid Based on NSAPOA
The optimization control of low-voltage DC microgrid system aims at system economy, environmental protection, and safety, fully considering system balance and constraints such as energy storage charging and discharging power, to achieve economic and low-carbon operation of low-voltage DC microgrid system.
4.1. Objective Function
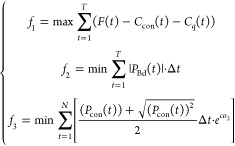
The objective function is to maximize daily net income, minimize equivalent total battery charge and discharge, and minimize CO2 emissions. The overall objective function expression is described as eq 8.
 |
8 |
4.1.1. Maximum Daily Net income
Assume that the purchase cost for photovoltaic panels and batteries based on a given capacity configuration is fixed. In actual operation, due to different daily loads, photovoltaic output and real-time electricity prices, the amount of electricity purchased and sold and the amount of abandoned solar energy each day are different. Therefore, the daily net income is mainly related to the income from selling electricity to the user load every day, as well as the cost of purchasing and selling electricity from the grid through grid-connected converters and the cost of abandoned solar energy. The objective function f1 can be described as eq 9.
| 9 |
 |
10 |
where F(t) is the electricity sales revenue to the user load at time t(USD); Ccon(t) is the cost of purchasing and selling electricity through the grid-connected converter at time t(USD); Cq(t) is the cost of abandoned photovoltaic at time t(USD); Pload(t) is the user load at time t (kW); Rprice(t) is the real-time electricity price at time t(USD/kW·h); Pcon(t) is the power of the grid-connected converter at time t (kW); When Pcon(t)>0, the system purchases electricity from the grid through a grid-connected converter, and sells electricity to the grid when Pcon(t)<0; Cbuy(t) and Csale(t) are the unit purchase price and unit sales price (USD/kW·h) at time t, respectively; Pq(t) is the power of abandoned photovoltaic at time t (kW); c is the corresponding unit cost of abandoned photovoltaic (USD/kW·h).
4.1.2. Minimum Equivalent Full Cycle Counts of the Battery
A battery’s time of service can be accurately calculated using the equivalent electric quantity weighting method, and the total equivalent discharge amount is equivalent to the total discharge amount under the charging and discharging cycle of the battery at different discharge depths. During operation, it is also necessary to consider the battery’s SOC to store excess electricity to absorb photovoltaic energy. Therefore, the objective function f2 is to minimize the equivalent charge and discharge capacity of the battery, as shown in eq 11.
| 11 |
 |
12 |
where PBd(t) represents the equivalent power of charging and discharging at time t (kW); PB(t) represents the battery’s actual output/input power at time t (kW); λsoc is the weight factor; SOC(t) is the battery’s state of charge at time t.
4.1.3. Minimum Carbon Emission
Based on the dual carbon target background, minimize emissions of CO2 during operation and add the minimum emissions of CO2 to the objective function. In the system operation model, there are no diesel generators, gas turbines, and other units. The load is met by photovoltaic, energy storage, and electricity purchase from the grid. Only when the electricity is purchased from the grid through grid-connected converters, carbon emissions can occur. Therefore, the minimum emissions of CO2 is regarded as the objective function f3. It can be given in eq 13.
| 13 |
where eco2 is the amount of carbon dioxide (kg/kW·h) that needs to be emitted from the power grid for every kW·h.
4.2. Constraints
4.2.1. Power Balance Constraint
| 14 |
where Pload(t) is the load power of the user at time t (kW); Ppv(t) is the photovoltaic power at time t (kW); Pcon(t) is the power of the grid connected converter at time t (kW); PB(t) is the energy storage charging and discharging power at time t (kW).
At every moment, the total load power should be equal to the total of the power from energy storage, (both charging and discharging) the power emitted from photovoltaic sources, and the energy exchanged from the grid via grid-linked converters.
4.2.2. Current Limitation Constraint
Ensuring that the current used for charging and discharging lithium iron phosphate batteries during use is not excessively high is crucial to avoid permanent harm and potential ignition of the battery. The current should not be greater than 0.3Iin when charging, and 0.5Iin when discharging.
 |
15 |
where Ic is the charging current (A); Id is the discharging current (A); UEV is the discharging voltage (A); Eb is the rated capacity (kW·h).
4.2.3. Power Limitation Constraint
The charging and discharging power ought to be less than the power rated for energy storage. When the power used for charging and discharging exceeds the rated limit, the battery’s over elevated temperature can trigger explosions, compromising its safety and operational stability.
| 16 |
where Prate represents the battery’s rated power (kW).
4.2.4. SOC Constraint
| 17 |
 |
18 |
where SOCmin and SOCmax are the upper and lower limits of the SOC of the battery, respectively; ηdc refers to the energy conversion efficiency of the battery in discharging; ηch represents the energy conversion efficiency of the battery in charging.
4.2.5. Grid-Connected Converter Constraints
The grid-connected converter adjusts its transmission power based on power instructions, and when it reaches its power limit, it operates at rated power.
| 19 |
where Pcon(t) is the power of the grid-connected converter at time t (kW); Prcon is the rated power of the grid-connected converter (kW).
4.3. Model Solving
Wang et al.(20) introduced the Arctic puffin optimization algorithm (APOA) in 2023, introduces an innovative meta heuristic algorithm centered on population dynamics, drawing inspiration from the collective dynamics and survival abilities of Arctic puffins in aerial and diving hunting. The APOA includes two stages: exploration and exploitation, corresponding to aerial flight and underwater foraging. In the APO algorithm, the behavioral conversion factor B demonstrates both adaptability and dynamic behavior, adeptly harmonizing the dynamic interplay of exploration and exploitation and play an important role in the algorithm’s robustness. The algorithm employs Levy flight coefficients and synergy factor to boost convergence in its development stage, incorporating behavioral transition factors to maintain a balance between exploration and exploitation, thereby offering almost universally optimal answers to intricate optimization challenges.
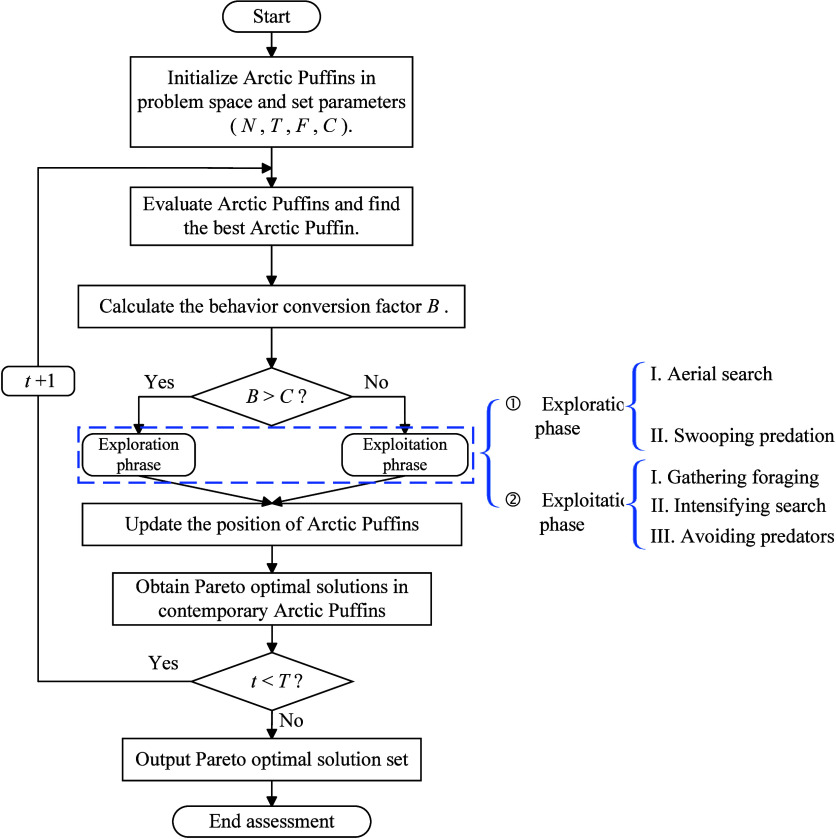
Solving multiobjective optimization issues often involves addressing a range of contradictory goals, with some focusing on maximizing functions and others on minimizing functions.21 For addressing the issue of multiobjective optimization, NSAPOA, a hybrid algorithm for nondominant sorting, has been created, utilizing the technology of nondominant sorting optimization. Figure 7 illustrates the methodology of the NSAPOA.
Figure 7.
Process of the NSAPOA
The algorithm implementation process of the NSAPOA is as follows:
4.3.1. Step1:
Set control parameters, initialize the number individuals in the Arctic puffin colony, the number of iterations, cooperative factor, factor reference value of behavior conversion and initializing positions of Arctic Puffins.
4.3.2. Step2:
Evaluate each position of Arctic Puffins and finding the one with the best fitness in all of Arctic Puffins. Calculate the behavior conversion factor B of the one has best fitness.
| 20 |
where rand represents a random figure within the range (0,1), and t and T denote the present and maximum iteration numbers, in that order. During its initial phase, the Arctic Puffin tends to seek appropriate feeding waters, but in its advanced stages, it shifts its focus to scuba diving for sustenance.
4.3.3. Step3:
Compare the size of the behavioral conversion factor B with its reference value C to deter mine the next behavior phase of the Arctic Puffin.
4.3.3.1. Exploration Phase
-
1)Aerial Search Strategy
where r represents a random integer ranging from 1 to N – 1, excluding i; Xti→ denotes the population’s present ith potential solution; Xtr→ represents a randomly chosen candidate solution from the existing population, with Xti→ ≠ Xtr → ; L(D) represents a stochastic figure produced via Levy flight; D signifies the dimensionally; α ∼ Normal(0,1) symbolizes a stochastic shape conforming to a standard normal distribution sequence.
21 -
2)Swooping Predation Strategy
where S = tan ((rand – 0.5) * π) serves as a speed variable to modify the puffin’s movement during a swoop.
22
where Xt+1i→ is the new population; Yt+1i → , Zt+1i→ indicate different positions in the current phase.
23
4.3.3.2. Exploitation Phase
-
1)Gathering Foraging
where F symbolizes the collaborative element, modifying the predatory actions of Arctic puffins. Within this document, F is set to 0.5; Random integers r1, r2, r3 fall within the range of 1 to N – 1, i not included, and Xtr1 → , Xtr2 → , Xtr3→ represent randomly chosen potential solutions from the existing population, and r1 ≠ r2 ≠ r3, Xtr2→ ≠ Xtr3 →.
24 -
2)Intensifying Search
where T signifies the aggregate count of iterations, and t indicates the present iteration tally. rand is a stochastic figure, symbolizing variations derived from the original position.
25 -
3)Avoiding Predators
where β represents a random number distributed evenly from 0 to 1; F serves as an adaptive variable to modify the Arctic puffin’s location in aquatic environments.
26
where Xt+1i→ is the new population; Wt+1i → , Yt+1i → , Zt+1i→ indicate different positions in the current phase.
27
4.3.4. Step4:
Update the phase, stages and position of Arctic puffins, and redo fitness computations to derive the Pareto optimal set of solutions until the cycle count is attained, and terminate the output.
4.3.5. Step5:
The algorithm concludes once the quantity of public iterations is restricted. Otherwise, move on to 4.3.2.
4.3.6. The MABAC method
While the NSAPOA is capable of deriving the Pareto optimal solution set for multiobjective programming, it lacks the capability to directly acquire the optimal solution. Utilizing the MABAC22 technique is essential for achieving the best solution. MABAC, an impartial method for assigning weights, calculates the size of the weight by analyzing the relationship between target values or the extent of variation in these values during data processing. To determine the best solution, assess how closely each solution aligns with either the positive or negative ideal solution by analyzing both positive and negative ideal solutions of the issue.
The specific procedure of the MABAC method is as follows:
-
1)
Determine the decision matrix: The performance data of all optional solutions form a decision matrix, where each row represents a solution and each column represents a decision criterion.
-
2)
Standardize the decision matrix: Standardize the decision matrix to ensure that the values of different criteria have the same weight.
-
3)
Calculate relative importance: Determine the relative importance of each solution under different criteria by calculating the performance score of each solution under different criteria.
-
4)
Calculate the fuzzy matrix: Calculate the fuzzy matrix of each solution to other solutions based on relative importance.
-
5)
Calculate the fuzzy comprehensive score: Using the fuzzy matrix, calculate the fuzzy comprehensive score of each solution.
-
6)
Sort and select: Sort all solutions according to the fuzzy comprehensive score, and select the solution with the highest fuzzy comprehensive score as the best solution.
5. Results and Discussion
5.1. Data Sources
The bus voltage of a low-voltage DC microgrid project in a certain area is ±375 V, the rated power of grid-connected converters is 200 kW, the rated power of photovoltaic power stations is Ppv = 488 kW, the rated power of the energy storage is Prate = 220.03 kW, and the capacity of the energy storage is Eb = 1265.77 kW·h. The operation process of the DC microgrid is optimized every 15 min, and the grid-connected converter adopts a bidirectional grid connected operation mode. The actual operation data including load, PV and electricity price are from North China. In order to compare the economic performance of low-voltage DC microgrid systems based on energy storage under different objectives, MOPSO,23 NSGA-II,24 and NSAPOA were used for comparative analysis.
The parameter settings of three optimization algorithms are shown in Table 1. The three objective functions are divided as follows:
Table 1. Parameter Settings for Different Algorithms.
| algorithms | MOPSO | NSGA-II | NSAPOA |
|---|---|---|---|
| parameters | |||
| population size | 100 | 100 | 100 |
| number of decision variable | 96 | 96 | 96 |
| number of iterations | 10,000 | 10,000 | 10,000 |
| global learning factor | 1.7 | 1.5 | |
| mutation probability | 0.1 | ||
| cross probability | 0.8 | ||
| individual learning factor | 1.7 | ||
| maximum speed | 2 | ||
| factor of inertia | 0.9 | 0.9 | |
| synergy factor | 0.5 | ||
| reference value of behavior conversion factor | 0.5 |
f1: Maximize net income;
f2: Minimize carbon emissions;
f3: Minimize equivalent charging and discharging capacity of the battery.
5.2. Comparison of Optimization Effect under Different Targets and Different Methods
5.2.1. Comparison of Optimization Effects Considering Net Income Only
For the optimization model established under a single objective function, PSO, GA and APOA are used to solve the model. The optimization results under a single objective are shown in Table 2. The charging and discharging curve of the energy storage system under a single objective obtained by PSO, GA and APOA is shown in Figure 8.
Table 2. Optimization Results of Different Optimization Algorithms under a Single Objective.
| f1 | net income/USD | carbon emissions/kg | equivalent charging and discharging capacity/kW·h |
|---|---|---|---|
| PSO | 1520.6 | 1197.59 | 2798.40 |
| GA | 2397.79 | 1304.72 | 3042.50 |
| APOA | 2425.52 | 1307.36 | 2957.57 |
Figure 8.
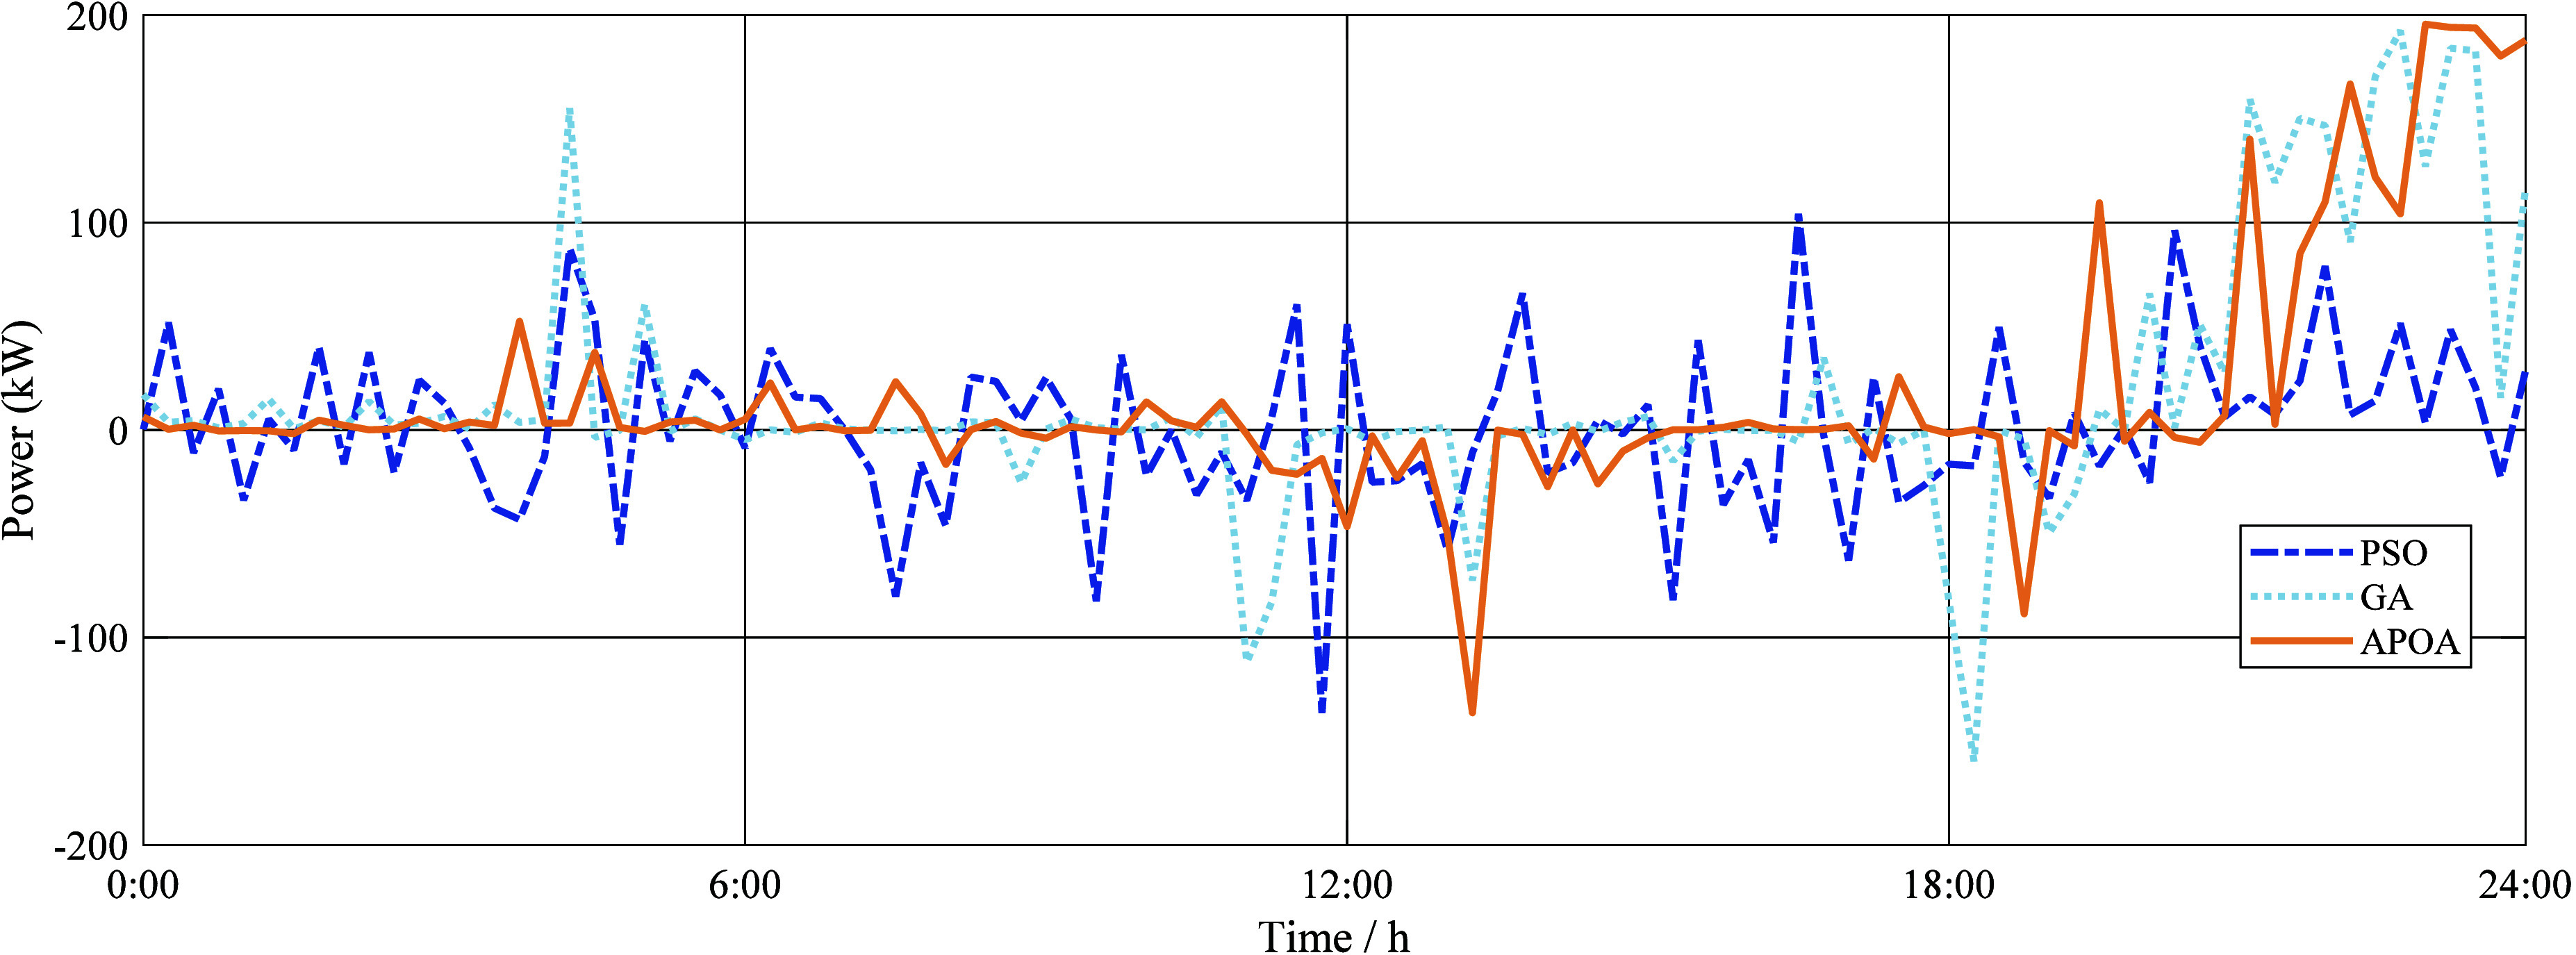
Charging and discharging curve of the energy storage system under a single objective obtained by three algorithms.
It can be seen from Table 2 and Figure 8 that compared with the other two algorithms, the net profit of the DC microgrid system obtained by the APOA is the maximum of 2425.52 USD. However, due to only taking daily net income as the objective function without considering the impact of carbon emissions on the environment, the achievement of the “dual carbon” goal has been hindered. The carbon emission is the maximum of 1307.36 kg. And the equivalent charging and discharging capacity of the energy storage system is 2957.57 kW·h, which is relatively high and can lead to the aging of the energy storage battery.
5.2.2. Comparison of Optimization Effects Considering Net Revenue and Carbon Emissions
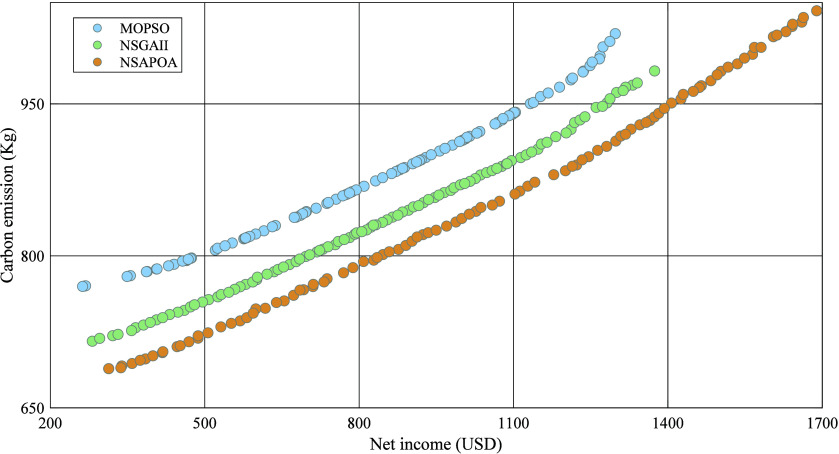
To diminish carbon emissions and showcase the benefits of renewable energy in lowering carbon in DC microgrid systems, carbon emissions are incorporated as the goal function, and a two-pronged optimization model is formulated, taking into account both the overall advantages and carbon emissions. Given that the two goal functions aim for the highest net gains and lowest carbon emissions, a negative indicator precedes the net gains in establishing the function, and a multiobjective algorithm resolves the minimum to fulfill both goals of maximizing net income and reducing carbon emissions.25 The Pareto optimal sets obtained by MOPSO, NSGA-II and NSAPOA are shown respectively in Figure 9.
Figure 9.
Pareto optimal solution set obtained through MOPSO, NSGA-II and NSAPOA.
It can be seen from Figure 9 that the Pareto solution set obtained by the NSAPOA algorithm is optimal compared to the other two algorithms; When the net benefit is equal, the carbon emission obtained by the NSAPOA is the lowest; When carbon emissions are equal, the algorithm optimizes the net benefit to its highest level. The optimal solution is selected from the Pareto sets generated by three optimization algorithms using the MABAC method, with results of 0.097286 (MOPSO), 0.098037 (NSGA-II), and 0.10749 (NSAPOA), respectively.
The power output curves of the battery energy storage system and the optimization results obtained by the three optimization algorithms under the optimal solution are shown in Figure 10 and Table3, respectively.
Figure 10.
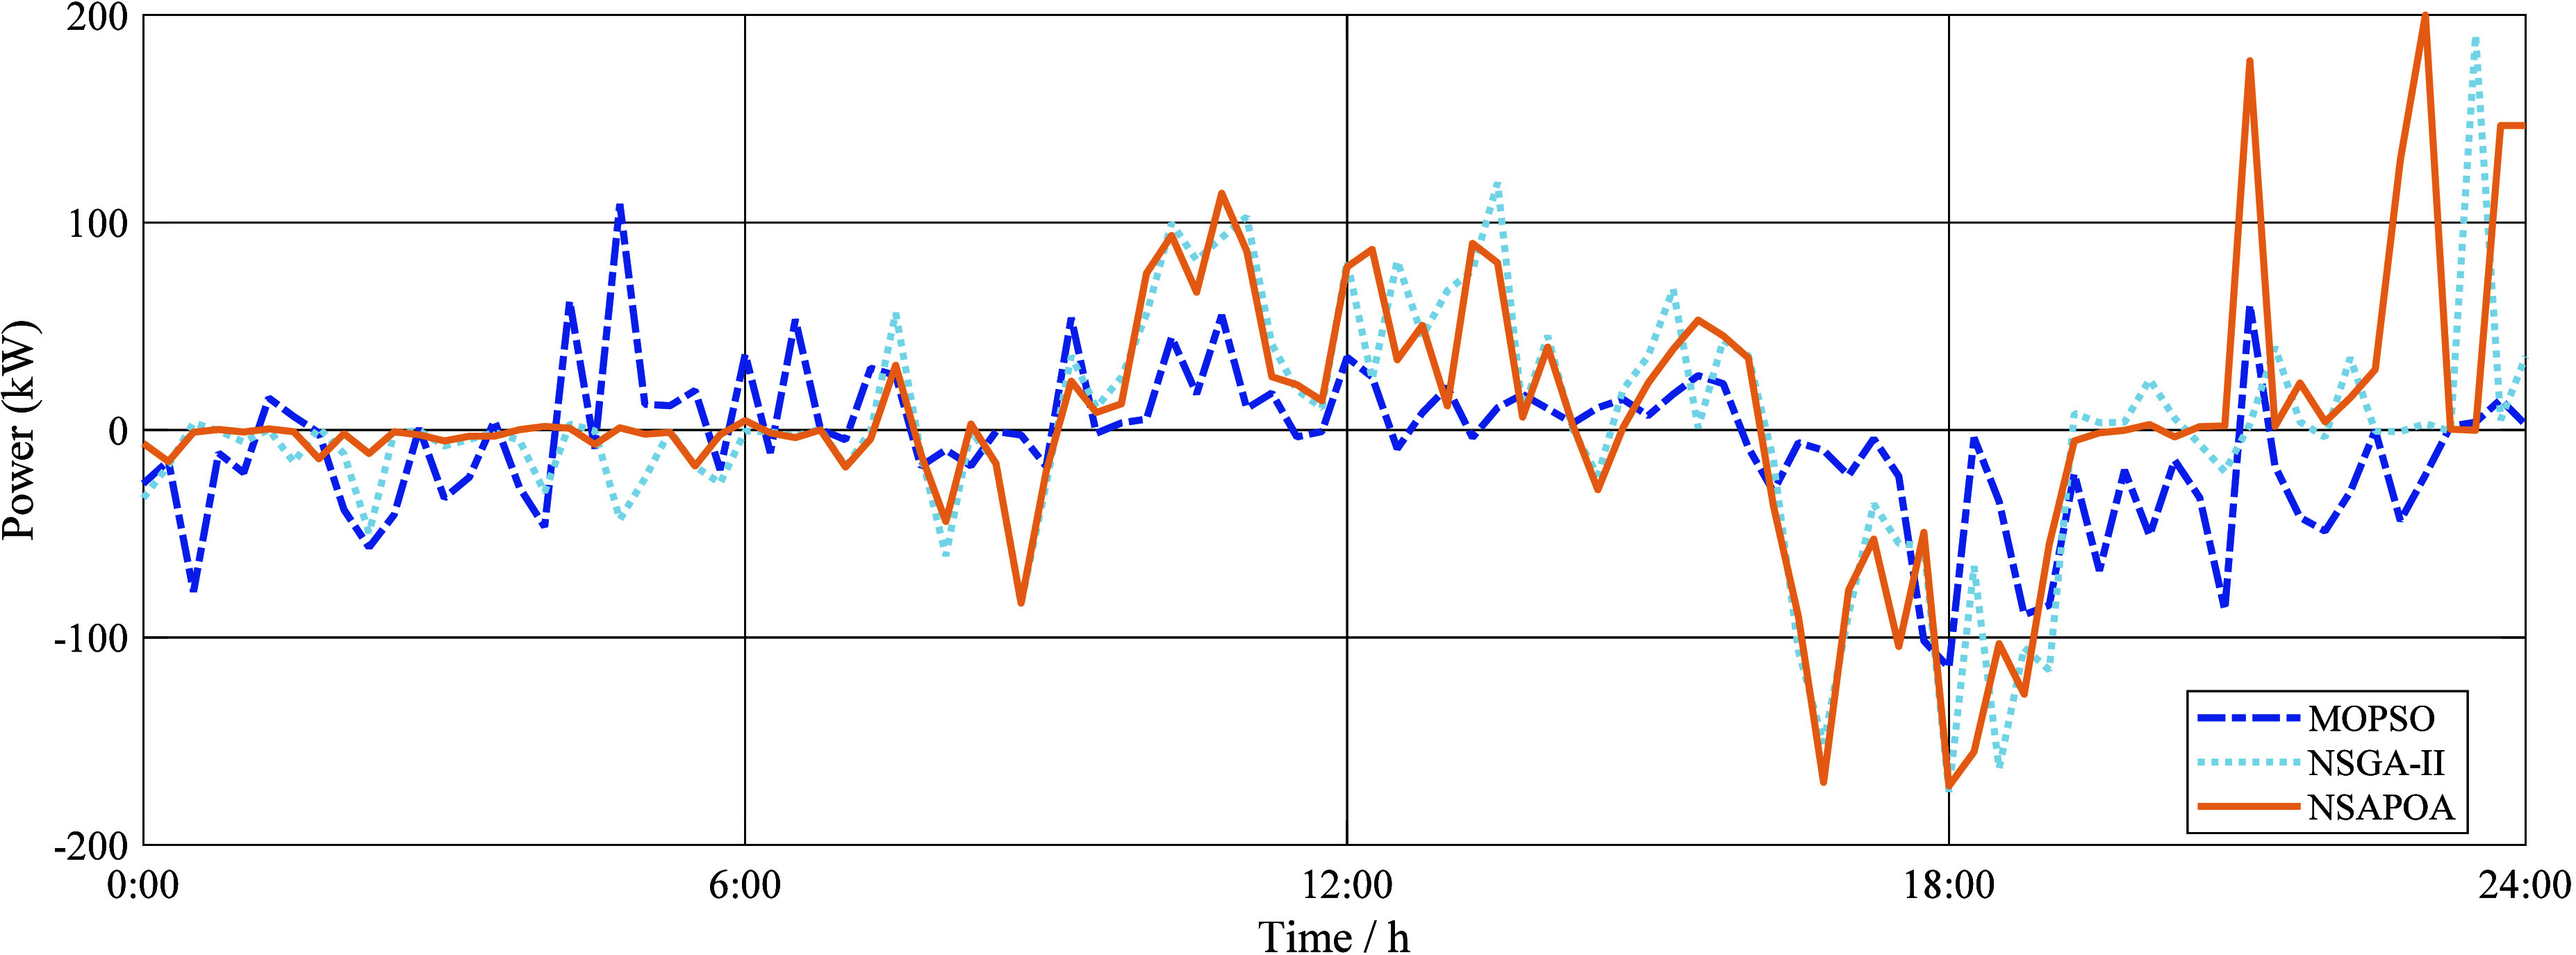
Battery’s output curves of different algorithm’s optimal solution.
Table 3. Comparison Results of MOPSO, NSGA-II and NSAPOA Considering Two Goals.
| f1 & f2 | net income/USD | carbon emissions/kg | equivalent charging and discharging capacity/kW·h | scores |
|---|---|---|---|---|
| MOPSO | 1152.40 | 957.17 | 2724.22 | 0.097286 |
| NSGA-II | 1202.25 | 921.35 | 2786.97 | 0.098037 |
| NSAPOA | 1357.64 | 931.66 | 2836.35 | 0.10749 |
It can be seen from Table 3 and Figure 10 that compared with the other two algorithms, the score obtained by the NSAPOA is the highest. The net income of the DC microgrid system is the maximum of 1357.64, 17.8% higher than the lowest. Carbon emissions is between the results of the other two algorithms in order to achieve a balance between the two goals, but only 1.1% more than the minimum. However, since the third objective is not considered, the equivalent charging and discharging capacity of the three algorithms are all relatively high.
5.2.3. Comparison of Optimization Effects Considering Net Profit, Carbon Emissions, and Service Life of the Battery
To prolong the battery’s service lifespan, the corresponding charge and discharge potential of the energy storage battery are incorporated into the stated objective function, leading to the creation of a multiobjective function optimization system that accounts for net profit, carbon emissions, and the battery’s equivalent charge and discharge capacities. Figure 11 illustrates the range of Pareto solutions derived from MOPSO, NSGA-II and NSAPOA for three goals, where the NSAPOA’s Pareto solution set distribution stands out as the most consistent and comprehensive, boasting robust overall search capabilities.
Figure 11.
Pareto solution sets obtained by different optimization algorithms under three objectives
The optimal solution is selected from the Pareto sets generated by three optimization algorithms using the MABAC method, with results of 0.1233(MOPSO), 0.14476(NSGA-II), and 0.17476(NSAPOA), respectively. The optimization results under three objective functions are shown in Table 4. The output curve of the energy storage system under three objective functions obtained by three multiobjective algorithms is shown in Figure 12.
Table 4. Comparison Results of MOPSO, NSGA-II and NSAPOA Considering Three Goals.
| f1 & f2 & f3 | net income/USD | carbon emissions/kg | equivalent charging and discharging capacity/kW·h | scores |
|---|---|---|---|---|
| MOPSO | 680.72 | 842.17 | 2635.74 | 0.1233 |
| NSGA-II | 882.13 | 880.57 | 2189.57 | 0.14476 |
| NSAPOA | 1082.11 | 857.30 | 2432.69 | 0.17476 |
Figure 12.
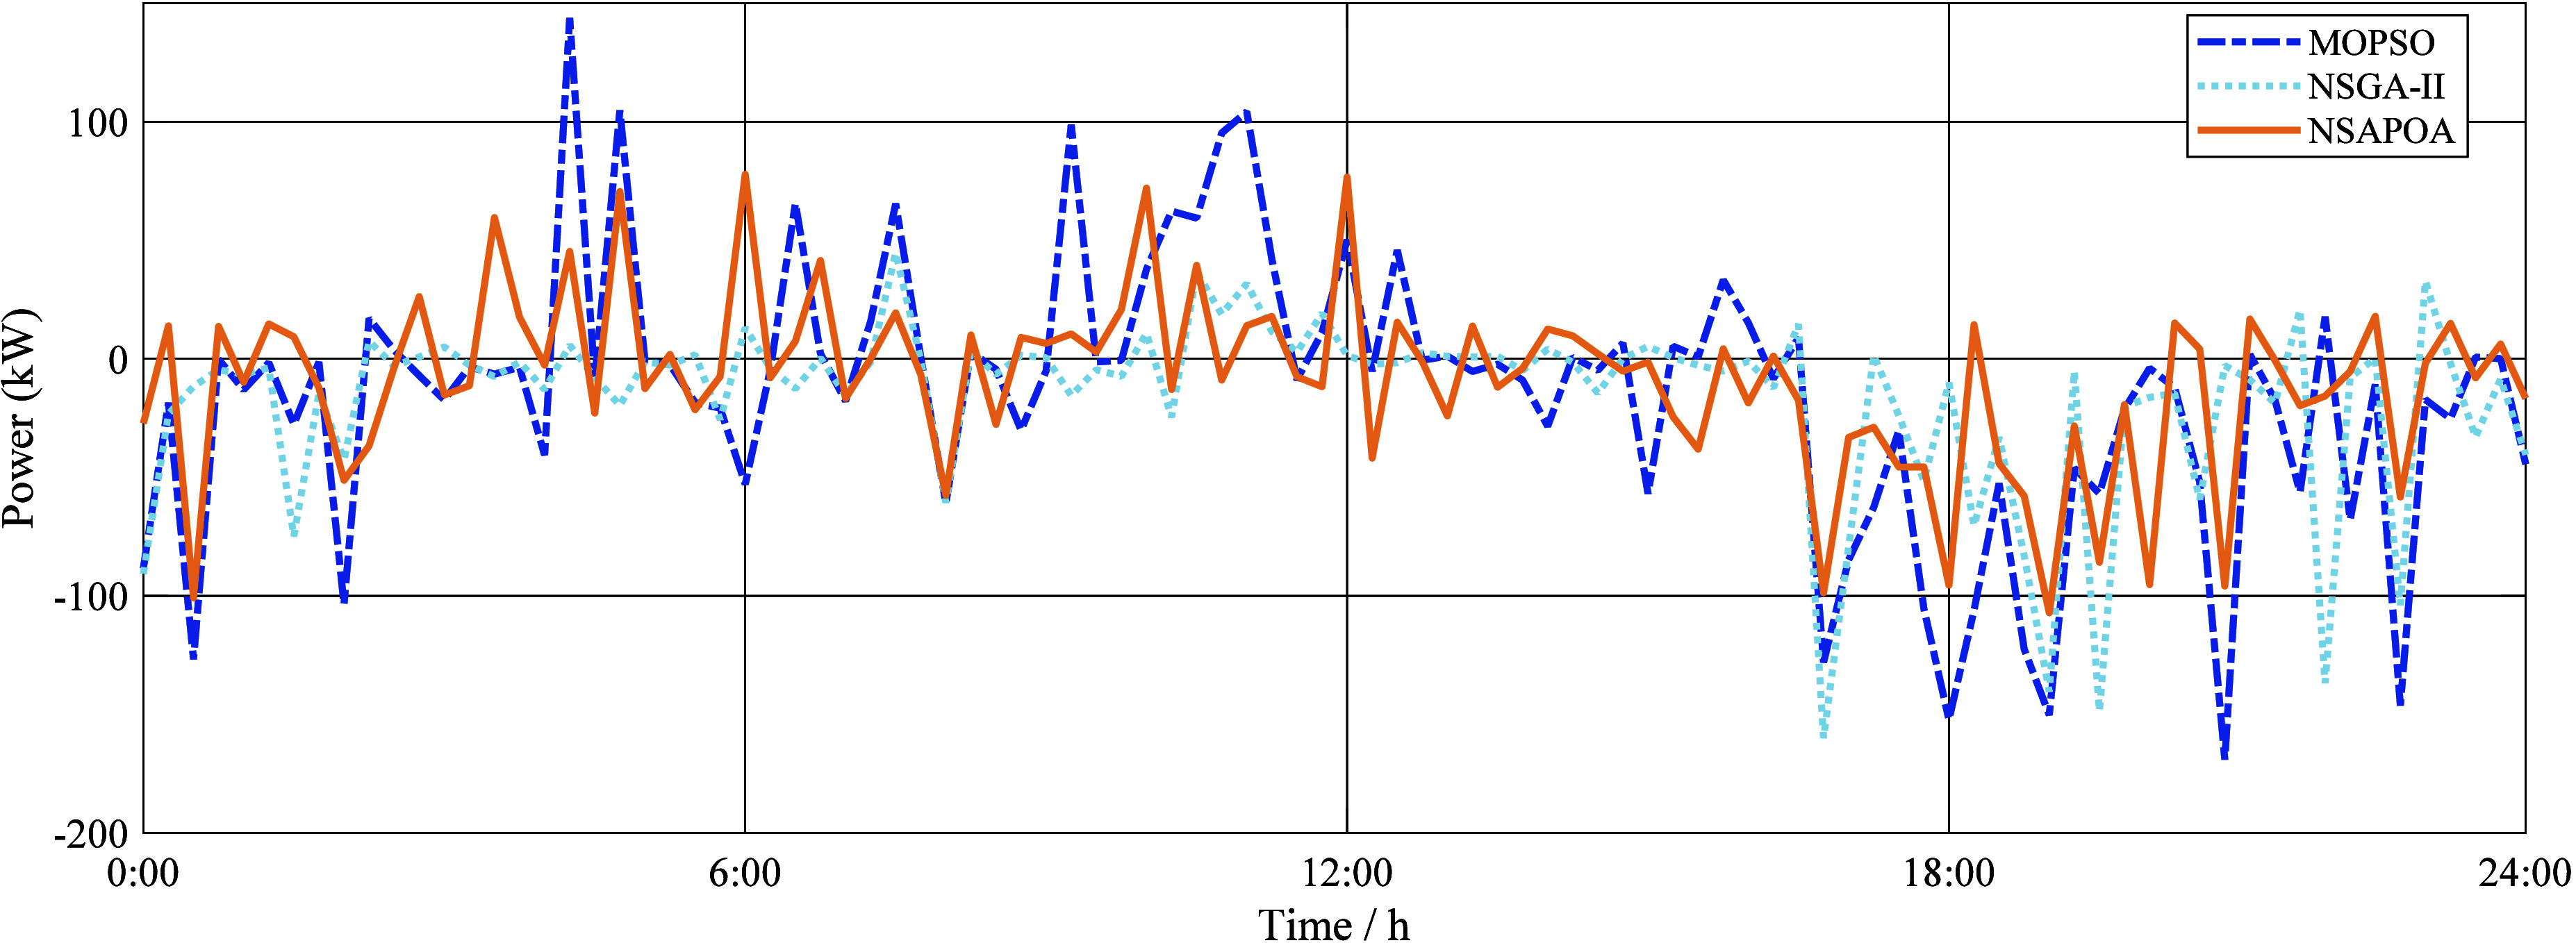
Output curves of energy storage batteries obtained by different algorithm.
It can be seen from Table 4 and Figure 12 that compare with the other two algorithms, the score obtained by the NSAPOA is the highest (0.17476). The net income of the DC microgrid system is the maximum of 1082.11, 59.1% higher than the lowest. However, due to the consideration of equivalent charging and discharging capacity, the net income needs to be compromised, which is lower than both in the single and dual goal cases. Carbon emissions is only 1.8% more than the minimum and is the lowest among the three cases. Equivalent charging and discharging capacity is slightly higher but is 7.7% lower than the maximum, also the lowest among the three cases. Considering three goals resulted in the most comprehensive solution, which improves the battery’s operational lifespan and reduces environmental pollution with the reduction of carbon emissions.
The optimized operational curve for DC microgrid system obtained by the NSAPOA, taking into account three different optimization goals is shown in Figure 13.
Figure 13.
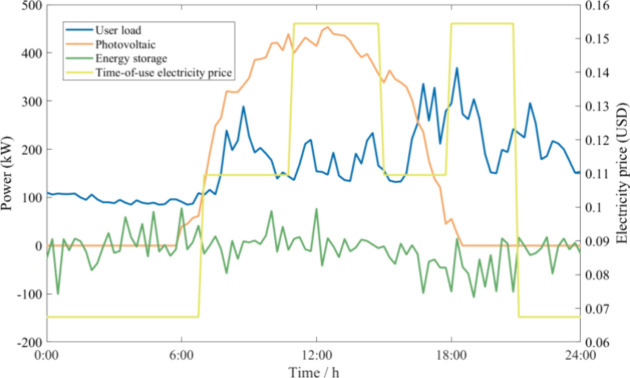
Optimized operational curve for DC microgrid obtained by the NSAPOA considering three objectives.
It can be seen from Figure 13 that during 0:00–7:00, real-time electricity prices are the lowest, and the generation from the PV plant is close to zero. During this period, the load is primarily supplied by energy storage and electricity purchased from the grid via grid-connected converters. Due to the low demand, energy storage and the grid-connected converters alternate in supplying power, ensuring a stable energy provision. During 7:00–11:00, electricity prices are in the middle level, while the generation from the PV plant steadily increases to its maximum. When the generated energy exceeds the load demand, the energy storage system begins charging to store excess energy. If capacity limitations restrict energy storage, surplus electricity is fed back into the grid via grid-connected converters, thus avoiding photovoltaic curtailment. During 11:00–17:00, electricity prices remained at a relatively high level, and the photovoltaic output continues to exceed the load demand. The energy storage system remains in charging mode until reaching full capacity, after which the surplus electricity is sold back to the grid through the grid-connected converters to generate profits. During 17:00–21:00, electricity prices reach the highest level, coinciding with a peak in energy demand. As the generation from the PV plant drops to zero, the energy storage system discharges a significant amount of previously stored energy, reducing the cost of electricity purchases during this peak pricing period. The combination of energy storage and grid-supplied electricity, delivered through grid-connected converters, meets the high electricity demand during this period. During 21:00–24:00, electricity prices become low again, and demands began to decrease. The energy storage and grid-connected converters continue to supply power alternately to meet the demands.
5.3. Comparison of Optimization Effect under Different Scenarios
For the different typical scenarios in 2.2, the optimization model established in this paper is used for solution. The optimized operation results under different scenarios are shown in Table 5, and the charging and discharging curves of energy storage batteries is shown in Figure 14.
Table 5. Comparison of the Optimal Solution Search Results of Different Weather Conditions.
| weather condition | net income/USD | carbon emissions/kg | equivalent charging and discharging capacity/kW·h |
|---|---|---|---|
| fair weather | 1082.11 | 857.30 | 2432.69 |
| adverse weather | 757.36 | 810.52 | 1967.87 |
Figure 14.
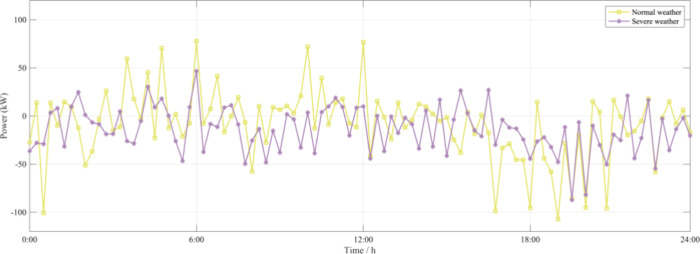
Output curves of energy storage batteries under different weather.
It can be seen from Table 5, compared with the normal weather scenario, in severe weather, due to the significant reduction of photovoltaic output, the energy obtained by the energy storage battery from renewable energy sources is reduced, the load is primarily purchased from the grid via grid-connected converters, resulting in a reduction in the net income and carbon emissions to 757.36USD and 810.52 kg, which is 30.1% and 5.5% lower than that in normal weather. It can be seen from Figure 14, the energy storage charging amount in the severe weather scenario from 4:00 to 12:00 is significantly lower than that in the normal weather scenario, resulting in insufficient power for discharge after the electricity price rises after 18:00, and thus leading to a decrease in revenue. Despite a reduction in net income, there’s a notable decrease (19.1%) in the battery’s equivalent charging and discharging capacity, enhancing its operational lifespan.
6. Conclusions
From the perspectives of economy, low-carbon, and safety in the operation of low-voltage DC microgrids, this paper proposes a multiscenario optimization control method of low-voltage DC microgrids based on the NSAPOA. The operation model of low-voltage DC microgrids considering the service life of energy storage is established with the objective functions of maximizing net income, minimizing equivalent charging/discharging capacity of the energy storage system, and minimizing carbon emissions. The main conclusions are as follows:
-
1)
By comparing and analyzing the energy exchange strategies and economy of time of use electricity prices and different operating modes of the system in multiple scenarios, the optimal economic efficiency of the low-voltage DC microgrid system in bidirectional grid-connected operation mode is obtained;
-
2)
The NSAPOA introduced in this study demonstrates robust search capabilities and effective optimization by evaluating various optimization algorithms across distinct objective functions, achieving the highest score obtained by the MABAC algorithm than those obtained by the MOPSO and NSGA-II;
-
3)
Taking into full consideration the daily net income, service life and carbon dioxide emissions, compared with the operating results under only one goal, the equivalent charging and discharging capacity of the battery is reduced by 17.7%, improving the service life of energy storage systems. And the carbon dioxide emissions is reduced by 450.06 kg, which leads to the balance between cost-effective and carbon-efficient functioning of energy storage in the low-voltage DC microgrid system.
Acknowledgments
This paper is supported by the Research and engineering demonstration project of safe, independent and controllable intelligent management and control system for tens of millions of kilowatts of fully clean energy (CSIEKJ220700539).
Data Availability Statement
The data underlying this study are not publicly available due to data owned by a third party. The data underlying this study were provided by Guoneng Qinghai Yellow River MaerDang Hydropower Development Co., Ltd. under license/by permission. Data are available from the corresponding author upon reasonable request with the permission of Guoneng Qinghai Yellow River MaerDang Hydropower Development Co., Ltd.
The authors declare no competing financial interest.
References
- Nojavan S.; Akbari-Dibavar A.; Farahmand-Zahed A.; et al. Risk-constrained scheduling of a CHP-based microgrid including hydrogen energy storage using robust optimization approach. Int. J. Hydrogen Energy 2020, 45 (56), 32269–32284. 10.1016/j.ijhydene.2020.08.227. [DOI] [Google Scholar]
- Boqtob O.; EI Moussaoui H.; EI Markhi H.; et al. Optimal energy management of microgrid based wind/PV/diesel with integration of incentive-based demand response program. Wind Eng. 2023, 47 (2), 266–282. 10.1177/0309524X221124335. [DOI] [Google Scholar]
- Karimi H.; Jadid S. Multi-layer energy management of smart integrated-energy microgrid systems considering generation and demand-side flexibility. Applied Energy 2023, 339, 120984 10.1016/j.apenergy.2023.120984. [DOI] [Google Scholar]
- Carrijo de Oliveira R.; Tofoli F. L.; Silva de Morais A. Novel Isolated Multiple-Input, Multiple-Output Multidirectional Converter for Modern Low-Voltage DC Power Distribution Architectures. Sustainability 2023, 15 (5), 4582. 10.3390/su15054582. [DOI] [Google Scholar]
- AlDavood M. S.; Mehbodniya A.; Webber J. L.; et al. Robust Optimization-Based Optimal Operation of Islanded Microgrid Considering Demand Response. Sustainability 2022, 14 (21), 14194. 10.3390/su142114194. [DOI] [Google Scholar]
- Dan L.; Yiqun K.; Ping X. Research on multi-objective optimization strategies for microgrids considering economic efficiency and photovoltaic consumption rate. Power Demand Side Manage. 2023, 25 (2), 70–75. [Google Scholar]
- Hayashi R.; Takano H.; Nyabuto W. M.; et al. Bilevel optimization model for sizing of battery energy storage systems in a microgrid considering their economical operation. Energy Reports 2023, 9 (S1), 728–737. 10.1016/j.egyr.2022.11.069. [DOI] [Google Scholar]
- Yong L.; Guohua Y.; Xuanru W.; et al. Research on Economic Operation Optimization of Microgrids Based on Improved MNPSO Algorithm. Electr. Eng. 2022, (07), 14–21+49. [Google Scholar]
- Rodriguez M.; Arcos-Aviles D.; Martinez W. Fuzzy logic-based energy management for isolated microgrid using meta-heuristic optimization algorithms. Applied Energy 2023, 335, 120771 10.1016/j.apenergy.2023.120771. [DOI] [Google Scholar]
- Hongliu Y.; Meini W. The modernization significance of China’s “dual carbon” strategy in governance from the perspective of ecological civilization history. J. Liaoning Norm. Univ. Soc. Sci. Ed. 2023, 46 (02), 39–43. [Google Scholar]
- Zixiao F.; Sheng L.; Jiawei Y. Multi objective optimization operation of microgrids based on improved NSGA-III algorithm. Electr. Autom. 2021, 43 (06), 39–41+45. [Google Scholar]
- Shizhen W.; Xun D.; Jun W. Optimization configuration of energy storage in distribution networks considering the economic operation of microgrids and systems. Mod. Electr. Power 2022, 39 (01), 88–94. [Google Scholar]
- Xiao H.; Pei W.; Dong Z.; Kong L. Bi-level planning for integrated energy systems incorporating demand response and energy storage under uncertain environments using novel metamodel. CSEE J. Power Energy Syst. 2018, 4, 155–167. 10.17775/CSEEJPES.2017.01260. [DOI] [Google Scholar]
- Park S.; Moon J.; Hwang E. Data generation scheme for photovoltaic power forecasting using Wasserstein GAN with gradient penalty combined with autoencoder and regression models. Expert Systems With Applications 2024, 257, 125012 10.1016/j.eswa.2024.125012. [DOI] [Google Scholar]
- Fotopoulou M.; Rakopoulos D.; Trigkas D.; et al. State of the Art of Low and Medium Voltage Direct Current (DC) Microgrids. Energies 2021, 14 (18), 5595–5595. 10.3390/en14185595. [DOI] [Google Scholar]
- Singh P.; Lather J. S. Dynamic power management and control for low voltage DC microgrid with hybrid energy storage system using hybrid bat search algorithm and artificial neural network. Journal of Energy Storage 2020, 32, 101974 10.1016/j.est.2020.101974. [DOI] [Google Scholar]
- Dehai C.; Ming H.; Zhengming Z.; et al. Optimizing the hierarchical T-S fuzzy control for dynamic estimation of the health status of pure electric vehicle batteries. J. Beijing Inst. Technol. 2019, 39 (06), 609–614. [Google Scholar]
- Huang W. The frequency domain estimate of fatigue damage of combined load effects based on the rain-flow counting. Mar. Struct. 2017, 52, 34–49. 10.1016/j.marstruc.2016.11.004. [DOI] [Google Scholar]
- Jenkins D.; Fletcher J.; Kane D. Lifetime Prediction and Sizing of Lead-Acid Batteries for Microgeneration Storage Applications. IET Renewable Power Generation 2008, 2 (3), 191–200. 10.1049/iet-rpg:20080021. [DOI] [Google Scholar]
- Wang W.; Tian W.; Xu D.; Zang H. Arctic puffin optimization: A bio-inspired metaheuristic algorithm for solving engineering design optimization. Advances in Engineering Software 2024, 195, 103694 10.1016/j.advengsoft.2024.103694. [DOI] [Google Scholar]
- Jangir P.; Jangir N. A new non-dominated sorting grey wolf optimizer (NS-GWO) algorithm: development and application to solve engineering designs and economic constrained emission dispatch problem with integration of wind power. Eng. Appl. Artif Intel 2018, 72, 449–67. 10.1016/j.engappai.2018.04.018. [DOI] [Google Scholar]
- Shi M.; Li X.; Xu C. Two-stage site selection of hydrogen refueling stations coupled with gas stations considering cooperative effects based on the CRITIC-ITFAHP-MABAC method: A case study in Beijing. Int. J. Hydrogen Energy 2024, 49, 1274–92. 10.1016/j.ijhydene.2023.09.168. [DOI] [Google Scholar]
- Yong Z.; Chunhua L. Research on Optimization of Microgrid Operation Based on Multi objective Particle Swarm Optimization Algorithm. J. Jiangsu Univ. Sci. Technol., Nat. Sci. Ed. 2017, 31 (04), 501–507. [Google Scholar]
- Siyu T.; Minxiang H. Multi objective scheduling of grid connected microgrids based on NSGA-II algorithm. East China Electr. Power 2013, 41 (8), 1678–1682. [Google Scholar]
- Mores W.; Nimmegeers P.; Hashem I.; et al. Multi-objective optimization under parametric uncertainty: A Pareto ellipsoids-based algorithm. Comput. Chem. Eng. 2023, 169, 108099 10.1016/j.compchemeng.2022.108099. [DOI] [Google Scholar]
Associated Data
This section collects any data citations, data availability statements, or supplementary materials included in this article.
Data Availability Statement
The data underlying this study are not publicly available due to data owned by a third party. The data underlying this study were provided by Guoneng Qinghai Yellow River MaerDang Hydropower Development Co., Ltd. under license/by permission. Data are available from the corresponding author upon reasonable request with the permission of Guoneng Qinghai Yellow River MaerDang Hydropower Development Co., Ltd.


