Abstract
Given that conducting controllable shock wave tests in actual rock formations underground in coal mines affects coal mine production with the parameters required for equipment design and incurs significant costs, a series of ground tests were conducted separately. First, the impact of energy storage on rock breaking efficiency was analyzed. Then, physical simulation experiments were conducted on the differential efficiency of controllable shock waves on high-strength cement, sandstone, granite, solid granite, and limestone. Results show that (a) for high-strength cement, the energy storage of 50 kJ is driven by pulse power, and the energy converter uses a metal wire with a length of 120 mm and a diameter of 1.6 mm to convert energy. (b) For sandstone, after a single impact on the sample, due to the lack of confining pressure and outer protection, the physical model sample was directly exploded, and the cracking effect was very good. (c) For granite, the experimental results of three energy levels of 50, 70, and 100 kJ have basically verified that the energy storage of the pulse power driving source with an energy of 100 kJ can achieve the result of fracturing material mode. (d) For solid granite, endoscopic exploration was conducted on the drilling holes and adjacent guide holes where impact was implemented. (e) For limestone strata, when the energy storage design of the pulse power drive source is 100 kJ, the existing metal wire electric explosion energy conversion efficiency and three impacts can meet the cutting seam requirements of most coal seam roofs.
1. Introduction
The Yulin area has abundant coal resources.1−3 When using the current coal mining technology,4−6 traditional blasting measures are mainly used for operations such as roof cutting,7−9 rock roadway excavation, removal of gangue layers/immersed rocks,10−12 and bottoming.13−15 However, the safety of the initiating explosive devices required for blasting measures is poor,16,17 and operations cannot be carried out at any time according to actual production needs,18 seriously reducing the production efficiency of coal mining enterprises.19−21 Therefore, controllable shock wave technology is gradually receiving attention.22−24
Controllable shock wave equipment includes:25−27 pulse power drive source, high current coaxial cable, coaxial cable terminal accessories, water tail, high current coaxial propulsion rod,28−30 and sealing device.31−33 Although there is enough space in the tunnel to place a pulse power drive source,34 the energy conversion efficiency can be improved by studying the mechanism of shock waves generated by metal wire electric explosions.35 This is very beneficial for miniaturizing pulse power drive sources and improving the applicability of controllable shock wave equipment and technology.36−38 At the same time, it reduces the technical difficulty of high current coaxial cables,39 terminal accessories, coaxial propulsion rods,40 and energy converters,41 and optimizes the process of on-site operations.42 Metal wire electric explosion process:43 When the high-density pulse high current generated by the pulse power source acts on the metal wire,44 the metal wire undergoes a violent phase transition process.45 As energy is continuously injected,46 the metal wire will undergo phase transitions from solid to liquid, gas to arc plasma,47 resulting in volume expansion and compression of the surrounding water medium.48 Due to the microsecond magnitude of the metal wire electrical explosion process,49 the compression waves generated during the metal wire phase transition process will diffuse outward in the form of shock waves,50 acting on the target area.51 Through long-term research on metal wire electric explosions, the mechanism of shock waves generated by electric explosions has been basically clarified.52 Although there are multiple directions of research on electric explosions both domestically and internationally,53 many studies on the specific applications of shock wave generation are general and have not been combined with specific applications.54 Our research focuses specifically on the generation of shock waves by electric explosions,55 recognizing the process of shock wave generation by electric explosions.56 Previous research has shown that the intensity of shock waves generated by underwater wire explosions is closely related to the quality of the metal wire.57
In summary, many scholars have studied the mechanism of controllable shock waves caused by electric pulses, but there is relatively little research on the mechanism of controllable shock waves under different rock conditions. This article conducts two research works: (a) The impact of energy storage on rock breaking efficiency was analyzed, and the electrical mechanical energy conversion efficiency of controllable shock waves was elaborated. (b) Physical simulation experiments were conducted on the differential efficiency of controllable shock waves on high-strength cement, sandstone, granite, solid granite, and limestone, and the rock breaking efficiency of controllable shock waves under different rock conditions is analyzed.
2. Physical Simulation Experiment Design
The controllable shock wave, characterized by multiple points and multiple operations, can replace pyrotechnic devices with too strong a one-time explosion power and potential safety hazards, thereby achieving the goal of safe and controllable top cutting. However, the strength of a single shock wave and the number of single point actions are the basic parameters and design basis for the development of controllable shock wave equipment, and the technical parameters for controllable shock wave cutting need to be determined based on the mechanical properties and operating conditions of the target rock layer. In order to improve the overall research progress of the project, this article simulates the environmental conditions of actual roof cutting, taking into account the heavy production tasks of coal mines, the limited number of underground testing sites approaching application conditions, the high time cost of conducting underground work conditions, and the inconvenience of related operations. Equipment technology validation tests were conducted on the ground using multiple rock types and scenarios. Optimize and determine controllable shock wave cutting equipment and process indicators in various ways.
The target rock layer for fracturing in this project is the roof of the 2 # coal seam, and its lithology and mechanical parameters are shown in Table 1.
Table 1. Rock and Mechanical Parameters of Coal Seam Roof in Ningtiaota Mine.
| layer | roof lithology | natural bulk density g/cm | porosity % | dry compressive strength MPa | saturated compressive strength MPa | tensile strength MPa |
|---|---|---|---|---|---|---|
| 2 # coal seam | siltstone | 2.49 | 9.63 | 61.94 | 24.18 | 1.4 |
| tensile strength MPa | shear strength | softening coefficient | elastic modulus ×104 MPa | Poisson’s ratio | ||
| C/MPa | φ/degree | |||||
| 1.4 | 1.9 | 50.68 | 0.39 | 2.88 | 0.24 | |
To ensure the reliability of shock wave parameters and take into account the required shock wave strength for other rock and mechanical parameters of coal seams, (1) shock fracturing tests were carried out on sandstone samples; (2) Conduct shock wave tests on high-strength physical model samples, and compensate for defects without confining pressure with the strength of the physical model; (3) In situ limestone overall test with compressive strength greater than sandstone; (4) Granite physical model cracking test with higher compressive strength; (5) Cracking tests on granite boulders and rock layers; (6) Model fracturing test of sand and gravel with confining pressure. By conducting multiple sets of experiments to verify and determine the process parameters of controllable shock wave induced fracturing of rock layers, technical basis is provided for determining the parameters of controllable shock wave equipment.
2.1. Overview of the Principle of Metal Wire Electric Explosion and Shock Wave Characteristics
During the process of electric explosion, the resistance of metal wires is a nonlinear value due to phase transition and plasma formation, resulting in a nonlinear value of the deposited electrical energy. So, the energy efficiency varies nonlinearly with parameters such as the energy storage of the pulse power driving source, the material and quality of the metal wire, and the initial resistance value. The shock wave generated by the electric explosion of metal wires in water is the result of the superposition of shock waves formed by multiple volume expansion processes (mainly vaporization phase transition and plasma expansion). In traditional research on shock waves generated by electric explosions, it is difficult to distinguish and determine the contributions of phase explosion shock waves and plasma expansion shock waves, which seriously affects the understanding of the mechanism of electric explosion shock waves. During the process of metal wire electric explosion, the shock waves generated by phase explosion (rapid phase change) and plasma expansion are closely related to the energy injected into the metal wire, the quality and material of the metal.
2.2. Experiments on the Impact of Energy Storage on Efficiency
Controllable shock waves and pyrotechnic explosions share the basic principle of rock fracture. Differently, controllable shock waves are based on physical methods, converting electrical energy into mechanical energy to produce a rupture effect. The controllable shock wave has high single pulse intensity, short duration, weak and controllable cracking effect. By performing multiple operations in the same area, the same effect as initiating explosive devices can be achieved. Perform operations on the entire borehole through the movement of equipment. Develop roof seam cutting technology and equipment based on controllable shock wave technology. On the basis of continuously improving the mechanism of shock wave generation and improving the energy conversion efficiency, optimize the controllable shock wave intensity and number of actions, and determine the technical indicators of the equipment.
2.2.1. Introduction to the Experimental Platform
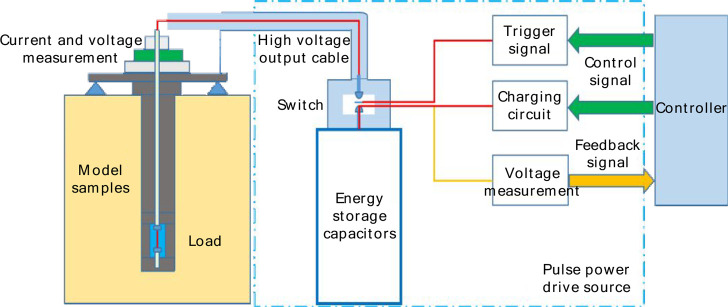
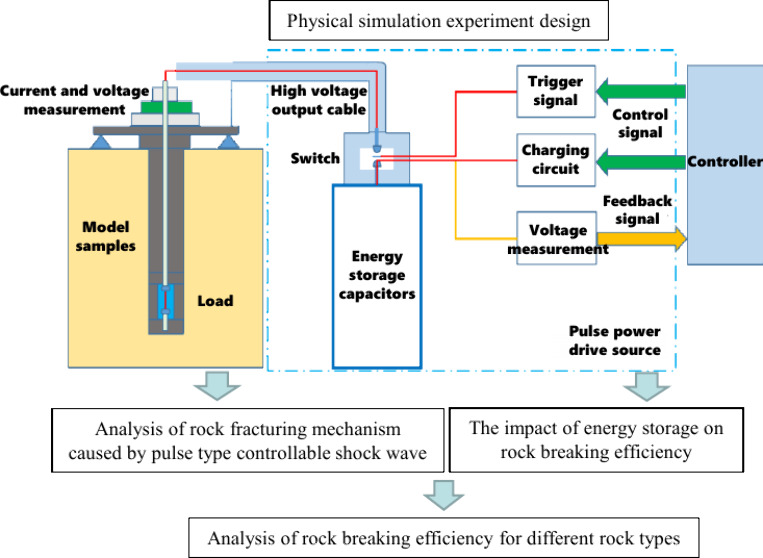
In order to apply controllable shock waves to coal mine roof seam cutting, rock roadway excavation, debris layer/immersed rock breaking, and bottoming, a series of physical model tests were carried out. When different systems are used for energy storage, the energy generated by the shock wave varies, resulting in different operational effects. As shown in Figure 1, the test platform consists of nine parts, including: charging power supply, energy storage capacitor, control switch, measurement device, special high-voltage cable, cable accessories, shock wave energy converter, load, and physical model sample. The working principle of the system is to use a charging power supply to charge the energy storage capacitor. When the system energy storage reaches the set value at the measurement end, a trigger signal is applied to make the switch conductive. Release the energy stored in the capacitor to the load through a high-voltage output cable within tens of us. The metal wire load undergoes rapid phase transition and generates shock waves that act on the physical model sample.
Figure 1.
Schematic diagram of the experimental platform.
In order to determine the optimal energy storage value for crack initiation, a physical model test platform with energy storage of 13.5 kJ and 30 kJ was constructed using existing energy storage devices in the laboratory. Conduct preliminary cracking tests with different energy storage and metal wire loads. The experimental purpose is to first verify the feasibility of shock wave induced rock fracturing, and then further optimize the metal wire load and the energy storage of the pulse power driving source.
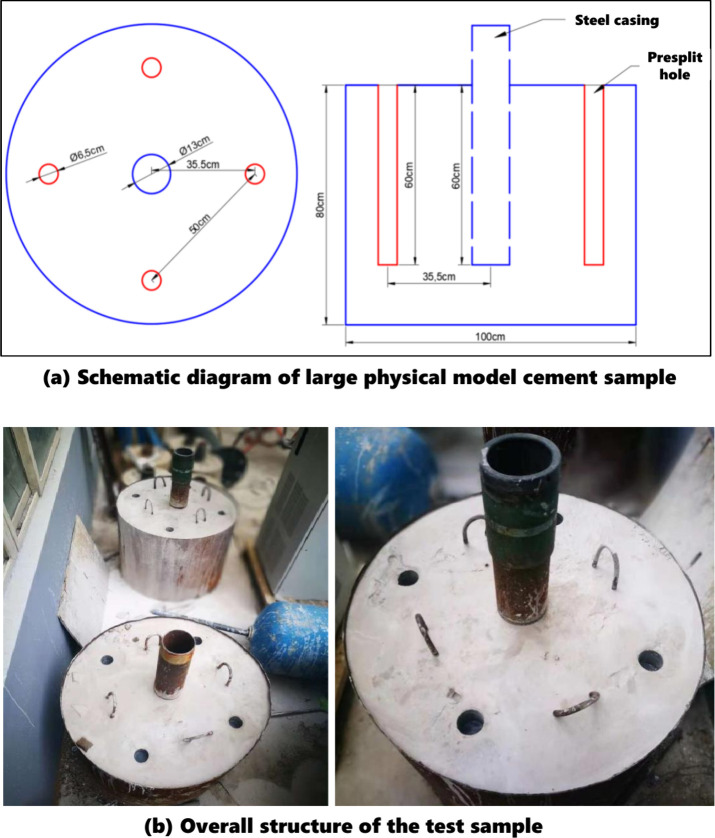
In order to verify the feasibility of applying controllable shock wave technology to roof cutting seams, it is necessary to use shock waves to create directional cracks in physical model samples. In order to verify the feasibility of applying controllable shock wave technology to rock roadway excavation, rock fragmentation and bottoming, it is necessary to use shock wave effective fracture physical model samples. There are currently two cement model samples in the laboratory. The sample sizes are all cylindrical with a diameter of 100 cm and a height of 80 cm, denoted as Sample 1 and Sample 2. There is a hole with a diameter of 13 cm and a depth of 60 cm at the center of the sample circle. Drill four holes with a diameter of 6.5 cm and a depth of 60 cm evenly at a distance of 35.5 cm from the center of the circle, with a distance of 50 cm between adjacent holes. Sample preparation is shown in Figure 2a. During the experiment, the shock wave energy converter is placed in a hole with a diameter of 6.5 cm for operation, which is called the test hole/operation hole. The remaining holes can be considered as guide holes and have an impact on the waveguide direction. When cracks appear in one direction, the guiding effect of other directional holes on shock waves weakens. The overall structure of the test sample is shown in Figure 2b.
Figure 2.
Overall structure of large scale cement samples and test samples.
2.2.2. Experimental Equipment
On the basis of preliminary experiments, a pulse source with energy storage of 3 × 40 kJ as shown in Figure 3a and an energy converter as shown in Figure 3b were developed. This pulse power driving source can independently output electrical energy with two parameters of 120 kJ and 80 kJ, as well as three circuits of 40 kJ each. This energy converter can be equipped with aluminum wires with diameters of 1.0, 1.6, and 2.0 mm and lengths of 100 mm to generate shock waves. Studying the energy conversion efficiency of shock waves generated by metal wire electric explosions can directly impact rock layers in drilling of physical model samples or in drilling of solid rock layers to verify the fracturing effect. There are three detection methods designed in the cracking effect test of solid rock layers. One is the decrease in liquid level in the hole. When cracks are formed at the impact point, water in the hole will seep into the cracks, causing a decrease in the liquid level in the hole. The distance between the lowered liquid level and the working point is half the length of the crack formed by the shock wave. The second method is to use an in hole observation instrument to observe the cracks formed by the shock wave on the hole wall. The third step is to check whether there is water infiltration and the water level in the adjacent holes. The hole wall crack detection equipment adopts a 5-megapixel industrial pipeline waterproof camera with a display screen and a qualified extension rod, as shown in Figure 3c.
Figure 3.
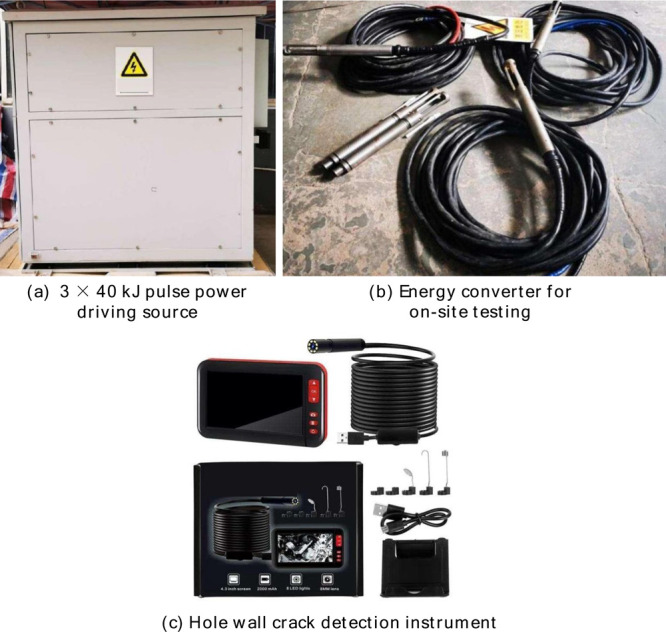
Pulse power drive source, energy converter, and hole wall crack detection instrument.
2.3. Experiments on Rock Breaking Efficiency of Different Rock Types
2.3.1. High Strength Cement Test
The preliminary experiments in cement samples were conducted using the existing cement model in the laboratory, and the ability of controllable shock waves to crack cement was preliminarily verified by drilling holes on the side of the middle borehole. On this basis, high-strength cement physical model tests were carried out.
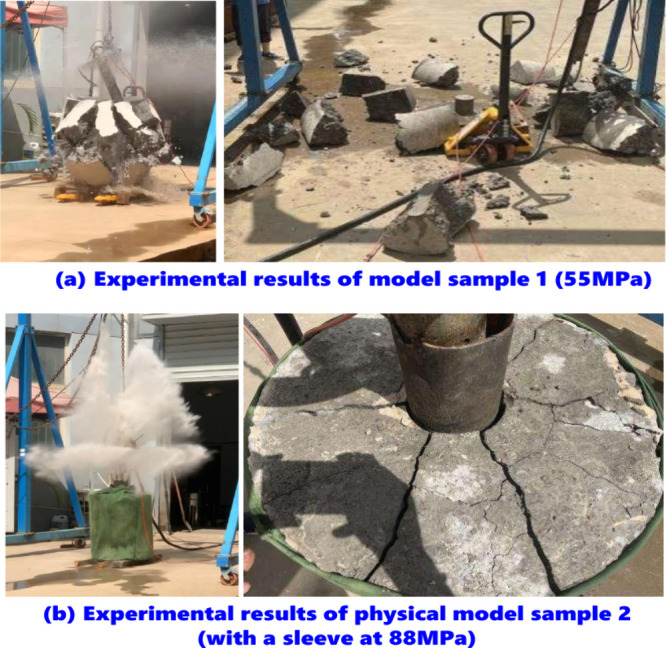
On the basis of preliminary experiments, the impact test of high-strength cement model samples mainly improved the pulse power driving source, increasing the energy storage of the pulse power driving source to 50 kJ. The metal wire material is aluminum alloy. Two physical model samples with strength of 55 and 88 MPa were made using similar materials. Model 1 has a diameter of 60 cm and a height of 80 cm. Drill a nonpenetrating hole with a diameter of 14 cm on the central axis. Drilling is a bare eye hole without casing. The compressive strength of the physical model sample is 55 MPa, as shown in Figure 4a. Model 2 has a diameter of 60 cm and a height of 80 cm. Drill a nonpenetrating hole with a diameter of 14 cm on the central axis. Metal sleeves are added to the holes in the sample. The compressive strength of the sample is 88 MPa. The experiment uses an energy converter to drill deep into the center hole, and the center of the output window of the energy converter is aligned with the center position in the height direction of the physical model. In order to suppress sample splashing after the experiment and prevent the problem of not being able to restore the original appearance of the sample after the experiment, canvas bags were used to wrap sample 2 as a whole, as shown in Figure 4b.
Figure 4.
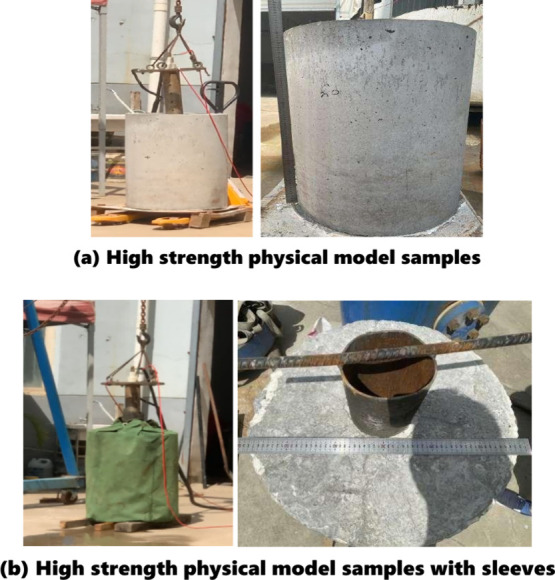
High strength model samples and high-strength model samples with sleeves.
2.3.2. Sandstone Physical Model Test
Sandstone is a typical rock layer in coal seam roof, which is as similar as the target rock layer as possible. Conducting sandstone column tests without confining pressure in the laboratory can further simulate the effect of shock wave fracturing realistically and obtain the controllable shock wave strength required for fracturing sandstone.
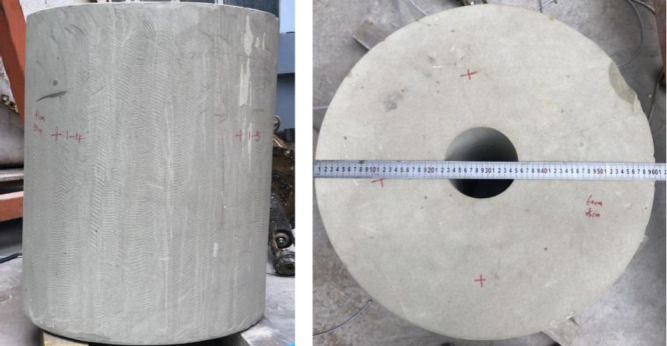
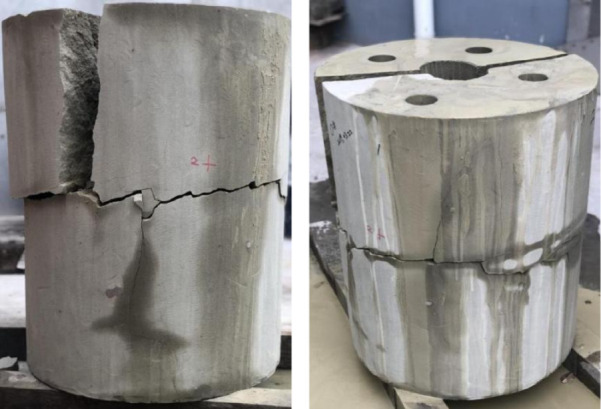
In order to verify the pre cracking effect of common sandstone roof and floor in coal mines, sandstone samples were collected in the outcrop area and made into test samples with mesoscale pores, as shown in Figure 5. The model sample has a diameter of 60 cm, a height of 80 cm, and a mesoscale pore diameter of 13.5 cm. The mechanical parameters are shown in Table 2, and the saturated compressive strength and tensile strength are both greater than the corresponding values of the target rock layer.
Figure 5.
Sandstone physical model samples.
Table 2. Summary Table of Rock Mechanical Property Test Results (Indoor).
| sample number | sample name | compressive
strength |
tensile
strength |
deformation
characteristics |
|||||||
|---|---|---|---|---|---|---|---|---|---|---|---|
| drying
(Rd) MPa |
saturation
(Rw) MPa |
softening coefficient KR | natural
(δt) MPa |
natural
elastic modulus (E50) GPa |
Poisson’s ratio (μ50) | ||||||
| experimental value | average value | experimental value | average value | experimental value | average value | experimental value | average value | ||||
| 190618 | medium fine grained sandstone | 34.89 | 34.88 | 31.11 | 30.55 | 0.88 | 2.18 | 2.19 | 5.93 | 5.86 | 0.25 |
| 35.03 | 30.56 | 2.16 | 5.89 | ||||||||
| 34.73 | 29.98 | 2.23 | 5.76 | ||||||||
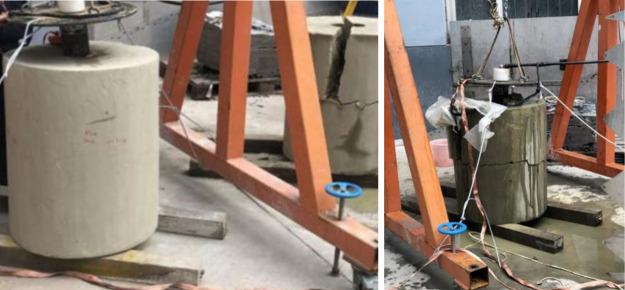
Deepen the experimental energy converter into the central borehole, aligning the axial center position of the output window of the energy converter with the center of the height direction of the physical model. The experimental method is shown in Figure 6. Insert the energy converter into the center hole, and then inject water into the center hole to the hole opening.
Figure 6.
Test methods for sandstone physical model samples
2.3.3. Granite Physical Model Test
Due to the lack of fracturing test areas in sandstone rock formations that are similar in lithology to the coal seam roof, and even in rock formations with confining pressure (such as in underground rock tunnels). Attempted to increase the strength of the physical model and simulate the unfavorable situation of the physical model sample without confining pressure, granite physical model experiments with higher strength were carried out.
The design of the granite physical model test sample is as shown in Figure 7a. Outer diameter 500 mm, height 600 mm. Drill a center hole with a diameter of 70 mm and a depth of 500 mm on the central axis. The experimental rock samples were obtained from granite mines. Divided into two types based on strength, each with four types, including red granite (strength of 80 MPa), named Red 1-Red 4, as shown in Figure 7b. Gray granite (with a strength of 120 MPa) is named as gray 1–4, as shown in Figure 7c.
Figure 7.
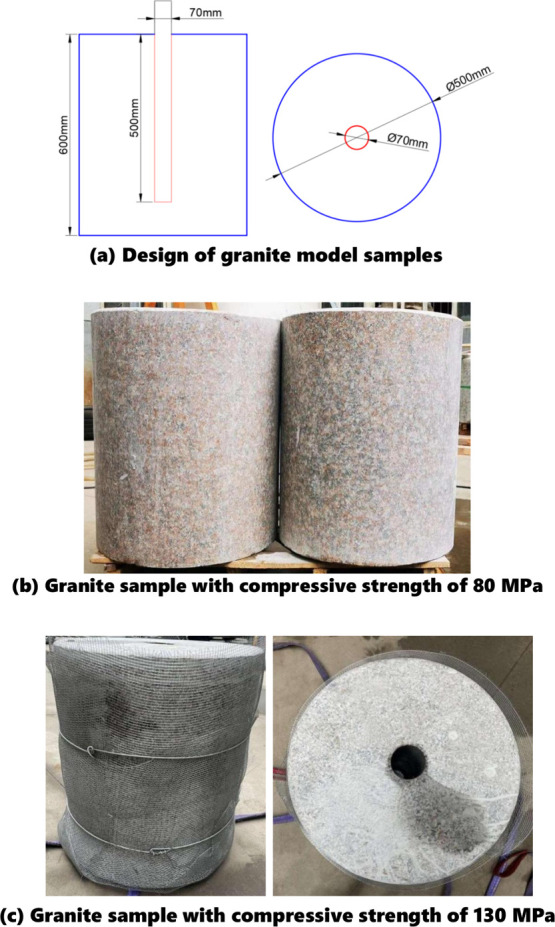
Design of granite physical model samples and granite physical model.
The experiment uses 50 and 100 kJ adjustable pulse power driving sources to drive metal wires that match the energy storage of the pulse power driving source for different impact strengths and different number of impact cracking tests.
The test plan for the red granite with a strength of 80 MPa is as follows: (1) The Red 1 stone sample was subjected to a 50 kJ energy impact, with 5 impacts. Record the development of cracks at the impact location before and after each impact, with a total of 6 endoscopic monitoring data, named “Red 1–50-JC0″ - “Red 1–50-JC5″. (2) The Red 2 stone sample was subjected to a 70 kJ energy impact with 5 impacts. Record the development of cracks at the impact location before and after each impact, with a total of 6 endoscopic monitoring data, named “Red 2–70-JC0″ - “Red 2–70-JC5″. (3) The Red 3 stone sample was subjected to a 100 kJ energy impact, with 5 impacts. Record the development of cracks at the impact location before and after each impact, with a total of 6 endoscopic monitoring data, named “Red 3–100-JC0″ - “Red 3–100-JC5″. (4) Red 4 stone samples are used as backup. If the first 3 are damaged, replace them with red 4.
The gray granite test with a strength of 120 MPa is conducted, and the experimental plan is (1) The gray 1 stone sample was subjected to a 50 kJ energy impact with 5 impacts. Record the development of cracks at the impact location before and after each impact, with a total of 6 endoscopic monitoring data, named “Gray 1–50-JC0″ - “Gray 1–50-JC5″. (2) The gray 2 stone sample was subjected to a 70 kJ energy impact with 5 impacts. Record the development of cracks at the impact location before and after each impact, with a total of 6 endoscopic monitoring data, named “Gray 2–70-JC0″ - “Gray 2–70-JC5″. (3) The gray 3 stone sample was subjected to a 100 kJ energy impact with 5 impacts. Record the development of cracks at the impact location before and after each impact, with a total of 6 endoscopic monitoring data, named “Gray 3–100-JC0″ - “Gray 3–100-JC5″. (4) Gray 4 stone samples are used as backup. If the first 3 are damaged, replace them with red 4.
2.3.4. Solid Granite Test
In response to the lack of confining pressure in the granite physical model test mentioned above, further experiments were designed on the overall rock layer or isolated rocks with heels of granite.
2.3.4.1. Solid Granite Test I
Drilling arrangement: A fracturing granite rock mass test was conducted in a granite cave, and the test area is shown in Figure 8a. Ten boreholes were designed on the end face of the cave, with a spacing of 30 cm and a depth of 2.7 m, as shown in Figure 8b. Although there are cracks between the two holes on the end face, the granite layer in the deep part of the borehole is integral. Before drilling test: The observation results of the hole wall using an endoscope are shown in Figure 8c, and the hole wall is smooth without cracks.
Figure 8.
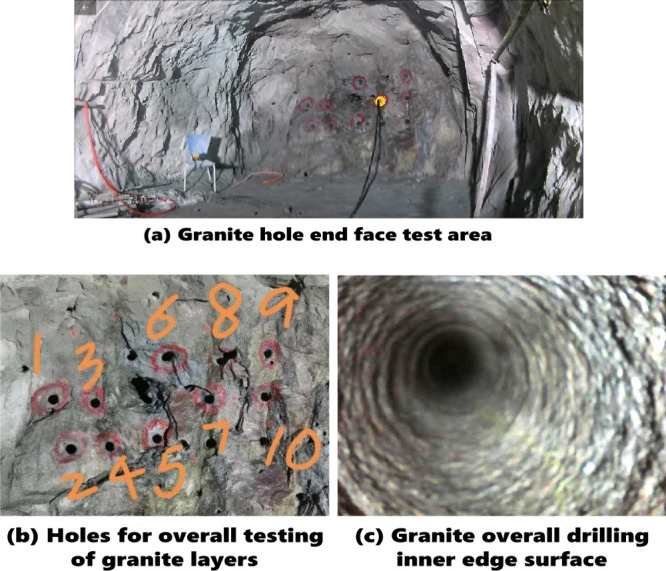
Granite hole end face test area, granite layer overall test hole layout, and granite overall drilling inner edge surface.
The average compressive strength of the granite in the cave during sampling testing is 120 MPa.
2.3.4.2. Solid Granite Experiment II
In the tunnel of the Water Diversion Project from Han to Wei, a fracturing test was conducted on an unweathered granite layer end face that passes through the main peak of the Qinling Mountains and approximates the overall rock layer. The experimental tunnel has a height difference of 300–400 m from the mountaintop, which is equivalent to having hundreds of meters of overlying pressure and confining pressure. The measured uniaxial compressive strength of the rock is 123 MPa.
Drilling arrangement: Two sets of three hole drilling were arranged on one side of the culvert in the experimental area, passing through the retaining wall and drilling into the solid rock layer. The drilling angle is −15°, as shown in Figure 9. The aperture of drilling group 1 is 100 mm, with a spacing of 50 cm. The aperture of drilling group 2 is 100 mm, with a spacing of 80 cm. All drilling holes have a depth of 5m. Mark the first group of boreholes as boreholes 1, 2, and 3. Mark the second group of boreholes as boreholes 2–1, 2–2, and 2–3.
Figure 9.
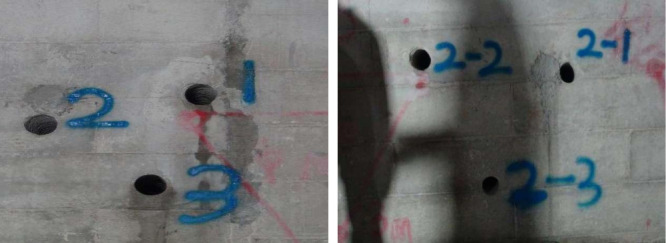
Granite hole end face test area.
2.3.5. Limestone Formation Test
In laboratory physical model tests, it is difficult to address the issues of confining pressure and small size, making it difficult to determine the actual situation of controllable shock wave intensity. To compensate for these two unfavorable conditions, cracking tests on limestone layers were conducted on the production platform of limestone quarries with strength greater than sandstone.
The rock layers in the experimental area are Silurian and Devonian limestone. When perpendicular to the bedding direction, the compressive strength is 60–140 MPa; When parallel to the bedding direction, the compressive strength is 70–120 MPa.
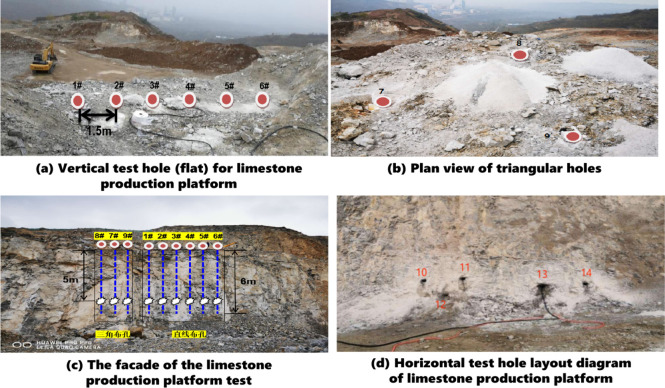
Test hole layout: This test involves two types of vertical and horizontal drilling, with four sets of test holes, each with a diameter of 115 mm. Among them, there are two groups of vertical holes and two groups of horizontal holes, with a total of 14 drilling holes. Nine vertical boreholes are numbered 1–9, and five horizontal boreholes are numbered 10–14. Vertical drilling is arranged on a line 1.5 m away from the aerial surface of the output platform. Six drilling holes are arranged parallel to the aerial surface, as shown in Figure 10a, with hole numbers 1–6 and a depth of 6 m. Three drilling holes were arranged in a triangle on one side, as shown in Figure 10b. The orientation of the holes observed from the aerial surface is shown in Figure 10c. Two sets of horizontal drilling holes are arranged on the rock mass behind the production platform. The drilling holes arranged in a triangular pattern are numbered 10, 11, and 12; The number of horizontal holes is 13, and the spacing between holes is 1.5m. Figure 10d shows the arrangement of holes and the actual drilling distance.
Figure 10.
Limestone production platform and borehole layout.
3. Results and Discussion
3.1. Analysis of Rock Fracturing Mechanism Caused by Pulse Type Controllable Shock Wave
Shockwave refers to the discontinuity or discontinuity in physical information that occurs before and after the wavefront, when the wavefront appears at the wavefront. This intermittent or discontinuous propagation in space is called shock wave or compressive stress wave. Controllable shock wave refers to controllable amplitude, impulse, operating area, and number of repetitions. Energy saving, environmental protection, minimal disturbance to surrounding rock, and unrestricted power on at any time.
When shock waves act on various rock layers, the rock layers are not only the target of the shock wave, but also the medium for propagating the shock wave. Each area in the rock layer changes its properties or state due to the action of shock waves, consuming some of the shock wave energy and propagating the remaining energy to the next area. The mechanism of a single shock wave acting on a rock layer is consistent with that of an explosive explosion shock wave acting on a rock layer, except that the controllable shock wave limits the action area and operation time of a single shock wave. Unlike the crushing zone caused by explosive explosions, it is safer to not produce a crushing zone in a single explosion. Controllable shock waves achieve crack propagation through multiple repetitions.
Controllable shock waves form shock fracture zones and shock desorption zones in different areas around the borehole, respectively, in the form of shock waves, compression waves, and elastic sound waves. The area where the shockwave intensity is higher than the compressive strength of the rock layer is the shockwave action zone. The area where the shock wave intensity is greater than the rock layer’s anti swelling and shear strength is called the compressive stress wave area.
The mechanism used for roof cutting is the impact fracture zone, which refers to the area where the intensity of the shock wave is greater than the antiswelling and shear strength of the rock layer. The indicators for designing a shock wave generator should be such that the shock wave intensity is higher than the tensile and shear strength of the rock layer in an area 1 m away from the borehole, in order to cope with the impact of different rock layers and confining pressures on the shock wave intensity.
3.2. The Impact of Energy Storage On Rock Breaking Efficiency
3.2.1. Results and Analysis of Physical Model Tests for Energy Storage of 13.5 kJ
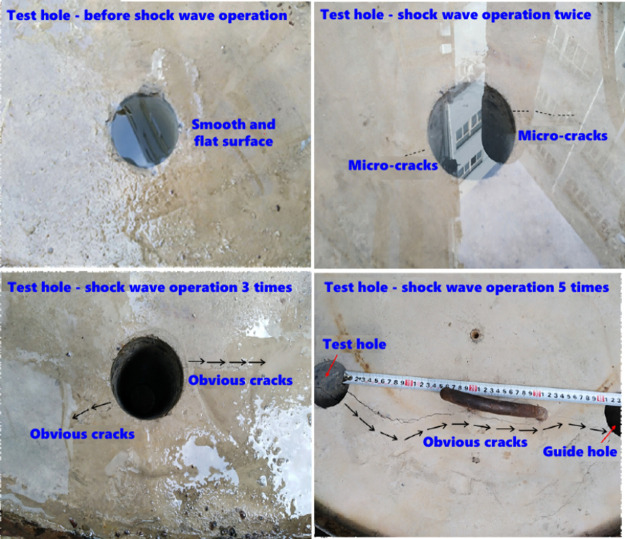
The smaller the energy storage, the smaller the equipment volume, making it more convenient to carry out operations underground. Therefore, first, a physical model test was conducted using a test platform with energy storage of 13.5 kJ and sample 1. The operation effect is shown in Figure 11: shock wave operation twice, directional microcracks with a length of about 3–5 cm are generated from the test hole to the side guide hole; Three shockwave operations, the crack length developed to about 10 cm and significantly widened; The shock wave operation was carried out 4 times, and the crack length developed to 40 cm, penetrating two holes. The crack near the test hole was wider, while the crack near the guide hole was finer; Shock wave operations were carried out 5 times, and the cracks further widened.
Figure 11.
Operational effect of shock wave on sample 1 at 13.5 kJ energy storage.
3.2.2. Results and Analysis of Physical Model Tests for Energy Storage of 30 kJ
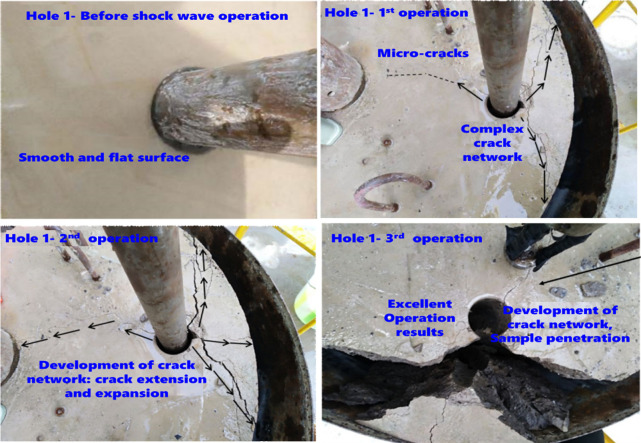
After four controllable shock wave operations at 13.5 kJ energy storage, significant through cracks appeared between the pre cracked holes, indicating a significant communication effect. In order to reduce the number of assignments, a 30 kJ energy storage experimental platform and sample 2 were used for physical model testing. The operation effect of hole 1 in sample 2 is shown in Figure 12. Under the action of multiple shock waves, the cracks in the sample exhibit a pattern of “first extending, then widening”. Shockwave operation once, directional cracks with a length of about 20 cm are exposed toward the middle guide hole of the operation hole; Perform two shockwave operations, with the crack length developing to about 30 cm, and penetrate the operation hole and guide hole; Three shockwave operations were carried out, and the cracks further widened and extended. Under the action of shock waves, not only directional cracks were formed in the sample, reducing the number of operations, but complex crack networks were also generated, effectively fracturing the sample. After two shockwave operations, a complex network of cracks is formed around the working hole; After three shockwave operations, the seam network further developed and the outer sample of the operation hole was automatically broken.
Figure 12.
Operational effect of shock wave on sample 2-hole 1 with energy storage of 30 kJ.
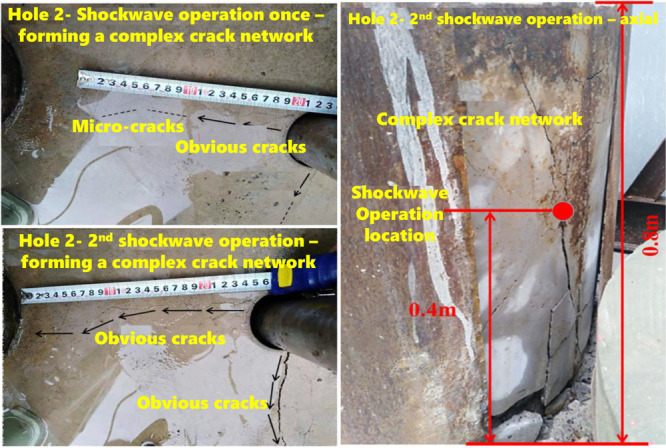
In order to obtain the optimal number of shock wave operations with rock fracturing effect, two shock wave operations were applied to hole 2 of sample 2. The operation effect is shown in Figure 13.
Figure 13.
Operation effect of shock wave on sample 2–2nd operation hole at 30 kJ energy storage.
Sample 2 was subjected to one impact operation, and directional cracks appeared in hole 2 toward the middle guide hole, with a length of about 20 cm, and complex crack networks appeared around the operation hole; The shock wave operation was carried out twice, and the crack network continued to develop. The crack developed to about 30 cm, penetrating through the operation hole and guide hole, and fractured axially within a range of 40 cm above and below the operation point. The sample on the outer side of the operation hole can be easily peeled off.
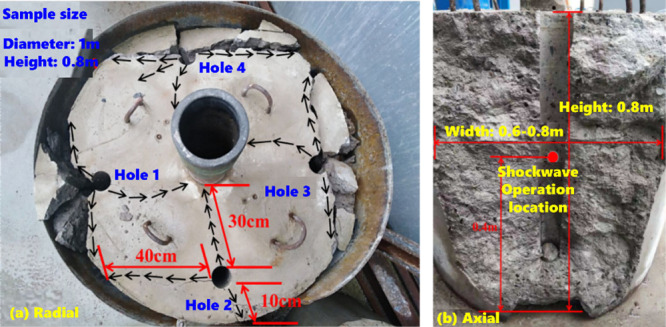
In order to further test the effect of shock wave fracturing on rocks, shock wave operations were applied three times to holes 3 and 4 of sample 2, respectively. The experimental results show that the sample has a significant fracturing effect, with both outer samples of the two working holes automatically breaking, and directional cracks appearing from the working hole to the middle guide hole; The radial operation diameter of the controllable shock wave is 0.6–0.8m, and the axial operation range is 0.8–1m, as shown in Figure 14.
Figure 14.
Operational effect of shock wave on sample 2 during 30 kJ energy storage.
The above physical model tests have verified the feasibility of coal seam roof cutting, rock roadway excavation, gangue layer/immersed rock breaking, and bottoming technology based on controllable shock wave method. Using 13.5 kJ energy storage, after 4–5 shockwave operations, the radial single side cut length reaches 40 cm; Using 30 kJ energy storage, after 2–3 shockwave operations, the radial single side cut length reaches 30 cm. The vertical operation scope is 40 cm above and below the operation point, and has a significant fracturing effect, forming a complex seam network. It can successfully break through the sample area with a height of 80 cm, a width of 60 cm, and a thickness of 10 cm along both sides of the crack.
3.3. Analysis of Rock Breaking Efficiency for Different Rock Types
3.3.1. Test Results and Analysis of High-Strength Cement
The energy storage of 50 kJ is driven by pulse power, and the energy converter uses a metal wire with a length of 120 mm and a diameter of 1.0 mm to convert energy. After a single impact on sample 1, due to the lack of confining pressure and outer protection, the physical model sample was directly exploded, and the cracking effect was very good, as shown in Figure 15a. The energy storage of 50 kJ is driven by pulse power, and the energy converter uses a metal wire with a length of 120 mm and a diameter of 1.6 mm to convert energy. After a single impact on sample 2, it also directly exploded the higher strength physical model sample. Due to the canvas bag on the outer side, it did not crack, but the cracking effect was very good, as shown in Figure 15b. The experimental results show that when the energy storage of the pulse power driving source reaches over 50 kJ, the purpose of fracturing the sandstone layer can be achieved by using appropriate metal wire loads. However, due to the lack of confining pressure in the physical model test, both the outer and upper and lower end faces are free surfaces, and the volume of the physical model sample is small, the test effect can be used as evidence for fracturing rock layers, but it is still difficult to use as a basis for the strength of the shock wave used for cutting. Further design of more realistic physical model tests is needed.
Figure 15.
Experimental results of Model Sample 1 (55 MPa) and Model Sample 2 (88 MPa with casing).
3.3.2. Test Results and Analysis of Sandstone
The pulse power drive source stores 50 kJ of energy, and the energy converter uses a metal wire with a length of 120 mm and a diameter of 1.6 mm to convert energy. After a single impact on the sample, due to the lack of confining pressure and outer protection, the physical model sample was directly exploded, and the cracking effect was very good, as shown in Figure 16.
Figure 16.
Sandstone samples after shock wave fracturing.
3.3.3. Test Results and Analysis of Granite
The test results of granite with a strength of 80 kJ: First, the strongest energy of 100 kJ was used to impact the granite red 1 sample with a strength of 80 MPa twice. According to the results, increasing the number of impacts, the results after 6 impacts are shown in Figure 17a. After reducing the energy to the minimum of 50 kJ, the test results of the red 2 sample after 6 impacts are shown in Figure 17b. Then, after increasing the energy to 70 kJ, the test results of the red 3 sample after 6 impacts are shown in Figure 17c.
Figure 17.
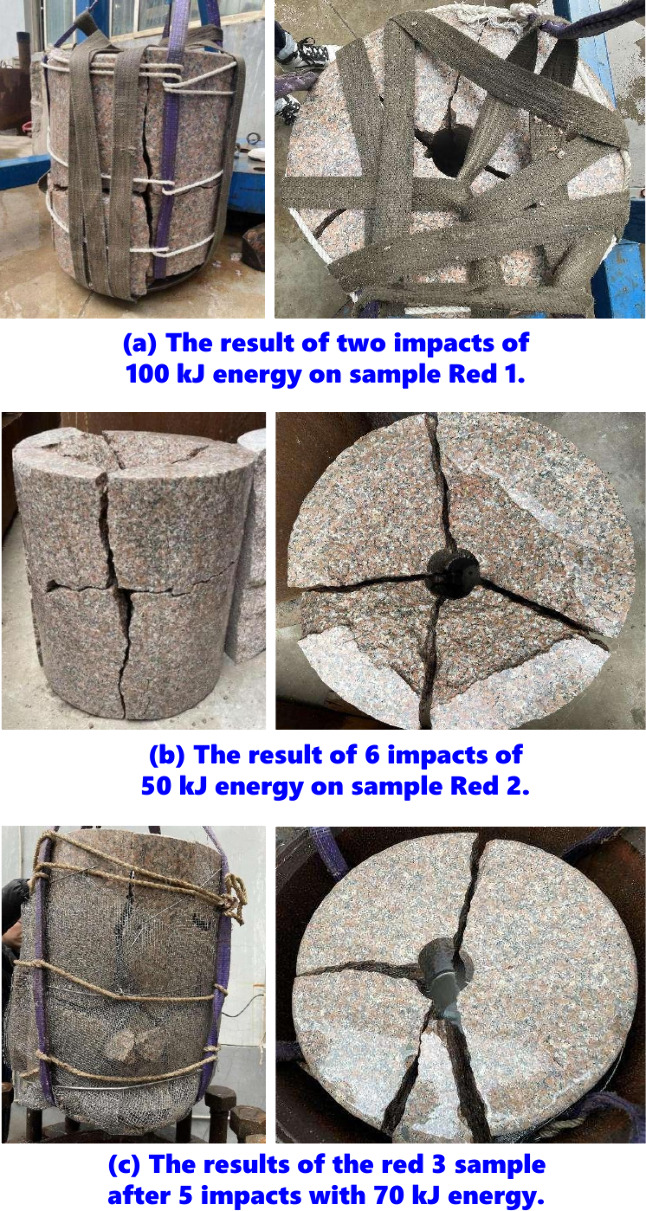
Test results of granite with a strength of 80 kJ.
Test on granite sample with a strength of 120 MPa: Similar to the above test, the experimental results of granite sample ash 1 with a strength of 120 MPa after being subjected to two impacts of 100 kJ energy are shown in Figure 18a. After reducing the energy to a minimum of 50 kJ, the test results of the red 2 sample after 6 impacts are shown in Figure 18b. Then, after increasing the energy to 70 kJ, the test results of the red 3 sample after 6 impacts are shown in Figure 18c.
Figure 18.
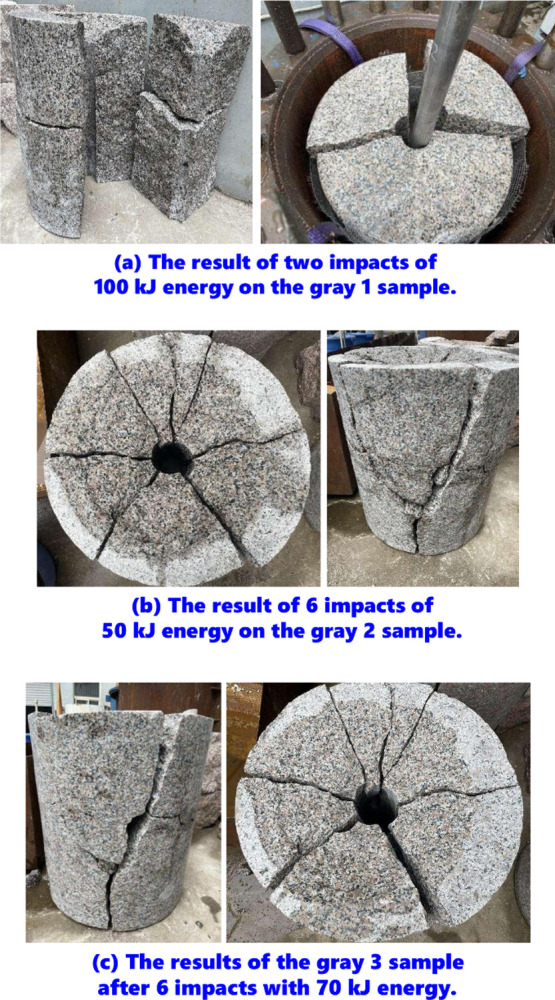
Test results of granite samples with a strength of 120 MPa.
Using high-strength granite tests to compensate for the disadvantage of the sample not being able to carry confining pressure. The experimental results of three energy levels of 50 kJ, 70 kJ, and 100 kJ, as well as 6, 6, and 2 shocks, have basically verified that the energy storage of the pulse power driving source with an energy of 100 kJ can achieve the result of fracturing material mode through 2 shocks. This result can reduce the number of impacts and alleviate the wire feeding difficulties faced by the energy converter during continuous operation.
3.3.4. Test Results and Analysis of Solid Granite
For solid granite test I: After filling the borehole with water, the energy converter is lowered to about 1.5 m inside the hole. Seal the hole with a hydraulic sealing device. Use a 100 kJ pulse power driver to drive a 2.0 mm diameter metal wire to convert shock waves for shock testing. After the experiment, no obvious cracks were found during endoscopic exploration.
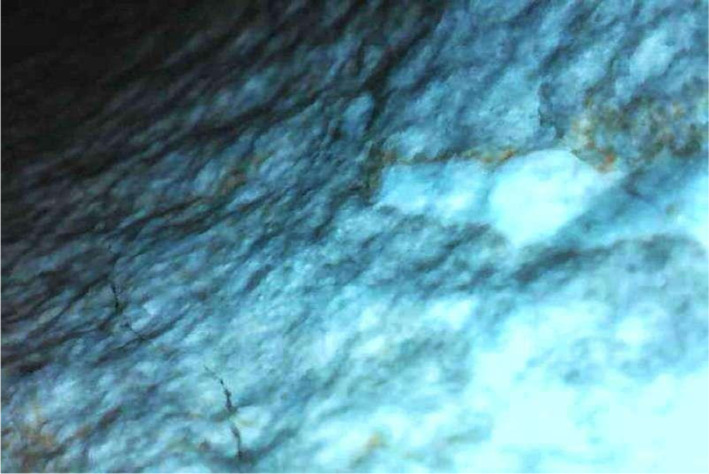
For experiment II on solid granite: The experiment uses a pulse power source with energy storage of 100 kJ to drive a metal wire with a diameter of 2.0 mm and a length of 120 mm to convert shock waves. During the experiment, most of the water injected into the adjacent guide holes was sprayed out, as shown in Figure 19a. After the experiment, endoscopic exploration was conducted on the drilling holes and adjacent guide holes where impact was implemented, and the exploration results are shown in Figure 19b.
Figure 19.
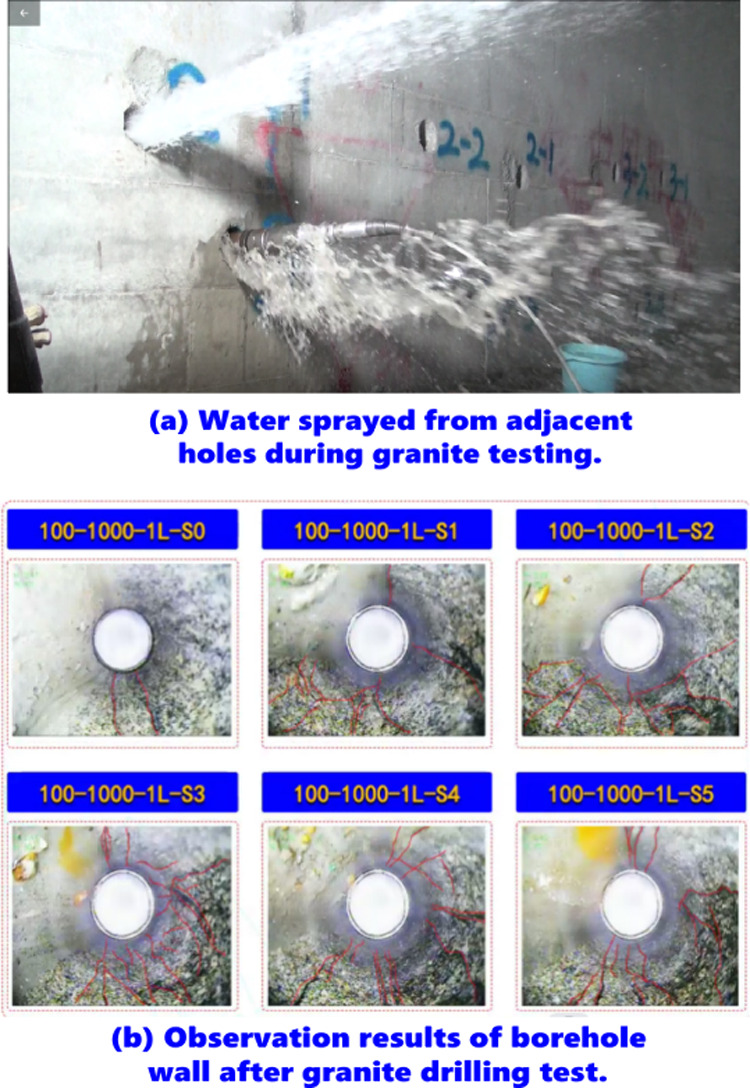
Results of experiment II on solid granite.
In the first granite body test, the equipment was not effectively supported at the orifice. The energy of the shock wave is greatly consumed in pushing the equipment out of the borehole, without effectively acting in the direction of the borehole wall. In the second granite body test, attention was paid to the support of the drilling hole on the equipment, so that the shock wave mainly acted on the hole wall. The experimental results have verified that controllable shock waves have a significant fracturing effect on hard rock layers under complete confining pressure conditions. The cracks are mainly characterized by axial tearing of 1.6–2.5m and rapidly expanding radially.
3.3.5. Test Results and Analysis of Limestone Strata
The impact test point is designed at a depth of 5 m from the orifice. Four vertical boreholes were tested in total. The experimental sequence is 2 #, 4 #, 5 #, and 1 #, with hole 3 # serving as the grounding wire hole for the pulse power drive source, as shown in Table 3.
Table 3. Test Sequence Record.
| 2 # | 4 # | 5 # | 1 # | |
|---|---|---|---|---|
| conversion mode | silk explosion 3 times | silk explosion 3 times | silk explosion 2 times | silk explosion 2 times |
| degree of cracking | medium | medium | good | good |
| number of experiments | 3 | 3 | 1 | 2 |
3.3.5.1. Test Results of Borehole 2
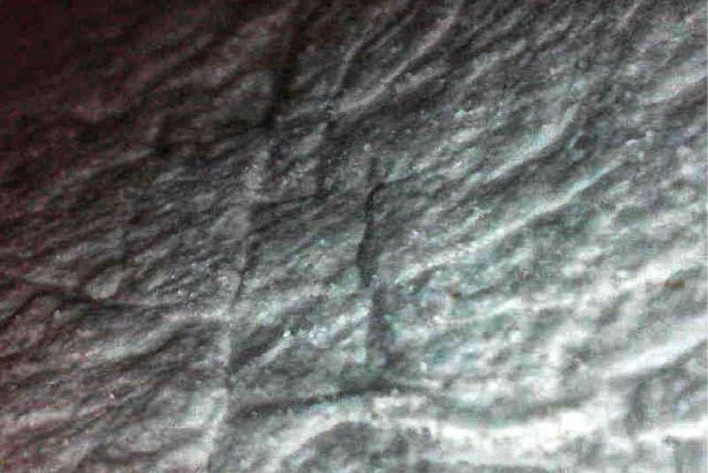
Observation results of water seepage in hole 2 after electric shock with a metal wire with a diameter of 1.0 mm: the first time the liquid level dropped by 1.2 m; The second time the liquid level drops by 1.8 m; The third time the liquid level dropped by 2.2 m. The endoscopic observation result shows that there are fine cracks at the explosion point of the 5-m hole, as shown in Figure 20.
Figure 20.
Cracks formed at the impact of hole 2.
3.3.5.2. Test Results of Borehole 4
Observation results of water seepage in hole 4 after electric shock with a 1.6 mm diameter metal wire: After the first experiment, the liquid level at the hole decreased by 2 m; After the liquid level stabilizes, add water to the borehole again until it reaches the orifice; After the second experiment, the liquid level at the orifice decreased by 2.5 m; After the liquid level stabilizes, add water to the borehole again until it reaches the orifice; After the third experiment, the liquid level at the orifice decreased by 2.8 m. The endoscopic observation result shows that there is a fine crack about 30 cm long at the explosion point of the 5-m hole, as shown in Figure 21.
Figure 21.
Fine cracks formed at the impact location of hole 4.
3.3.5.3. Test Results of Borehole 5
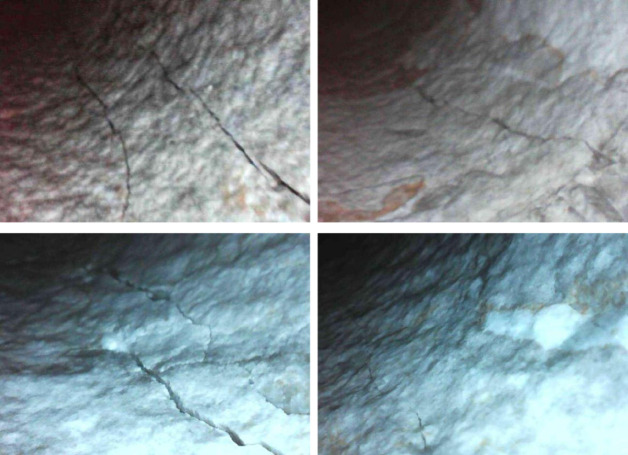
Observation results of water seepage in hole 5 after electric shock with a 2.0 mm diameter metal wire: After the first shock, the liquid level at the hole decreased by 2 m; After the liquid level stabilizes, add water to the borehole again until it reaches the orifice; After the second impact, the liquid level at the orifice decreased by 2.5 m; After the third impact, the liquid level in the hole dropped to the impact point position; After the fourth impact, the liquid level in the hole dropped to the impact point position. According to the endoscopic observation results, there are multiple fine cracks in four directions at a depth of 5 m, with the longest one being 80 cm. The cracks are perpendicular to the rock bedding. The photo of endoscopic inspection is shown in Figure 22. From Figure 22, it can be seen that the cracks in Figure 22c are relatively fine. Due to the rudimentary equipment of the endoscope, the orientation of the four cracks could not be distinguished, but inference can be made based on the experimental hole arrangement. There are adjacent holes on both sides of the test hole, which can guide the shock wave. A floating surface is conducive to shock wave fracturing, and only a surface like the interior of a rock layer has confining pressure. Therefore, the third finer crack is oriented toward the interior of the rock mass, while the other three directions have produced good cracks.
Figure 22.
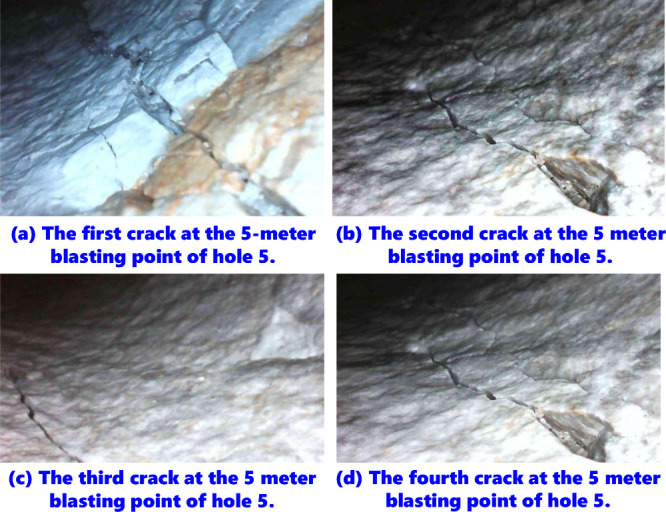
Test results of borehole 5.
3.3.5.4. Test Results of Borehole 1
The No.1 test hole was subjected to an electric shock test with a 2.0 mm diameter metal wire. In the first test hole, the liquid level dropped by 2.5 m (3.7 m-1.2 m); The liquid level in the second experimental hole decreased by 1.8 m (2.5 m-0.7 m). There is a crack observed at the impact point under the endoscope, with the longest crack being 80 cm long, as shown in Figure 23. The No.1 borehole is an edge borehole with two orientations facing the solid rock layer. Compared with No. 5, the cracks facing the No. 2 drilling hole and the orientation of the suspended surface are longer and wider, while the cracks in the orientation of the other two oriented experience layers are finer.
Figure 23.
Crack in the first orientation of borehole 1.
3.3.5.5. Vertical Drilling Test Results of Triangular Holes
The vertical hole depth of the triangular layout hole is 6m, and the operation point is set at 5m. Using a 3 × 40 kJ pulse power drive source with three cables, each channel outputs 40 kJ of electrical energy, and drives three energy converters using metal wires with diameters of 1.0, 1.6, and 2.0 mm to work simultaneously on holes 7, 8, and 9. The ninth borehole used an energy converter with a 1.0 mm diameter metal wire. After the experiment, the liquid level in the borehole decreased by 1 m (1.8 m-0.8 m), and no cracks were found on the endoscope. The eighth drilling hole used an energy converter with a 1.6 mm diameter metal wire, and after the experiment, the liquid level in the hole decreased by 0.6m (2.6 m-2 m). Endoscopy revealed cracks perpendicular to the rock bedding planes, as shown in on-site photos in Figure 24a. The seventh hole uses an energy converter with a 2.0 mm diameter metal wire, and after the experiment, the liquid level in the hole drops by 1.3 m (2.9 m-1.6 m). The endoscope revealed obvious cracks, which were divergent in shape, as shown in Figure 24b.
Figure 24.
Vertical drilling test results of triangular holes.
3.3.5.6. Experimental Situation of Triangular Hole Arrangement in Horizontal Drilling
The horizontal drilling holes for triangular layout are numbered 10, 11, and 12, with a depth of 3 m, and the operation point is set at 2 m. A 3 × 40 kJ pulse power driving source was used, with each channel outputting 40 kJ of electrical energy. The energy converters using metal wires with diameters of 1.0, 1.6, and 2.0 mm were respectively driven to generate shock waves, which were operated simultaneously in three holes, with one shock each. The energy converter with a diameter of 1.0 mm metal wire was used for drilling hole 10. After the experiment, the liquid level in the hole decreased by 1 m, and there were no obvious cracks observed under the endoscope. The 11th hole was drilled using an energy converter with a 1.6 mm diameter metal wire. After the experiment, the liquid level in the hole decreased by 1.1 m, and there were obvious cracks observed under the endoscope. The cracks were perpendicular to the rock fractures, as shown in Figure 25a. The energy converter with a 1.6 mm diameter metal wire was used for drilling hole 12. After the experiment, the liquid level in the hole dropped by 1.2 m, and there were obvious cracks observed under the endoscope. The cracks were divergent, as shown in Figure 25b. It can be seen that for limestone with higher strength than sandstone, no matter what parameters of metal wire are used, the effect of fracturing limestone is not good enough when the energy storage is 40 kJ. Therefore, it is necessary to increase the energy storage of the pulse power driving source and match more optimized metal wire parameters.
Figure 25.
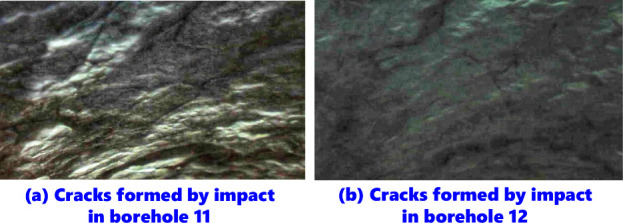
Experimental situation of triangular hole arrangement in horizontal drilling.
3.3.5.7. Test Situation in Horizontal Drilling
The horizontal drilling holes for parallel drilling are numbered 13 and 14, with a depth of 3 m, and the operation point is set at 2 m. A 3 × 40 kJ pulse power drive source was used, with a single output of 100 kJ electrical energy. In borehole 13, the energy converter used a 2.0 mm diameter metal wire for a total of 3 impacts. In borehole 14, the energy converter used a 1.6 mm diameter metal wire for a total of 3 impacts. After the impact of drilling hole 13, all the water in the hole infiltrated the rock mass, and no liquid level was observed. Four cracks were observed under the endoscope. Three cracks are perpendicular to the rock joint, and one crack is perpendicular to the rock joint, as shown in Figure 26a. After the impact of drilling hole No. 14, all water in the hole infiltrated the rock mass, and no liquid level was observed. An obvious crack was observed under an endoscope, with the longest one being 80 cm long. The crack is perpendicular to the rock joint, as shown in Figure 26b.
Figure 26.
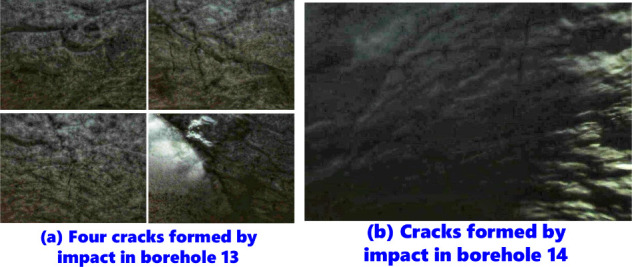
Test situation in horizontal drilling.
On the basis of the previous physical model test and solitary rock test without confining pressure, this experiment achieved the fracturing test in the overall rock layer. It has been preliminarily confirmed that a pulse power source with energy storage of 100 kJ can drive a 2.0 mm metal wire to achieve fracturing of the entire rock layer. In the fracturing test, the energy converter in the downward vertical drilling is affected by gravity, and most of the shock wave energy acts on the rock layer, resulting in better results. In horizontal drilling, some of the shock wave energy is consumed by pushing the energy converter out of the hole, resulting in relatively poor fracturing effect. In future roof cutting operations, the propulsion rod and drilling rig supporting the energy converter need to be able to withstand sufficient recoil force, so that the shock wave energy mainly acts on the roof rock layer.
4. Conclusions
In this paper, the impact of energy storage on rock breaking efficiency was analyzed, and the rock breaking efficiency of controllable shock waves under different rock conditions is analyzed. Key findings are summarized below:
-
(a)
The physical model tests have verified the feasibility of coal seam roof cutting, rock roadway excavation, gangue layer/immersed rock breaking, and bottoming technology based on controllable shock wave method. Using 13.5 kJ energy storage, after 4–5 shockwave operations, the radial single side cut length reaches 40 cm.
-
(b)
Using 30 kJ energy storage, after 2–3 shockwave operations, the radial single side cut length reaches 30 cm. The vertical operation scope is 40 cm above and below the operation point, and has a significant fracturing effect, forming a complex seam network. It can successfully break through the sample area with a height of 80 cm, a width of 60 cm, and a thickness of 10 cm along both sides of the crack.
-
(c)
The energy storage of 50 kJ is driven by pulse power, and the energy converter uses a metal wire with a length of 120 mm and a diameter of 1.0 mm to convert energy; The energy storage of 50 kJ is driven by pulse power, and the energy converter uses a metal wire with a length of 120 mm and a diameter of 1.6 mm to convert energy.
-
(d)
When the energy storage design of the pulse power drive source is 100 kJ, the existing metal wire electric explosion energy conversion efficiency and three impacts can meet the cutting seam requirements of most coal seam roofs. After three impacts, cracks with a radius of 1 m can be generated in the radial direction of the borehole, extending toward the direction of the inner borehole. A crack area of 1.2 m can be generated along the borehole direction.
Acknowledgments
There is no funding.
The authors declare no competing financial interest.
References
- Wei C.; Li S.; Yu L.; Zhang B.; Liu R.; Pan D.; Zhang F. Study on Mechanism of Strength Deterioration of Rock-Like Specimen and Fracture Damage Deterioration Model Under Pulse Hydraulic Fracturing. Rock Mech. Rock Eng. 2023, 56, 4959–4973. 10.1007/s00603-023-03313-3. [DOI] [Google Scholar]
- Liu B.; Mohammadi M.; Ma Z.; Bai L.; Wang L.; Xu Y.; Ostadhassan M.; Hemmati-Sarapardeh A. Evolution of porosity in kerogen type I during hydrous and anhydrous pyrolysis: Experimental study, mechanistic understanding, and model development. Fuel 2023, 338, 127149 10.1016/j.fuel.2022.127149. [DOI] [Google Scholar]
- Wang Y.; Mao C.; Duan X. Coupling of Paleosedimentary Environment and Lithofacies: Implications for Shale Oil Enrichment in the Lianggaoshan Formation, Northeastern Sichuan Basin, China. ACS Omega 2024, 9, 28237. 10.1021/acsomega.4c01542. [DOI] [PMC free article] [PubMed] [Google Scholar]
- Liu B.; Yang Y.; Li J.; Chi Y.; Li J.; Fu X. Stress sensitivity of tight reservoirs and its effect on oil saturation: A case study of Lower Cretaceous tight clastic reservoirs in the Hailar Basin, Northeast China. J. Pet. Sci. Eng. 2020, 184, 106484 10.1016/j.petrol.2019.106484. [DOI] [Google Scholar]
- Liu B.; Sun J.; Zhang Y.; He J.; Fu X.; Yang L.; Xing J.; Zhao X. Reservoir space and enrichment model of shale oil in the first member of Cretaceous Qingshankou Formation in the Changling sag, southern Songliao Basin. NE China. Petroleum Exploration and Development 2021, 48 (3), 608–624. 10.1016/S1876-3804(21)60049-6. [DOI] [Google Scholar]
- Liu B.; Song Y.; Zhu K.; Su P.; Ye X.; Zhao W. Mineralogy and element geochemistry of salinized lacustrine organic-rich shale in the Middle Permian Santanghu Basin: Implications for paleoenvironment, provenance, tectonic setting and shale oil potential. Marine and Petroleum Geology 2020, 120, 104569 10.1016/j.marpetgeo.2020.104569. [DOI] [Google Scholar]
- Gong D.; Bai X.; Gao Z.; Qin Z.; Wang Z.; Wei W.; Yang A.; Wang R. Occurrence Mechanisms of Laminated-Type and Sandwich-Type Shale Oil in the Fengcheng Formation of Mahu Sag. Junggar Basin. Energy & Fuels 2023, 37 (18), 13960–13975. 10.1021/acs.energyfuels.3c02625. [DOI] [Google Scholar]
- Liu B.; Wang H.; Fu X.; Bai Y.; Bai L.; Jia M.; He B. Lithofacies and depositional setting of a highly prospective lacustrine shale oil succession from the Upper Cretaceous Qingshankou Formation in the Gulong Sag, northern Songliao Basin, Northeast China. AAPG Bulletin 2019, 103, 405–432. 10.1306/08031817416. [DOI] [Google Scholar]
- Niu Z.; Wang Y.; Li Z.; Wang R.; Wang X.; Wang X. Analysis of the Spatial Distribution Characteristics of Crude Oils with Different Freezing Points and the Genetic Mechanism of High-Freezing-Point Crude Oils in the Dongying Sag. ACS Omega 2023, 8 (38), 35093–35106. 10.1021/acsomega.3c04555. [DOI] [PMC free article] [PubMed] [Google Scholar]
- Meng S.; Li D.; Liu X.; Zhang Z.; Tao J.; Yang L.; Rui Z. Study on dynamic fracture growth mechanism of continental shale under compression failure. Gas Sci. Eng. 2023, 114, 204983 10.1016/j.jgsce.2023.204983. [DOI] [Google Scholar]
- Zhang S.; Liao S.; Li S.; Hu J. Influence of Engineering Parameters on Fracture Vertical Propagation in Deep Shale Reservoir: A Numerical Study Based on FEM. ACS Omega 2024, 9 (4), 4635–4646. 10.1021/acsomega.3c07862. [DOI] [PMC free article] [PubMed] [Google Scholar]
- Tao J.; Meng S.; Li D.; Rui Z.; Liu H.; Xu J. Analysis of CO2 effects on porosity and permeability of shale reservoirs under different water content conditions. Geoenergy Sci. Eng. 2023, 226, 211774 10.1016/j.geoen.2023.211774. [DOI] [Google Scholar]
- Yu H.; Xu W.; Li B.; Huang H.; Micheal M.; Wang Q.; Huang M.; Meng S.; Liu H.; Wu H. Hydraulic Fracturing and Enhanced Recovery in Shale Reservoirs: Theoretical Analysis to Engineering Applications. Energy Fuels 2023, 37 (14), 9956–9997. 10.1021/acs.energyfuels.3c01029. [DOI] [Google Scholar]
- Siwei M.; Zihan Z.; Jiaping T.; Chuanqing Z.; Liu Y.; Jianchun X. A Novel Upscaling Method for Evaluating Mechanical Properties of the Shale Oil Reservoir Based on Cluster Analysis and Nanoindentation. J. Energy Resour. Technol. 2023, 145 (11), 112901 10.1115/1.4062248. [DOI] [Google Scholar]
- Liu H.; Huang Y.; Cai M.; Meng S.; Tao J. Practice and development suggestions of hydraulic fracturing technology in the Gulong shale oil reservoirs of Songliao Basin, NE China. Pet. Explor. Dev. 2023, 50 (3), 688–698. 10.1016/S1876-3804(23)60420-3. [DOI] [Google Scholar]
- Wang Z.; Fang H.; Sang S.; Guo J.; Yu S.; Liu H.; Xu H. Comprehensive Analysis of Connectivity and Permeability of a Pore-Fracture Structure in Low Permeability Seam of Huainan–Huaibei Coalfield. ACS Omega 2024, 9 (13), 15357–15371. 10.1021/acsomega.3c10247. [DOI] [PMC free article] [PubMed] [Google Scholar]
- Yuan B.; Zhao Z.; Meng S.; et al. Intelligent identification and real-time warning method of diverse complex events in horizontal well fracturing. Pet. Explor. Dev. 2023, 50 (6), 1487–1496. 10.1016/S1876-3804(24)60482-9. [DOI] [Google Scholar]
- Liu H.; Meng S. W.; Wang S. L.; et al. Mechanical characteristics and fracture propagation mechanism of the Gulong shale. Oil Gas Geol. 2023, 44 (04), 820–828. [Google Scholar]
- Liu X.; Meng S.; Liang Z.; Tang C.; Tao J.; Tang J. Microscale crack propagation in shale samples using focused ion beam scanning electron microscopy and three-dimensional numerical modeling. Petroleum Science 2023, 20 (3), 1488–1512. 10.1016/j.petsci.2022.10.004. [DOI] [Google Scholar]
- Lv R.; Guo H.; Zhu L.; Ni X. Optimization of the Layer Location of Extraction Wells Based on the Unpressurized Gas Transport Law. ACS Omega 2024, 9 (13), 15468–15480. 10.1021/acsomega.4c00299. [DOI] [PMC free article] [PubMed] [Google Scholar]
- Liu H.; Kuang L.; Li G.; Wang F.; Jin X.; Tao J.; Meng S. Considerations and suggestions on optimizing completion methods of continental shale oil in China. Acta Pet. Sin. 2020, 41 (4), 489–496. [Google Scholar]
- Zhao J. Effect of burial depth on reservoir petrophysical properties and development performance of deep coalbed methane reservoirs: A case of Yanchuannan Block in southeastern margin of Ordos Basin. Pet. Geol. Recovery Effic. 2022, 29 (3), 62–67. [Google Scholar]
- Min C.; Zhang X.; Yang Z. Identification of main controlling factors of fracturing performance in coalbed methane wells based on CBFS-CV algorithm. Pet. Geol. Recovery Effic. 2022, 29 (1), 168–174. [Google Scholar]
- Ehsan M.; Chen R.; Latif M. A. U.; Abdelrahman K.; Ali A.; Ullah J.; Fnais M. S. Unconventional Reservoir Characterization of Patala Formation, Upper Indus Basin. Pakistan. ACS Omega 2024, 9 (13), 15573–15589. 10.1021/acsomega.4c00465. [DOI] [PMC free article] [PubMed] [Google Scholar]
- Lai P.; Wang H.; Wang Y.; Li W.; Xing D.; Du S.; Zhang G. Influence of tectonic activities on CBM enrichment and accumulation in Junnan Coalfield. Unconv. Oil Gas 2024, 11 (05), 37–43. [Google Scholar]
- Lai S.; Huang F.; Chen K.; Liu Y.; Li B.; Jin F.; Zhang J.; Qi Y. Experimental study on pulsed pneumatic pre-fracturing grouting in sandy and clayey-silty hydrate-bearing sediments. Gas Science and Engineering 2024, 126, 205338 10.1016/j.jgsce.2024.205338. [DOI] [Google Scholar]
- Liu Y.; Yao C.; Liu B.; Xuan Y.; Du X. Performance Prediction and Heating Parameter Optimization of Organic-Rich Shale In Situ Conversion Based on Numerical Simulation and Artificial Intelligence Algorithms. ACS Omega 2024, 9 (13), 15511–15526. 10.1021/acsomega.4c00323. [DOI] [PMC free article] [PubMed] [Google Scholar]
- Su Y. New progress and development countermeasures of Shanxi CBM exploration and mining. Unconv. Oil Gas 2024, 11 (03), 1–9. [Google Scholar]
- Soliman M. Y.; Rezaei A.; Khalaf M.; Gordon P.; Cipolla C. Pulse power plasma stimulation: A technique for waterless fracturing, enhancing the near wellbore permeability, and increasing the EUR of unconventional reservoirs. Gas Sci. Eng. 2024, 122, 205201 10.1016/j.jgsce.2023.205201. [DOI] [Google Scholar]
- Sun F.; Yao Y.; Chen M.; Li X.; Zhao L.; Meng Y.; Sun Z.; Zhang T.; Feng D. Performance analysis of superheated steam injection for heavy oil recovery and modeling of wellbore heat efficiency. Energy 2017, 125, 795–804. 10.1016/j.energy.2017.02.114. [DOI] [Google Scholar]
- Liu Y.; Mu S.; Guo J.; Li Q.; Hu D.; Wang S. Analytical model for fracture conductivity considering rod proppant in pulse fracturing. J. Pet. Sci. Eng. 2022, 217, 110904 10.1016/j.petrol.2022.110904. [DOI] [Google Scholar]
- Liu W.; Zhang Y.; Zhu X. The partial electrical breakdown mechanism by high voltage electric pulses in multi-fractured granite. Geomechanics for Energy and the Environment 2023, 34, 100459 10.1016/j.gete.2023.100459. [DOI] [Google Scholar]
- Sun F.; Yao Y.; Li X. The Heat and Mass Transfer Characteristics of Superheated Steam Coupled with Non-condensing Gases in Horizontal Wells with Multi-point Injection Technique. Energy 2018, 143, 995–1005. 10.1016/j.energy.2017.11.028. [DOI] [Google Scholar]
- Guo L.; Zhang N.; Yu Y.; Xu W.; Gao L.; Hou X.; Chen S.; Wu S.; Tian F. Pulse Pressure Variability and the Risk of Fragility Fracture: The Kailuan Prospective Cohort Study in China. Bone 2023, 173, 116776 10.1016/j.bone.2023.116776. [DOI] [PubMed] [Google Scholar]
- Yu X.; Chen A.; Hong L.; Zhai C.; Regenauer-lieb K.; Sang S.; Xu J.; Jing Y. Experimental investigation of the effects of long-period cyclic pulse loading of pulsating hydraulic fracturing on coal damage. Fuel 2024, 358, 129907 10.1016/j.fuel.2023.129907. [DOI] [Google Scholar]
- Sun F.; Yao Y.; Li G.; Li X. Geothermal energy extraction in CO2 rich basin using abandoned horizontal wells. Energy 2018, 158, 760–773. 10.1016/j.energy.2018.06.084. [DOI] [Google Scholar]
- Wang Y.; Li X.; Zhao B.; Zhang Z. 3D numerical simulation of pulsed fracture in complex fracture-cavitied reservoir. Computers and Geotechnics 2020, 125, 103665 10.1016/j.compgeo.2020.103665. [DOI] [Google Scholar]
- Lin Y.; Ma J.; Lai Z.; Huang L.; Lei M. A FDEM approach to study mechanical and fracturing responses of geo-materials with high inclusion contents using a novel reconstruction strategy. Engineering Fracture Mechanics 2023, 282, 109171 10.1016/j.engfracmech.2023.109171. [DOI] [Google Scholar]
- Sun F.; Yao Y.; Li G.; Li X. Performance of geothermal energy extraction in a horizontal well by using CO2 as the working fluid. Energy Conversion and Management 2018, 171, 1529–1539. 10.1016/j.enconman.2018.06.092. [DOI] [Google Scholar]
- Xue Y.; Ranjith P. G.; Gao F.; Zhang Z.; Wang S. Experimental investigations on effects of gas pressure on mechanical behaviors and failure characteristic of coals. Journal of Rock Mechanics and Geotechnical. Engineering 2023, 15 (2), 412–428. 10.1016/j.jrmge.2022.05.013. [DOI] [Google Scholar]
- Sun F.; Yao Y.; Li G.; Li X. Geothermal energy development by circulating CO2 in a U-shaped closed loop geothermal system. Energy Conversion and Management 2018, 174, 971–982. 10.1016/j.enconman.2018.08.094. [DOI] [Google Scholar]
- Wu Q.; Liu Y.; Tang H.; Kang J.; Wang L.; Li C.; Wang D.; Liu Z. Experimental study of the influence of wetting and drying cycles on the strength of intact rock samples from a red stratum in the Three Gorges Reservoir area. Engineering Geology 2023, 314, 107013 10.1016/j.enggeo.2023.107013. [DOI] [Google Scholar]
- Huang L.; Tan J.; Fu H.; Liu J.; Chen X.; Liao X.; Wang X.; Wang C. The non-plane initiation and propagation mechanism of multiple hydraulic fractures in tight reservoirs considering stress shadow effects. Engineering Fracture Mechanics 2023, 292, 109570 10.1016/j.engfracmech.2023.109570. [DOI] [Google Scholar]
- Sun F.; Liu D.; Cai Y.; Qiu Y. Coal rank-pressure coupling control mechanism on gas adsorption/desorption in coalbed methane reservoirs. Energy 2023, 270, 126849 10.1016/j.energy.2023.126849. [DOI] [Google Scholar]
- Wei M.; Dai F.; Liu Y.; Jiang R. A fracture model for assessing tensile mode crack growth resistance of rocks. Journal of Rock Mechanics and Geotechnical Engineering 2023, 15 (2), 395–411. 10.1016/j.jrmge.2022.03.001. [DOI] [Google Scholar]
- Sun F.; Liu D.; Cai Y.; Qiu Y. Surface jump mechanism of gas molecules in strong adsorption field of coalbed methane reservoirs. Applied Energy 2023, 349, 121605 10.1016/j.apenergy.2023.121605. [DOI] [Google Scholar]
- Ma Q.; Liu X.; Tan Y.; Elsworth D.; Shang J.; Song D.; Liu X.; Yan F. Numerical study of mechanical properties and microcrack evolution of double-layer composite rock specimens with fissures under uniaxial compression. Eng. Fract. Mech. 2023, 289, 109403 10.1016/j.engfracmech.2023.109403. [DOI] [Google Scholar]
- Xin J.; Jiang Q.; Li S.; Chen P.; Zhao H. Fracturing and Energy Evolution of Rock Around Prefabricated Rectangular and Circular Tunnels Under Shearing Load: A Comparative Analysis. Rock Mech. Rock Eng. 2023, 56, 9057–9084. 10.1007/s00603-023-03532-8. [DOI] [Google Scholar]
- Liu J.; Mei L.; Ding W.; Xu K.; Yang H.; Liu Y. Asymmetric propagation mechanism of hydraulic fracture networks in continental reservoirs. GSA Bulletin 2023, 135 (3–4), 678–688. 10.1130/B36358.1. [DOI] [Google Scholar]
- Prasad S. K.; Sangwai J. S.; Byun H. A review of the supercritical CO2 fluid applications for improved oil and gas production and associated carbon storage. Journal of CO2 Utilization 2023, 72, 102479 10.1016/j.jcou.2023.102479. [DOI] [Google Scholar]
- Wu M.; Jiang C.; Song R.; Liu J.; Li M.; Liu B.; Shi D.; Zhu Z.; Deng B. Comparative study on hydraulic fracturing using different discrete fracture network modeling: Insight from homogeneous to heterogeneity reservoirs. Engineering Fracture Mechanics 2023, 284, 109274 10.1016/j.engfracmech.2023.109274. [DOI] [Google Scholar]
- Zhang Y.; Zhao Y.; Zang A.; Long A. Acoustic Emission Evolution and Hydraulic Fracture Morphology of Changning Shale Stressed to Failure at Different Injection Rates in the Laboratory. Rock Mech. Rock Eng. 2024, 57, 1287–1308. 10.1007/s00603-023-03586-8. [DOI] [Google Scholar]
- Wu L.; Hou Z.; Luo Z.; Xiong Y.; Zhang N.; Luo J.; Fang Y.; Chen Q.; Wu X. Numerical simulations of supercritical carbon dioxide fracturing: A review. J. Rock Mech. Geotech. Eng. 2023, 5 (7), 1895–1910. 10.1016/j.jrmge.2022.08.008. [DOI] [Google Scholar]
- Shams G.; Rivard P.; Moradian O. Observation of fracture process zone and produced fracture surface roughness in granite under Brazilian splitting tests. Theoretical and Applied Fracture Mechanics 2023, 125, 103680 10.1016/j.tafmec.2022.103680. [DOI] [Google Scholar]
- Ge Z.; Zhang H.; Zhou Z.; Cao S.; Zhang D.; Liu X.; Tian C. Experimental study on the characteristics and mechanism of high-pressure water jet fracturing in high-temperature hard rocks. Energy 2023, 270, 126848 10.1016/j.energy.2023.126848. [DOI] [Google Scholar]
- Cai X.; Yuan J.; Zhou Z.; Pi Z.; Tan L.; Wang P.; Wang S.; Wang S. Effects of hole shape on mechanical behavior and fracturing mechanism of rock: Implications for instability of underground openings. Tunnelling and Underground Space Technology 2023, 141, 105361 10.1016/j.tust.2023.105361. [DOI] [Google Scholar]
- Song Z.; Zhang J.; Zhang Y.; Dong X.; Wang S. Characterization and evaluation of brittleness of deep bedded sandstone from the perspective of the whole life-cycle evolution process. International Journal of Mining Science and Technology 2023, 33 (4), 481–502. 10.1016/j.ijmst.2022.12.007. [DOI] [Google Scholar]


