Abstract
In amblyopia, abnormal binocular interactions lead to an overwhelming dominance of one eye. One mechanism implied in this imbalance is the suppression between the inputs from the two eyes. This interocular suppression involves two components: an overlay suppression and a surround suppression. Here, we propose a new method for measuring surround suppression which has been demonstrated in both strabismic and anisometropic amblyopes, based on a novel interocular contrast scaling task, suitable for use as a clinical tool. We compare the results obtained with this method against those from another method designed to measure overlay suppression: the Dichoptic Letter Test. We find a strong correlation between the results obtained with the two methods. Additionally, we observe strong correlations between the imbalance measured with the two tests and visual acuity and stereopsis. Altogether this suggests that amblyopic suppression is spatially broad and has direct relevance in global vision. So our new method is a relevant, clinically suitable tool to track the disease state in amblyopia.
Supplementary Information
The online version contains supplementary material available at 10.1038/s41598-024-82899-2.
Subject terms: Neuroscience, Visual system
Introduction
Although suppression has always been recognized as a part of the amblyopic syndrome (together with loss of binocularity and reduced monocular acuity), its importance has possibly been underappreciated. The past two decades of laboratory studies1 have advanced the view that the loss of binocularity which is a common feature of the condition2 is, in fact, the primary deficit and the loss of monocular acuity, its consequence3. Suppression is thought to play a key role in the binocular deficit4 and yet there is no convenient means of quantifying it in the clinic. The popular Worth Four Dot test is only a qualitative measure5. The need for a quantitative measure arises from the finding that the majority of amblyopes have a latent form of binocular vision4. This latent binocularity may only be revealed once suppression is reduced under special dichoptic viewing conditions. Treatments for the binocular deficit have been devised based on this finding. With these, strengthening of the fusional capacity can (over time) lead to a restoration of binocular vision6–8.
Through the use of artificial viewing conditions where the two eyes are unequally stimulated, the depth of interocular suppression can be reduced in amblyopia. This reveals underlying binocular function, which had conventionally been thought to be completely absent4. This approach has a theoretical basis in rebalancing the reciprocal inhibitory circuits described above. Although our understanding of suppression in amblyopia is far from complete9, we have learned a great deal of its spatio-temporal and visual field dependencies from numerous laboratory studies employing a wide variety of different experimental approaches. A convenient clinical tool to quantify suppression would allow the assessment and refinement of new therapeutic approaches to treat amblyopia. A non-exhaustive list of quantitative tools designed to measure imbalances in binocular vision is provided elsewhere (in Table A1 of Appendix A in Ref.10).
The task and stimulus design of each test determines whether it provides measurement of overlay suppression, surround suppression, or a combination of the two. Overlay suppression is defined as the suppression between the stimulation of corresponding points in the visual field of the two eyes. Surround suppression, in its most general sense (i.e. not just limited to circularly symmetric regions) involves the suppression occurring between regions of the visual field that are non-corresponding in the two eyes. In amblyopia, surround suppression is important11 and can be between regions in the two eyes that are separated by 10° or more ( e.g. see12). The imbalance in amblyopia is often thought of as arising from overlay suppression, perhaps due to the highly influential neurophysiology studies that described imbalances in the responses of cortical neurons to inputs from the two eyes at corresponding locations13–15. However, there are examples of profound suppression from non-corresponding stimuli in the two eyes9,12. In only one study has surround and overlay suppression been compared with the same stimuli11. Their results indicated comparable contributions from these both types of suppression in amblyopia.
Recently we have developed a method of measuring dichoptic surround suppression, the Dichoptic Contrast Ordering Test (DiCOT). The test works by having the participant rank the perceived contrast/perceived visibility of a number of visual icons or sprite images in order from highest to lowest. These stimuli are viewed dichoptically, such that half of the sprites are seen by each eye. In this way, each eye sees different sprites and any suppressive interaction is between the sprites from eye and the sprites from disparity regions of the other eye. We term these surround interactions because they involve stimuli that are separated in space12. A novel algorithm manipulates the luminance contrasts seen by each eye to find a scaling parameter that balances the perceived contrast seen by each eye10. Another recently-proposed clinical test for interocular suppression instead targets overlay suppression. The Dichoptic Letter Test (DLT)16 involves the identification of dichoptic letters that have different contrasts in the two eyes. The contrasts seen by the two eyes are adjusted to find the point at which the participant is equally likely to report the letter presented to each eye.
So, here, our goal was to test our newly developed application, and validate it in a clinical setting, using a very quick and engaging protocol against the most common test presently in used16. We compare the test-retest reliability of these two recent clinical tests for amblyopic interocular suppression: the DiCOT that targets surround suppression and the DLT that targets overlay suppression. Our results reveal that both tests are similarly reliable, are moderately correlated with each other, and give measurements that are related to two established indices of the severity of amblyopia (visual acuity and stereoacuity).
Materials and methods
Participants
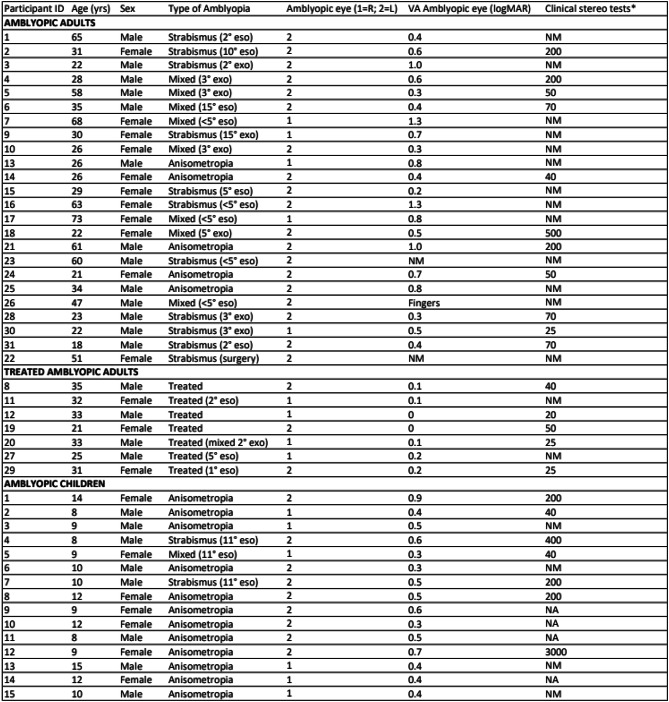
A total of 46 amblyopic participants took part in the study (43% female). These included subgroups of amblyopic adults (n = 23), successfully treated amblyopic adults (n = 8) and amblyopic children (n = 15). Participant ages ranged from 8 to 73 years. Visual acuity of the amblyopic eye was measured using an ETDRS acuity chart with Sloan letters, ranged from 0 to 1.3 logMAR (Mean = 0.5, standard deviation = 0.3). The amblyopia was associated with either strabismus (n = 10), anisometropia (n = 24) or mixed deficits (n = 4). These clinical characteristics are detailed in Table 1.
Table 1.
Details of amblyopic participants tested in this study.
*Randot stereo test was used in adults, and the Titmus test in children. The standard for a “treated” amblyopic participant was one with a remaining acuity deficit < 0.2 logMAR. Key: NA, “not available”; NM, “not measurable”.
Experiments were conducted in accordance with the protocol approved by the institutional research ethics board of the McGill University Health Center and complying with the Declaration of Helsinki. Written informed consent was obtained from all participants or their parent and/or legal guardian for children. All participants were tested wearing their best correction. Best-corrected visual acuity was measured using a Snellen chart. Stereoacuity was measured in adults with the Randot Preschool and in children with the Titmus Stereotest (both Stereo Optical Co. Inc, Chicago, IL, USA).
Experimental design
Interocular suppression was measured using the Dichoptic Letter Test (DLT)16 and our newly-developed Dichoptic Contrast Ordering Test (DiCOT)12. Procedures and apparatus for these 2 tests are detailed briefly below. In order to produce a wide range of interocular suppression, amblyopic participants were chosen to have a wide range of acuity deficits1. To measure test–retest repeatability, all measures were performed three times successively in a same session.
Methods for dichoptic contrast ordering test
Stimuli and apparatus
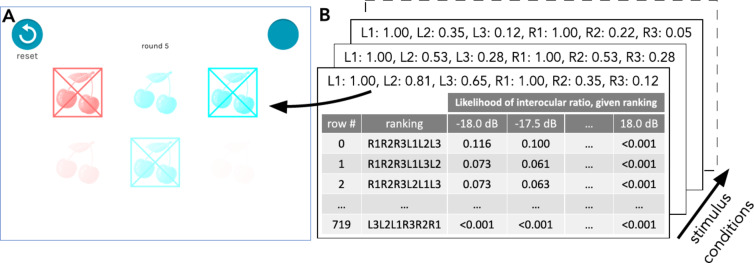
Cyan and red sprites representing fruits drawings (i.e., apple, cherry or grape) were displayed on a uniform white background (561 cd/m2) with varying contrasts (Fig. 1). At the viewing distance of 40 cm, the field size was 28° by 21°. Viewed through red/green anaglyph glasses, stimuli were presented on an iPad (model: iPad mini 5th generation A2133; resolution: 2048 × 1536). The screen luminance was 26 cd/ m2 through the red filter, and 52 cd/m2 through the green filter. The Cross-talk measurements were 20% in red filter and 3% in green filter. Importantly, the use of the anaglyph method on a white background ensures that the stimuli seen by each eye are seen as dark against a light background and the no chromatic contrast. The contrast was perceptually calibrated to be equal through each filter such that the contrast range was similar in both eyes. The contrast is defined as the negative luminance difference relative to the background.
Fig. 1.
Conditions for a single trial of the DiCOT. (A) Shows a screenshot of a trial where the left eye stimuli (in red for illustrative purposes) have contrasts of 100%, 35%, and 12% and the right eye stimuli (in green for illustrative purposes) have contrasts of 100%, 81%, and 65%. (B) Shows an illustration of the look-up tables (one per stimulus condition) which indicate the likelihood of the participant’s visual system being balanced by some interocular ratio parameter (from − 18 to + 18 dB) given the ranking given in response to that stimulus. Figure taken from Baldwin et al.10.
The software was written in the Unity Engine (Unity Technologies, Copenhagen, Denmark). Presentation of the luminance contrast was linearised through the use of a custom-written shader. Spectral measurements were made (using a VPixx-Edition X-Rite i1Pro; VPixx Technologies, Saint-Bruno, Canada) of the different colours (red, green, and blue) on the iPad display. These measurements showed that the red and green colour channels were not entirely independent. For our anaglyph presentation there was a cross-talk of 20% when viewing through the red filter. When viewing through the green filter the cross-talk was only 3%.
Procedure
While wearing red/green anaglyph glasses, participants were instructed to rate the contrast/relative visibility of the sprites by tapping on them on the iPad starting from those appearing to have the most to the least contrast. Instructions phrasing was: “Please tap fruits from most to least visible”. At each round, there was a presentation of 6 fruits from the same category (i.e., apple, cherry or grape) distributed on a grid of 2 lines of 3 fruits (3 in red and 3 in cyan). A reset button was presented in the top-left corner in case participants made a mistake and a skip button was presented in the top-right corner. A trial terminated after the participant either tapped the 6 fruits or tapped the skip button because they couldn’t see any more fruit. The algorithm led to a range of 10–20 trials; each trial lasted approximately 10 s. So a full measurement took 2–3 min. When the suppression task was completed, the red/green factor (i.e., interocular suppression threshold) in dB with a 95% confidence interval was obtained. Participants were given a few binocular practice trials before the experimental test to make sure they fully understood the task and procedure.
Methods for dichoptic letters test
Stimuli and apparatus
The Dichoptic Letters Test was adapted from Kwon et al.16,17. This method consists of reading dichoptically displayed band-pass filtered Sloan letters arranged in a layout similar to the ETDRS acuity chart on a gray background (60 cd/m2). Two different set-ups were used for adults and children. For adults, the stimuli were generated and controlled using MATLAB (version 9.7.0) with Psychophysics Toolbox18 extensions for Windows 10, running on a PC desktop computer. Stimuli were presented dichoptically on an active 3D display setup LCD monitor (model: Asus VS278H-E; refresh rate: 120 Hz; resolution: 1920 × 1080; maximum luminance 250 cd/m2). For children, stimuli were created and presented using MATLAB (version 9.2.0), on a Eurocom P370EM Scorpius laptop (Eurocom, Ottawa, Canada) with a 17.3-in. 120 Hz display; 1920 × 1080 pixels; mean luminance 197 cd/m2. In both cases, participants viewed the stimuli using the Nvidia 3D Vision2 shutter glasses (nVidia Corp., Santa Clara, CA) running at 60 Hz frame rate per eye. Participants seated 50 cm away from the screen in a dim-lit room.
Procedure
The balance point between the two eyes was determined by the interocular contrast-ratio required to report the letter in each eye with equal probability. This was found using an adaptive procedure described in detail by Kwon et al.16,17. In each trial, two different sets of 5 letters of different contrast were presented dichoptically overlapping to each eye. At each position, the identity and interocular contrast-ratio of the letter on each chart differed. Participants were instructed to read aloud the most visible letter at each of the 5 positions in the chart from left-to-right. The experimenter manually input the letters spoken by the participant. The relative contrast of overlapping letters in each eye was adjusted via a customised adaptive procedure adapted from the QUEST algorithm19 for a total of 60 data points (12 charts × 5 contrast ratios), each eye threshold was then determined by fitting a Weibull function20.
Statistical analysis
For each test, the interocular suppression ratio was computed in decibels:
 |
Accuracy of the methods were validated by assessing their test-retest reliability using (a) the “agreement” form of the Intraclass Correlation Coefficient (ICCagreement) and (b) Bland and Altman difference plot21 in which difference values between two measurements (e.g., 1st–2nd measurement) were presented as a function of mean value of the two measurements for each subject. Test-retest variability is indicated by 95% limits of agreement. Comparisons between the two tests made additional use of the Pearson correlation coefficient to calculate R2.
Results
Test–retest reliability
The DiCOT and DLT measure two complementary aspects of interocular suppression that are known to occur in amblyopia. These are surround suppression (measured by the DiCOT) and overlay suppression (measured by the DLT)11. They both use a contrast metric to provide quantitative measures with an associated measurement error. Figure 2 shows the test–retest reliability of the two tests based on comparison of the first and second measurements we made. Comparisons of the second and third measurements are given in Supplementary Fig. S1. Scatter plots of the test and retest measurements are shown in the left column with Panel A showing the DiCOT and Panel C the DLT. The right column shows a Bland Altman plot of the difference between the two measurements against the mean of the two measurements. Statistical measures of the test-retest performance are provided in Table 2. All individual data are presented in Supplementary Data Table 1.
Fig. 2.
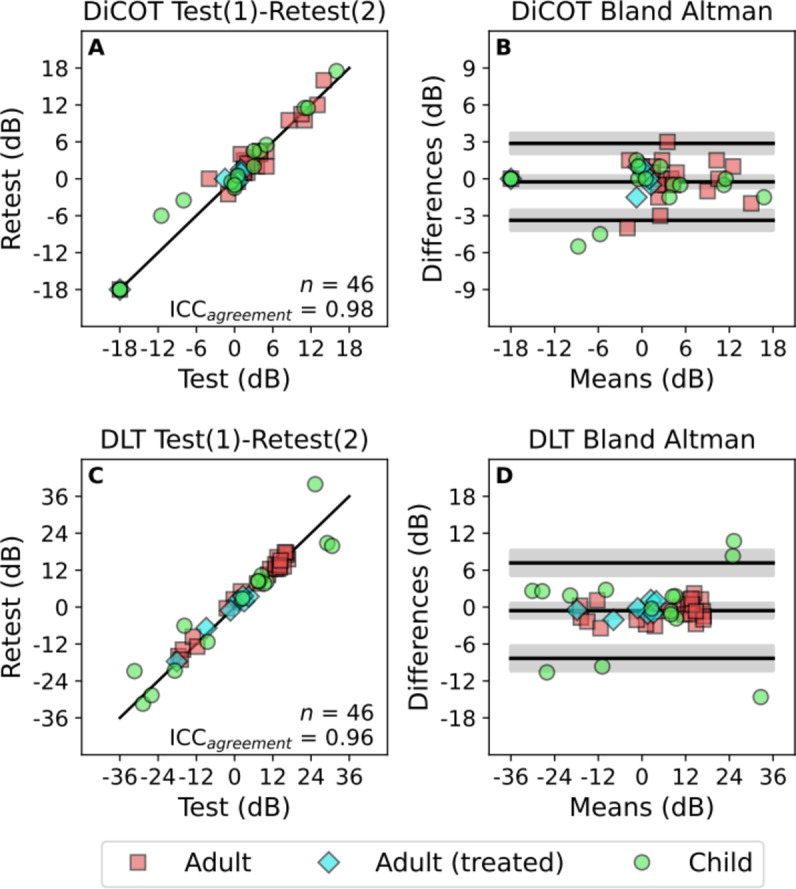
Test–retest reliability comparison of first and second measurements made with the DiCOT (top row) and DLT (bottom row). The panels on the left show scatter plots of retest vs. test measurement. The solid diagonal line is the line of equality (y = x). The panels on the right show Bland Altman plots of the difference against the mean. The three solid lines show the bias, and the limits of agreement. Shaded regions around those lines give the 95% confidence intervals. Positive and negative values refer to suppression on right and left eyes respectively.
Table 2.
Test–retest statistics for the dichoptic contrast ordering test (DiCOT) and dichoptic letters test (DLT).
| Comparison | n | ICCagreement | Limits of agreement |
|---|---|---|---|
| DiCOT 1 vs. 2 | 46 | 0.98 | − 3 dB to + 3 dB |
| DiCOT 2 vs. 3 | 45 | 0.98 | − 3 dB to + 3 dB |
| DLT 1 vs. 2 | 46 | 0.96 | − 8 dB to + 7 dB |
| DLT 2 vs. 3 | 46 | 0.98 | − 6 dB to + 5 dB |
Comparisons are shown for the first vs. second (1 vs. 2) and second vs. third (2 vs. 3) measurements. The number of valid pairs of measurements included in each comparison is given (n) along with the agreement Intraclass Correlation Coefficient and the Bland Altman limits of agreement.
The scatter plots in the left column of Fig. 2 and the ICCagreement scores demonstrate excellent22 test-retest reliability for both tests (0.98 for the DiCOT, 0.96 for the DLT). The range of results found with the DLT (between − 36 dB and + 36 dB) was approximately twice that found with the DiCOT (which can only give results ranging ± 18 dB). At the same time however, the Bland Altman limits of agreement with the DiCOT were around half of that found with the DLT (around ± 6 dB vs. ± 3 dB). The middle “bias” lines in the Bland Altman plots (with shaded 95% confidence interval) indicate no significant bias between the repeated measurements.
Comparison between DLT and DiCOT
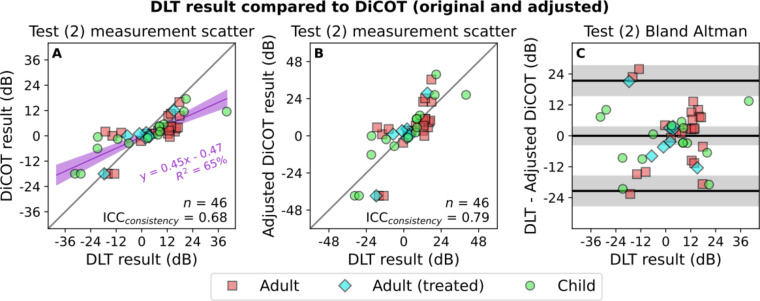
The comparison between the second measurements made using the DLT and DiCOT methods is shown in Fig. 3. A more comprehensive figure also showing the results from the first and third measurements is provided as Supplementary Fig. S2. These results were similar to those shown in Fig. 3. The statistical measures of these comparisons are provided in Table 3.
Fig. 3.
Comparisons between DLT and DiCOT measurement results. Presentation is similar to that used in Fig. 2. (A) Shows a scatter plot with the ICCconsistency calculated as well as the linear regression between the two measures. Shaded purple area indicates 95% confidence interval. This regression is used to transform the DiCOT results to give the adjusted DiCOT in (B) that is put into better agreement with the DLT following the equation: Adjusted DiCOT = (DiCOT + 0.47)/0.45. (C) Shows the Bland Altman plot of the difference between the two measures plotted against the DLT result.
Table 3.
Comparisons between the dichoptic contrast ordering test (DiCOT) and dichoptic letters test (DLT) for the first, second, and third measurements.
| # | n | Linear fit | R 2 | ICCconsistency | Limits of agreement |
|---|---|---|---|---|---|
| 1 | 46 | y = 0.45x − 0.46 | 66%, p < 0.001 | 0.80 | − 21 dB to 21 dB |
| 2 | 46 | y = 0.45x − 0.47 | 65%, p < 0.001 | 0.79 | − 21 dB to 21 dB |
| 3 | 45 | y = 0.39x − 0.11 | 61%, p < 0.001 | 0.76 | − 24 dB to 24 dB |
The number of valid pairs of measurements included in each comparison is given (n) along with the linear relationship between them, the consistency ICC (with the DiCOT transformed based on the regression result) and the Bland–Altman limits of agreement.
The comparisons between the DLT and DiCOT in Fig. 3A reflect the difference in the range of the measurements obtained with the two tests. For all three comparisons there was a highly significant relationship between the results obtained with the two tests (Table 3). The slope was around 0.45, reflecting that the range of the DLT was around twice that of the DiCOT. We used the linear relationship we observed to calculate transformed results from the DiCOT that would put them in best possible agreement with the DLT. These results are shown in Fig. 3B,C.
There are a number of points in Fig. 3C where there was a large difference between the results obtained with the two measures (Bland Altman LoA around ± 24 dB). This indicates that the two methods measure (at least in-part) different aspects of interocular suppression. Although Fig. 3 shows the results from only the second set of measurements, the results from the other two repetitions given in Supplementary Fig. S2 are similar.
Relationship with visual acuity and stereoacuity
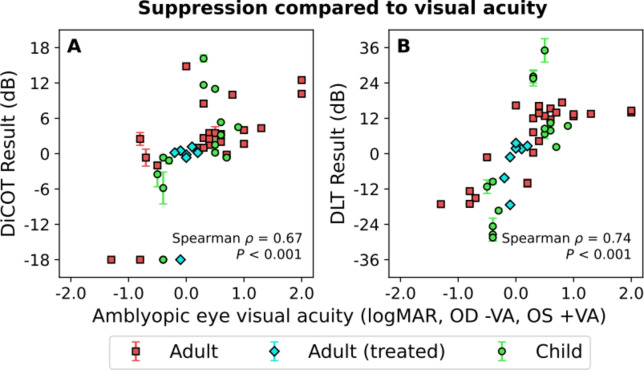
The relationship between the measured suppression and the visual acuity of the amblyopic eye with these two tests (DiCOT and DLT), each reflecting suppression of different origin (i.e. surround vs. overlay suppression) is displayed in Fig. 4. In each case we plot the visual acuity in logMAR units against suppression measured in decibels, the positive and negative value refer to whether the left or right eye is amblyopic. For each suppression measure there is a clear positive relationship with the acuity of the amblyopic eye (P < 0.001); the greater the suppression, the greater the acuity deficit. This relationship is similar for surround suppression (DiCOT, Spearman ρ = 0.67) and overlay suppression (Spearman ρ = 0.74).
Fig. 4.
Relationship between amblyopic eye acuity and the two suppression measures. The two scatterplots show the average measurement from the DiCOT (A) and DLT (B) plotted against the logMAR acuity in the amblyopic eye. The sign of the acuity is flipped based on which eye is amblyopic. This makes values from the right eye negative (−VA) and from the left eye positive (+ VA). Different groups are plotted separately, however the Spearman rank correlation was calculated for the combined data.
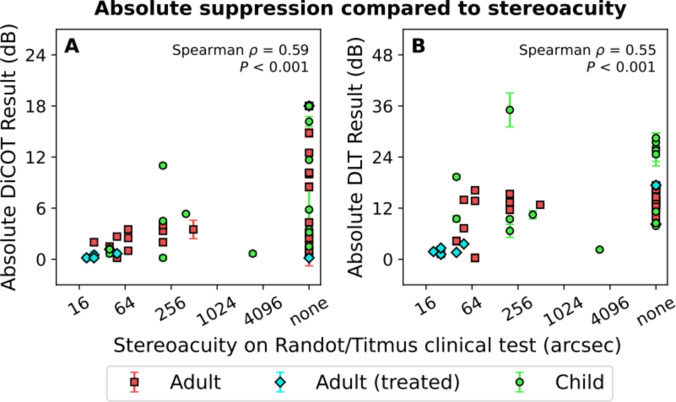
The correlations between the suppression measurement results and standard clinical measures of stereoacuity are shown in Fig. 5. Half of our participants were unable to achieve a score on the clinical stereo test, and so are indicated as having a stereoacuity of “none”. In our Spearman rank correlation they are given a value larger than that of the participants able to perform the test. We find strong correlations between stereoacuity and suppression measured with either method. This relationship was again similar for surround suppression (DiCOT, Spearman ρ = 0.59) and overlay suppression (Spearman ρ = 0.55). Participants with small stereo thresholds (good stereoacuity), in particular treated amblyopes (blue diamonds) presented small absolute suppression ratios. While people with poor (high stereo thresholds), or none stereoacuity were associated with greater interocular suppression. Finally, we also found a significant relationship between amblyopic eye visual acuity and clinical stereoacuity (Spearman ρ = 0.33, P = 0.027, Fig. 6).
Fig. 5.
Relationship between stereoacuity measured in a standard clinical test and the two suppression measures. The two scatterplots show the average absolute measurement from the DiCOT (A) and DLT (B) plotted against the stereoacuity. Different groups of amblyopic participants are plotted separately, however the Spearman rank correlation was calculated for the combined data. The 23/46 participants who were unable to perform the clinical stereo tests are indicated as having a value of “none”.
Fig. 6.
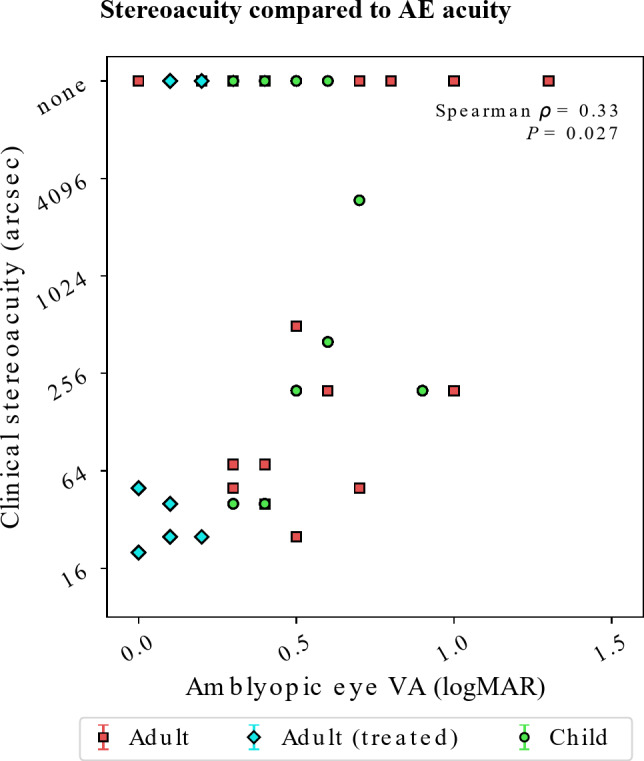
Relationship between stereoacuity measured in a standard clinical test and the visual acuity of the amblyopic eye.
Discussion
The test–retest reliability of both measures of interocular suppression examined in this study (DiCOT and DLT) was excellent. We found very high (> 0.96) agreement Intraclass Correlation Coefficients from pairs of single measurements made with either test. In the Bland–Altman test, there is no significant bias between successive measurements and the 95% confidence limits are relatively narrow (scaling with the larger range of the DLT). These test–retest results in amblyopic participants are comparable to what we have observed in a previous study of individuals with normal vision where suppression was manipulated artificially10.
In the DiCOT, anaglyph colored sprites are displayed on a white background. So luminance and contrast are interdependent. High contrast stimuli appear dark on the white background and low contrast stimuli appear light on the white background. This definition of contrast is the same as applied in the Pelli-Robson chart23. At suprathreshold, previous studies12,26,27 reported minimal perceived contrast imbalance in amblyopia, whether stimuli were presented simultaneously to the two eyes or not26. But they reported more imbalance at low contrast or close to threshold12,26. The DiCOT algorithm adjusts to test contrasts above the threshold for both eyes, therefore the tested range is optimal for measuring the interocular suppression ratio.
The DiCOT and DLT provide complementary measures of suppression. The former reflects surround suppression while the latter reflects overlay suppression24. Our results suggest that both types of suppression are present in amblyopia, in agreement with previous studies11. The DLT measurements of overlay suppression are about a factor of two greater than the DiCOT surround suppression measurements in our group of amblyopic participants. Actually, the range of suppression ratios measured with the DiCOT was smaller than with the DLT and smaller than most other reported measures4,25. We believe the three main reasons for this smaller range are that (i) the presented stimuli were non-overlapping; as it has been shown that overlapping, and particularly rivalrous stimuli produce more suppression24, (ii) the stimuli were above threshold, where suppression is minimal12,26,27, and (iii) the stimuli were spatially broadband, so it is likely that participants would mostly match the more similarly perceived frequencies (i.e. the low ones26).
Those results highlight that there is not one absolute measure of interocular suppression in amblyopia. And so far, not a unique test to measure it. Assessing interocular suppression in amblyopia would require a comprehensive set of tests to measure suppression with both overlapping28 and non-overlapping stimuli24, in rivalrous16,20 or fusion conditions29, at threshold or suprathreshold26.
Looking at our other clinical measurements, we find that both the amblyopic eye visual acuity and the clinical stereoacuity (including no ability on the clinical tests) are related to suppression measured with either test. And that they correlate each other. This is different from another recent study30. This is maybe because, in that study, the stereoacuity measurement was made using a recently-developed test of stereo vision that attempts to reduce influences of visual acuity on the stereoacuity result31.
The fact that each measure of suppression exhibits a similar, positive relationship with the degree of amblyopia is compatible with this suppression playing a causative role in the aetiology of amblyopia1. The measurements made by each method are however distinct from each other, which is not surprising since there is evidence that these two forms of suppression are subserved by a different neural substrate32. A comprehensive assessment of suppression in amblyopia and how it might be impacted by different treatment regimes would therefore benefit from the use of both tests (DiCOT and DLT).
Electronic Supplementary Material
Below is the link to the electronic supplementary material.
Acknowledgements
The authors thank Dr MiYoung Kwon and Prof Peter Bex for sharing the code of the Dichoptic Letters test.
Author contributions
AR, MCL, ASB and RFH designed the study. AR and MCL performed the experiments. ASB analyzed the data. AR, ASB and RFH wrote the manuscript. All authors reviewed the manuscript.
Data availability
The datasets used and/or analysed during the current study are available from the corresponding author on reasonable request.
Declarations
Competing interests
Authors ASB and RFH are inventors on a provisional patent application (U.S. Provisional Patent Application 63/511.359) that describes the inventive aspects of the DiCOT measurement tool. The study protocol was designed by the authors AR, ASB and RFH, and conducted by all authors at RI-MUHC; McGill University. Novartis Pharma AG (Basel) supported the study with funds under a research agreement entered into on March 31st, 2020, and terminated on March 31st, 2023.
Footnotes
Publisher’s note
Springer Nature remains neutral with regard to jurisdictional claims in published maps and institutional affiliations.
References
- 1.Li, J. et al. The role of suppression in amblyopia. Investig. Ophthal. Vis. Sci.52(7), 4167–4176 (2011). [DOI] [PubMed] [Google Scholar]
- 2.McKee, S. P., Levi, D. M. & Movshon, J. A. The pattern of visual deficits in amblyopia. J. Vis.3(5), 380–405 (2003). [DOI] [PubMed] [Google Scholar]
- 3.Hess, R. F. & Thompson, B. Amblyopia and the binocular approach to its therapy. Vis. Res.114, 4–16 (2015). [DOI] [PubMed] [Google Scholar]
- 4.Mansouri, B., Thompson, B. & Hess, R. F. Measurement of suprathreshold binocular interactions in amblyopia. Vis. Res.48(28), 2775–2784 (2008). [DOI] [PubMed] [Google Scholar]
- 5.Worth, C. A. Squint, Its Causes, Pathology and Treatment 6th edn (John Bale Sons and Danielsson, 1929).
- 6.Kelly, K. R. et al. Binocular iPad game vs patching for treatment of amblyopia in children: A randomized clinical trial. JAMA Ophthalmol.134(12), 1402–1408 (2016). [DOI] [PMC free article] [PubMed] [Google Scholar]
- 7.Kelly, K. R. et al. Improved binocular outcomes following binocular treatment for childhood amblyopia. Investig. Ophthalmol. Vis. Sci.59(3), 1221–1228 (2018). [DOI] [PMC free article] [PubMed] [Google Scholar]
- 8.Webber, A. L., Wood, J. M. & Thompson, B. Fine motor skills of children with amblyopia improve following binocular treatment. Investig. Ophthalmol. Vis. Sci.57(11), 4713–4720 (2016). [DOI] [PubMed] [Google Scholar]
- 9.Thompson, B. et al. Long-range interocular suppression in adults with strabismic amblyopia: A pilot fMRI study. Vision (Basel)3, 1 (2019). [DOI] [PMC free article] [PubMed] [Google Scholar]
- 10.Baldwin, A. S. et al. The dichoptic contrast ordering test: A method for measuring the depth of binocular imbalance. J. Vis.24(11), 2 (2024). [DOI] [PMC free article] [PubMed] [Google Scholar]
- 11.Huang, P. C., Baker, D. H. & Hess, R. F. Interocular suppression in normal and amblyopic vision: spatio-temporal properties. J. Vis.12, 11 (2012). [DOI] [PubMed] [Google Scholar]
- 12.Maehara, G. et al. The perceptual consequences of interocular suppression in amblyopia. Investig. Ophthalmol. Vis. Sci.52(12), 9011–9017 (2011). [DOI] [PubMed] [Google Scholar]
- 13.Sengpiel, F. & Blakemore, C. The neural basis of suppression and amblyopia in strabismus. Eye10, 250–258 (1996). [DOI] [PubMed] [Google Scholar]
- 14.Sengpiel, F., Blakemore, C. & Harrad, R. Interocular suppression in the primary visual cortex: a possible neural basis of binocular rivalry. Vis. Res.35(2), 179–195 (1995). [DOI] [PubMed] [Google Scholar]
- 15.Sengpiel, F. et al. Strabismic suppression is mediated by interactions in the primary visual cortex. Cereb. Cortex16, 1750–1758 (2006). [DOI] [PubMed] [Google Scholar]
- 16.Kwon, M. et al. Assessing binocular interaction in amblyopia and its clinical feasibility. PLoS ONE9(6), e100156 (2014). [DOI] [PMC free article] [PubMed] [Google Scholar]
- 17.Birch, E. E. et al. Assessing suppression in amblyopic children with a dichoptic eye chart. Investig. Ophthalmol. Vis. Sci.57(13), 5649–5654 (2016). [DOI] [PMC free article] [PubMed] [Google Scholar]
- 18.Kleiner, M., Brainard, D. & Pelli, D. What’s New in Psychtoolbox-3? Perception. 36 ECVP Abstract Supplement (2007).
- 19.Watson, A. B. & Pelli, D. G. QUEST: A Bayesian adaptive psychometric method. Percept. Psychophys.33, 113–120 (1983). [DOI] [PubMed] [Google Scholar]
- 20.Kwon, M. et al. Spatial-frequency dependent binocular imbalance in amblyopia. Sci. Rep.5, 17181 (2015). [DOI] [PMC free article] [PubMed] [Google Scholar]
- 21.Bland, J. M. & Altman, D. G. Statistical methods for assessing agreement between two methods of clinical measurement. Lancet1(8476), 307–310 (1986). [PubMed] [Google Scholar]
- 22.Cicchetti, D. V. Guidelines, criteria, and rules of thumb for evaluating normed and standardized assessment instruments in psychology. Psychol. Assess.4(4), 284–290 (1994). [Google Scholar]
- 23.Pelli, D. G., Robson, J. G. & Wilkins, A. J. The design of a new letter chart for measuring contrast sensitivity. Clinic. Vis. Sci.2(3), 187–199 (1988). [Google Scholar]
- 24.Bossi, M. et al. A comparison of tests for quantifying sensory eye dominance. Vis. Res.153, 60–69 (2018). [DOI] [PubMed] [Google Scholar]
- 25.Zhou, J., Huang, P. C. & Hess, R. F. Interocular suppression in amblyopia for global orientation processing. J. Vis.13(5), 19 (2013). [DOI] [PubMed] [Google Scholar]
- 26.Reynaud, A. & Hess, R. F. Is suppression just normal dichoptic masking? Suprathreshold considerations. Investig. Ophthalmol. Vis. Sci.57(13), 5107–5115 (2016). [DOI] [PubMed] [Google Scholar]
- 27.Hess, R. F. & Bradley, A. Contrast perception above threshold is only minimally impaired in human amblyopia. Nature287(5781), 463–464 (1980). [DOI] [PubMed] [Google Scholar]
- 28.Meier, K. et al. Characterizing amblyopic perception under non-rivalrous viewing conditions. Sci. Rep.13(1), 7993 (2023). [DOI] [PMC free article] [PubMed] [Google Scholar]
- 29.Ding, J., Klein, S. A. & Levi, D. M. Binocular combination in abnormal binocular vision. J. Vis.13(2), 14 (2013). [DOI] [PMC free article] [PubMed] [Google Scholar]
- 30.Webber, A. L. et al. Suppression rather than visual acuity loss limits stereoacuity in amblyopia. Investig. Ophthalmol. Vis. Sci.61, 50–60 (2020). [DOI] [PMC free article] [PubMed] [Google Scholar]
- 31.Tittes, J. et al. Assessment of stereovision with digital testing in adults and children with normal and impaired binocularity. Vis. Res.164, 69–82 (2019). [DOI] [PubMed] [Google Scholar]
- 32.Angelucci, A. et al. Circuits and mechanisms for surround modulation in visual cortex. Annu. Rev. Neurosci.40, 425–451 (2017). [DOI] [PMC free article] [PubMed] [Google Scholar]
Associated Data
This section collects any data citations, data availability statements, or supplementary materials included in this article.
Supplementary Materials
Data Availability Statement
The datasets used and/or analysed during the current study are available from the corresponding author on reasonable request.


