Abstract
Osteoporosis and sarcopenia are common diseases in the older. This study aims to use transcriptomics and explore common diagnostic genes of osteoporosis and sarcopenia and predict potentially effective treatment drugs. Three datasets for osteoporosis and sarcopenia were downloaded from the GEO database, and transcriptome sequencing was performed on clinical samples. A total of 23 differentially expressed genes (DEGs) were selected using the LIMMA, WGCNA, and the DEseq2 package. Three machine learning methods were employed to determine the final common diagnostic genes for the diseases. Receiver operating characteristic (ROC) curves were used to evaluate the predictive performance of genes. Single-gene enrichment analysis (GSEA), immune infiltration abundance calculation, and related metabolic analysis were used to study the pathogenesis of the two diseases. Finally, the CMap database was used to predict potential therapeutic drugs for the diseases, and further validation was conducted through RT-PCR and WB. Three genes for the diseases CHST3, PGBD5, and SLIT2 were identified, showing good predictive performance in both internal and external validations. GSEA analysis revealed that genes were enriched primarily in pathways related to cell cycle regulation, fatty acid metabolism, DNA replication, and carbohydrate synthesis. CHST3 and SLIT2 were involved in the immune response, but PGBD5 seemed unrelated to the immune response. Potential therapeutic drugs were predicted, and the RT-PCR, WB results further validated our hypotheses. CHST3, PGBD5, and SLIT2 can serve as potential genes for the diagnosis and treatment of osteoporosis and sarcopenia; furthermore, these results provide new clues for further experimental research and treatment.
Keywords: Osteoporosis, Sarcopenia, Transcriptomics, Diagnostic genes, Pathogenesis
Subject terms: Biochemistry, Computational biology and bioinformatics, Immunology, Medical research
Introduction
Muscles and bones are two interdependent components of the body that form the musculoskeletal system. Currently, diseases of the musculoskeletal system have become a hot topic in geriatric research. Osteoporosis has emerged as a significant concern affecting the health of individuals aged 50 or above. Its main characteristics include reduced cortical and trabecular bone quantity, leading to an increased risk of fractures1. Menopause results in oestrogen deficiency, particularly in elderly women, disrupting the balance between osteoblasts and osteoclasts, causing increased absorption of trabeculae, and accelerating the progression of osteoporosis. Concurrently, research by LU et al. suggests a significant connection between muscle loss and oestrogen in elderly individuals2,3. In 2018, the European Working Group on Sarcopenia in Older People (EWGSOP) reached a consensus on sarcopenia, defining it as a degenerative disease characterised by a core reduction in muscle strength accompanied by low muscle mass, poor muscle quality, and impaired physical function4. Hormonal changes, aging, lack of exercise, malnutrition, neurodegenerative diseases, and other factors mediate the occurrence of sarcopenia5. Current research indicates a clear causal relationship between sarcopenia and osteoporosis6. Osteoporosis is identified as a risk factor for features associated with sarcopenia, and the location-specific occurrence of osteoporosis may vary depending on the site of muscle loss7.
The mutual intervention of two chronic diseases increases the incidence of osteoporotic vertebral compression fractures (OVCF). Patients with OVCF exhibit local pain and activity impairment, and a significant portion of them remain bedridden for extended periods, resulting in severe complications8–10. However, due to the relatively late establishment of standardised diagnostic procedures and criteria for sarcopenia and variations in its recognition across regions, prospective studies with strong evidence grades are scarce. Most current research focuses on elderly individuals with OVCF or nonfracture-related sarcopenia patients. In this study, under the conditions of collecting clinical case specimens, we gathered data from the GEO database and employed bioinformatics methods to explore common diagnostic genes and pathogenesis and predict potential therapeutic drugs for osteoporosis and sarcopenia. This research aims to provide a foundation for future studies on comorbid patients with these conditions.
Methods
Data download
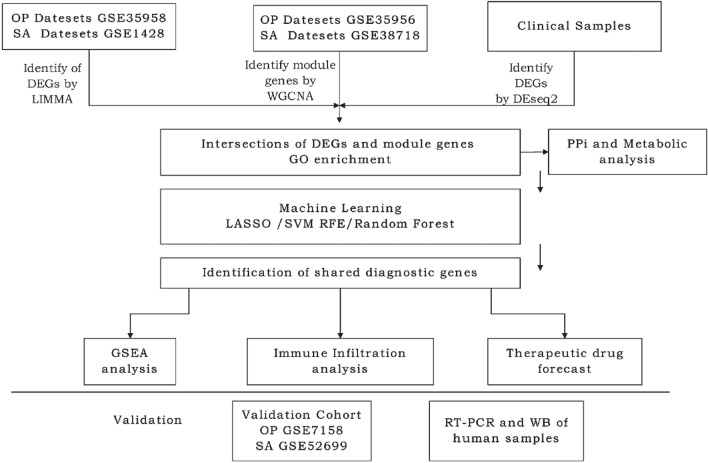
Microarray datasets related to the respective diseases were downloaded from the Gene Expression Omnibus (GEO) database (http://www.ncbi.nlm.nih.gov/geo/). By using the keywords ‘osteoporosis’ and ‘sarcopenia’ on the official website, we obtained three human specimen datasets for osteoporosis and three for sarcopenia. Detailed information about the datasets is presented in Table 1. The entire experimental analysis workflow is illustrated in Fig. 1.
Table 1.
Information on GEO datasets for related diseases.
| Diseases | GEO series | GPL platform | Control case | Sample case | Routes of application |
|---|---|---|---|---|---|
| OP | GSE35958 | GPL570 | 4 | 5 | LIMMA |
| GSE35956 | GPL570 | 5 | 5 | WGCNA | |
| GSE7158 | GPL570 | 14 | 12 | Validation cohort | |
| SA | GSE1428 | GPL96 | 10 | 12 | LIMMA |
| GSE38718 | GPL570 | 14 | 8 | WGCNA | |
| GSE52699 | GPL10558 | 10 | 10 | Validation cohort |
OP osteoporosis, SA sarcopenia.
Fig. 1.
Flowchart of the experiment. OP osteoporosis, SA sarcopenia, GSE gene expression composite series, LIMMA linear modelling of microarray data, WGCNA weighted gene co-expression network analysis, DEGs differentially expressed genes, LASSO least absolute shrinkage and selection operator, SVM-RFE support vector machine-recursive feature elimination, GSEA gene set enrichment analysis, RT-PCR real-time polymerase chain reaction.
Filtering disease-related differentially expressed genes and constructing a Venn diagram
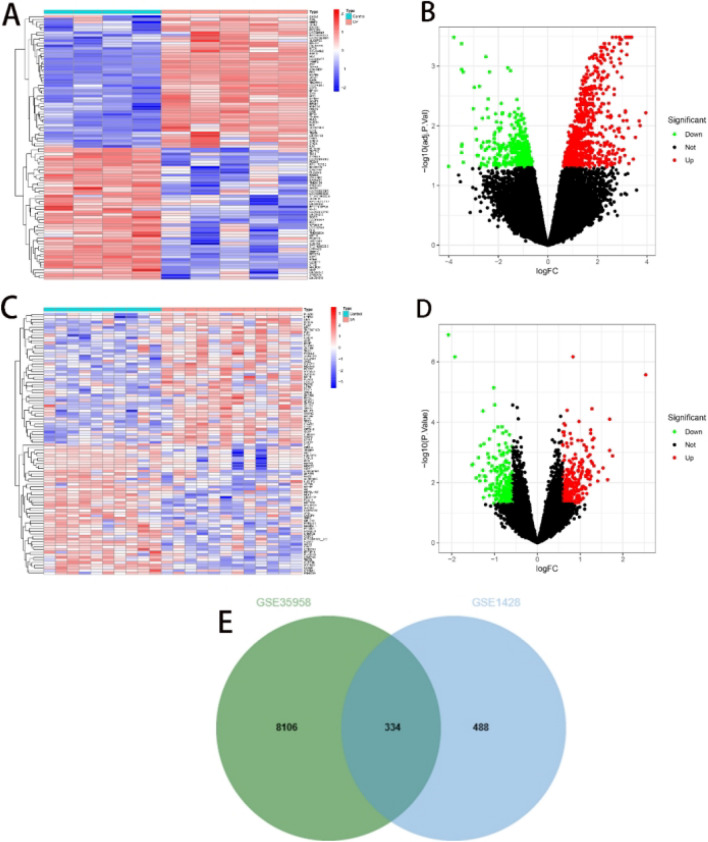
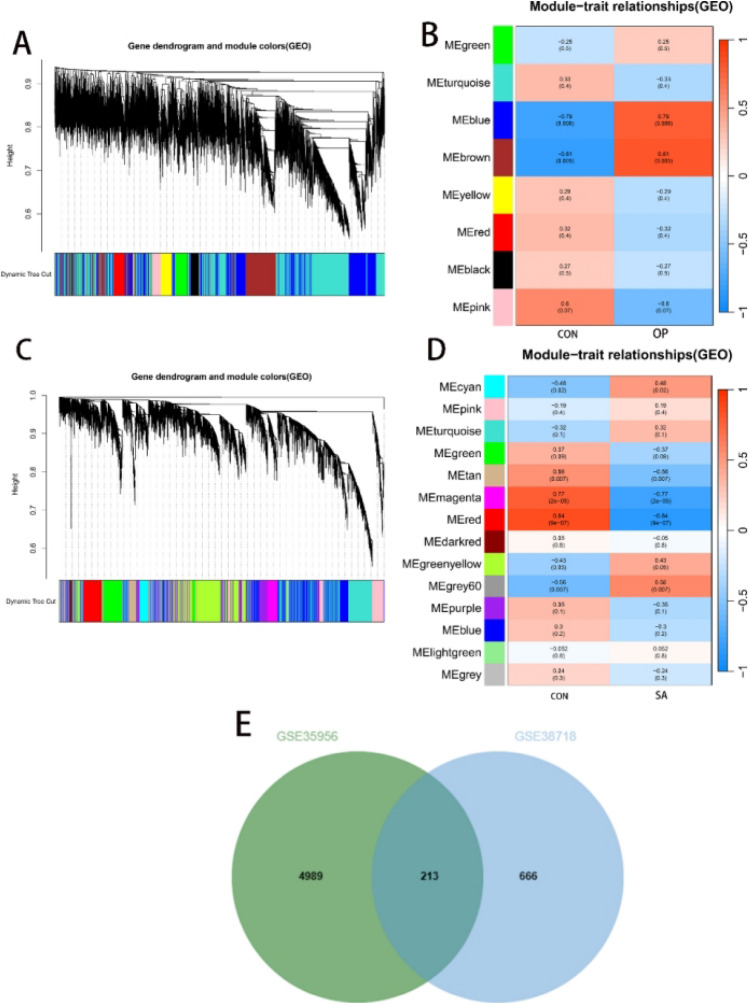
First, using the prepared datasets GSE35958 and GSE1428, the Linear Models for Microarray (LIMMA) package in R (version 4.2.2) was employed to filter for DEGs. For both datasets, a statistical significance threshold level for the DEG samples was set at |log2FC (fold change)|> 0.585 and P < 0.0511. The analysis of the datasets is visually presented using heatmaps and volcano plots. Furthermore, a Venn diagram was constructed by identifying the intersections of the DEGs. WGCNA as conducted on GSE35956 and GSE38718 to identify key gene modules12. Finally, again, the genes in the gene module intersected, and the results are presented using a venn diagram.
Collection of human samples and parallel transcriptome sequencing
After obtaining written informed consent from patients or their legal representatives, we utilised biological samples donated by patients from the biobank of Chengdu Fifth People’s Hospital. Three muscle samples were obtained from patients diagnosed with both osteoporosis and sarcopenia (admitted due to OVCF and diagnosed with sarcopenia after admission; muscle fibres were collected during surgery). Additionally, three muscle samples were collected from patients with vertebral fractures due to trauma (without osteoporosis or sarcopenia). All patients had no other underlying diseases. The diagnostic criteria for osteoporosis are a DXA (Dualenergy X-ray absorptiometry) measurement of bone density T-score ≤ − 2.5 or a recent occurrence of fragility fractures in the spine or hip. The diagnostic criteria for sarcopenia involve testing the patient’s grip strength using the SARC-F scoring scale (men < 28 kg, women < 18 kg)13. This experiment was approved by the Ethics Committee of Chengdu Fifth People’s Hospital (Approval Number: Ethical Review 2023-013-Sci01).All research is conducted in accordance with the relevant regulations and in strict compliance with the Declaration of Helsinki.
Transcriptomic sequencing was conducted by the HaploX Genomics centre, Ltd. After successful sample extraction and library construction, the library was subjected to quality control. Library sequencing was performed using the NovaSeq 6000 instrument and the corresponding NovaSeq S4 reagent kit. Subsequently, a comparison was made with the control group. Gene expression and differential gene analysis were conducted using the R language package DESeq2 (version 0.10.0). A volcano plot was constructed to illustrate the DEGs.
The DEGs obtained separately through the LIMMA package, WGCNA, and DESeq2 were intersected. Subsequently, gene function analysis using Gene Ontology (GO) was performed using the Metascape database (https://metascape.org/gp/index.html#). This analysis aims to elucidate the functional information of these genes.
Using three machine learning algorithms to identify shared genes in diseases
Subsequently, three machine learning algorithms—Least Absolute Shrinkage and Selection Operator (LASSO), Support Vector Machine-Recursive Feature Elimination (SVM-RFE), and RandomForest (RF)—were employed to determine disease-sharing genes conclusively12. Initially, the LASSO regression algorithm was utilised to construct a regression model using the R language package glmnet, selecting the optimal hub genes through repeated cross-computation. The SVM-RFE algorithm was then employed, starting with all the features of the data and recursively eliminating the least important features based on the model’s performance, ultimately filtering out the best hub genes. Following this, the R language package randomForest was used to analyse the most important variables and rank all the genes. Genes with a score greater than 2 were considered the best hub genes. Finally, the intersection of hub genes derived from these three algorithms was taken to specify the final set of disease codiagnostic genes. Due to the presence of duplicate samples of osteoporotic patients in the GSE35958 and GSE35956 datasets, five duplicate samples were screened out of the subsequent study of the combined dataset.
Validating the diagnostic predictive ability of disease codiagnostic genes
The sequencing results of GSE35958, GSE1428, GSE35956, GSE38718, and clinical samples were integrated using the language package SVA and used as a training cohort. Datasets GSE7158 and GSE52699 were used as validation cohort. The diagnostic predictive ability of the co-diagnostic genes was demonstrated by calculating the AUC.
Construction of the single diagnostic gene GSEA
The R package clusterProfiler was used to perform GSEA on the identified disease codiagnostic genes. This analysis showcased the biological signalling pathways in the control and diseased groups. The enrichment plot displays the top three activated and inhibited pathways for each gene in both disease groups.
Analysing the abundance of immune cell infiltration
CIBERSORT, based on the principles of linear support vector regression, was employed for deconvolution analysis. It provides a comprehensive set of immune cell categories, encompassing nearly 22 different types of immune cells14. We performed CIBERSORT calculations on samples from two osteoporosis datasets (GSE35958 and GSE35956) and two sarcopenia datasets (GSE1428 and GSE38718) to determine the relative levels of immune cells. Samples with CIBERSORT P < 0.05 were selected for analysis. For each sample, the output estimates from CIBERSORT were normalised to one, facilitating comparisons between immune cell types and datasets. R language packages such as corrplot, vioplot, and ggplot2 were utilised to visualise the results.
Predicting potential drugs associated with treatment
We utilised the Connectivity Map (CMap) database to predict potentially effective therapeutic drugs. The 23 genes that were filtered were grouped based on their upregulation or downregulation, and each group was input into the CMap database. If genes not present in the database were encountered, they were ranked based on the differential expression in clinical samples, and at least ten upregulated or downregulated genes were included in the database. The results were selected for visualisation based on the median tau score. Finally, the PubChem database was used to visualise the chemical structures of the candidate drugs.
Real-time fluorescence quantitative detection and western blotting
The collected clinical samples underwent real-time fluorescent quantitative detection. RNA extraction was performed using the TRIZOL reagent kit (Invitrogen™, Japan), and cDNA synthesis was carried out using the PrimescriptTM RT reagent kit (including gDNA) (TaKaRa, RR047A). RT-PCR was employed to measure the expression levels of disease-sharing genes. The primer sequences for the two genes are detailed in Table 2. Statistical analysis, using the Student t-test, was conducted to compare the different groups, and P < 0.05 was considered statistically significant.
Table 2.
Primer sequences for the tested genes.
| Gene | Forward primer | Reverse primer |
|---|---|---|
| CHST3 | CCGCGAGATGTACCGCTTC | GCCTGCGTGTTCTTTTGGA |
| PGBD5 | GTGGAGGTGACGTTGGCAG | TAGAGCCCATGCGTGGTCT |
| SLIT2 | CCATGTAAAAATGATGGCACCTG | ATCACAGTCCTGACCCTTGAA |
Western blot analysis of CHST3, PGBD5 and SLIT2 levels of muscle from NC and SP group people (n = 3). The pre-prepared samples were separated on sodium dodecyl sulfate–polyacrylamide gels (SDS-PAGE) and transferred to a PVDF membrane (Civita). After blocking in 5% skim milk for 1 h at room temperature, the membrane were cultured with following antibody: anti-CHST3 (Afininty, DF9329, 1:1000), anti-SLIT2 (Affinity, DF7991, 1:1000), anti-PGBD5 (HUABIO, M1012-1, 1; 1000), anti-GAPDH (Affinity, AF7021, 1:1000), at 4 ℃ overnight. The membranes were washed with TBST then incubated with HRP-conjugated secondary antibody (Abclonal) at room temperature for 1 h. The membrane then got washed 3 times by TBST, then exposed ECL solutions (Applygen) for 5–10 min and developed by Hyper film ECL.
Construction of the protein–protein interaction (PPI) networks and relevant metabolic analysis
The 23 hub genes were input into geneMANIA (https://genemania.org) to construct the relevant PPI network and explore the interactions between hub genes. To further investigate disease-related metabolites and enhance our understanding of the molecular mechanisms driving these diseases, we used the DsigDB database (https://dsigdb.tanlab.org/DSigDBv1.0/).
We first conducted small molecule prediction for the 23 hub genes using the DsigDB database. In DsigDB, each gene was input for querying, and the database predicted drugs or small molecules associated with these genes based on changes in gene expression. During the screening process, we applied a threshold of p < 0.05 to ensure statistical significance in the selected compounds. Through this step, we identified small molecules that were closely associated with the expression of these genes.
Subsequently, we performed pathway enrichment analysis on the predicted small molecules. We utilized the “Pathway Analysis” module in MetaboAnalyst (https://www.metaboanalyst.ca/) and selected the KEGG database as the reference to evaluate the metabolic pathways involved with these small molecules. The analysis was conducted using the “Hypergeometric Test” for significance testing, and "Relative-Betweenness Centrality" was used to assess the impact of each pathway. Additionally, adjusted p-values were calculated using False Discovery Rate (FDR) correction to reduce false positives arising from multiple hypothesis testing. Finally, we identified potential metabolic pathways related to OP or SA, with particular focus on pathways showing p-values < 0.05 and higher pathway impact scores.
Results
Screening of DEGs in patients with osteoporosis and sarcopenia
Analysis of dataset GSE35958 using the Limma package resulted in 8440 DEGs (Fig. 2A,B); 822 differential genes were obtained from GSE1428(Fig. 2C,D). The intersection of both sets yielded 334 DEGs (Fig. 2E). In GSE35956, we identified eight gene modules closely associated with OP compared to normal bone mass samples. Each module is labelled with a different colour. We observed a positive correlation between the ‘blue’ module (r = 0.79, P = 0.006) and the ‘brown’ module (r = 0.81, P = 0.005) with OP. The ‘blue’ module comprised 3332 genes, and the ‘brown’ module contained 1870 genes (Fig. 3A,B). In the GSE38718 dataset, we obtained 12 gene modules. Notably, the ‘magenta’ module (r = − 0.77, P = 2e–05) and the ‘red’ module (r = − 0.84, P = 9e–07) exhibited a negative correlation with SA. The ‘magenta’ module contained 352 genes, and the ‘red’ module contained 527 genes (see Fig. 3C,D). The intersection of both sets resulted in the selection of 213 genes (Fig. 3E).
Fig. 2.
Employed ‘Limma’ for screening DEGs. (A,B) Heatmap and volcano plot of GSE35958. (C,D) Heatmap and volcano plot of GSE1428. (E) Intersection of DEGs in GSE35958 and GSE1428.
Fig. 3.
Utilised ‘WGCNA’ to identify module genes. (A) Cluster analysis of highly connected genes in key modules of GSE35956. (B) Correlation and P-values of modules with features in GSE35956. (C) Cluster analysis of highly connected genes in key modules of GSE38718. (D) Correlation and P-values of modules with features in GSE38718. (E) Intersection of module genes in the two datasets.
Screening of clinical samples for expression of differential genes with parallel GO analysis
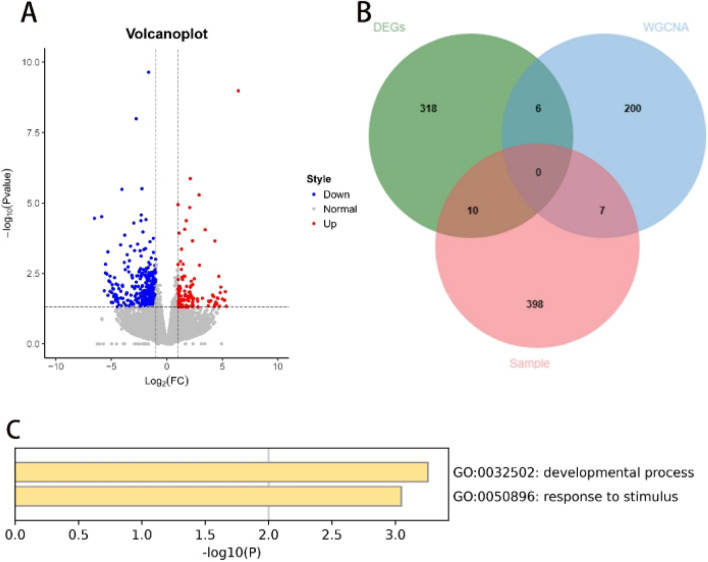
After conducting transcriptome sequencing on six clinical samples and analysing the processed data using “R”, 415 DEGs were filtered (Fig. 4A). Intersection of all obtained genes resulted in 23 hub DEGs (Fig. 4B). These 23 hub DEGs were input into the Metascape database, and a GO analysis was performed. As shown in the figure, the genes were enriched mainly in processes related to growth and response to stimuli (Fig. 4C). The raw sequence data reported in this paper have been deposited in the Genome Sequence Archive (Genomics, Proteomics & Bioinformatics 2021) in the National Genomics Data Center (Nucleic Acids Res 2022), China National Center for Bioinformation / Beijing Institute of Genomics, Chinese Academy of Sciences (GSA-Human: HRA006459) that are publicly accessible at https://ngdc.cncb.ac.cn/gsa-human15,16.
Fig. 4.
Screening of clinical samples for DEGs and GO analysis. (A) Volcano plot of DEGs in clinical samples; (B) Intersection of all DEGs; (C) Perform GO analysis on the 23 hub genes.
Machine learning identifies disease co-diagnostic genes
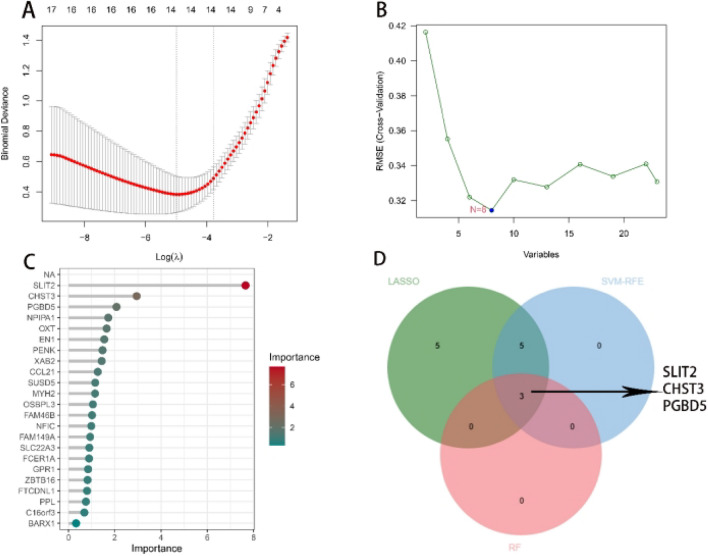
To select the optimal shared genes from these 23 genes, we subsequently employed three machine learning algorithms (LASSO, SVM-RFE, RF) for final determination and filtering. Based on the LASSO algorithm, using the R language package “glmnet”, 14 optimal hub genes were identified (OXT, FAM149A, ZBTB16, SLC22A3, CHST3, EPHA2, PLK1, WT1, KCNC3, PTGS2, PRDM13, NINJ1, CLEC4E, and SPOCK1) (Fig. 5A). Employing the SVM-RFE algorithm, as shown in the figure, the minimum cross-validation error corresponded to eight genes (SLIT2, PGBD5, CHST3, PENK, OXT, EN1, XAB2, and CCL21) (Fig. 5B). Finally, employing the RF algorithm, using the R language package randomForest, we established a random forest model with 500 trees and identified three hub genes closely associated with the disease factors (SLIT2, CHST3, and PGBD5) (Fig. 5C). Then, a Venn diagram of shared disease genes was constructed, confirming SLIT2, CHST3, and PGBD5 as common diagnostic genes for osteoporosis and muscle atrophy (Fig. 5D).
Fig. 5.
Employing three machine learning methods to screen for common diagnostic genes between OP and SA. (A) LASSO regression model to identify the optimal diagnostic genes. (B) Employing SVM-RFE algorithm to screen for the top 8 genes associated with the disease. (C) Utilizing the random forest algorithm to determine the top 3 shared diagnostic genes. (D) Intersection of the results from the three algorithms to identify the final set of common diagnostic genes. OP osteoporosis, SA muscle atrophy, LASSO least absolute shrinkage and selection operator, SVM-RFE support vector machine – recursive feature elimination, RF random forest.
Diagnostic value and validation of disease codiagnostic genes
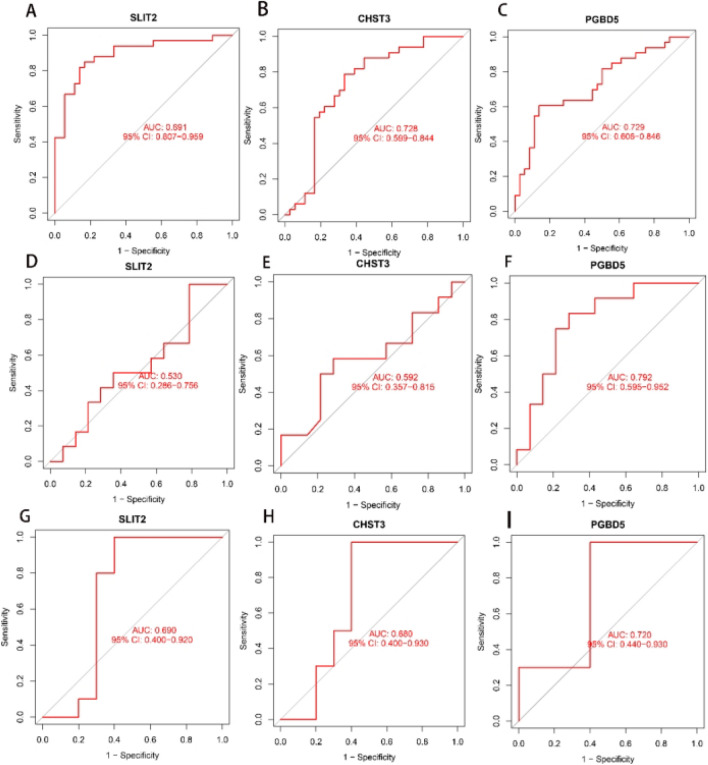
Upon confirming the disease codiagnostic genes as SLIT2, CHST3, and PGBD5, we conducted internal and external validations to assess their specificity and sensitivity in diagnosing the two diseases. In the training cohort, SLIT2 (AUC = 0.891), CHST3 (AUC = 0.728), and PGBD5 (AUC = 0.729), all three genes demonstrated excellent predictive capabilities (Fig. 6A–C). When utilizing the osteoporosis dataset GSE7158 as the validation cohort, SLIT2 (AUC = 0.530) and CHST3 (AUC = 0.592) showed moderate predictive performance (Fig. 6D,F), while PGBD5 (AUC = 0.792) exhibited good predictive capability (Fig. 6E). When using the sarcopenia dataset GSE52699 as the validation cohort, good predictive performance (Fig. 6G–I). These results confirmed their ability to serve as key identification molecules for OP and SA, respectively.
Fig. 6.
Validation of the three disease codiagnostic genes. (A–C) ROC curves of the three genes in the training cohort; (D–F) ROC curves when using GSE7158 as the validation cohort; (G–I) ROC curves when using GSE52699 as the validation cohort.
Single-gene GSEA for the shared diagnostic genes
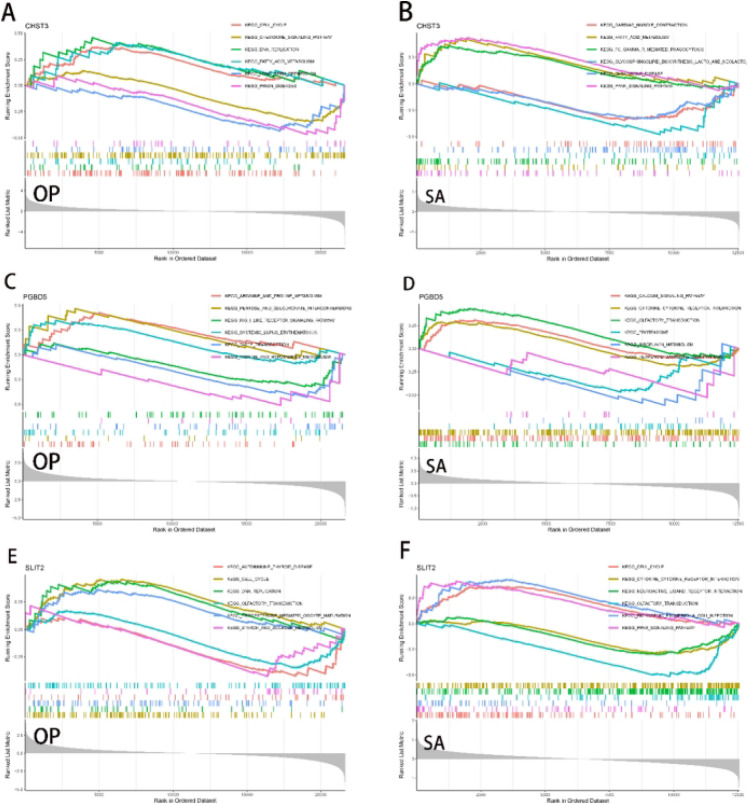
The results of the GSEA analysis indicated that the three genes are involved in metabolic pathways, including regulation of the cell cycle, fatty acid metabolism, DNA replication, and carbohydrate synthesis (Fig. 7). Additionally, we observed that these three genes are also involved in immune pathways and pathways related to inflammation.
Fig. 7.
Analysis of single-gene GSEA. (A,C,E) GSEA analysis of the three diagnostic genes in the OP samples. (B,D,F) Analysis of the three diagnostic genes in the SA samples. GSEA gene set enrichment analysis.
Immunoinfiltration analysis of shared diagnostic genes
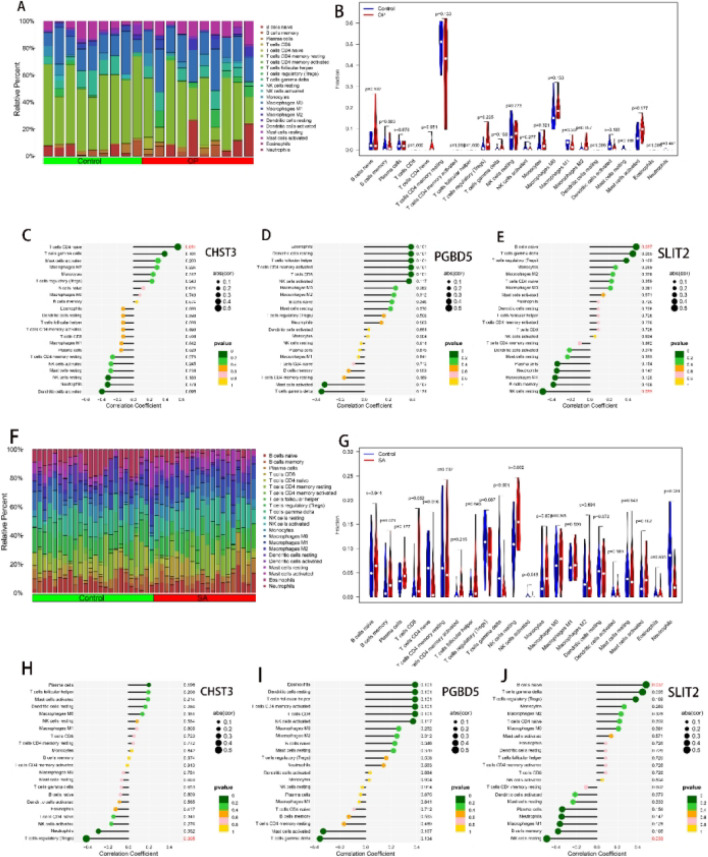
In previous studies, it has been suggested that OP or SA involves immune reactions during progression. Therefore, in this study, we conducted an immune infiltration analysis for both diseases. The abundance of immune cells in each diseases was analysed using the CIBERSORT method. In each diseases, the proportions of 22 immune cells are presented in bar graphs in Fig. 8. The bar graphs clearly show that in the OP samples, resting memory CD4 T cells constituted the majority, while the proportion of naive CD4 T cells showed noticeable differences (P = 0.054) (Fig. 8A,B). In the SA samples, there were significant differences in naive CD4 T cells (P = 0.016), γ-δ T cells (P < 0.001), resting NK cells (P = 0.002), and neutrophils (P < 0.001) (Fig. 8F,G). Subsequently, in the osteoporosis samples, CHST3 showed a significant positive correlation with naive CD4 T cells (Fig. 8C), SLIT2 exhibited a significant positive correlation with naive B cells (Fig. 8E), and PGBD5 did not show significant associations with immune cells (Fig. 8D). In samples from patients with muscle atrophy, CHST3 showed a significant negative correlation with regulatory T cells (Fig. 8H), SLIT2 exhibited a significant positive correlation with naive B cells and a significant negative correlation with resting NK cells (Fig. 8J), and PGBD5 similarly did not show significant correlations with these immune cells (Fig. 8I).
Fig. 8.
Immunological correlation analysis. (A,F) Show the proportions of immune cells in OP samples and SA samples, respectively; (B,G) Display the differences in different immune cells between OP samples and SA samples; (C–E) In OP samples, the correlation between the expressions of CHST3, PGBD5, SLIT2, and immune cells; (H–J) In SA samples, the correlation between the expressions of shared diagnostic genes and immune cells.
Predicting potential therapeutic agents
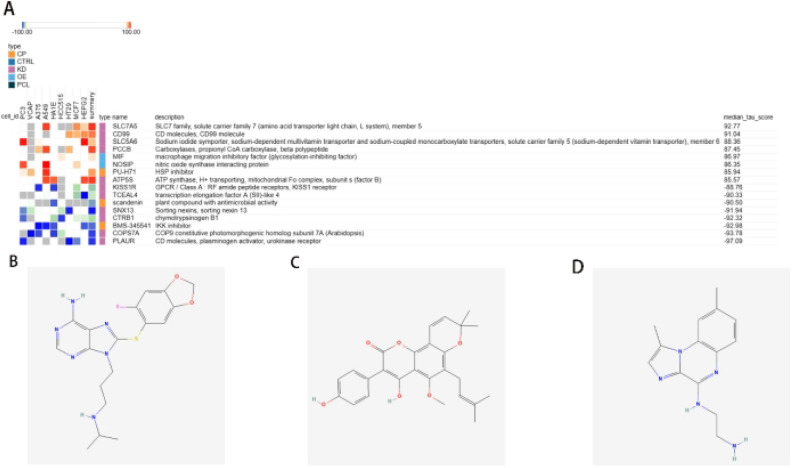
We sorted the 23 genes mentioned above based on gene expression levels and categorised them into upregulated and downregulated genes for inclusion in the CMap database. Using the results of differential expression analysis, we predicted the therapeutic effects of small molecule drugs (Table 3). Based on the median tau values, we selected eight different perturbagens, including genes and knockouts. The results indicated that knocking out or downregulating SLC7A5, CD99, SLC5A6, PCCB, and ATP5S may be beneficial for improving the prognosis of combined OP and SA. On the other hand, knocking out or downregulating KISS1R, TCEAL4, SNX13, CTRB1, COPS7A, and PLAUR may lead to poorer prognosis in patients. Additionally, overexpression of MIF and NOSIP, among other factors, may improve patient outcomes. Finally, we queried and analysed the PubChem database, suggesting that the small molecule drug PU-H71 may be beneficial for improving patient conditions, while Scandenin and BMS-345541 may exacerbate the situation (Fig. 9).
Table 3.
Genes included in predicting therapeutic drugs.
| Expression style | Gene |
|---|---|
| UP | NFIC ZBTB16 XAB2 SUSD5 SLIT2 CHST3 NPIPA1 BARX1 FCER1A EN1 GPR1 MYH2 OSBPL3 SLC22A3 OXT |
| DOWN | PPL CCL21 PGBD5 PENK PPL GSTT1 CLEC4E CPNE6 TCL1A STMN2 |
Fig. 9.
Therapeutic drug prediction and chemical molecular formulas. (A) Heatmap of relevant genes; (B) PU-H71; (C) Scandenin; (D) BMS-345541.
RT-PCR and WB of clinical samples
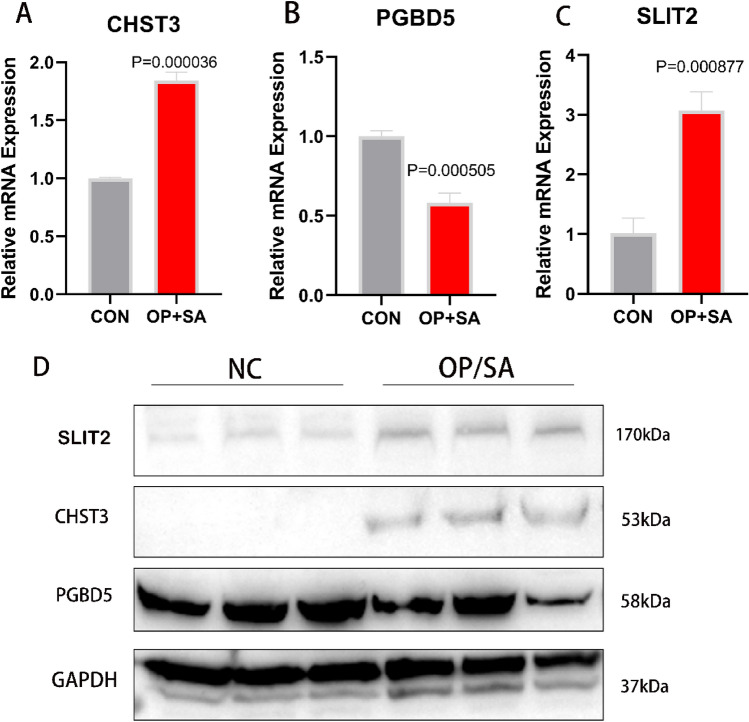
RT-PCR was performed on the collected clinical samples to validate our experimental results. In these samples, the expression levels of CHST3 and SLIT2 were upregulated, while PGBD5 was downregulated (Fig. 10A–C). This was consistent with the results of our previous analysis. This result was further confirmed in the Western blot experiment (Fig. 10D, Fig. S1).
Fig. 10.
RT-PCR and WB of human samples. (A) Expression levels of CHST3 in OP and SA samples; (B) Expression levels of PGBD5; (C) Expression levels of SLIT2; (D) Western blot.
Construction of the PPI network and investigation of related metabolic pathways
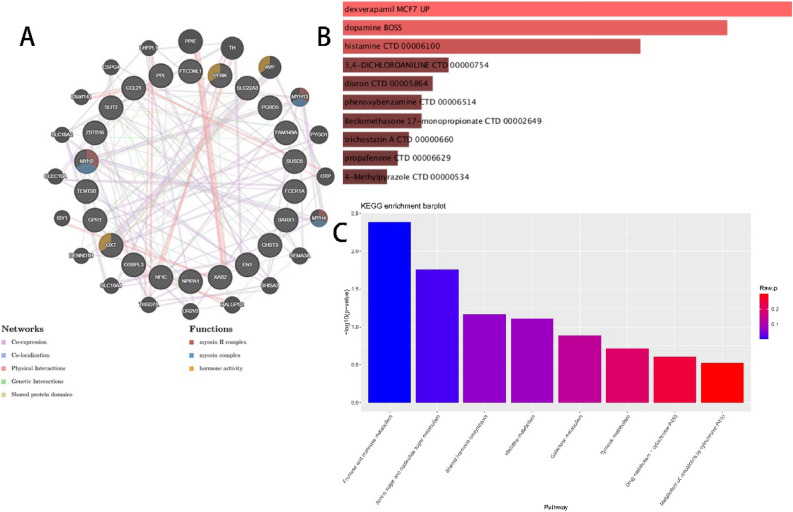
The PPI network constructed using the 23 hub genes is beneficial for further understanding the significant molecular regulatory networks and protein–protein interactions (Fig. 11A). Additionally, the top 10 metabolites associated with these genes were predicted (Fig. 11B). Finally, through KEGG enrichment analysis, we identified potential metabolic pathways associated with OP or SA, such as Fructose and mannose metabolism, Amino sugar and nucleotide sugar metabolism, Steroid hormone biosynthesis, and Histidine metabolism (Fig. 11C). These findings help enhance our understanding of the disease mechanisms at the metabolic level.
Fig. 11.
PPI network and investigation of related metabolic pathways. (A) PPI network; (B) Disease-associated metabolites; (C) Enrichment analysis of related metabolic pathways.
Discussion
With the progress of societal aging, OP and SA often co-occur, and they are currently collectively referred to as ‘osteosarcopenia’. Several factors closely associated with the occurrence and progression have been mentioned in current research: genetics, age, inflammation, and obesity17. In another recent Mendelian randomization study, it was mentioned that OP and SA may have significant causal relationships with each other. Patients with severe osteoporosis have appendicular lean mass, but the decrease in appendicular lean mass may lead to lower lumbar spine bone density, thereby contributing to the occurrence of OVCFs18. Currently, there is no research exploring common diagnostic genes for both diseases. In previous studies, we have not found researchers who included clinical samples for sequencing and analysis; the majority used LIMMA or WGCNA for analysis11,12. Therefore, in this study, we investigated the comorbidity hypothesis of OP and SA by integrating data from public databases and combining it with the clinical samples we collected. In the end, we identified common diagnostic genes and potential molecular mechanisms for both diseases, providing new clinical insights and guidance for diagnosing and treating OP and SA patients.
After analysing with LIMMA, we obtained 334 DEGs; after WGCNA analysis, we got 213 DEGs; and after sequencing clinical samples, we identified 415 DEGs for osteosarcopenia. By taking the intersection of the DEGs obtained from the three algorithms, we identified 23 pivotal genes. We sought to determine which plays the most important role among them. We integrated machine learning algorithms LASSO, SVM-RFE, and RF to obtain the final shared diagnostic genes for the diseases12: CHST3, PGBD5, and SLIT2. In the subsequent training and validation cohorts, these three genes exhibited good predictive performance for the disease.
At the same time, the three genes in both individual OP and SA diseases were found through GSEA analysis to be involved in metabolic pathways such as cell cycle regulation, fatty acid metabolism, DNA replication, and carbohydrate synthesis19. Coincidentally, in our understanding, OP and SA happen to be two diseases closely associated with cellular aging20. The deficiency of essential fatty acids often occurs in diseases related to aging21; the ATP produced by glycolysis is a crucial pathway ensuring the activity of osteoblasts22. The increase in skeletal muscle fat is considered one of the markers of SA23. Aging leads to the loss of muscle mass and functional dysfunction24. At the same time, slowed metabolism and increased body fat ultimately lead to an increased risk of fractures in the elderly25,26.
In our study, we found a significant difference in the proportion of naive CD4 T cells in OP samples (Fig. 8B). In the progression of osteoporosis, it has been demonstrated that T cells are involved and mediate related inflammatory reactions27. Specific subtypes of T cells can express TNFα, accelerating apoptosis of osteoblasts and indirectly stimulating osteoclast generation through the receptor activator of NF-κB ligand (RANKL) produced by B cells28. In SA samples, naive CD4 T cells, γ-δ T cells, resting NK cells, and neutrophils showed significant differences (Fig. 8F,G). In a study by Heo SJ et al., it was observed that the functions of CD4, CD8, and CD19 cells decline with age29. Our study also showed a decrease in the proportion of CD8 T, naive CD4 T, and γ-δ T cells in the bodies of SA patients, while the proportions of NK cells and neutrophils increased, consistent with the results of Ventura et al.’s research30. PGBD5 seems not to be involved in the immune response of both diseases.
We included the 23 obtained pivotal genes in CMap, generating relevant heatmaps, and predicted the chemical formulas of drugs possibly related to osteosarcopenia. These results can provide effective assistance and insights for subsequent research on osteosarcopenia. The results of RT-PCR and WB further strengthen the reliability of the experimental findings. Considering that OP and SA are metabolic diseases, we constructed a PPI network to illustrate the types and strengths of interactions between hub genes and predicted relevant small metabolic molecules and pathways, providing a reference for future research.
CHST3 is an important gene involved in metabolic pathways, and its variation or loss can lead to abnormal development of the spine or joints with dislocation31–33. In a meta-analysis of whole-genome association studies with 177,517 osteoarthritis patients, researchers found a genetic correlation between spinal osteoarthritis and osteoarthritis in the rest of the body. Additionally34. CHST3 is one of the top three genes most confidently associated with hip joint OA In another study involving 32,642 patients, CHST3 was confirmed to be closely associated with lumbar disc degeneration35. Simultaneously, the overexpression of CHST3 can repair degenerated intervertebral discs in mice36. These findings also suggest an indirect impact on the progression of spinal osteoarthritis. Currently, there is no direct evidence showing an association between CHST3 and SA. However, due to the causal relationship between the two diseases, it is difficult to determine whether CHST3 is involved in the onset and progression of SA, and further independent research is needed. Our study also found that CHST3 and SLIT2 exhibited significant correlations with some immune cells in both OP and SA samples, while PGBD5 appeared to be unrelated to the immune response.
Current research has limited understanding of PiggyBac transposable Element-derived protein 5 (PGBD5), considering it to be a fully functional PiggyBac transposase, where its DNA transposition activity remains constant and contributes to the expression of its biological functions37. Its main function is to promote the development of the human brain38,39. It can also influence the progression of certain diseases, such as tumours40,41. After researching relevant literature, we did not find any studies linking PGBD5 to OP or SA, and there are no reports on the association of PGBD5 with the immune system. Perhaps, as mentioned in our research results, PGBD5 may not be involved in the immune processes during the onset of OP and SA but may play a role in metabolic pathways.
The physiological functions of human SLIT2 are numerous and complex, involving processes such as biological development, neural genesis, and tumour progression42. Most studies have focused on cancer treatment. Li et al. found that the overexpression of SLIT2 reduces the proliferation and migration of breast cancer cells43. In our study, the expression of SLIT2 was positively correlated with naive B cells and significantly negatively correlated with NK cells, indicating its important role in immune regulation. The study by Kaul et al. mentioned that SLIT2 was mentioned to increase the polarization of bone marrow-derived macrophages towards an anti-tumour phenotype by regulating immune metabolism44. SLIT2 also regulates osteoclast activity. Park et al. found that SLIT2 inhibited osteoclast formation and reduced bone resorption by reducing Cdc42 activity45. Limited research has been done on whether SLIT2 regulates the metabolism of skeletal muscle. In summary, the various signalling pathways involving SLIT2 are gradually being revealed and explored for their use in the diagnosis and treatment of different diseases.
Considering that both OP and SA are metabolic diseases, our previous metabolic analysis revealed that the hubgenes primarily influence fructose and mannose metabolism, amino acid and nucleotide sugar metabolism, steroid hormone biosynthesis, and histidine metabolism. Previous studies have shown that amino acids are not only involved in protein synthesis but also affect bone cell function by supporting the biosynthesis of nucleotides, redox factors, and lipids46. The metabolism of steroid hormones also plays a crucial role in both OP and SA, particularly estrogen, which has been clearly established to inhibit bone resorption and promote bone formation3. Additionally, histidine metabolism may contribute to the development of SA47. These findings also provide valuable insights for future research.
There are limitations in this study. First, the datasets in the GEO database that meet the research requirements are limited, which restricted our choices. To avoid missing key genes, we selected multiple datasets for screening and used “LIMMA” and “WGCNA” for analysis. Additionally, these factors prevented us from using datasets from common sample sources. We investigated this issue and found that the occurrence of such diseases is accompanied by systemic multi-organ and tissue lesions, so we chose to identify common key genes from three types of tissues. This was also to avoid missing some key genes. Finally, we used transcriptomics to sequence the collected clinical samples. Due to various factors, the clinical samples we collected were limited. Similarly, during external validation, we did not find combined samples of OP and SA for analysis. Although there are imperfections, they do not affect our research results.
In conclusion, CHST3, PGBD5, and SLIT2 have been identified for the first time as common diagnostic genes for the comorbidity of OP and SA. Our analysis also predicts corresponding therapeutic drugs. These results provide future research directions and strengthen the theoretical foundation for understanding comorbid progression.
Supplementary Information
Acknowledgements
We thank the Fifth People’s Hospital of Chengdu City for providing the experimental space and instruments for this experiment.
Author contributions
Xingyao and Shuxing developed the entire research framework, and Zhangzhen provided the experimental methods. Xingyao drafted the manuscript, and Shuxing and Zhangzhen revised it. All authors contributed to this article and approved its submission.
Funding
Funding was provided by Shuxing Xing’s Key Research and Development Project of Chengdu Science and Technology Bureau (2023ZYFS0235).
Data availability
The dataset used in this study is publicly available and can be downloaded from the GEO database (http://www.ncbi.nlm.nih.gov/geo/). The raw sequence data reported in this paper have been deposited in the Genome Sequence Archive (Genomics, Proteomics & Bioinformatics 2021) in the National Genomics Data Center (Nucleic Acids Res 2022), China National Center for Bioinformation/Beijing Institute of Genomics, Chinese Academy of Sciences (GSA-Human: HRA006459) that are publicly accessible at https://ngdc.cncb.ac.cn/gsa-human.
Declarations
Competing interests
The authors declare no competing interests.
Ethics approval and consent to participate
This study was approved by the Ethics Committee of the Affiliated Fifth People’s Hospital of Chengdu University of Traditional Chinese Medicine (Approval Number: Ethical Review 2023-013-Science 01). Prior to the commencement of the experiment, the patients were informed about precautions and signed a written informed consent form.
Footnotes
Publisher’s note
Springer Nature remains neutral with regard to jurisdictional claims in published maps and institutional affiliations.
Supplementary Information
The online version contains supplementary material available at 10.1038/s41598-024-83231-8.
References
- 1.Mattera, M. et al. Imaging of metabolic bone disease. Acta Biomed.89(1-s), 197–207 (2018). [DOI] [PMC free article] [PubMed] [Google Scholar]
- 2.Lu, L. & Tian, L. Postmenopausal osteoporosis coexisting with sarcopenia: the role and mechanisms of oestrogen. J. Endocrinol.10.1530/JOE-23-0116 (2023). [DOI] [PubMed] [Google Scholar]
- 3.McNamara, L. M. Osteocytes and estrogen deficiency. Curr. Osteoporos. Rep.19(6), 592–603 (2021). [DOI] [PubMed] [Google Scholar]
- 4.Cruz-Jentoft, A. J. et al. Sarcopenia: revised European consensus on definition and diagnosis. Age Ageing48(1), 16–31 (2019). [DOI] [PMC free article] [PubMed] [Google Scholar]
- 5.Dhillon, R. J. & Hasni, S. Pathogenesis and management of sarcopenia. Clin. Geriatr. Med.33(1), 17–26 (2017). [DOI] [PMC free article] [PubMed] [Google Scholar]
- 6.Lin, R. et al. Copper-incorporated bioactive glass-ceramics inducing anti-inflammatory phenotype and regeneration of cartilage/bone interface. Theranostics9(21), 6300–6313 (2019). [DOI] [PMC free article] [PubMed] [Google Scholar]
- 7.Ma, X. Y. et al. A bi-directional Mendelian randomization study of the sarcopenia-related traits and osteoporosis. Aging (Albany N.Y.)14(14), 5681–5698 (2022). [DOI] [PMC free article] [PubMed] [Google Scholar]
- 8.Alsoof, D. et al. Diagnosis and management of vertebral compression fracture. Am. J. Med.135(7), 815–821 (2022). [DOI] [PubMed] [Google Scholar]
- 9.Andrei, D. et al. The variability of vertebral body volume and pain associated with osteoporotic vertebral fractures: conservative treatment versus percutaneous transpedicular vertebroplasty. Int. Orthop.41(5), 963–968 (2017). [DOI] [PubMed] [Google Scholar]
- 10.Zeytinoglu, M., Jain, R. K. & Vokes, T. J. Vertebral fracture assessment: enhancing the diagnosis, prevention, and treatment of osteoporosis. Bone104, 54–65 (2017). [DOI] [PubMed] [Google Scholar]
- 11.Mo, L. et al. Integrated bioinformatic analysis of the shared molecular mechanisms between osteoporosis and atherosclerosis. Front. Endocrinol. (Lausanne)13, 950030 (2022). [DOI] [PMC free article] [PubMed] [Google Scholar]
- 12.Chen, W. et al. Shared diagnostic genes and potential mechanism between PCOS and recurrent implantation failure revealed by integrated transcriptomic analysis and machine learning. Front. Immunol.14, 1175384 (2023). [DOI] [PMC free article] [PubMed] [Google Scholar]
- 13.Ha, Y. C., Won Won, C., Kim, M., Chun, K. J. & Yoo, J. I. SARC-F as a useful tool for screening sarcopenia in elderly patients with hip fractures. J. Nutr. Health Aging24(1), 78–82 (2020). [DOI] [PubMed] [Google Scholar]
- 14.Newman, A. M. et al. Robust enumeration of cell subsets from tissue expression profiles. Nat. Methods12(5), 453–457 (2015). [DOI] [PMC free article] [PubMed] [Google Scholar]
- 15.Chen, T. et al. The genome sequence archive family: toward explosive data growth and diverse data types. Genom. Proteom. Bioinform.19(4), 578–583 (2021). [DOI] [PMC free article] [PubMed] [Google Scholar]
- 16.Xue, Y. et al. Database resources of the National Genomics Data Center, China National Center for Bioinformation in 2022. Nucleic Acids Res.50(D1), D27-d38 (2022). [DOI] [PMC free article] [PubMed] [Google Scholar]
- 17.Clynes, M. A., Gregson, C. L., Bruyère, O., Cooper, C. & Dennison, E. M. Osteosarcopenia: where osteoporosis and sarcopenia collide. Rheumatology (Oxford)60(2), 529–537 (2021). [DOI] [PubMed] [Google Scholar]
- 18.Liu, C. et al. Osteoporosis and sarcopenia-related traits: a bi-directional Mendelian randomization study. Front. Endocrinol. (Lausanne)13, 975647 (2022). [DOI] [PMC free article] [PubMed] [Google Scholar]
- 19.Subramanian, A. et al. Gene set enrichment analysis: a knowledge-based approach for interpreting genome-wide expression profiles. Proc. Natl. Acad. Sci. U. S. A.102(43), 15545–15550 (2005). [DOI] [PMC free article] [PubMed] [Google Scholar]
- 20.Farr, J. N. & Khosla, S. Cellular senescence in bone. Bone121, 121–133 (2019). [DOI] [PMC free article] [PubMed] [Google Scholar]
- 21.Das, U. N. Bioactive lipids in age-related disorders. Adv. Exp. Med. Biol.1260, 33–83 (2020). [DOI] [PubMed] [Google Scholar]
- 22.Lee, W. C., Guntur, A. R., Long, F. & Rosen, C. J. Energy metabolism of the osteoblast: implications for osteoporosis. Endocr. Rev.38(3), 255–266 (2017). [DOI] [PMC free article] [PubMed] [Google Scholar]
- 23.Li, C. W. et al. Pathogenesis of sarcopenia and the relationship with fat mass: descriptive review. J. Cachexia Sarcopenia Muscle13(2), 781–794 (2022). [DOI] [PMC free article] [PubMed] [Google Scholar]
- 24.Johannsen, D. L. & Ravussin, E. Obesity in the elderly: is faulty metabolism to blame?. Aging Health6(2), 159–167 (2010). [DOI] [PMC free article] [PubMed] [Google Scholar]
- 25.Yeung, S. S. Y. et al. Sarcopenia and its association with falls and fractures in older adults: a systematic review and meta-analysis. J. Cachexia Sarcopenia Muscle10(3), 485–500 (2019). [DOI] [PMC free article] [PubMed] [Google Scholar]
- 26.Caffarelli, C., Alessi, C., Nuti, R. & Gonnelli, S. Divergent effects of obesity on fragility fractures. Clin. Interv. Aging9, 1629–1636 (2014). [DOI] [PMC free article] [PubMed] [Google Scholar]
- 27.Wu, D. et al. T-cell mediated inflammation in postmenopausal osteoporosis. Front. Immunol.12, 687551 (2021). [DOI] [PMC free article] [PubMed] [Google Scholar]
- 28.Fischer, V. & Haffner-Luntzer, M. Interaction between bone and immune cells: Implications for postmenopausal osteoporosis. Semin. Cell Dev. Biol.123, 14–21 (2022). [DOI] [PubMed] [Google Scholar]
- 29.Heo, S. J. & Jee, Y. S. Characteristics of age classification into five-year intervals to explain sarcopenia and immune cells in older adults. Medicina (Kaunas)59(10), 1700 (2023). [DOI] [PMC free article] [PubMed] [Google Scholar]
- 30.Ventura, M. T., Casciaro, M., Gangemi, S. & Buquicchio, R. Immunosenescence in aging: between immune cells depletion and cytokines up-regulation. Clin. Mol. Allergy15, 21 (2017). [DOI] [PMC free article] [PubMed] [Google Scholar]
- 31.Kausar, M. et al. Biallelic variants in CHST3 cause Spondyloepiphyseal dysplasia with joint dislocations in three Pakistani kindreds. BMC Musculoskelet. Disord.23(1), 818 (2022). [DOI] [PMC free article] [PubMed] [Google Scholar]
- 32.Superti-Furga, A., Unger, S. CHST3-related skeletal dysplasia. In GeneReviews(®) (Adam, M.P., Feldman, J., Mirzaa, G.M., Pagon, R.A., Wallace, S.E., Bean, L.J.H., Gripp, K.W., Amemiya, A. eds) GeneReviews is a registered trademark of the University of Washington, Seattle (University of Washington, 1993).
- 33.Begolli, G., Marković, I., Knežević, J. & Debeljak, Ž. Carbohydrate sulfotransferases: a review of emerging diagnostic and prognostic applications. Biochem. Med. (Zagreb)33(3), 030503 (2023). [DOI] [PMC free article] [PubMed] [Google Scholar]
- 34.Boer, C. G. et al. Deciphering osteoarthritis genetics across 826,690 individuals from 9 populations. Cell184(18), 4784-4818.e4717 (2021). [DOI] [PMC free article] [PubMed] [Google Scholar]
- 35.Song, Y. Q. et al. Lumbar disc degeneration is linked to a carbohydrate sulfotransferase 3 variant. J. Clin. Investig.123(11), 4909–4917 (2013). [DOI] [PMC free article] [PubMed] [Google Scholar]
- 36.Guan, Y. et al. Carbohydrate sulfotransferase 3 (CHST3) overexpression promotes cartilage endplate-derived stem cells (CESCs) to regulate molecular mechanisms related to repair of intervertebral disc degeneration by rat nucleus pulposus. J. Cell. Mol. Med.25(13), 6006–6017 (2021). [DOI] [PMC free article] [PubMed] [Google Scholar]
- 37.Henssen, A. G. et al. Genomic DNA transposition induced by human PGBD5. Elife10.7554/eLife.10565 (2015). [DOI] [PMC free article] [PubMed] [Google Scholar]
- 38.Zapater, L. J. et al. A transposase-derived gene required for human brain development. bioRxiv8, 1395 (2023). [Google Scholar]
- 39.Pavelitz, T., Gray, L. T., Padilla, S. L., Bailey, A. D. & Weiner, A. M. PGBD5: a neural-specific intron-containing piggyBac transposase domesticated over 500 million years ago and conserved from cephalochordates to humans. Mob. DNA4(1), 23 (2013). [DOI] [PMC free article] [PubMed] [Google Scholar]
- 40.Henssen, A. G. et al. Therapeutic targeting of PGBD5-induced DNA repair dependency in pediatric solid tumours. Sci. Transl. Med.10.1126/scitranslmed.aam9078 (2017). [DOI] [PMC free article] [PubMed] [Google Scholar]
- 41.Henssen, A. G. et al. PGBD5 promotes site-specific oncogenic mutations in human tumours. Nat. Genet.49(7), 1005–1014 (2017). [DOI] [PMC free article] [PubMed] [Google Scholar]
- 42.Li, Q. et al. Coadaptation fostered by the SLIT2-ROBO1 axis facilitates liver metastasis of pancreatic ductal adenocarcinoma. Nat. Commun.14(1), 861 (2023). [DOI] [PMC free article] [PubMed] [Google Scholar]
- 43.Li, P. et al. Enhancer RNA SLIT2 inhibits bone metastasis of breast cancer through regulating P38 MAPK/c-Fos signaling pathway. Front. Oncol.11, 743840 (2021). [DOI] [PMC free article] [PubMed] [Google Scholar]
- 44.Kaul, K. et al. Slit2-mediated metabolic reprogramming in bone marrow-derived macrophages enhances antitumor immunity. Front. Immunol.12, 753477 (2021). [DOI] [PMC free article] [PubMed] [Google Scholar]
- 45.Park, S. J., Lee, J. Y., Lee, S. H., Koh, J. M. & Kim, B. J. SLIT2 inhibits osteoclastogenesis and bone resorption by suppression of Cdc42 activity. Biochem. Biophys. Res. Commun.514(3), 868–874 (2019). [DOI] [PubMed] [Google Scholar]
- 46.Devignes, C. S., Carmeliet, G. & Stegen, S. Amino acid metabolism in skeletal cells. Bone Rep.8(17), 101620. 10.1016/j.bonr.2022.101620 (2022). [DOI] [PMC free article] [PubMed] [Google Scholar]
- 47.Zhou, J. et al. Characteristics of the gut microbiome and metabolic profile in elderly patients with sarcopenia. Front. Pharmacol.3(14), 1279448 (2023). [DOI] [PMC free article] [PubMed] [Google Scholar]
Associated Data
This section collects any data citations, data availability statements, or supplementary materials included in this article.
Supplementary Materials
Data Availability Statement
The dataset used in this study is publicly available and can be downloaded from the GEO database (http://www.ncbi.nlm.nih.gov/geo/). The raw sequence data reported in this paper have been deposited in the Genome Sequence Archive (Genomics, Proteomics & Bioinformatics 2021) in the National Genomics Data Center (Nucleic Acids Res 2022), China National Center for Bioinformation/Beijing Institute of Genomics, Chinese Academy of Sciences (GSA-Human: HRA006459) that are publicly accessible at https://ngdc.cncb.ac.cn/gsa-human.


