

Abstract
Viruses exploit key host cell factors to accomplish each individual stage of the viral replication cycle. To understand viral pathogenesis and speed the development of new antiviral strategies, high resolution visualization of virus-host interactions is needed to define where and when these events occur within cells. Here, we review state-of-the-art live cell imaging techniques for tracking individual stages of viral life cycles, focusing predominantly on retroviruses, and especially the human immunodeficiency virus type 1 (HIV-1) which is most extensively studied. We describe how “visible” viruses can be engineered for live cell imaging and how non-modified viruses can, in some instances, be tracked and studied indirectly using cell biosensor systems. We summarize the ways in which live cell imaging has been used to dissect the retroviral life cycle. Finally, we discuss select challenges for the future including the need for better labeling strategies, increased resolution, and multivariate systems that will allow for the study of full viral replication cycles.
Keywords: Virus replication, time-lapse imaging, live cell imaging, fluorescence microscopy
1. INTRODUCTION
As intracellular parasites, viruses hijack specific host cell factors to carry out each individual stage of the viral life cycle. For example, viruses exploit host receptors for cell entry, host transcription and translation machineries to drive efficient viral genome replication and protein production, and host transport factors to facilitate virion assembly and egress. Successful viruses must also circumvent myriad host intrinsic and innate cell barriers that would otherwise slow or abrogate infection. Understanding the mechanistic nature of these key virus-host interactions is vital to informing the development of new antiviral strategies and can reveal important new concepts in molecular and cellular biology.
While powerful genomics-based approaches (e.g., gene knockout screens and interactome studies) now provide us with the means to rapidly screen for host factors (either positive or negative) relevant to viral replication, a limitation of these approaches is that they rarely provide information regarding viral replication dynamics, i.e., when and where key virus-host interactions are taking place inside the cell. Doing so requires “seeing is believing”; the capacity to directly visualize these processes as they occur and with sufficient spatiotemporal resolution. Unfortunately, the first challenge to visualizing viruses is that most virion subtypes are small (<200 nm in diameter), below the resolution limit of conventional light microscopes. Accordingly, for the first decades of modern virology, viral images were necessarily static — generated by electron microscopes and carried out on virion preparations or infected cells treated with fixatives and heavy metal stains (1, 2). Only in the 1980s did cell culture systems, techniques, and cameras suitable for single cell video microscopy begin to allow for real-time visualization of viral transport events as they occurred, initially tracking virions or viral elements labeled using lipid dyes (3), covalently attached synthetic fluorophores (4), or fluorescently-tagged antibodies (5, 6).
The “viral video” game changed dramatically in the 1990’s with the discovery and development of bright, stable versions of the green fluorescent protein (GFP) (7–9), followed by an explosion in the use of GFP and related fluorescent proteins (FPs) to study virus replication in cells (reviewed in (10–18)). Over the last two decades, additional technical innovations have advanced the field: automated stages, regulated stage-top incubators, controlled focus systems, improved light sources, highly sensitive cameras, the development of super-resolution light microscopy techniques, and a broad expansion in the number of available fluorescent labels and labeling strategies. Here, we review both standard and emerging approaches by which viruses are being tracked in single cells using live cell imaging, focusing predominantly on the human immunodeficiency virus type 1 (HIV-1) and other retroviruses, which have been most comprehensively studied.
2. SEEING IS BELIEVING: VISIBLE RETROVIRUSES AND CELL BIOSENSORS
In general, either of two strategies are employed to visualize the individual stages of retroviral replication cycles in living cells: (1) using engineered “visible” viruses wherein individual viral components (i.e., viral proteins, genes, genomes, lipids) are labelled directly with fluorescent molecules or (2) tracking viruses indirectly using host cell biosensors designed to respond to infection and report on specific virus activities.
2a. Engineered Visible Retroviruses.
In the first direct approach, virus genomes are modified to encode FPs or viral elements that are tagged with FPs or chemical probes that allow for real-time tracking of specific activities inside the cell. Viruses are packaged into virions on the order of 100,000-times smaller than cells (in eukaryotes). Thus, they must maintain small genomes and often further optimize their genomic efficiency using overlapping reading frames and/or multifunctional structural elements. As a result of this highly dense genome, generating a tagged visible virus can be a challenge because even minor perturbations can be deleterious to viral replication. Despite this, there are myriad success stories wherein FPs have been used for live cell detection and analysis of viral infection events in cell culture, even for especially compact RNA viruses (14, 19), and sometimes even to monitor virally infected cells in vivo (20, 21).
The most common FP-based labeling strategy for viruses involves modifying viral genomes to express an FP from a viral promoter as a proxy for detecting infection and measuring viral gene expression (22–25). Alternatively, in many instances, virion proteins or genomes are directly fused to an FP marker with only minor effects on protein function or replication efficiency (Figure 1). For example, visible variants of HIV-1 virions (Figure 1A) have been engineered wherein the HIV-1 Gag and Gag-Pol proteins, which drive virion assembly, carry FP inserts and are expressed under conditions where they retain infectivity. These visible variants have been used to study Gag subcellular trafficking (26, 27), virion assembly (28–32), virion cell-to-cell transmission (28–32); and even post-entry events (Figure 1B, strategy 1) (33–35). Alternatively, versions of Gag have recently been engineered to carry non-canonical amino acids that allow for tagging using “click” chemistry — covalent linkages to small, bright chemical probes (Figure 1B, strategy 2) (36). Non-modified versions of Gag have also been successfully tracked by proxy using FP-tagged versions of the Viral protein R (Vpr) (31, 37–39) or host protein Cyclophilin A (CypA) (40), both of which bind to regions of Gag with high affinity and are incorporated into assembling virions (Figure 1B, strategies 3 and 4).
Figure 1.
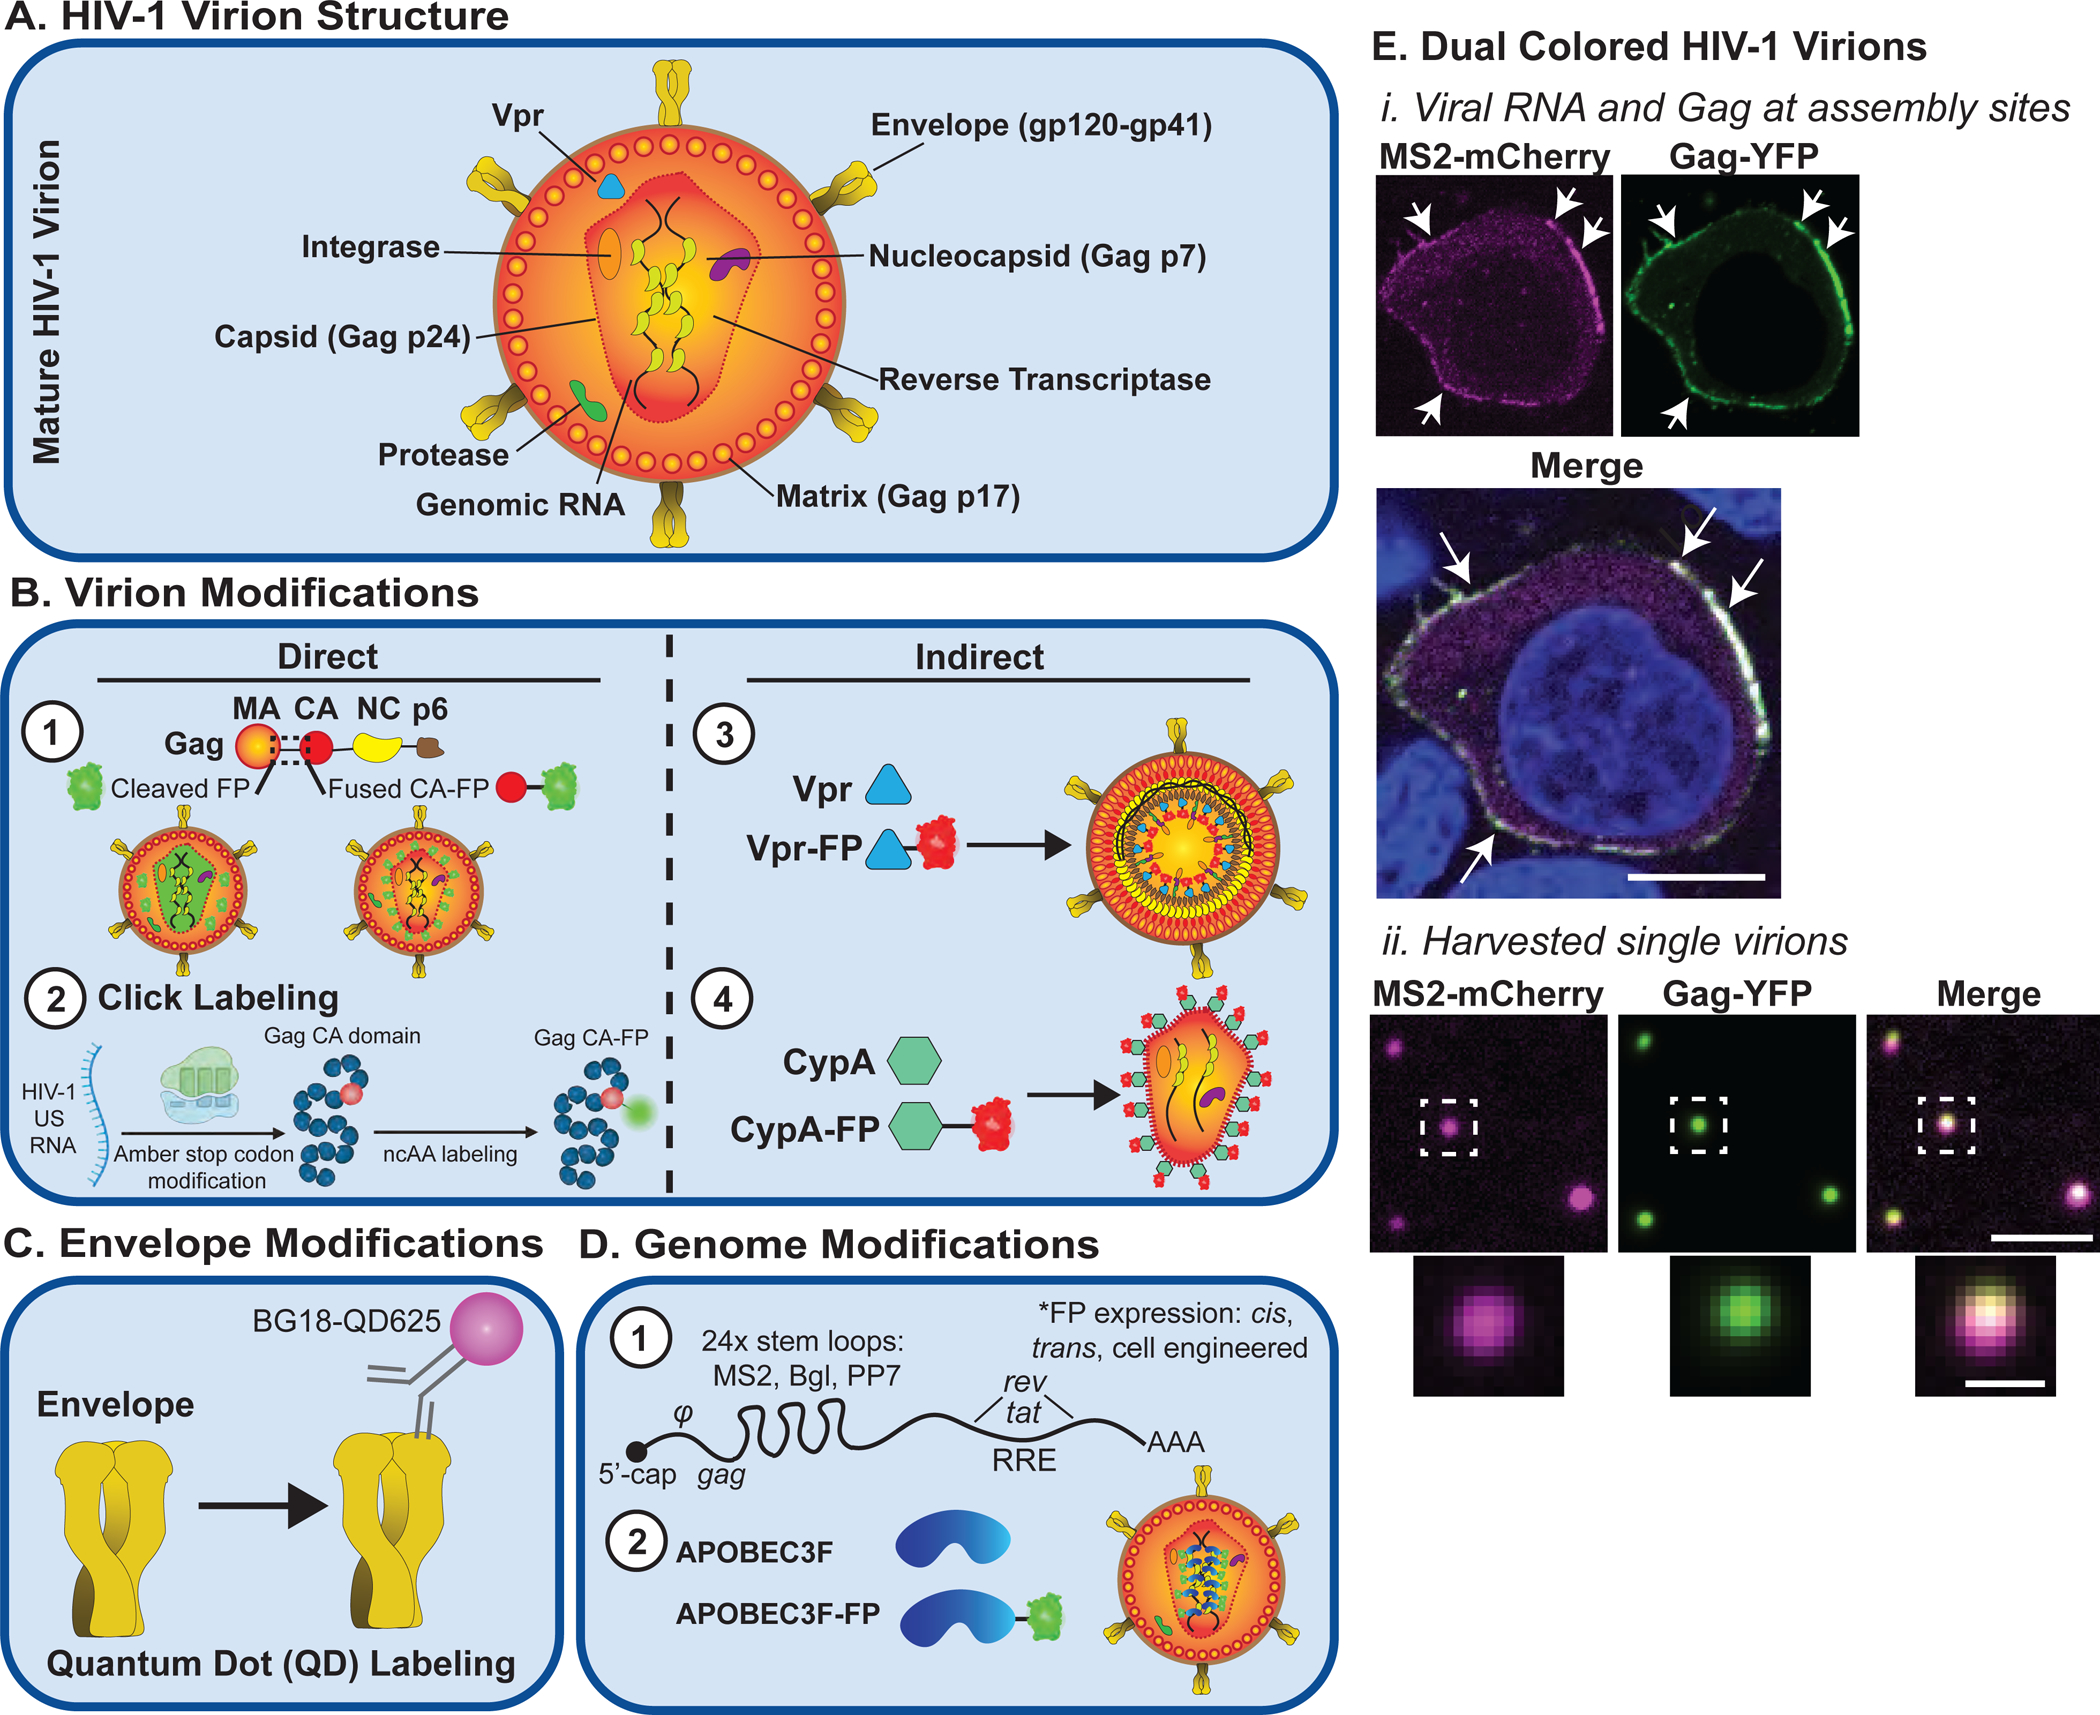
Examples of engineered visible HIV-1 virions. A. HIV-1 virion structure. B. HIV-1 capsid modifications using direct or indirect labeling of Gag. Direct labeling of HIV-1 Gag using (1) fluorescent protein (FP) fusions or (2) click labeling, or indirect labeling using (3) Vpr-FP or (4) CypA-FP. C. HIV-1 Envelope has been successfully tracked using antibodies covalently linked to bright fluorescent dyes such as BG18-QD625 quantum dots. D. (1) HIV-1 RNA genomes modified with RNA stem loops for tracking using stem loop-binding proteins, or (2) direct interaction of nonmodified viral genomes with an FP fused to host RNA-binding protein APOBEC3F. E. Example of two-color HIV-1 virions generated after co-expression of MS2-mCherry-tagged viral RNA genomes and Gag-YFP (i) assembling at the plasma membrane of a HeLa cell or (ii.) visualized after harvesting single virus particles from cell supernatants; cell scale bar = 5 μm, virion scale bar =2.5 μm, inset = 0.5 μm.
To label retroviral envelopes, the generation of functional FP-tagged Envelope (Env) proteins was previously demonstrated as feasible for the model oncoretrovirus murine leukemia virus (MLV) (41–43). However, this strategy has proven challenging for HIV-1 (44). Instead, HIV-1 Env has been successfully monitored in living cells by proxy during virion assembly bound to antibodies covalently linked to bright fluorophores such as quantum dots (45) (Figure 1C).
Finally, HIV-1 RNA genomes and those of other retroviruses have been successfully tracked in several studies using RNA stem loop scaffolding systems (e.g., MS2, Bgl, PP7) (15, 46–50), wherein short, structured RNA elements with a high affinity for recognition by a specific binding protein are engineered into viral RNA, and then co-expressed with the cognate FP-fused RNA-binding protein (Figure 1D, strategy 1). FP-tagged host RNA-binding proteins such as APOBEC3F have also been shown to represent a viable strategy to label non-modified HIV-1 genomes as a proxy system to visualize viral trafficking during the post-entry phases (51) (Figure 1D, strategy 2). Using dual-labeling, FP scaffolding has been used in several instances to successfully track interactions between tagged HIV-1 RNA genomes and Gag-FP proteins in cells using video microscopy, and resulting in the production of two-colored virions (example shown in Figure 1E) (47, 49, 52, 53).
2b. Viral Biosensor Cells.
For the second, “indirect” approach, biosensor cell lines have been engineered that can detect infection by responding to one or more specific virus activities that activate or downregulate expression of fluorescent marker proteins (Figure 2). In general, a major benefit to using virus sensor cells lies in their capacity to detect and study native, non-modified viruses without the risk of impacting viral replication efficiency. For HIV-1, reporters that utilize the HIV-1 Long Terminal Repeat (LTR) promoter region to drive FP-expression have been used extensively since the 1990s (e.g., GHOST cells or analogous systems) (54–56). In these cases, FP expression is conditional on successful viral infection yielding expression of the viral transcriptional activator protein Tat (Figure 2A). Alternatively, stably-expressed FP-tagged versions of host proteins such as APOBEC3G (57, 58) that are downregulated by HIV-1 proteins, can serve as useful biosensors to detect infection and monitor replication dynamics (Figure 2B). For both HIV-1 or other viruses, native cell responses to infection, e.g., remodeling of membranes or the cytoskeleton (59), induction of antiviral gene expression (56, 60), or even cytopathic effects (e.g., activation of apoptotic markers or live cell “plaque assays”) (57, 61) have also been used to detect infection and provide insights into viral replication features.
Figure 2.
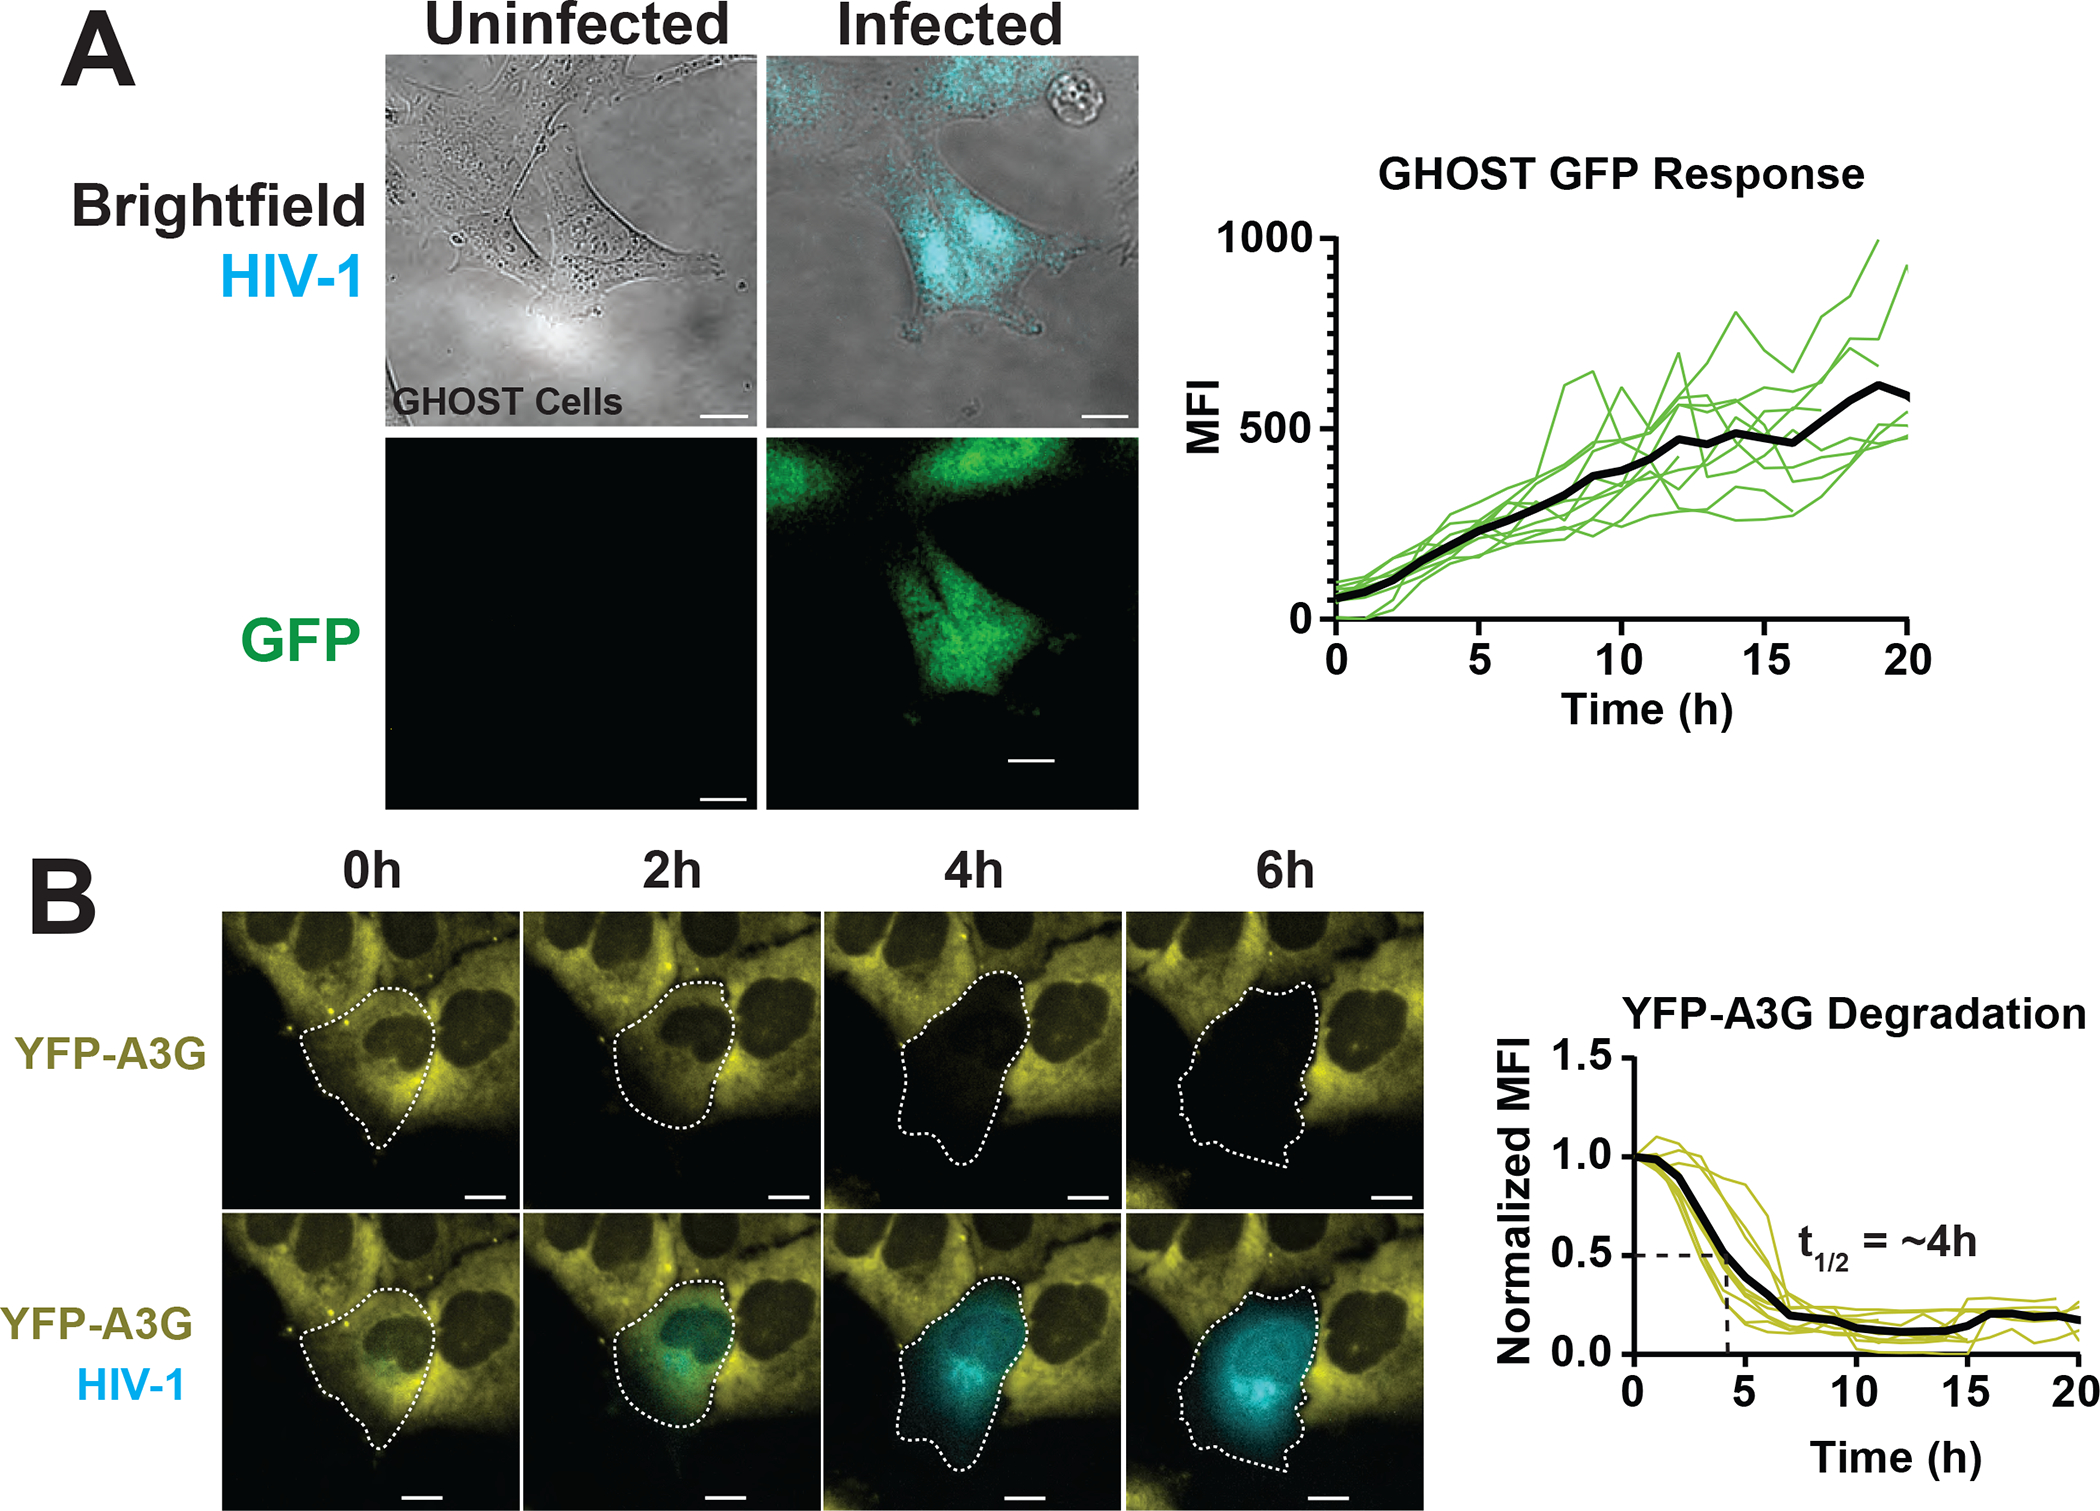
Summary of select cell-based FP-based HIV-1 biosensor strategies. A. Direct detection of HIV- 1 infection using GHOST (HIV-1 LTR-responsive GFP expression), with single cell changes to mean fluorescence intensity shown for a 20h time course (bold line is average for n=10). B. Indirect detection of HIV-1 using YFP-APOBEC3G downregulated by HIV-1 Vif. Graphs show single cell changes to relative mean fluorescence intensity shown for a 20h time course (bold line is average for n=10). The t1/2 measure represents time to 50% single cell signal decay. Size bars = 20μm.
In summary, tagging viral components represents a powerful and direct means of tracking specific phases of the viral life cycle, while cell biosensors can also be highly useful in their capacity to measure viral gene activities even for native, non-modified viruses.
3. THE VIRAL LIVE CELL IMAGING TOOLKIT
3a. Imaging Modalities for Virus Live Cell Imaging
In theory, any fluorescence-based microscopy modality (examples summarized in Table 1) can be used to study retroviral replication provided one has access to a suitably infectable cell culture system and stable incubation conditions. Widefield microscopes couple bright light sources to a broad range of excitation and emission filter sets and are thus the most common and versatile set-ups due to ease of use and low cost. However, low axial (z-axis) resolution is a limitation when the goal is to track single virions or single viral molecules (single particle tracking or SPT). Moreover, out-of-focus light is intrinsic to widefield imaging and may necessitate computational deconvolution strategies. Laser-based systems, such as confocal microscopes or evanescent wave configurations (e.g., total internal reflection fluorescence microscopy, TIR-FM) can provide superior resolution and notably have been used for a wide variety of successful precision retroviral SPT studies (29, 47, 62–64).
Table 1.
Imaging modalities for studies of viral replication
| Imaging modality | Light Source | Best Lateral (XY) & Axial (Z) Resolution | Advantages | Disadvantages | Applications |
|---|---|---|---|---|---|
| Widefield | Mercury bulb or LED | ~230 nm XY ~1000 nm Z |
-Fast acquisition speeds -Ease of use -Low cost -Very broad range of wavelengths |
-Low axial resolution -Out of focus light |
-Broad applications |
| Confocal (scanning or spinning disk) | Laser | ~180nm XY ~500 nm Z |
-High lateral and axial resolution -Pinhole prevents out of focus light |
-Scanning speeds can limit acquisition time -Laser photobleaching |
-Flexible applications including fRaP, photoconversion, FCS |
| Evanescent Wave (TIRFM) | Laser | ~230 nm XY ~100 nm Z |
-Tight axial (Z) resolution -Low signal to noise ratios |
-Limited penetration depth -Sample must be attached to glass |
-Focus on events at the plasma membrane facilitates studies of entry/egress |
| Multiphoton (2P) | Laser | ~200 nm XY ~400 nm Z |
-Deep penetration -Reduced photodamage (low energy) |
-Limit number of useful fluorophores -Relatively low temporal resolution |
-Allows for intravital imaging & visualization of viruses in 3-D culture systems |
| STED | Laser | ~20nm XY ~50 nm Z |
-High lateral and axial resolution -Compatible with a range of fluorophores |
-Photobleaching -Complex optics |
Methods for live viral systems in development |
| PALM | Laser | ~20nm XY ~60 nm Z |
-High lateral and axial resolution -Best method for single molecule resolution |
-Prone to artifacts (complex sample preparation) -Phototoxicicity -Large datasets generated |
Methods for live viral systems in development |
| Lattice Light Sheet | Laser | ~300 nm XY ~300 nm Z |
-High speed 3-D volume image acquisition -Relatively low phototoxicity |
~Limited penetration depth -Large datasets generated |
Methods for live viral systems in development |
Laser systems also enable methods that have measured single cell rates of retroviral protein or RNA diffusion based on fluorescence correlation spectroscopy (FCS) or fluorescence recovery after photobleaching (FRAP) (65–69). These advances are also contributing to the development of live cell versions of previously static super-resolution methods based on stimulated emission depletion (STED) (70) or photoactivation localization microscopy (PALM) (71, 72).
A downside to lasers is photobleaching, slow acquisition, and cell toxicity, which limits imaging times. However, phototoxicity is less of an issue using multiphoton (also known as “2-photon” or “2P”) imaging, that utilizes only long wavelength (e.g. 800 to 1000 nm) laser light that can achieve deep penetration into cell layers or tissues, even allowing for the visualization of retrovirus-infected cells in vivo (20, 73, 74). However, 2P has, by its nature, a limited range of accessible wavelengths and is less useful for rapid (millisecond resolution) imaging applications such as those typically needed for SPT. An alternative recent breakthrough is lattice light sheet microscopy (LLSM). Instead of laser scanning, LLSM moves a thin sheet of light through a fixed sample, thereby allowing for detailed three-dimensional volumetric image acquisition over a time course with relatively low toxicity. However, although LLSM applications for live cell imaging of virally infected cells are under development (75, 76), there are tradeoffs in the context of SPT due to the limited spatial and temporal resolution of LLSM.
3b. Virus Labeling Techniques
A predominant mode of retrovirus labeling involves FP fusions. There are now hundreds of useful FPs available that vary in properties including excitation/emission wavelengths, stability, convertibility, brightness, size, and tendency to multimerize. Moreover, select combinations of FPs allow for real-time studies of HIV-1 protein-protein interactions using techniques including Förster resonance energy transfer (FRET) and fluorescence lifetime imaging (FLIM) (e.g., (77)). Another major boon has been convertible FPs such as photoactivatable versions (PA-GFP) (78) that not only allows for the development of PALM but can also be used for real-time applications including FRAP-based measurements of HIV-1 protein mobility in membranes (79). pH-responsive versions of GFP (e.g., pHlourins) have also been of value to the study of retroviral entry, allowing researchers to track virion association with acidic endosomes (80).
Despite their considerable utility in live imaging of viruses, a drawback to FP fusions for viruses is the large size of the FP relative to the viral protein is tagging. The size issue can be mitigated to an extent using split versions of the FP. One popular system is “GFP1–10” wherein only a small portion of GFP is fused to the protein of interest, and the rest of the GFP protein is co-expressed from a host cell promoter with fluorescence only occuring if there is complementation (81). GFP1–10 systems have been used to detect HIV-1 envelope-mediated membrane fusion (82) and also to generate HIV-1 reporter cells wherein GFP complementation is conditional on infection and delivery of an active viral protease (83). Alternatively, two halves of select FPs can be split with each half used to tag either of two viral proteins that are expected to multimerize — a technique termed biomolecular fluorescence (BiFC) (84). BiFC is conditional on the formation of an intact, fluorescent conjugate that will only occur when the viral proteins are in close proximity (~7nm apart). However, important caveats related to BiFC are that the interaction is irreversible and that BiFC binding may affect protein multimerization kinetics. Nevertheless, this technique has been used successfully to study HIV-1 subcellular trafficking in multiple studies (85–87).
Another FP proxy method for detecting HIV-1 nucleic acids or proteins at the single molecule level is FP scaffolding. By analogy to RNA scaffolding systems such as MS2 (introduced in Figure 1D, strategy 1), a new DNA-based targeting system (ANCHOR) is allowing researchers to detect and track HIV-1 proviral DNA in newly infected cells soon after reverse transcription (88). There are also scaffolding techniques for protein detection, exemplified by the popular SUN-tag system that is based on co-expressing proteins engineered to encode iterative sequences of an protein epitope that can, during or after translation, be bound tightly by co-expressed FP-fused single-chain antibodies (nanobodies) (48);
An additional emerging technique for tagging viral proteins is “click” chemistry. In this approach, viral proteins are engineered (e.g., using an amber suppression system, see Figure 1B, strategy 2) to carry one or more synthetic (“clickable”) codons in a well-defined region of the protein where a synthetic ligand such as a bright, stable chemical fluorophore can be attached covalently. Because the binding reaction between the target protein and fluorophore is irreversible, fluorescence can persist for long periods of time, and the small tags are often much better tolerated by the virus compared to FP fusions. Both cell-permeable and impermeable dyes have recently allowed for tracking HIV-1 capsid cores and viral glycoprotein subcellular transport dynamics using this technology (36, 89).
Taken together, there is a wealth of imaging modalities and labeling techniques now available to virus researchers, with certain imaging methods and fluorescent labels more useful than others for specific applications.
4. USE OF LIVE IMAGING TO BREAK DOWN THE RETROVIRUS LIFE CYCLE
To put these live cell imaging techniques into context, below we summarize how several have been used to study each major phase of the retroviral replication cycle.
4a. Retrovirus Entry
The first barrier viruses face to entry is the cell’s plasma membrane. Viruses are adapted to enter cells either at the plasma membrane or after uptake into the endosomes (Figure 3, Stages 1–3) (16). Live cell imaging has demonstrated that HIV-1 entry is a multistep process that requires cell attachment, receptor engagement, and activation of virion-cell membrane fusion for enveloped virions or membrane penetration by non-enveloped viruses (90, 91). FP-labelled retroviral virions have been shown to first associate with cell surface factors including glycosyl-aminoglycans (92) (Figure 3, Stage 1) prior to the initiation of receptor-dependent, actin-driven “surfing” to preferred sites of entry (Figure 3, Stage 2) (28, 41) and delivery of the capsid core into the cytoplasm (Figure 3, Stage 3a). FP-tagged receptors have been shown to cluster to virion entry sites (41, 93). Furthermore, real-time tracking of single fusion events using virions labeled with lipid dyes and/or FP-tagged virion components demonstrate that viral entry is a cholesterol-dependent process involving a series of stepwise transitions: starting with pore formation, then proceeding to hemifusion, and culminating in full fusion and release of capsid cores into the cell (94, 95). While these studies indicated that HIV-1 virions can fuse at the plasma membrane, live cell single virion tracking has also provided evidence that, in the context of native infection, fusion may occur predominately in endosomes (Figure 3, Stage 3b) (80, 96, 97).
Figure 3.
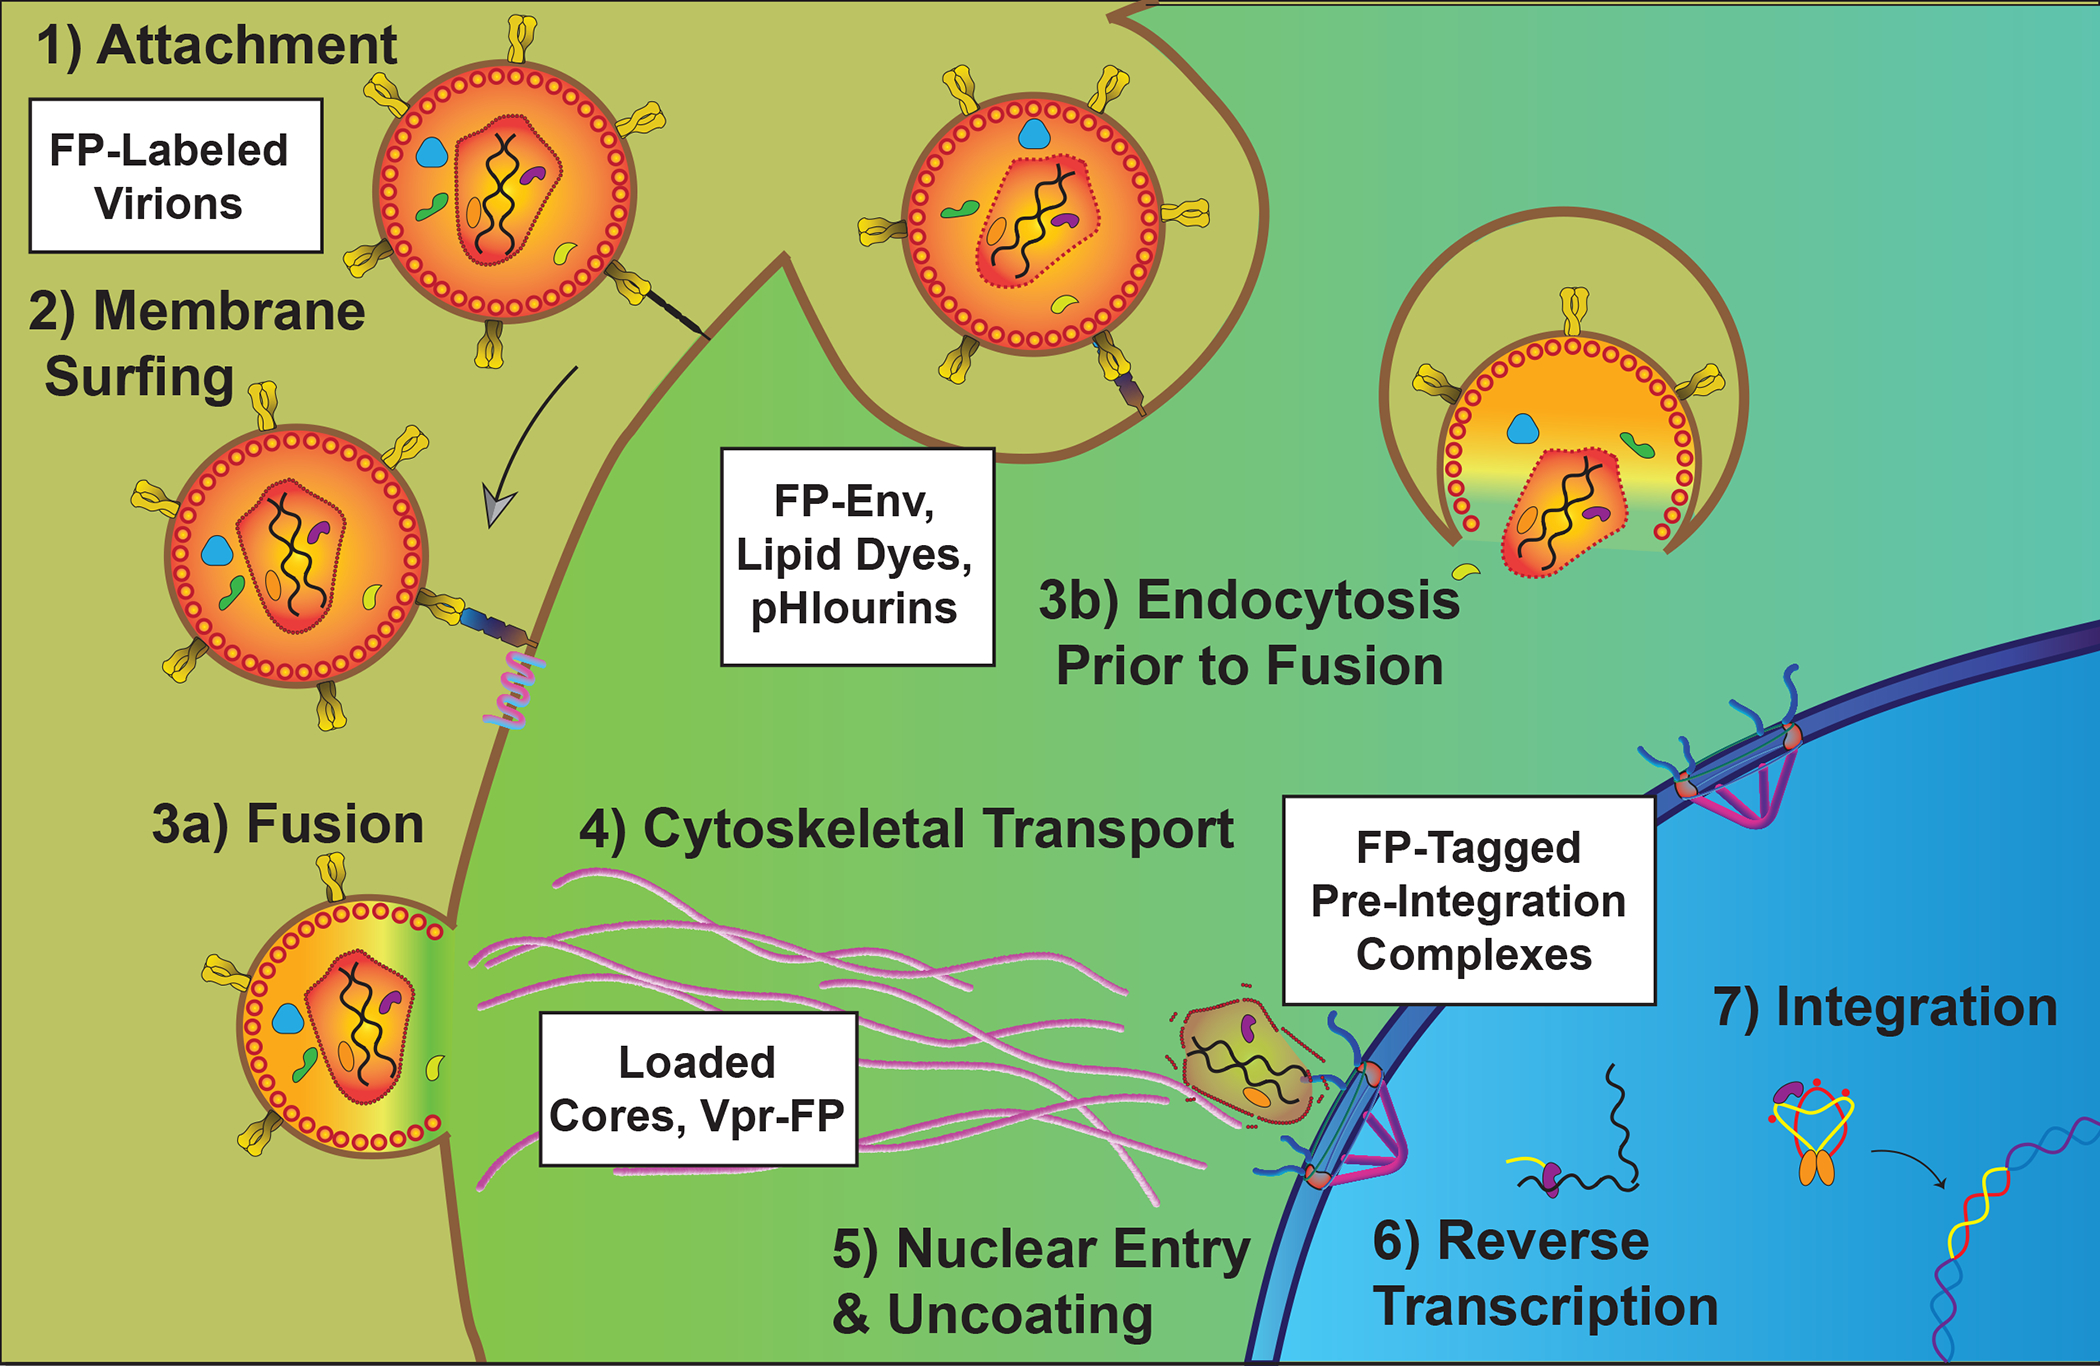
Tracking HIV-1 during entry and the pre-integration stages. HIV-1 first binds to cell surface moieties (Stage 1) and then receptor proteins CD4 and a chemokine co-receptor (Stage 2) prior to undergoing fusion at the plasma membrane or in endosomes (Stage 3). Various labeling methods including lipid dyes and FP-labelled Envelope glycoproteins have been used to study these stages using live cell imaging. Released capsids are trafficked to the nucleus in association with the cytoskeleton (Stage 4), enter the nucleus (Stage 5) during or after reverse transcription (Stage 6) to form the viral pre-integration complex (PIC) and integration of the DNA provirus into the cell’s genome (Stage 7). Established and emerging techniques for tracking HIV-1’s post-entry stages include direct capsid labeling using Gag-FP fusions or chemical probes, indirect capsid labeling using FP-tagged proxies (e.g., based on Vpr or Cyclophilin A), or detecting viral nucleic acids using FP-labeled host proteins or FP-scaffolding.
4b. Post Entry Trafficking
Once inside a cell, viruses face the challenge of navigating the dense cytosol to deliver genomes to sites where viral gene expression can proceed safely from intracellular immune detection. For (+) sense RNA viruses, this process typically entails viral remodeling of cytosolic membranes to form replication compartments (98, 99) whereas (−) sense RNA viruses form inclusion granules wherein viral RNA synthesis is compartmentalized through phase separation (100, 101). For DNA viruses and retroviruses that carry out genome replication stages in the nucleus, capsids can provide protection in the cytoplasm, delivering genomes to the nucleus either through the nuclear pore complex or in conjunction with nuclear membrane breakdown in cells that are actively dividing (102–105).
During the early stages of retroviral infection, the retrovirus capsid undergoes an uncoating process wherein the virus sheds the capsid (CA) lattice that encapsidates and protects the viral RNA genome. This is a critical step in the viral lifecycle that allows for successful reverse transcription to generate the DNA provirus (formation of the “pre-integration complex”, PIC) prior to proviral integration into the host cell’s genome. This delicate process was originally studied using biochemical assays, which provided only indirect measurements of uncoating. To overcome these obstacles, FP-tagging of HIV-1 capsids and/or reverse transcription complexes has been used extensively to achieve direct visualization of the movements of HIV-1 capsids and uncoating dynamics (Figure 1A), with several live imaging studies supporting an early role for the microtubule (MT) cytoskeleton and MT motors in regulating these processes (Figure 3, Stages 4 and 5) (106–111).
Indirect labeling of HIV-1 capsids and PICs was first achieved using FP-tagged Vpr, a viral accessory protein incorporated into virions that retain association with capsids and preintegration complexes (37, 38, 110). More recently, insertion of an FP between the cleavage sites of Gag matrix (MA) and CA has proven valuable (see Figure 1A) because it allows for conditional release of the FP inside the virion after budding and protease maturation, with the fluorophore loaded in the core until uncoating (112, 113). Variations on this fluid-phase approach were recently used in combination with Vpr-FP to show that HIV-1 viral cores may, at least under some conditions, remain intact in the nucleus with reverse transcription occurring in the nucleus and just prior to integration (Figure 3, Stages 6 and 7) (113, 114). These new findings are consistent with data tracking click-labeled cores (see Figure 1A, strategy 2) in live cells (36), as well as high resolution imaging from whole cell cryo-electron tomography, which provided evidence for largely intact conical capsid structures entering the nucleus through the nuclear pore (115, 116). However, it should be noted that these studies’ findings conflicted with earlier live cell imaging studies that used either FP-tagged CA (34) or a modified indirect strategy wherein the capsid is labelled using an FP-tagged version of the host cell protein CypA. These previous studies showed loss of capsid signal in the cytoplasm, which would be more consistent with uncoating occurring prior to nuclear entry (40).
In addition to capsid core subcellular tracking, significant progress has been made in tracking the viral RNA or DNA forms of the genome during the post-entry phases. As discussed earlier, a useful FP-scaffolding DNA tagging strategy dubbed “ANCHOR” was recently developed to serve as a means to detect and track newly reverse transcribed proviral DNA in the nucleus (88). To track viral RNA, an FP-tagged version of host restriction factor APOBEC3F (A3F), which binds to the HIV-1 RNA genome during virion assembly, was used to track incoming virus particles. This study showed that A3F is trafficked all the way to the nucleus, demonstrating that reverse transcription in the cytoplasm is not required for nuclear import (51).
4c. Transcription and Gene Expression (HIV)
Integration of the HIV-1 provirus and subsequent transcription activated by the viral Tat protein and mediated by host RNA polymerase II (RNAP2) yields three groups of viral transcripts: unspliced (US), partially spliced (PS), and completely spliced (CS). The US RNA can serve either as the mRNA template for Gag/Gag-Pol protein synthesis or as the complete viral RNA genome that is packaged into assembling particles (Figure 4). The PS and CS transcripts are translated and produce the other HIV-1 proteins required for efficient viral replication and circumvention of host defenses. The US and PS pools, which retain introns, require specialized nuclear export regulated by the viral Rev protein and the Rev response element RNA structure.
Figure 4.
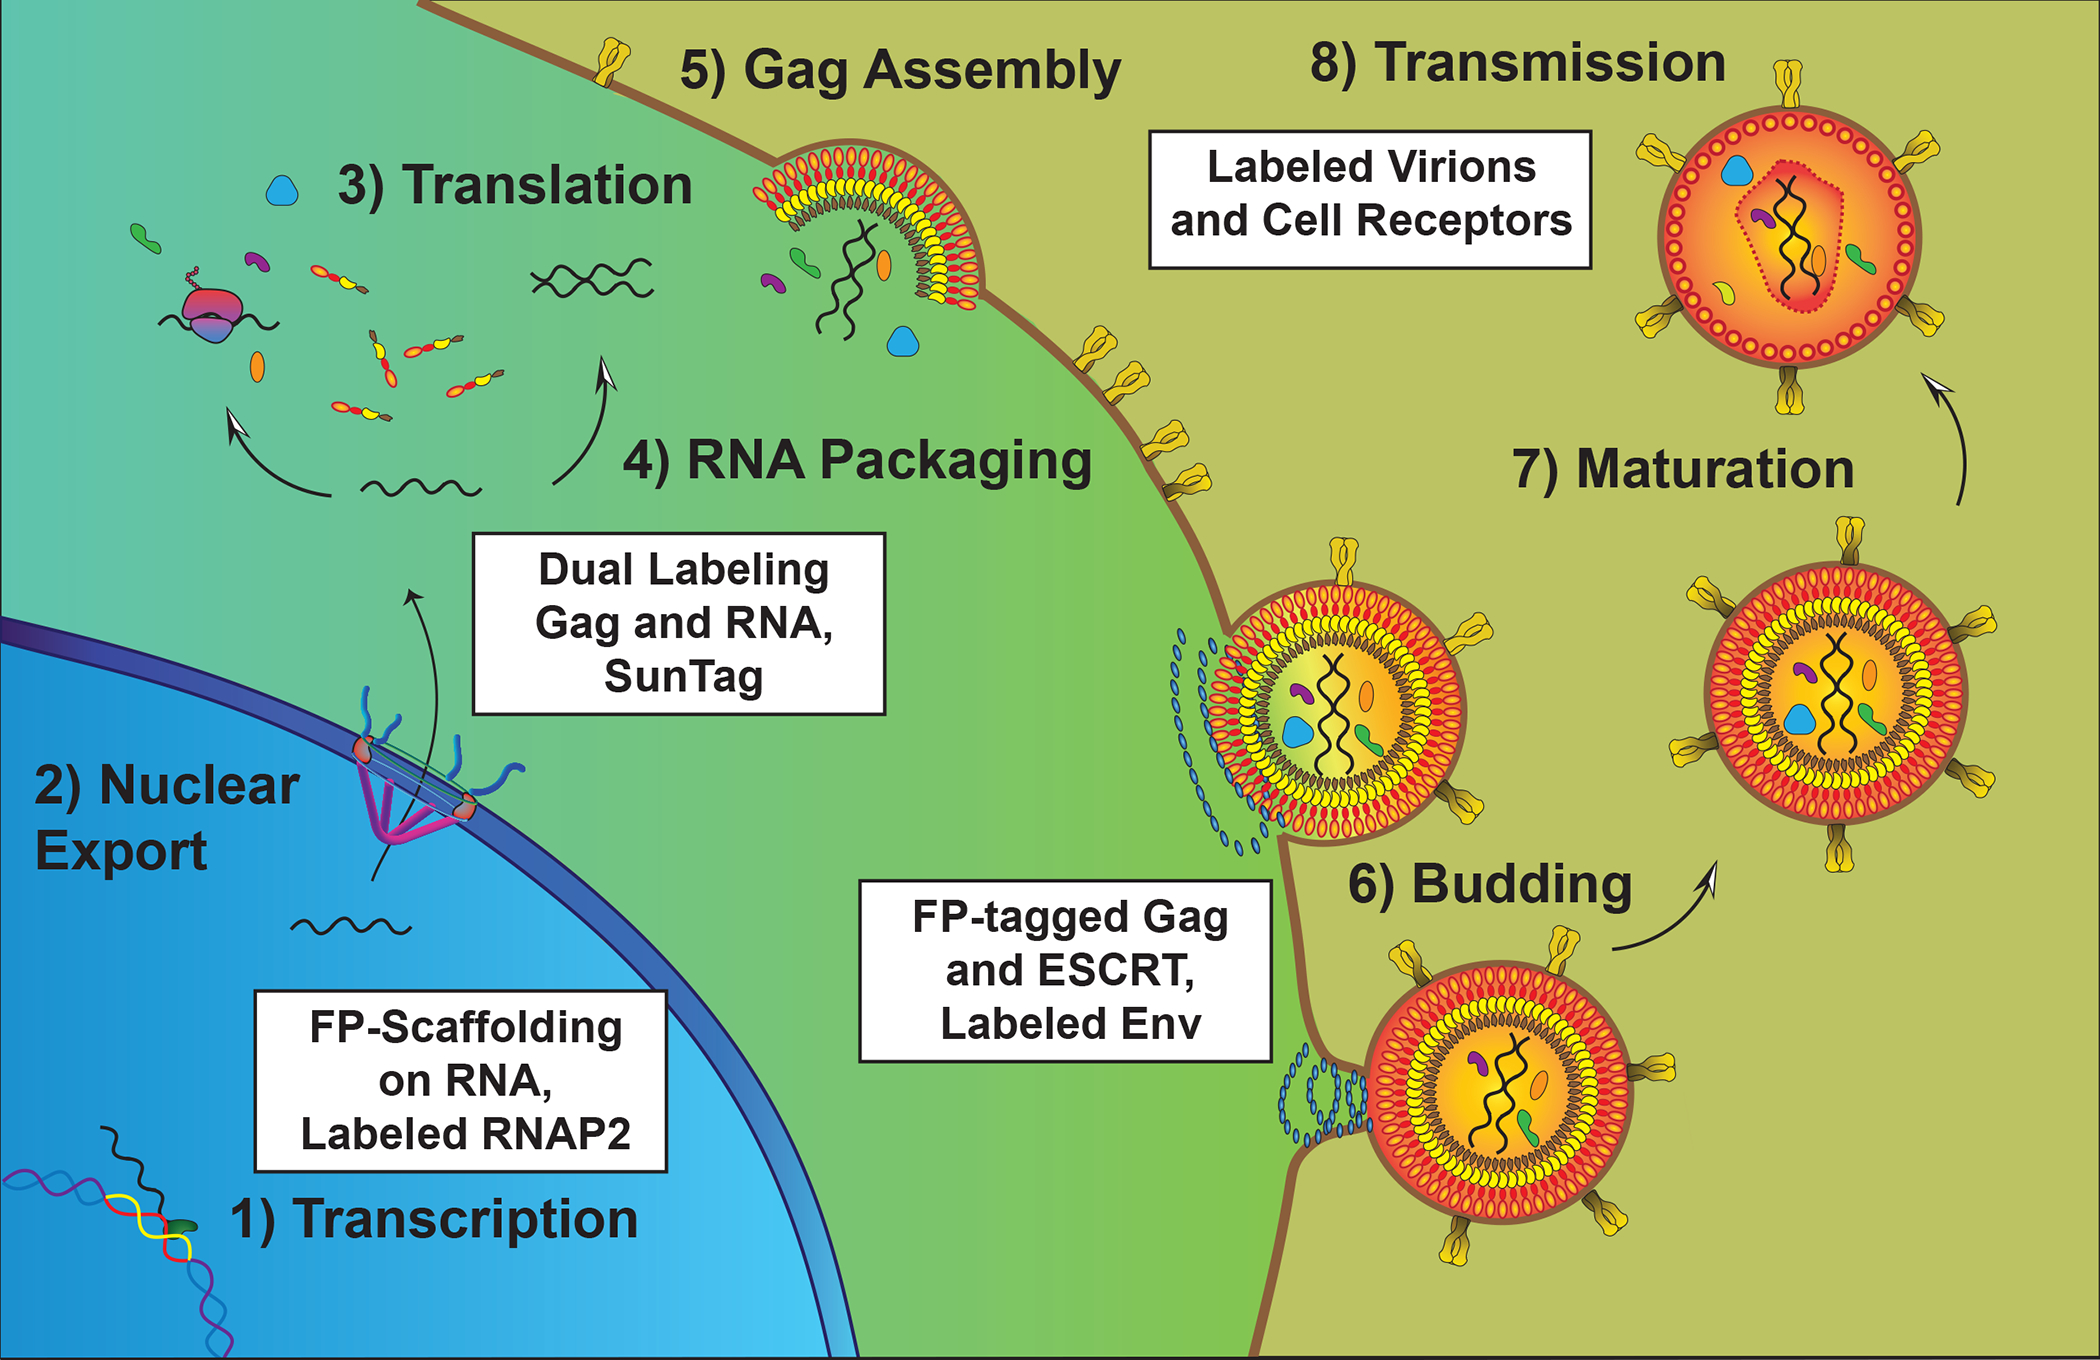
Tracking HIV-1 during the post-integration stages. HIV-1 transcription is driven by host RNAP2 in the nucleus (Stage 1) with viral RNAs (spliced, partially spliced, and unspliced) exported from the nucleus to the cytoplasm through nuclear pores. In the cytoplasm, viral unspliced (US) RNA is either translated to generate Gag and Gag-Pol proteins (Stage 3) or transported by Gag to the plasma membrane for genome packaging (Stage 4). Gag and Gag-Pol multimerization at the plasma membrane driving virion assembly (Stage 5), recruiting Envelope glycoproteins that stud the viral membrane and host ESCRT proteins that mediate membrane scission at the end of the budding stage (Stage 6). After or during budding, the viral protease is activated and cleaves Gag and Gag-Pol into protein subunits including Capsid (CA) that forms the infectious, conical core; a process called maturation (Stage 7). Virions can then be transmitted among cells and tissues to spread infection (Stage 8).
RNA FP-scaffolding has been used extensively to study retroviral RNA dynamics during or after transcription, frequently using methods adapted from a technique first developed by Singer and colleagues. In this method, the MS2 phage capsid protein fused to a fluorophore (e.g., GFP) is co-expressed with RNA molecules engineered to carry multiple copies of an RNA stem loop that bind with high affinity to the MS2-FP tracker protein, thereby generating bright puncta that can yield single mRNA detection (117). To study viral transcription dynamics (Figure 4, Stage 1), methods including FRAP and time-resolved continuous imaging of FP-labelled RNA have been used, at times tracking MS2-FP recruitment co-incident with recruitment and residence of labelled visible RNAP2 at sites of viral integration (68, 118–120). Combined, these techniques have allowed for tracking of HIV-1 Tat-driven viral transcription all the way from pre-initiation to termination.
After transcription, MS2 or analogous systems have also been used to study viral RNA nuclear export and cytoplasmic events that culminate in virion assembly at the plasma membrane (Figure 4, Stage 2) (46, 49, 50, 64, 121–123). Moreover, direct visualization of HIV-1 mRNA translation in the cytosol (Figure 4, Stage 3) has been achieved by combining gag-pol mRNA detection (e.g., using MS2-FP) with detection of Gag or Gag-Pol protein synthesis using SUN-tag (48). Combined, these novel multi-color approaches to study retroviral transcription and gene expression in living cells now establish powerful platforms with which to study complex RNA regulatory elements and host factors that regulate with these processes.
4d. Assembly
As noted above, retroviral US RNA is subjected to dual fates in the cytoplasm, acting as either the mRNA template for Gag/Gag-Pol protein synthesis or the genome that is packaged into assembling virus particles (Figure 4, Stages 3 through 5). Assembly of the HIV-1 virion involves incorporation of two dimerized US RNA genomes into enveloped virions made up of ~2000 Gag and Gag-Pol proteins, with the membrane studded with Envelope proteins, and carrying varying amounts of the accessory proteins Vif, Nef, and Vpr (124). This process starts with Gag proteins interacting with RNA genomes during their trafficking to the plasma membrane. The assembly of Gag into multimers around the viral genomes then occurs at lipid raft sites on the plasma membrane where envelope glycoproteins accumulate. This is followed by recruitment of host endosomal sorting machinery for receptor transport (ESCRT), which mediates viral budding (Figure 4, Stage 6). Virion egress from the cell membrane triggers cleavage of the Gag precursor by the viral protease into its components Capsid (CA), Nucleocapsid (NC), Matrix (MA), and p6 during the maturation process (Figure 4, Stage 7).
Substantial work has been done to study the complex HIV-1 lifecycle using live cell imaging, to the point that we currently have a solid understanding of the general timing of the assembly process. Much of this insight has been gleaned from the use of TIR-FM methods that allowed for the detection of FP-tagged Gag puncta forming at the plasma membrane with high spatial and temporal resolution (125, 126). Co-expression of FP-tagged Gag and viral genomes was used to demonstrate that Gag-dependent transport of HIV-1 RNA genomes to the plasma membrane is an initiating event for assembly, with genome tethering to the membrane preceding the formation of higher-order Gag multimers and full virion assembly (47). Tracking two differentially tagged US RNA genomes later demonstrated that dimerization can occur at the plasma membrane in conjunction with the onset of assembly, contrasting with prior views that genomes first dimerize in the cytoplasm (127). A follow-up study combining the SunTag system with US RNA imaging demonstrated that US RNA is unlikely to be undergoing active translation at sites of virion assembly (48). TIRFM has also proved a powerful technique for monitoring Gag’s recruitment of individual FP-tagged components of the host ESCRT machinery that facilitates membrane cleavage during virus particle release from the cell surface (e.g., TSG101, ALIX, CHMPs, VPS4A) (62, 128–130). Moreover, single particle tracking using TIRFM was recently successfully employed to study Envelope incorporation into assembling virions, using quantum dots conjugated to Env-specific nanobodies (45) (Figure 1C). However, it is important to note that other modalities can provide complementary insights into HIV-1 assembly kinetics. For example 2-photon-based FCS (66) was recently employed to demonstrate that HIV-1 Gag bound to RNA is excluded from the cytoplasmic region directly adjacent to the plasma membrane, exposing a physical barrier to assembly regulated by the peripheral actin cytoskeleton (65).
After assembly and maturation, HIV-1 virions are transmitted to uninfected cells and tissues to spread infection (Figure 4, Stage 8). Transfer of virions occurs through direct cell-cell contacts formed between infected and uninfected cells (referred to as “virological synapses”, VSs). VS-mediated transmission is proposed to be more than 10,000 times more efficient than cell-free virion infection (131). Live-cell viral spread at the VS was first tracked for retroviruses using FP-tagged murine leukemia virus as a model system (28). Subsequent imaging demonstrated that assembly is polarized to the VS (63). Further evidence for VS-mediated MLV spread was obtained using live cell multiphoton imaging in living mice (20). Similar mechanisms have been shown using live cell imaging to enhance the efficiency of spread for HIV-1 (29, 30, 32, 132, 133).
5. SUMMARY AND FUTURE PERSPECTIVES
As summarized above, the retroviral field is rich in techniques and tools for studying virus-host interactions using live cell imaging. HIV-1, now extensively studied, also serves as a useful model system for developing and validating new technologies that can be of broad applicability to the study of diverse viruses and viral families.
Live cell studies of HIV-1 have exposed key stepwise transitions in entry and egress pathways that are only partially characterized. Researchers are now invested in developing approaches to visualize these stages in the context of emerging host antiviral factors such as SERINC5 (134, 135). Similarly, live imaging is playing a crucial role in elucidating the key remaining cytoplasmic and subnuclear trafficking steps that govern HIV-1 genomes subcellular transit to integration sites in the nucleus, illustrated by recent studies of viral capsid interactions with host factors including CPSF6 and nuclear granules (136, 137).
For the post-integration stages, several questions remain related to retroviral RNA regulatory control that are now accessible using imaging tools. For example, efforts are ongoing to more broadly define HIV-1 Tat activity and transcriptional control in the context of viral latency (119, 120), and to define features of the unique nuclear export pathways exploited by retroviruses to mediate nuclear export of RNA genomes (64, 121, 138, 139). As described above, TIRFM studies have exposed many key details related to HIV-1 Gag behaviors at the plasma membrane during virion assembly. However, additional high resolution live cell work, including coupling live cell imaging to super-resolution and electron microscopy techniques (69, 71, 140), will be needed to more fully understand budding and virion maturation steps in molecular detail. Moreover, outside the cell there is a need to continue to apply imaging to identify and understand the host factors that regulate extracellular virion spread among cells and dissemination among tissues (141, 142).
In terms of emerging trajectories, there is enthusiasm for efforts to “put the pieces together” by prioritizing the development of multivariate systems capable of visualizing multiple stages of viral replication cycles simultaneously (144). Ideally, these strategies will access the most “native” contexts possible in order address infection comprehensively and in the setting of combined intrinsic, innate, and cell-based immune defenses, i.e., in vivo using intravital imaging (141, 144) or through the development of biomimetic 3-D cell culture systems (74, 145, 146). To facilitate these efforts, multicolor imaging of viruses engineered to carry multiple minimally obtrusive labels will be ideal (36, 147), potentially in conjunction with multivariate cell sensor systems or, alternatively, computationally adaptive label-free techniques that learn to track infection through cell morphological changes or by measuring metabolic fluctuations (148, 149).
Table 2.
Fluorescence-based labeling strategies for tracking viruses
| Labels | Examples | Advantages | Disadvantages | Live Cell Applications for Studying Viruses |
|---|---|---|---|---|
| Intact Fluorescent Proteins |
GFP, RFP, CFP, YFP, mCherry, tdTomato, etc. | -Expressed in cells -Non-toxic -Flexible experimental design -Allow for multicolor imaging |
-Large size (20–40 kDa) can perturb viral functions -Brightness, sensitivity, and stability can vary broadly -Maturation times can confound temporal measurement |
-Fluid phase reporters -Protein fusions -Tags for single molecule detection using FP scaffolding strategies (RNA; MS2, DNA; ANCHOR, Protein; SunTag) -FRET/FLIM combinations |
| Split Fluorescent Proteins |
BiFC, GFP1– 10/11, tripartite GFP | -Smaller tag than intact FP -Can be used to study molecular interactions |
-Requires balanced levels of co-expression -Irreversible complementation can affect dissociation of protein-protein interactions. |
-Useful for studying of viral multimerization events (BiFC) -Has been used to detect viral protease activity |
| Photoswitchable Fluorescent Proteins |
pHlourin, pHlameleons Photoactivatible GFP (PA-GFP, mEos, Kaede) | -Allows for tight control of FPs activated -Can reduce signal to noise -Some reactions are reversible |
-Photobleaching during switching can influence strength of signal and observation time | -Imaging-based pulse-chase type experiments -Tracking in low pH endosomes -PALM superresolution imaging |
| Quantum dots and other dyes | Fluorophore ligands for HALO and SNAP tags, amber-stop labels, tetracysteine tags (e.g., flASH/reASH) | -Can be very bright and stable and thus allow for single molecule detection -For amber-stop systems, potential to tag a viral element with less impact on structure | -Not all ligands are membrane permeable -Assays must be time dependent and require incubation and wash steps |
-Click chemistry to generate bright virions -Conjugation to antibodies specific for viral proteins -Very useful for pulse-chase type experiments to study viral protein stability and trafficking over time |
| RNA- and DNA- based probes | Fluorescent RNAs (Spinach, Corn, RNA-Mango etc.), molecular beacons | -Nucleic acid probes can be rendered cell- permeable and are often non-toxic -Can be titrated to achieve good signal to noise -For fluorescent RNA structures, can be utilized in cis or in trans |
-Nucleic acids can be susceptible to degradation | -Methods for live viral systems in development |
ACKNOWLEDGMENTS
We would like to acknowledge the work of investigators whose work was not discussed due to space limitations.
Footnotes
DISCLOSURE STATEMENT
The authors are not aware of any affiliations, memberships, funding, or financial holdings that might be perceived as affecting the objectivity of this review.
LITERATURE CITED
- 1.Bernal JD, Fankuchen I. 1937. Structure Types of Protein Crystals from Virus-infected Plants. Nature. 139(3526):923–24 [Google Scholar]
- 2.Brenner S, Horne RW. 1959. A negative staining method for high resolution electron microscopy of viruses. Biochim Biophys Acta. 34:103–10 [DOI] [PubMed] [Google Scholar]
- 3.Lowy RJ, Sarkar DP, Chen Y, Blumenthal R. 1990. Observation of single influenza virus-cell fusion and measurement by fluorescence video microscopy. Proc Natl Acad Sci U S A. 87(5):1850–54 [DOI] [PMC free article] [PubMed] [Google Scholar]
- 4.Georgi A, Mottola-Hartshorn C, Warner A, Fields B, Chen LB. 1990. Detection of individual fluorescently labeled reovirions in living cells. Proc Natl Acad Sci U S A. 87(17):6579–83 [DOI] [PMC free article] [PubMed] [Google Scholar]
- 5.Arnheiter H, Dubois-Dalcq M, Lazzarini RA. 1984. Direct visualization of protein transport and processing in the living cell by microinjection of specific antibodies. Cell. 39(1):99–109 [DOI] [PubMed] [Google Scholar]
- 6.Bächi T 1988. Direct observation of the budding and fusion of an enveloped virus by video microscopy of viable cells. J Cell Biol. 107(5):1689–95 [DOI] [PMC free article] [PubMed] [Google Scholar]
- 7.Prasher DC, Eckenrode VK, Ward WW, Prendergast FG, Cormier MJ. 1992. Primary structure of the Aequorea victoria green-fluorescent protein. Gene. 111(2):229–33 [DOI] [PubMed] [Google Scholar]
- 8.Cubitt AB, Heim R, Adams SR, Boyd AE, Gross LA, Tsien RY. 1995. Understanding, improving and using green fluorescent proteins. Trends Biochem Sci. 20(11):448–55 [DOI] [PubMed] [Google Scholar]
- 9.Chalfie M, Tu Y, Euskirchen G, Ward WW, Prasher DC. 1994. Green fluorescent protein as a marker for gene expression. Science. 263(5148):802–5 [DOI] [PubMed] [Google Scholar]
- 10.Marsh M, Helenius A. 2006. Virus entry: open sesame. Cell. 124(4):729–40 [DOI] [PMC free article] [PubMed] [Google Scholar]
- 11.Greber UF, Way M. 2006. A superhighway to virus infection. Cell. 124(4):741–54 [DOI] [PubMed] [Google Scholar]
- 12.Witte R, Andriasyan V, Georgi F, Yakimovich A, Greber UF. 2018. Concepts in Light Microscopy of Viruses. Viruses. 10(4):202. [DOI] [PMC free article] [PubMed] [Google Scholar]
- 13.Campbell EM, Hope TJ. 2008. Live cell imaging of the HIV-1 life cycle. Trends Microbiol. 16(12):580–87 [DOI] [PMC free article] [PubMed] [Google Scholar]
- 14.Sivaraman D, Biswas P, Cella LN, Yates MV, Chen W. 2011. Detecting RNA viruses in living mammalian cells by fluorescence microscopy. Trends Biotechnol. 29(7):307–13 [DOI] [PubMed] [Google Scholar]
- 15.Bann DV, Parent LJ. 2012. Application of Live-Cell RNA Imaging Techniques to the Study of Retroviral RNA Trafficking. Viruses. 4(6):963–79 [DOI] [PMC free article] [PubMed] [Google Scholar]
- 16.Sun E, He J, Zhuang X. 2013. Live cell imaging of viral entry. Curr Opin Virol. 3(1):34–43 [DOI] [PMC free article] [PubMed] [Google Scholar]
- 17.Dirk BS, Van Nynatten LR, Dikeakos JD. 2016. Where in the Cell Are You? Probing HIV-1 Host Interactions through Advanced Imaging Techniques. Viruses. 8(10):288. [DOI] [PMC free article] [PubMed] [Google Scholar]
- 18.Saffarian S 2021. Application of Advanced Light Microscopy to the Study of HIV and Its Interactions with the Host. Viruses. 13(2):223. [DOI] [PMC free article] [PubMed] [Google Scholar]
- 19.Tran V, Poole DS, Jeffery JJ, Sheahan TP, Creech D, et al. 2015. Multi-Modal Imaging with a Toolbox of Influenza A Reporter Viruses. Viruses. 7(10):5319–27 [DOI] [PMC free article] [PubMed] [Google Scholar]
- 20.Sewald X, Gonzalez DG, Haberman AM, Mothes W. 2012. In vivo imaging of virological synapses. Nat Commun. 3:1320. [DOI] [PMC free article] [PubMed] [Google Scholar]
- 21.Fukuyama S, Katsura H, Zhao D, Ozawa M, Ando T, et al. 2015. Multi-spectral fluorescent reporter influenza viruses (Color-flu) as powerful tools for in vivo studies. Nat Commun. 6:6600. [DOI] [PMC free article] [PubMed] [Google Scholar]
- 22.Casper SJ, Holt CA. 1996. Expression of the green fluorescent protein-encoding gene from a tobacco mosaic virus-based vector. Gene. 173(1 Spec No):69–73 [DOI] [PubMed] [Google Scholar]
- 23.Lee AH, Han JM, Sung YC. 1997. Generation of the replication-competent human immunodeficiency virus type 1 which expresses a jellyfish green fluorescent protein. Biochem Biophys Res Commun. 233(1):288–92 [DOI] [PubMed] [Google Scholar]
- 24.Duprex WP, McQuaid S, Hangartner L, Billeter MA, Rima BK. 1999. Observation of measles virus cell-to-cell spread in astrocytoma cells by using a green fluorescent protein-expressing recombinant virus. J Virol. 73(11):9568–75 [DOI] [PMC free article] [PubMed] [Google Scholar]
- 25.Vieira J, O’Hearn PM. 2004. Use of the red fluorescent protein as a marker of Kaposi’s sarcoma-associated herpesvirus lytic gene expression. Virology. 325(2):225–40 [DOI] [PubMed] [Google Scholar]
- 26.Hendrix J, Baumgärtel V, Schrimpf W, Ivanchenko S, Digman MA, et al. 2015. Live-cell observation of cytosolic HIV-1 assembly onset reveals RNA-interacting Gag oligomers. J. Cell Biol. 210(4):629–46 [DOI] [PMC free article] [PubMed] [Google Scholar]
- 27.Becker JT, Sherer NM. 2017. Subcellular Localization of HIV-1 gag-pol mRNAs Regulates Sites of Virion Assembly. J Virol. 91(6):e02315–16 [DOI] [PMC free article] [PubMed] [Google Scholar]
- 28.Sherer NM, Lehmann MJ, Jimenez-Soto LF, Horensavitz C, Pypaert M, Mothes W. 2007. Retroviruses can establish filopodial bridges for efficient cell-to-cell transmission. Nat Cell Biol. 9(3):310–15 [DOI] [PMC free article] [PubMed] [Google Scholar]
- 29.Hübner W, McNerney GP, Chen P, Dale BM, Gordon RE, et al. 2009. Quantitative 3D video microscopy of HIV transfer across T cell virological synapses. Science. 323(5922):1743–47 [DOI] [PMC free article] [PubMed] [Google Scholar]
- 30.Sowinski S, Jolly C, Berninghausen O, Purbhoo MA, Chauveau A, et al. 2008. Membrane nanotubes physically connect T cells over long distances presenting a novel route for HIV-1 transmission. Nat Cell Biol. 10(2):211–19 [DOI] [PubMed] [Google Scholar]
- 31.McDonald D, Wu L, Bohks SM, KewalRamani VN, Unutmaz D, Hope TJ. 2003. Recruitment of HIV and its receptors to dendritic cell-T cell junctions. Science. 300(5623):1295–97 [DOI] [PubMed] [Google Scholar]
- 32.Gousset K, Ablan SD, Coren LV, Ono A, Soheilian F, et al. 2008. Real-time visualization of HIV-1 GAG trafficking in infected macrophages. PLoS Pathog. 4(3):e1000015. [DOI] [PMC free article] [PubMed] [Google Scholar]
- 33.Burdick RC, Delviks-Frankenberry KA, Chen J, Janaka SK, Sastri J, et al. 2017. Dynamics and regulation of nuclear import and nuclear movements of HIV-1 complexes. PLoS Pathog. 13(8):e1006570. [DOI] [PMC free article] [PubMed] [Google Scholar]
- 34.Mamede JI, Cianci GC, Anderson MR, Hope TJ. 2017. Early cytoplasmic uncoating is associated with infectivity of HIV-1. Proc Natl Acad Sci U S A. 114(34):E7169–78 [DOI] [PMC free article] [PubMed] [Google Scholar]
- 35.Zurnic Bönisch I, Dirix L, Lemmens V, Borrenberghs D, De Wit F, et al. 2020. Capsid-Labelled HIV To Investigate the Role of Capsid during Nuclear Import and Integration. J Virol. 94(7):e01024–19 [DOI] [PMC free article] [PubMed] [Google Scholar]
- 36.Schifferdecker S, Zila V, Müller TG, Sakin V, Anders-Össwein M, et al. 2022. Direct Capsid Labeling of Infectious HIV-1 by Genetic Code Expansion Allows Detection of Largely Complete Nuclear Capsids and Suggests Nuclear Entry of HIV-1 Complexes via Common Routes. mBio. 13(5):e0195922. [DOI] [PMC free article] [PubMed] [Google Scholar]
- 37.Campbell EM, Perez O, Melar M, Hope TJ. 2007. Labeling HIV-1 virions with two fluorescent proteins allows identification of virions that have productively entered the target cell. Virology. 360(2):286–93 [DOI] [PMC free article] [PubMed] [Google Scholar]
- 38.Lampe M, Briggs JAG, Endress T, Glass B, Riegelsberger S, et al. 2007. Double-labelled HIV-1 particles for study of virus-cell interaction. Virology. 360(1):92–104 [DOI] [PubMed] [Google Scholar]
- 39.Sood C, Francis AC, Desai TM, Melikyan GB. 2017. An improved labeling strategy enables automated detection of single-virus fusion and assessment of HIV-1 protease activity in single virions. J Biol Chem. 292(49):20196–207 [DOI] [PMC free article] [PubMed] [Google Scholar]
- 40.Francis AC, Marin M, Shi J, Aiken C, Melikyan GB. 2016. Time-Resolved Imaging of Single HIV-1 Uncoating In Vitro and in Living Cells. PLoS Pathog. 12(6):e1005709. [DOI] [PMC free article] [PubMed] [Google Scholar]
- 41.Lehmann MJ, Sherer NM, Marks CB, Pypaert M, Mothes W. 2005. Actin- and myosin-driven movement of viruses along filopodia precedes their entry into cells. J Cell Biol. 170(2):317–25 [DOI] [PMC free article] [PubMed] [Google Scholar]
- 42.Sherer NM, Lehmann MJ, Jimenez-Soto LF, Ingmundson A, Horner SM, et al. 2003. Visualization of retroviral replication in living cells reveals budding into multivesicular bodies. Traffic. 4(11):785–801 [DOI] [PubMed] [Google Scholar]
- 43.Sliva K, Erlwein O, Bittner A, Schnierle BS. 2004. Murine leukemia virus (MLV) replication monitored with fluorescent proteins. Virol J. 1:14. [DOI] [PMC free article] [PubMed] [Google Scholar]
- 44.Carravilla P, Nieva JL, Eggeling C. 2020. Fluorescence Microscopy of the HIV-1 Envelope. Viruses. 12(3):348. [DOI] [PMC free article] [PubMed] [Google Scholar]
- 45.Pezeshkian N, Groves NS, van Engelenburg SB. 2019. Single-molecule imaging of HIV-1 envelope glycoprotein dynamics and Gag lattice association exposes determinants responsible for virus incorporation. Proc Natl Acad Sci U S A. 116(50):25269–77 [DOI] [PMC free article] [PubMed] [Google Scholar]
- 46.Kemler I, Meehan A, Poeschla EM. 2010. Live-cell coimaging of the genomic RNAs and Gag proteins of two lentiviruses. J Virol. 84(13):6352–66 [DOI] [PMC free article] [PubMed] [Google Scholar]
- 47.Jouvenet N, Simon SM, Bieniasz PD. 2009. Imaging the interaction of HIV-1 genomes and Gag during assembly of individual viral particles. Proc. Natl. Acad. Sci. U.S.A. 106(45):19114–19 [DOI] [PMC free article] [PubMed] [Google Scholar]
- 48.Chen J, Liu Y, Wu B, Nikolaitchik OA, Mohan PR, et al. 2020. Visualizing the translation and packaging of HIV-1 full-length RNA. Proc Natl Acad Sci U S A. 117(11):6145–55 [DOI] [PMC free article] [PubMed] [Google Scholar]
- 49.Pocock GM, Becker JT, Swanson CM, Ahlquist P, Sherer NM. 2016. HIV-1 and M-PMV RNA Nuclear Export Elements Program Viral Genomes for Distinct Cytoplasmic Trafficking Behaviors. PLoS Pathog. 12(4):e1005565. [DOI] [PMC free article] [PubMed] [Google Scholar]
- 50.Basyuk E, Galli T, Mougel M, Blanchard J-M, Sitbon M, Bertrand E. 2003. Retroviral genomic RNAs are transported to the plasma membrane by endosomal vesicles. Dev Cell. 5(1):161–74 [DOI] [PubMed] [Google Scholar]
- 51.Burdick RC, Hu W-S, Pathak VK. 2013. Nuclear import of APOBEC3F-labeled HIV-1 preintegration complexes. Proc Natl Acad Sci U S A. 110(49):E4780–4789 [DOI] [PMC free article] [PubMed] [Google Scholar]
- 52.Hatch SC, Sardo L, Chen J, Burdick R, Gorelick R, et al. 2013. Gag-dependent Enrichment of HIV-1 RNA near the Uropod Membrane of Polarized T Cells. J. Virol. [DOI] [PMC free article] [PubMed] [Google Scholar]
- 53.Chen J, Nikolaitchik O, Singh J, Wright A, Bencsics CE, et al. 2009. High efficiency of HIV-1 genomic RNA packaging and heterozygote formation revealed by single virion analysis. Proc. Natl. Acad. Sci. U.S.A. 106(32):13535–40 [DOI] [PMC free article] [PubMed] [Google Scholar]
- 54.Mörner A, Björndal A, Albert J, Kewalramani VN, Littman DR, et al. 1999. Primary human immunodeficiency virus type 2 (HIV-2) isolates, like HIV-1 isolates, frequently use CCR5 but show promiscuity in coreceptor usage. J Virol. 73(3):2343–49 [DOI] [PMC free article] [PubMed] [Google Scholar]
- 55.Gervaix A, West D, Leoni LM, Richman DD, Wong-Staal F, Corbeil J. 1997. A new reporter cell line to monitor HIV infection and drug susceptibility in vitro. Proc Natl Acad Sci U S A. 94(9):4653–58 [DOI] [PMC free article] [PubMed] [Google Scholar]
- 56.Kane M, Zang TM, Rihn SJ, Zhang F, Kueck T, et al. 2016. Identification of Interferon-Stimulated Genes with Antiretroviral Activity. Cell Host Microbe. 20(3):392–405 [DOI] [PMC free article] [PubMed] [Google Scholar]
- 57.Evans EL, Becker JT, Fricke SL, Patel K, Sherer NM. 2018. HIV-1 Vif’s Capacity To Manipulate the Cell Cycle Is Species Specific. J Virol. 92(7):e02102–17 [DOI] [PMC free article] [PubMed] [Google Scholar]
- 58.Holmes M, Zhang F, Bieniasz PD. 2015. Single-Cell and Single-Cycle Analysis of HIV-1 Replication. PLoS Pathog. 11(6):e1004961. [DOI] [PMC free article] [PubMed] [Google Scholar]
- 59.Cortese M, Lee J-Y, Cerikan B, Neufeldt CJ, Oorschot VMJ, et al. 2020. Integrative Imaging Reveals SARS-CoV-2-Induced Reshaping of Subcellular Morphologies. Cell Host Microbe. 28(6):853–866.e5 [DOI] [PMC free article] [PubMed] [Google Scholar]
- 60.Voigt E, Inankur B, Baltes A, Yin J. 2013. A quantitative infection assay for human type I, II, and III interferon antiviral activities. Virol J. 10:224. [DOI] [PMC free article] [PubMed] [Google Scholar]
- 61.Arias-Arias JL, Corrales-Aguilar E, Mora-Rodríguez RA. 2021. A Fluorescent Real-Time Plaque Assay Enables Single-Cell Analysis of Virus-Induced Cytopathic Effect by Live-Cell Imaging. Viruses. 13(7):1193. [DOI] [PMC free article] [PubMed] [Google Scholar]
- 62.Baumgärtel V, Ivanchenko S, Dupont A, Sergeev M, Wiseman PW, et al. 2011. Live-cell visualization of dynamics of HIV budding site interactions with an ESCRT component. Nat Cell Biol. 13(4):469–74 [DOI] [PubMed] [Google Scholar]
- 63.Jin J, Sherer NM, Heidecker G, Derse D, Mothes W. 2009. Assembly of the murine leukemia virus is directed towards sites of cell-cell contact. PLoS Biol. 7(7):e1000163. [DOI] [PMC free article] [PubMed] [Google Scholar]
- 64.Maldonado RJK, Rice B, Chen EC, Tuffy KM, Chiari EF, et al. 2020. Visualizing Association of the Retroviral Gag Protein with Unspliced Viral RNA in the Nucleus. mBio. 11(2):e00524–20 [DOI] [PMC free article] [PubMed] [Google Scholar]
- 65.Angert I, Karuka SR, Mansky LM, Mueller JD. 2022. Partitioning of ribonucleoprotein complexes from the cellular actin cortex. Sci Adv. 8(33):eabj3236. [DOI] [PMC free article] [PubMed] [Google Scholar]
- 66.Fogarty KH, Berk S, Grigsby IF, Chen Y, Mansky LM, Mueller JD. 2014. Interrelationship between cytoplasmic retroviral Gag concentration and Gag-membrane association. J Mol Biol. 426(7):1611–24 [DOI] [PMC free article] [PubMed] [Google Scholar]
- 67.Roy NH, Chan J, Lambelé M, Thali M. 2013. Clustering and mobility of HIV-1 Env at viral assembly sites predict its propensity to induce cell-cell fusion. J Virol. 87(13):7516–25 [DOI] [PMC free article] [PubMed] [Google Scholar]
- 68.Maiuri P, Knezevich A, Bertrand E, Marcello A. 2011. Real-time imaging of the HIV-1 transcription cycle in single living cells. Methods. 53(1):62–67 [DOI] [PubMed] [Google Scholar]
- 69.Dibsy R, Bremaud E, Mak J, Favard C, Muriaux D. 2023. HIV-1 diverts cortical actin for particle assembly and release. Nat Commun. 14(1):6945. [DOI] [PMC free article] [PubMed] [Google Scholar]
- 70.Chojnacki J, Eggeling C. 2021. Super-Resolution STED Microscopy-Based Mobility Studies of the Viral Env Protein at HIV-1 Assembly Sites of Fully Infected T-Cells. Viruses. 13(4):608. [DOI] [PMC free article] [PubMed] [Google Scholar]
- 71.Saha I, Saffarian S. 2020. Dynamics of the HIV Gag Lattice Detected by Localization Correlation Analysis and Time-Lapse iPALM. Biophys J. 119(3):581–92 [DOI] [PMC free article] [PubMed] [Google Scholar]
- 72.Yang Y, Qu N, Tan J, Rushdi MN, Krueger CJ, Chen AK. 2018. Roles of Gag-RNA interactions in HIV-1 virus assembly deciphered by single-molecule localization microscopy. Proc Natl Acad Sci U S A. 115(26):6721–26 [DOI] [PMC free article] [PubMed] [Google Scholar]
- 73.Vrba SM, Hickman HD. 2022. Imaging viral infection in vivo to gain unique perspectives on cellular antiviral immunity. Immunol Rev. 306(1):200–217 [DOI] [PMC free article] [PubMed] [Google Scholar]
- 74.Murooka TT, Deruaz M, Marangoni F, Vrbanac VD, Seung E, et al. 2012. HIV-infected T cells are migratory vehicles for viral dissemination. Nature. 490(7419):283–87 [DOI] [PMC free article] [PubMed] [Google Scholar]
- 75.Flomm FJ, Soh TK, Schneider C, Wedemann L, Britt HM, et al. 2022. Intermittent bulk release of human cytomegalovirus. PLOS Pathogens. 18(8):e1010575. [DOI] [PMC free article] [PubMed] [Google Scholar]
- 76.Joseph JG, Mudgal R, Lin S-S, Ono A, Liu AP. 2022. Biomechanical Role of Epsin in Influenza A Virus Entry. Membranes. 12(9):859. [DOI] [PMC free article] [PubMed] [Google Scholar]
- 77.El Meshri SE, Dujardin D, Godet J, Richert L, Boudier C, et al. 2015. Role of the nucleocapsid domain in HIV-1 Gag oligomerization and trafficking to the plasma membrane: a fluorescence lifetime imaging microscopy investigation. J Mol Biol. 427(6 Pt B):1480–94 [DOI] [PubMed] [Google Scholar]
- 78.Lippincott-Schwartz J, Patterson GH. 2009. Photoactivatable fluorescent proteins for diffraction-limited and super-resolution imaging. Trends Cell Biol. 19(11):555–65 [DOI] [PMC free article] [PubMed] [Google Scholar]
- 79.Gomez CY, Hope TJ. 2006. Mobility of human immunodeficiency virus type 1 Pr55Gag in living cells. J Virol. 80(17):8796–8806 [DOI] [PMC free article] [PubMed] [Google Scholar]
- 80.Sharma M, Marin M, Wu H, Prikryl D, Melikyan GB. 2023. Human Immunodeficiency Virus 1 Preferentially Fuses with pH-Neutral Endocytic Vesicles in Cell Lines and Human Primary CD4+ T-Cells. ACS Nano. 17(17):17436–50 [DOI] [PMC free article] [PubMed] [Google Scholar]
- 81.Cabantous S, Terwilliger TC, Waldo GS. 2005. Protein tagging and detection with engineered self-assembling fragments of green fluorescent protein. Nat Biotechnol. 23(1):102–7 [DOI] [PubMed] [Google Scholar]
- 82.Wang J, Kondo N, Long Y, Iwamoto A, Matsuda Z. 2009. Monitoring of HIV-1 envelope-mediated membrane fusion using modified split green fluorescent proteins. J Virol Methods. 161(2):216–22 [DOI] [PMC free article] [PubMed] [Google Scholar]
- 83.Guerreiro MR, Fernandes AR, Coroadinha AS. 2020. Evaluation of Structurally Distorted Split GFP Fluorescent Sensors for Cell-Based Detection of Viral Proteolytic Activity. Sensors (Basel). 21(1):24. [DOI] [PMC free article] [PubMed] [Google Scholar]
- 84.Kerppola TK. 2008. Bimolecular fluorescence complementation (BiFC) analysis as a probe of protein interactions in living cells. Annu Rev Biophys. 37:465–87 [DOI] [PMC free article] [PubMed] [Google Scholar]
- 85.Dirk BS, Jacob RA, Johnson AL, Pawlak EN, Cavanagh PC, et al. 2015. Viral bimolecular fluorescence complementation: a novel tool to study intracellular vesicular trafficking pathways. PLoS One. 10(4):e0125619. [DOI] [PMC free article] [PubMed] [Google Scholar]
- 86.Friew YN, Boyko V, Hu W-S, Pathak VK. 2009. Intracellular interactions between APOBEC3G, RNA, and HIV-1 Gag: APOBEC3G multimerization is dependent on its association with RNA. Retrovirology. 6:56. [DOI] [PMC free article] [PubMed] [Google Scholar]
- 87.Jin J, Sturgeon T, Weisz OA, Mothes W, Montelaro RC. 2009. HIV-1 matrix dependent membrane targeting is regulated by Gag mRNA trafficking. PLoS One. 4(8):e6551. [DOI] [PMC free article] [PubMed] [Google Scholar]
- 88.Blanco-Rodriguez G, Gazi A, Monel B, Frabetti S, Scoca V, et al. 2020. Remodeling of the Core Leads HIV-1 Preintegration Complex into the Nucleus of Human Lymphocytes. J Virol. 94(11):e00135–20 [DOI] [PMC free article] [PubMed] [Google Scholar]
- 89.Sakin V, Hanne J, Dunder J, Anders-Össwein M, Laketa V, et al. 2017. A Versatile Tool for Live-Cell Imaging and Super-Resolution Nanoscopy Studies of HIV-1 Env Distribution and Mobility. Cell Chem Biol. 24(5):635–645.e5 [DOI] [PubMed] [Google Scholar]
- 90.Hulme AE, Hope TJ. 2014. Live Cell Imaging of Retroviral Entry. Annu Rev Virol. 1(1):501–15 [DOI] [PubMed] [Google Scholar]
- 91.Francis AC, Melikyan GB. 2018. Live-Cell Imaging of Early Steps of Single HIV-1 Infection. Viruses. 10(5):275. [DOI] [PMC free article] [PubMed] [Google Scholar]
- 92.Sherer NM, Jin J, Mothes W. 2010. Directional spread of surface-associated retroviruses regulated by differential virus-cell interactions. J. Virol. 84(7):3248–58 [DOI] [PMC free article] [PubMed] [Google Scholar]
- 93.Popik W, Alce TM, Au W-C. 2002. Human immunodeficiency virus type 1 uses lipid raft-colocalized CD4 and chemokine receptors for productive entry into CD4(+) T cells. J Virol. 76(10):4709–22 [DOI] [PMC free article] [PubMed] [Google Scholar]
- 94.Melikyan GB, Barnard RJO, Abrahamyan LG, Mothes W, Young JAT. 2005. Imaging individual retroviral fusion events: from hemifusion to pore formation and growth. Proc Natl Acad Sci U S A. 102(24):8728–33 [DOI] [PMC free article] [PubMed] [Google Scholar]
- 95.Viard M, Parolini I, Sargiacomo M, Fecchi K, Ramoni C, et al. 2002. Role of cholesterol in human immunodeficiency virus type 1 envelope protein-mediated fusion with host cells. J Virol. 76(22):11584–95 [DOI] [PMC free article] [PubMed] [Google Scholar]
- 96.Dale BM, McNerney GP, Thompson DL, Hubner W, de Los Reyes K, et al. 2011. Cell-to-cell transfer of HIV-1 via virological synapses leads to endosomal virion maturation that activates viral membrane fusion. Cell Host Microbe. 10(6):551–62 [DOI] [PMC free article] [PubMed] [Google Scholar]
- 97.Miyauchi K, Kim Y, Latinovic O, Morozov V, Melikyan GB. 2009. HIV enters cells via endocytosis and dynamin-dependent fusion with endosomes. Cell. 137(3):433–44 [DOI] [PMC free article] [PubMed] [Google Scholar]
- 98.Harak C, Lohmann V. 2015. Ultrastructure of the replication sites of positive-strand RNA viruses. Virology. 479–480:418–33 [DOI] [PMC free article] [PubMed] [Google Scholar]
- 99.den Boon JA, Ahlquist P. 2010. Organelle-like membrane compartmentalization of positive-strand RNA virus replication factories. Annu Rev Microbiol. 64:241–56 [DOI] [PubMed] [Google Scholar]
- 100.Borodavka A, Acker J. 2023. Seeing Biomolecular Condensates Through the Lens of Viruses. Annu Rev Virol. 10(1):163–82 [DOI] [PubMed] [Google Scholar]
- 101.Su JM, Wilson MZ, Samuel CE, Ma D. 2021. Formation and Function of Liquid-Like Viral Factories in Negative-Sense Single-Stranded RNA Virus Infections. Viruses. 13(1):126. [DOI] [PMC free article] [PubMed] [Google Scholar]
- 102.Yamashita M, Engelman AN. 2017. Capsid-Dependent Host Factors in HIV-1 Infection. Trends Microbiol. 25(9):741–55 [DOI] [PMC free article] [PubMed] [Google Scholar]
- 103.Ozbun MA, Campos SK. 2021. The long and winding road: human papillomavirus entry and subcellular trafficking. Curr Opin Virol. 50:76–86 [DOI] [PMC free article] [PubMed] [Google Scholar]
- 104.Smith GA. 2021. Navigating the Cytoplasm: Delivery of the Alphaherpesvirus Genome to the Nucleus. Curr Issues Mol Biol. 41:171–220 [DOI] [PubMed] [Google Scholar]
- 105.Blanco-Rodriguez G, Di Nunzio F. 2021. The Viral Capsid: A Master Key to Access the Host Nucleus. Viruses. 13(6):1178. [DOI] [PMC free article] [PubMed] [Google Scholar]
- 106.Malikov V, Naghavi MH. 2017. Localized Phosphorylation of a Kinesin-1 Adaptor by a Capsid-Associated Kinase Regulates HIV-1 Motility and Uncoating. Cell Rep. 20(12):2792–99 [DOI] [PMC free article] [PubMed] [Google Scholar]
- 107.Malikov V, da Silva ES, Jovasevic V, Bennett G, de Souza Aranha Vieira DA, et al. 2015. HIV-1 capsids bind and exploit the kinesin-1 adaptor FEZ1 for inward movement to the nucleus. Nat Commun. 6:6660. [DOI] [PMC free article] [PubMed] [Google Scholar]
- 108.Dharan A, Opp S, Abdel-Rahim O, Keceli SK, Imam S, et al. 2017. Bicaudal D2 facilitates the cytoplasmic trafficking and nuclear import of HIV-1 genomes during infection. Proc Natl Acad Sci U S A. 114(50):E10707–16 [DOI] [PMC free article] [PubMed] [Google Scholar]
- 109.Dharan A, Talley S, Tripathi A, Mamede JI, Majetschak M, et al. 2016. KIF5B and Nup358 Cooperatively Mediate the Nuclear Import of HIV-1 during Infection. PLoS Pathog. 12(6):e1005700. [DOI] [PMC free article] [PubMed] [Google Scholar]
- 110.McDonald D, Vodicka MA, Lucero G, Svitkina TM, Borisy GG, et al. 2002. Visualization of the intracellular behavior of HIV in living cells. J Cell Biol. 159(3):441–52 [DOI] [PMC free article] [PubMed] [Google Scholar]
- 111.Arhel N, Genovesio A, Kim K-A, Miko S, Perret E, et al. 2006. Quantitative four-dimensional tracking of cytoplasmic and nuclear HIV-1 complexes. Nat Methods. 3(10):817–24 [DOI] [PubMed] [Google Scholar]
- 112.Mamede JI, Hope TJ. 2016. Detection and Tracking of Dual-Labeled HIV Particles Using Wide-Field Live Cell Imaging to Follow Viral Core Integrity. Methods Mol Biol. 1354:49–59 [DOI] [PMC free article] [PubMed] [Google Scholar]
- 113.Francis AC, Cereseto A, Singh PK, Shi J, Poeschla E, et al. 2022. Localization and functions of native and eGFP-tagged capsid proteins in HIV-1 particles. PLoS Pathog. 18(8):e1010754. [DOI] [PMC free article] [PubMed] [Google Scholar]
- 114.Burdick RC, Li C, Munshi M, Rawson JMO, Nagashima K, et al. 2020. HIV-1 uncoats in the nucleus near sites of integration. Proc Natl Acad Sci U S A. 117(10):5486–93 [DOI] [PMC free article] [PubMed] [Google Scholar]
- 115.Zila V, Margiotta E, Turoňová B, Müller TG, Zimmerli CE, et al. 2021. Cone-shaped HIV-1 capsids are transported through intact nuclear pores. Cell. 184(4):1032–1046.e18 [DOI] [PMC free article] [PubMed] [Google Scholar]
- 116.Müller TG, Zila V, Müller B, Kräusslich H-G. 2022. Nuclear Capsid Uncoating and Reverse Transcription of HIV-1. Annu Rev Virol. 9(1):261–84 [DOI] [PubMed] [Google Scholar]
- 117.Femino AM, Fay FS, Fogarty K, Singer RH. 1998. Visualization of single RNA transcripts in situ. Science. 280(5363):585–90 [DOI] [PubMed] [Google Scholar]
- 118.Boireau S, Maiuri P, Basyuk E, de la Mata M, Knezevich A, et al. 2007. The transcriptional cycle of HIV-1 in real-time and live cells. J Cell Biol. 179(2):291–304 [DOI] [PMC free article] [PubMed] [Google Scholar]
- 119.Forero-Quintero LS, Raymond W, Handa T, Saxton MN, Morisaki T, et al. 2021. Live-cell imaging reveals the spatiotemporal organization of endogenous RNA polymerase II phosphorylation at a single gene. Nat Commun. 12(1):3158. [DOI] [PMC free article] [PubMed] [Google Scholar]
- 120.Tantale K, Garcia-Oliver E, Robert M-C, L’Hostis A, Yang Y, et al. 2021. Stochastic pausing at latent HIV-1 promoters generates transcriptional bursting. Nat Commun. 12:4503. [DOI] [PMC free article] [PubMed] [Google Scholar]
- 121.Pocock GM, Zimdars LL, Yuan M, Eliceiri KW, Ahlquist P, Sherer NM. 2017. Diverse activities of viral cis-acting RNA regulatory elements revealed using multicolor, long-term, single-cell imaging. Mol. Biol. Cell. 28(3):476–87 [DOI] [PMC free article] [PubMed] [Google Scholar]
- 122.Chen J, Grunwald D, Sardo L, Galli A, Plisov S, et al. 2014. Cytoplasmic HIV-1 RNA is mainly transported by diffusion in the presence or absence of Gag protein. Proc. Natl. Acad. Sci. U.S.A. 111(48):E5205–5213 [DOI] [PMC free article] [PubMed] [Google Scholar]
- 123.Chen J, Umunnakwe C, Sun DQ, Nikolaitchik OA, Pathak VK, et al. 2020. Impact of Nuclear Export Pathway on Cytoplasmic HIV-1 RNA Transport Mechanism and Distribution. mBio. 11(6):e01578–20 [DOI] [PMC free article] [PubMed] [Google Scholar]
- 124.Freed EO. 2015. HIV-1 assembly, release and maturation. Nat. Rev. Microbiol. 13(8):484–96 [DOI] [PMC free article] [PubMed] [Google Scholar]
- 125.Jouvenet N, Bieniasz PD, Simon SM. 2008. Imaging the biogenesis of individual HIV-1 virions in live cells. Nature. 454(7201):236–40 [DOI] [PMC free article] [PubMed] [Google Scholar]
- 126.Ivanchenko S, Godinez WJ, Lampe M, Kräusslich H-G, Eils R, et al. 2009. Dynamics of HIV-1 assembly and release. PLoS Pathog. 5(11):e1000652. [DOI] [PMC free article] [PubMed] [Google Scholar]
- 127.Chen J, Rahman SA, Nikolaitchik OA, Grunwald D, Sardo L, et al. 2016. HIV-1 RNA genome dimerizes on the plasma membrane in the presence of Gag protein. Proc Natl Acad Sci U S A. 113(2):E201–208 [DOI] [PMC free article] [PubMed] [Google Scholar]
- 128.Gupta S, Bromley J, Saffarian S. 2020. High-speed imaging of ESCRT recruitment and dynamics during HIV virus like particle budding. PLoS One. 15(9):e0237268. [DOI] [PMC free article] [PubMed] [Google Scholar]
- 129.Jouvenet N, Zhadina M, Bieniasz PD, Simon SM. 2011. Dynamics of ESCRT protein recruitment during retroviral assembly. Nat Cell Biol. 13(4):394–401 [DOI] [PMC free article] [PubMed] [Google Scholar]
- 130.Bleck M, Itano MS, Johnson DS, Thomas VK, North AJ, et al. 2014. Temporal and spatial organization of ESCRT protein recruitment during HIV-1 budding. Proc Natl Acad Sci U S A. 111(33):12211–16 [DOI] [PMC free article] [PubMed] [Google Scholar]
- 131.Mothes W, Sherer NM, Jin J, Zhong P. 2010. Virus cell-to-cell transmission. J Virol. 84(17):8360–68 [DOI] [PMC free article] [PubMed] [Google Scholar]
- 132.Gardiner JC, Mauer EJ, Sherer NM. 2016. HIV-1 Gag, Envelope, and Extracellular Determinants Cooperate To Regulate the Stability and Turnover of Virological Synapses. J Virol. 90(14):6583–97 [DOI] [PMC free article] [PubMed] [Google Scholar]
- 133.Wang L, Izadmehr S, Kamau E, Kong X-P, Chen BK. 2019. Sequential trafficking of Env and Gag to HIV-1 T cell virological synapses revealed by live imaging. Retrovirology. 16(1):2. [DOI] [PMC free article] [PubMed] [Google Scholar]
- 134.Ward AE, Kiessling V, Pornillos O, White JM, Ganser-Pornillos BK, Tamm LK. 2020. HIV-cell membrane fusion intermediates are restricted by Serincs as revealed by cryo-electron and TIRF microscopy. Journal of Biological Chemistry. 295(45):15183–95 [DOI] [PMC free article] [PubMed] [Google Scholar]
- 135.Sood C, Marin M, Chande A, Pizzato M, Melikyan GB. 2017. SERINC5 protein inhibits HIV-1 fusion pore formation by promoting functional inactivation of envelope glycoproteins. J Biol Chem. 292(14):6014–26 [DOI] [PMC free article] [PubMed] [Google Scholar]
- 136.Zhong Z, Ning J, Boggs EA, Jang S, Wallace C, et al. 2021. Cytoplasmic CPSF6 Regulates HIV-1 Capsid Trafficking and Infection in a Cyclophilin A-Dependent Manner. mBio. 12(2):e03142–20 [DOI] [PMC free article] [PubMed] [Google Scholar]
- 137.Francis AC, Marin M, Singh PK, Achuthan V, Prellberg MJ, et al. 2020. HIV-1 replication complexes accumulate in nuclear speckles and integrate into speckle-associated genomic domains. Nat Commun. 11:3505. [DOI] [PMC free article] [PubMed] [Google Scholar]
- 138.Behrens RT, Sherer NM. 2023. Retroviral hijacking of host transport pathways for genome nuclear export. mBio. 14(6):e0007023. [DOI] [PMC free article] [PubMed] [Google Scholar]
- 139.Evans EL, Pocock GM, Einsdorf G, Behrens RT, Dobson ETA, et al. 2022. HIV RGB: Automated Single-Cell Analysis of HIV-1 Rev-Dependent RNA Nuclear Export and Translation Using Image Processing in KNIME. Viruses. 14(5):903. [DOI] [PMC free article] [PubMed] [Google Scholar]
- 140.Larson DR, Johnson MC, Webb WW, Vogt VM. 2005. Visualization of retrovirus budding with correlated light and electron microscopy. Proc Natl Acad Sci U S A. 102(43):15453–58 [DOI] [PMC free article] [PubMed] [Google Scholar]
- 141.Haugh KA, Ladinsky MS, Ullah I, Stone HM, Pi R, et al. 2021. In vivo imaging of retrovirus infection reveals a role for Siglec-1/CD169 in multiple routes of transmission. eLife. 10:e64179. [DOI] [PMC free article] [PubMed] [Google Scholar]
- 142.Murakami T, Carmona N, Ono A. 2020. Virion-incorporated PSGL-1 and CD43 inhibit both cell-free infection and transinfection of HIV-1 by preventing virus–cell binding. Proceedings of the National Academy of Sciences. 117(14):8055–63 [DOI] [PMC free article] [PubMed] [Google Scholar]
- 143.Starling T, Carlon-Andres I, Iliopoulou M, Kraemer B, Loidolt-Krueger M, et al. 2023. Multicolor lifetime imaging and its application to HIV-1 uptake. Nat Commun. 14(1):4994. [DOI] [PMC free article] [PubMed] [Google Scholar]
- 144.Sewald X, Ladinsky MS, Uchil PD, Beloor J, Pi R, et al. 2015. Retroviruses use CD169-mediated trans-infection of permissive lymphocytes to establish infection. Science. 350(6260):563–67 [DOI] [PMC free article] [PubMed] [Google Scholar]
- 145.Symeonides M, Murooka TT, Bellfy LN, Roy NH, Mempel TR, Thali M. 2015. HIV-1-Induced Small T Cell Syncytia Can Transfer Virus Particles to Target Cells through Transient Contacts. Viruses. 7(12):6590–6603 [DOI] [PMC free article] [PubMed] [Google Scholar]
- 146.Ayuso JM, Farooqui M, Virumbrales-Muñoz M, Denecke K, Rehman S, et al. 2023. Microphysiological model reveals the promise of memory-like natural killer cell immunotherapy for HIV± cancer. Nat Commun. 14(1):6681. [DOI] [PMC free article] [PubMed] [Google Scholar]
- 147.Ao Y, Grover JR, Gifford L, Han Y, Zhong G, et al. 2024. Bioorthogonal click labeling of an amber-free HIV-1 provirus for in-virus single molecule imaging. Cell Chem Biol, pp. S2451-9456(23)00474-9 [DOI] [PMC free article] [PubMed] [Google Scholar]
- 148.Bakhshpour-Yucel M, Gür SD, Seymour E, Aslan M, Lortlar Ünlü N, Ünlü MS. 2023. Highly-Sensitive, Label-Free Detection of Microorganisms and Viruses via Interferometric Reflectance Imaging Sensor. Micromachines (Basel). 14(2):281. [DOI] [PMC free article] [PubMed] [Google Scholar]
- 149.Petkidis A, Andriasyan V, Greber UF. 2023. Label-free microscopy for virus infections. Microscopy. 72(3):204–12 [DOI] [PMC free article] [PubMed] [Google Scholar]